
Molecular Dynamics and Near-Tg Phenomena of Cyclic Thioethers

 , ,
, ,  ,
,  ,
,
Abstract
:1. Introduction
2. Results
3. Discussion
4. Conclusions
5. Materials and Methods
5.1. Materials
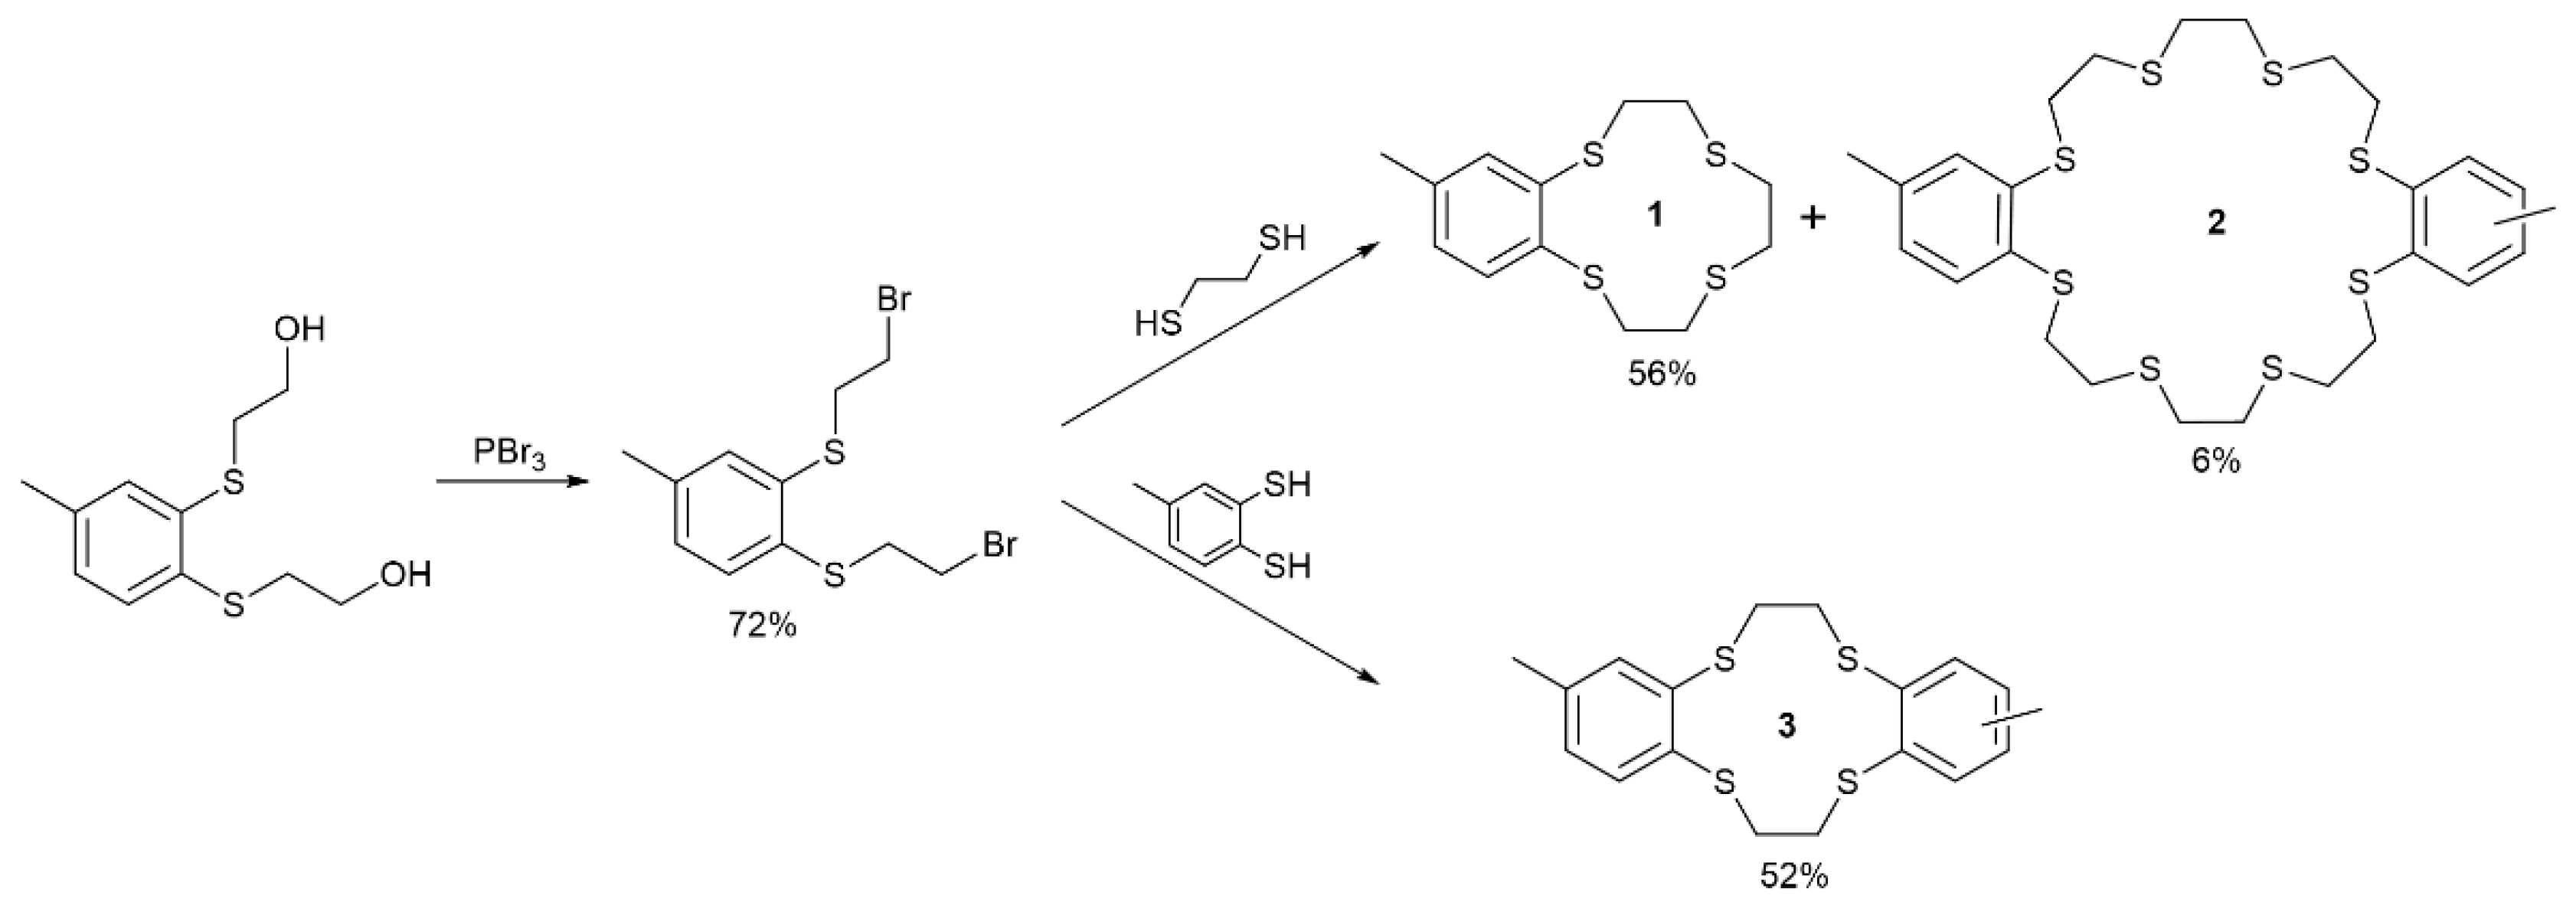
5.2. Syntheses
5.3. NMR Spectroscopy
5.4. Thermogravimetry (TGA)
5.5. Differential Scanning Calorimetry (DSC)
5.6. Broadband Dielectric Spectroscopy (BDS) under Ambient Pressure
5.7. Broadband Dielectric Spectroscopy (BDS) under High Pressure
5.8. Fourier Transform Infrared Spectroscopy (FTIR)
Supplementary Materials
Author Contributions
Funding
Institutional Review Board Statement
Informed Consent Statement
Data Availability Statement
Conflicts of Interest
References
- Pedersen, C.J. The Discovery of Crown Ethers (Noble Lecture). Angew. Chem. Int. Ed. 1988, 27, 1021–1027. [Google Scholar] [CrossRef]
- Tsukube, H. Double armed crown ethers and armed macrocycles as a new series of metal-selective reagents: A review. Talanta 1993, 40, 1313–1324. [Google Scholar] [CrossRef] [PubMed]
- Gunter, M.J.; Johnston, M.R.; Skelton, B.W.; White, A.H. Porphyrin–crown ether based macrocyclic receptors for bipyridinium cations. Chem. Soc. Perkin Trans. 1994, 1, 1009–1018. [Google Scholar] [CrossRef]
- Liu, Y.; Zhou, H.-T.; Chen, S.-P.; Tan, Y.-H.; Wang, C.-F.; Yang, C.-S.; Wen, H.-R.; Tang, Y.-Z. Reversible phase transition and switchable dielectric behaviors triggered by rotation and order-disorder motions of crowns. Dalton Trans. 2018, 47, 3851–3856. [Google Scholar] [CrossRef] [PubMed]
- Buchanan, G.W. Nuclear magnetic resonance studies of crown ethers. Prog. Nucl. Magn. Reson. Spectrosc. 1999, 34, 327–377. [Google Scholar] [CrossRef]
- Al-Jallal, N.A.; Al-Kahtani, A.A.; El-Azhary, A.A. Conformational Study of the Structure of Free 18-Crown-6. J. Phys. Chem. A 2005, 109, 3694–3703. [Google Scholar] [CrossRef]
- Zhang, Y.; Ye, H.-Y.; Fu, D.-W.; Xiong, R.-G. An Order–Disorder Ferroelectric Host–Guest Inclusion Compound. Angew. Chem. Int. Ed. 2014, 53, 2114–2150. [Google Scholar] [CrossRef] [PubMed]
- Fu, D.-W.; Cai, H.-L.; Li, S.-H.; Ye, Q.; Zhou, L.; Zhang, W.; Zhang, Y.; Deng, F.; Xiong, R.-G. 4-Methoxyanilinium Perrhenate 18-Crown-6: A New Ferroelectric with Order Originating in Swinglike Motion Slowing Down. Phys. Rev. Lett. 2013, 110, 257601. [Google Scholar] [CrossRef]
- Khan, T.; Asghar, M.A.; Sun, Z.-H.; Zeb, A.; Ji, C.-M.; Luo, J.-H. A supra-molecular switchable dielectric material with non-linear optical properties. J. Mater. Chem. C 2017, 5, 2865–2870. [Google Scholar] [CrossRef]
- Wei, Y.-L.; Jing, J.; Shi, C.; Ye, H.-Y.; Wang, Z.-X.; Zhang, Y. Unusual high-temperature reversible phase transition containing dielectric and nonlinear optical switches in host–guest supramolecular crown ether clathrates. Chem. Commun. 2018, 54, 8076–8079. [Google Scholar] [CrossRef]
- Zhang, Z.-X.; Zhang, T.; Shi, P.-P.; Zhang, W.-Y.; Ye, Q.; Fu, D.-W. Anion-Regulated Molecular Rotor Crystal: The First Case of a Stator–Rotator Double Switch with Relaxation Behavior. J. Phys. Chem. Lett. 2019, 10, 4237–4244. [Google Scholar] [CrossRef] [PubMed]
- Li, Y.-R.; Zhang, Y.-F.; Tang, Y.-Y.; Zhang, H.-Y. [(Histamine)(18-crown-6)2][BF4]2 is a high-temperature piezoelectric. Chem. Commun. 2022, 58, 5148–5151. [Google Scholar] [CrossRef]
- Lun, M.-M.; Luo, J.-Q.; Zhang, Z.-X.; Li, J.; Xie, L.-Y.; Lu, H.-F.; Zhang, Y.; Fu, D.-W. Piezoelectric self-power supply driven by ferroelastic host–guest supramolecule with considerable electromechanical conversion capability. Chem. Eng. J. 2023, 475, 145969. [Google Scholar] [CrossRef]
- Ooi, T.; Maruoka, K. Recent Advances in Asymmetric Phase-Transfer Catalysis. Angew. Chem. Int. Ed. 2007, 46, 4222–4266. [Google Scholar] [CrossRef]
- Awual, M.R.; Yaita, T.; Taguchi, T.; Shiwaku, H.; Suzuki, S.; Okamoto, Y. Selective cesium removal from radioactive liquid waste by crown ether immobilized new class conjugate adsorbent. J. Hazard. Mater. 2014, 278, 227–235. [Google Scholar] [CrossRef] [PubMed]
- Stott, P.E.; Bradshaw, J.S.; Parish, W.W. Modified Crown Ether Catalysts. 3. Structural Parameters Affecting Phase Transfer Catalysis by Crown Ethers and a Comparison of the Effectiveness of Crown Ethers to That of Other Phase Transfer Catalysts. J. Am. Chem. Soc. 1980, 102, 4810–4815. [Google Scholar] [CrossRef]
- Gokel, G.W.; Leevy, W.M.; Weber, M.E. Crown Ethers: Sensors for Ions and Molecular Scaffolds for Materials and Biological Models. Chem. Rev. 2004, 104, 2723–2750. [Google Scholar] [CrossRef]
- Tsukanov, A.V.; Dubonosov, A.D.; Bren, V.A.; Minkin, V.I. Organic chemosensors with crown-ether groups (review). Chem. Heterocycl. Comp. 2008, 44, 899–923. [Google Scholar] [CrossRef]
- Kralj, M.; Tušek-Božić, L.; Frkanec, L. Biomedical Potentials of Crown Ethers: Prospective Antitumor Agents. ChemMedChem 2008, 3, 1478–1492. [Google Scholar] [CrossRef]
- Voyer, N.; Potvin, L.; Rousseau, É. Electrical activity of artificial ion channels incorporated into planar lipid bilayers. J. Chem. Soc. Perkin Trans. 1997, 2, 1469–1472. [Google Scholar] [CrossRef]
- Stephen, M.; Wu, X.; Li, T.; Salim, T.; Hou, K.; Chen, S.; Leong, W.L. Crown ether enabled enhancement of ionic–electronic properties of PEDOT:PSS. Mater. Horiz. 2022, 9, 2408–2415. [Google Scholar] [CrossRef] [PubMed]
- Chehardoli, G.; Bahmani, A. The role of crown ethers in drug delivery. Supramol. Chem. 2019, 31, 221–238. [Google Scholar] [CrossRef]
- Ryan, H.P.; Fishman, Z.S.; Pawlik, J.T.; Grommet, A.; Musial, M.; Rizzuto, F.; Booth, J.C.; Long, C.J.; Schwarz, K.; Orloff, N.D.; et al. Quantifying the Effect of Guest Binding on Host Environment. J. Am. Chem. Soc. 2023, 145, 19533–19541. [Google Scholar] [CrossRef] [PubMed]
- Szeremeta, A.Z.; Nowok, A.; Sieradzki, A.; Simenas, M.; Vilčiauskas, L.; Gągor, A.; Mączka, M.; Paluch, M.; Pawlus, S. Relaxing under pressure with a rigid niccolite formate framework. J. Mater. Chem. C 2020, 8, 16736–16741. [Google Scholar] [CrossRef]
- Peksa, P.; Nowok, A.; Formalik, F.; Zaręba, J.K.; Trzmiel, J.; Gągor, A.; Mączka, M.; Sieradzki, A. More complex than originally thought: Revisiting the origins of the relaxation processes in dimethylammonium zinc formate. J. Mater. Chem. C 2022, 10, 6866–6877. [Google Scholar] [CrossRef]
- Rams-Baron, M.; Jachowicz, R.; Boldyreva, E.; Zhou, D.; Jamroz, W.; Paluch, M. (Eds.) Amorphous Drugs: Benefits and Challenges; Springer: New York, NY, USA, 2018. [Google Scholar]
- De Groot, B.; Loeb, S.J. Synthesis and Structural Characterization of the Crown Thioether 1,3,6,9,11,14-Hexathiacyclohexadecane (16S6) and the Copper(I) Complex [Cu(16S6)][ClO4]. Inorg. Chem. 1989, 28, 3573–3578. [Google Scholar] [CrossRef]
- DeSimone, R.E.; Glick, M.D. Structures of the Macrocyclic Polythiaether 1,4,8,11-Tetrathiacyclotetradecane and Implications for Transition-Metal Chemistry. J. Am. Chem. Soc. 1976, 98, 762–767. [Google Scholar] [CrossRef]
- Hartman, J.R.; Wolf, R.E.; Foxman, B.M.; Cooper, S.R. Crown Thiaether Chemistry. Crystal Structure of 1,4,7,10,13,16-Hexathiacyclooctadecane, the Hexathia Analogue of 18-Crown-6. J. Am. Chem. Soc. 1983, 105, 131–132. [Google Scholar] [CrossRef]
- Wolf, R.E.; Hartman, J.R.; Storey, J.M.E.; Foxman, B.M.; Cooper, S.R. Crown Thioether Chemistry: Structural and Conformational Studies of Tetrathia-12-crown-4, Pentathia-15-crown-5, and Hexathia-18-Crown-6. Implications for Ligand Design. J. Am. Chem. Soc. 1987, 109, 4328–4335. [Google Scholar] [CrossRef]
- Kim, S.; Lindoy, L.F.; Lee, S.S. Recent developments in the thiamacrocyclic chemistry of the latter d-block elements. Coord. Chem. Rev. 2014, 280, 176–202. [Google Scholar] [CrossRef]
- Lee, E.; Lee, S.Y.; Lindoy, L.F.; Lee, S.S. Metallacycles derived from metal complexes of exo-coordinated macrocyclic ligands. Coord. Chem. Rev. 2013, 257, 3125–3138. [Google Scholar] [CrossRef]
- Andjelic, S. Study of Multiple Relaxations in Crown Ethers by Dielectric Relaxation Spectroscopy. J. Phys. Chem. A 1999, 103, 4973–4980. [Google Scholar] [CrossRef]
- Hellwig, H.; Nowok, A.; Małecki, J.G.; Kuś, P.; Jędrzejowska, A.; Grzybowska, K.; Pawlus, S. Conformational analysis and molecular dynamics of glass-forming aromatic thiacrown ethers. Phys. Chem. Chem. Phys. 2020, 22, 17948–17959. [Google Scholar] [CrossRef]
- Kowall, T.; Geiger, A. Molecular Dynamics Simulation Study of 18-Crown-6 in Aqueous Solution. 1. Structure and Dynamics of the Hydration Shell. J. Phys. Chem. 1994, 98, 6216–6224. [Google Scholar] [CrossRef]
- Straatsma, T.P.; McCammon, J.A. Treatment of rotational isomers in free energy calculations. II. Molecular dynamics simulation study of 18-crown-6 in aqueous solution as an example of systems with large numbers of rotational isomeric states. J. Chem. Phys. 1989, 91, 3631–3637. [Google Scholar] [CrossRef]
- Świergiel, J.; Grembowski, J.; Jadżyn, J. Odd-even alternation in molecular structure and self-assembling of some macrocyclic polyethers. J. Mol. Liq. 2017, 229, 472–476. [Google Scholar] [CrossRef]
- Kremer, F.; Schönhals, A. (Eds.) Broadband Dielectric Spectroscopy; Springer: Berlin/Heidelberg, Germany, 2003. [Google Scholar]
- Havriliak, S.; Negami, S. A Complex Plane Representation of Dielectric and Mechanical Relaxation Processes in Some Polymers. Polymer 1967, 8, 161–210. [Google Scholar] [CrossRef]
- Cole, K.S.; Cole, R.H. Dispersion and Absorption in Dielectrics I. Alternating Current Characteristics. J. Chem. Phys. 1941, 9, 341–351. [Google Scholar] [CrossRef]
- Vogel, H. The Law of the Relation between the Viscosity of Liquids and the Temperature. Phys. Z. 1921, 22, 645–646. [Google Scholar]
- Fulcher, G.S. Analysis of Recent Measurements of the Viscosity of Glasses. J. Am. Ceram. Soc. 1925, 8, 339–355. [Google Scholar] [CrossRef]
- Tamman, V.G.; Hesse, W. Die Abhängigkeit Der Viscosität von Der Temperatur Bie Unterkühlten Flüssigkeiten. Z. Anorg. Allg. Chem. 1926, 156, 245–257. [Google Scholar] [CrossRef]
- Angell, C.A. Formation of Glasses from Liquids and Biopolymers. Science 1995, 267, 1924–1935. [Google Scholar] [CrossRef] [PubMed]
- Kudlik, A.; Tschirwitz, C.; Benkhof, S.; Blochowicz, T.; Rössler, E. Slow secondary relaxation process in supercooled liquids. Europhys. Lett. 1997, 40, 649–654. [Google Scholar] [CrossRef]
- Kudlik, A.; Tschirwitz, C.; Blochowicz, T.; Benkhof, S.; Rössler, E. Slow secondary relaxation in simple glass formers. J. Non-Cryst. Solids 1998, 235–237, 406–411. [Google Scholar] [CrossRef]
- Kudlik, A.; Benkhof, S.; Blochowicz, T.; Tschirwitz, C.; Rössler, E. The dielectric response of simple organic glass formers. J. Mol. Struct. 1999, 479, 201–218. [Google Scholar] [CrossRef]
- Ngai, K.L.; Capaccioli, S. Relation between the activation energy of the Johari-Goldstein β relaxation and Tg of glass formers. Phys. Rev. E 2004, 69, 031501. [Google Scholar] [CrossRef] [PubMed]
- Ngai, K.L.; Tsang, K.Y. Similarity of relaxation in supercooled liquids and interacting arrays of oscillators. Phys. Rev. E 1999, 60, 4511–4517. [Google Scholar] [CrossRef] [PubMed]
- Ngai, K.L. An extended coupling model description of the evolution of dynamics with time in supercooled liquids and ionic conductors. J. Phys. Condens. Matter 2003, 15, S1107–S1125. [Google Scholar] [CrossRef]
- Williams, G.; Watts, D.C. Non-symmetrical dielectric relaxation behaviour arising from a simple empirical decay function. Trans. Faraday Soc. 1970, 66, 80–85. [Google Scholar] [CrossRef]
- Ngai, K.L.; Paluch, M. Inference of the Evolution from Caged Dynamics to Cooperative Relaxation in Glass-Formers from Dielectric Relaxation Data. J. Phys. Chem. B 2003, 107, 6865–6872. [Google Scholar] [CrossRef]
- Ngai, K.L. Classification of secondary relaxation in glass-formers based on dynamic properties. J. Chem. Phys. 2004, 120, 857–873. [Google Scholar] [CrossRef]
- Floudas, G.; Paluch, M.; Grzybowski, A.; Ngai, K.L. Molecular Dynamics of Glass Forming Systems, Effect of Pressure; Springer: Berlin/Heidelberg, Germany, 2011. [Google Scholar]
- Andersson, S.P.; Andersson, O. Relaxation Studies of Poly(propylene glycol) under High Pressure. Macromolecules 1998, 31, 2999–3006. [Google Scholar] [CrossRef]
- Larkin, P.J. Infrared and Raman Spectroscopy: Principles and Spectral Interpretation; Elsevier: Amsterdam, The Netherlands, 2018. [Google Scholar]
- Derdour, L.; Pack, S.K.; Skliar, D.; Lai, C.J.; Kiang, S. Crystallization from solutions containing multiple conformers: A new modeling approach for solubility and supersaturation. Chem. Eng. Sci. 2011, 66, 88–102. [Google Scholar] [CrossRef]
- Novikov, V.N.; Rössler, E.A. Correlation between glass transition temperature and molecular mass in non-polymeric and polymer glass formers. Polymer 2013, 54, 6987–6991. [Google Scholar] [CrossRef]
- Li, Y.; Day, D.A.; Stark, H.; Jimenez, J.L.; Shiraiwa, M. Predictions of the glass transition temperature and viscosity of organic aerosols from volatility distributions. Atmos. Chem. Phys. 2020, 20, 8103–8122. [Google Scholar] [CrossRef]
- DeRieux, W.-S.W.; Li, Y.; Lin, P.; Laskin, J.; Laskin, A.; Bertram, A.K.; Nizkorodov, S.A.; Shiraiwa, M. Predicting the glass transition temperature and viscosity of secondary organic material using molecular composition. Atmos. Chem. Phys. 2018, 18, 6331–6351. [Google Scholar] [CrossRef]
- Shiraiwa, M.; Li, Y.; Tsimpidi, A.P.; Karydis, V.A.; Berkemeier, T.; Pandis, S.N.; Lelieveld, J.; Koop, T.; Pöschl, U. Global distribution of particle phase state in atmospheric secondary organic aerosols. Nat. Commun. 2017, 8, 15002. [Google Scholar] [CrossRef]
- Rothfuss, N.E.; Petters, M.D. Influence of Functional Groups on the Viscosity of Organic Aerosol. Environ. Sci. Technol. 2017, 51, 271–279. [Google Scholar] [CrossRef]
- Galeazzo, T.; Shiraiwa, M. Predicting glass transition temperature and melting point of organic compounds via machine learning and molecular embeddings. Environ. Sci. Atmos. 2022, 2, 362–374. [Google Scholar] [CrossRef]
- Nowok, A.; Dulski, M.; Jurkiewicz, K.; Grelska, J.; Szeremeta, A.Z.; Grzybowska, K.; Pawlus, S. Molecular stiffness and aromatic ring position—Crucial structural factors in the self-assembly processes of phenyl alcohols. J. Mol. Liq. 2021, 335, 116426. [Google Scholar] [CrossRef]
- Rams-Baron, M.; Yao, B.; Cheng, S.; Dulski, M.; Paluch, M. Complex Reorientation Dynamics of Sizable Glass-Formers with Polar Rotors Revealed by Dielectric Spectroscopy. J. Phys. Chem. Lett. 2021, 12, 11303–11307. [Google Scholar] [CrossRef]
- Rams-Baron, M.; Jędrzejowska, A.; Jurkiewicz, K.; Matussek, M.; Ngai, K.L.; Paluch, M. Broadband Dielectric Study of Sizable Molecular Glass Formers: Relationship Between Local Structure and Dynamics. J. Phys. Chem. Lett. 2021, 12, 245–249. [Google Scholar] [CrossRef] [PubMed]
- Jędrzejowska, A.; Matussek, M.; Ngai, K.L.; Grzybowska, K.; Jurkiewicz, K.; Paluch, M. New paradigm of dielectric relaxation of sizable and rigid molecular glass formers. Phys. Rev. E 2020, 101, 010603. [Google Scholar] [CrossRef] [PubMed]
- Tarnacka, M.; Madejczyk, O.; Adrjanowicz, K.; Pionteck, J.; Kaminska, E.; Kamiński, K.; Paluch, M. Thermodynamic scaling of molecular dynamics in supercooled liquid state of pharmaceuticals: Itraconazole and ketoconazol. J. Chem. Phys. 2015, 142, 224507. [Google Scholar] [CrossRef] [PubMed]
- Nowok, A.; Cieślik, W.; Grelska, J.; Jurkiewicz, K.; Makieieva, N.; Kupka, T.; Alemán, J.; Musioł, R.; Pawlus, S. Simple Rules for Complex Near-Glass-Transition Phenomena in Medium-Sized Schiff Bases. Int. J. Mol. Sci. 2022, 23, 5185. [Google Scholar] [CrossRef]
- Traeger, J.; Klamroth, T.; Kelling, A.; Lubahn, S.; Cleve, E.; Mickler, W.; Heydenreich, M.; Müller, H.; Holdt, H.-J. Complexation of palladium (II) with unsaturated dithioethers—A systematic development of highly selective ligands for solvent extraction. Eur. J. Inorg. Chem. 2012, 2012, 2341–2352. [Google Scholar] [CrossRef]


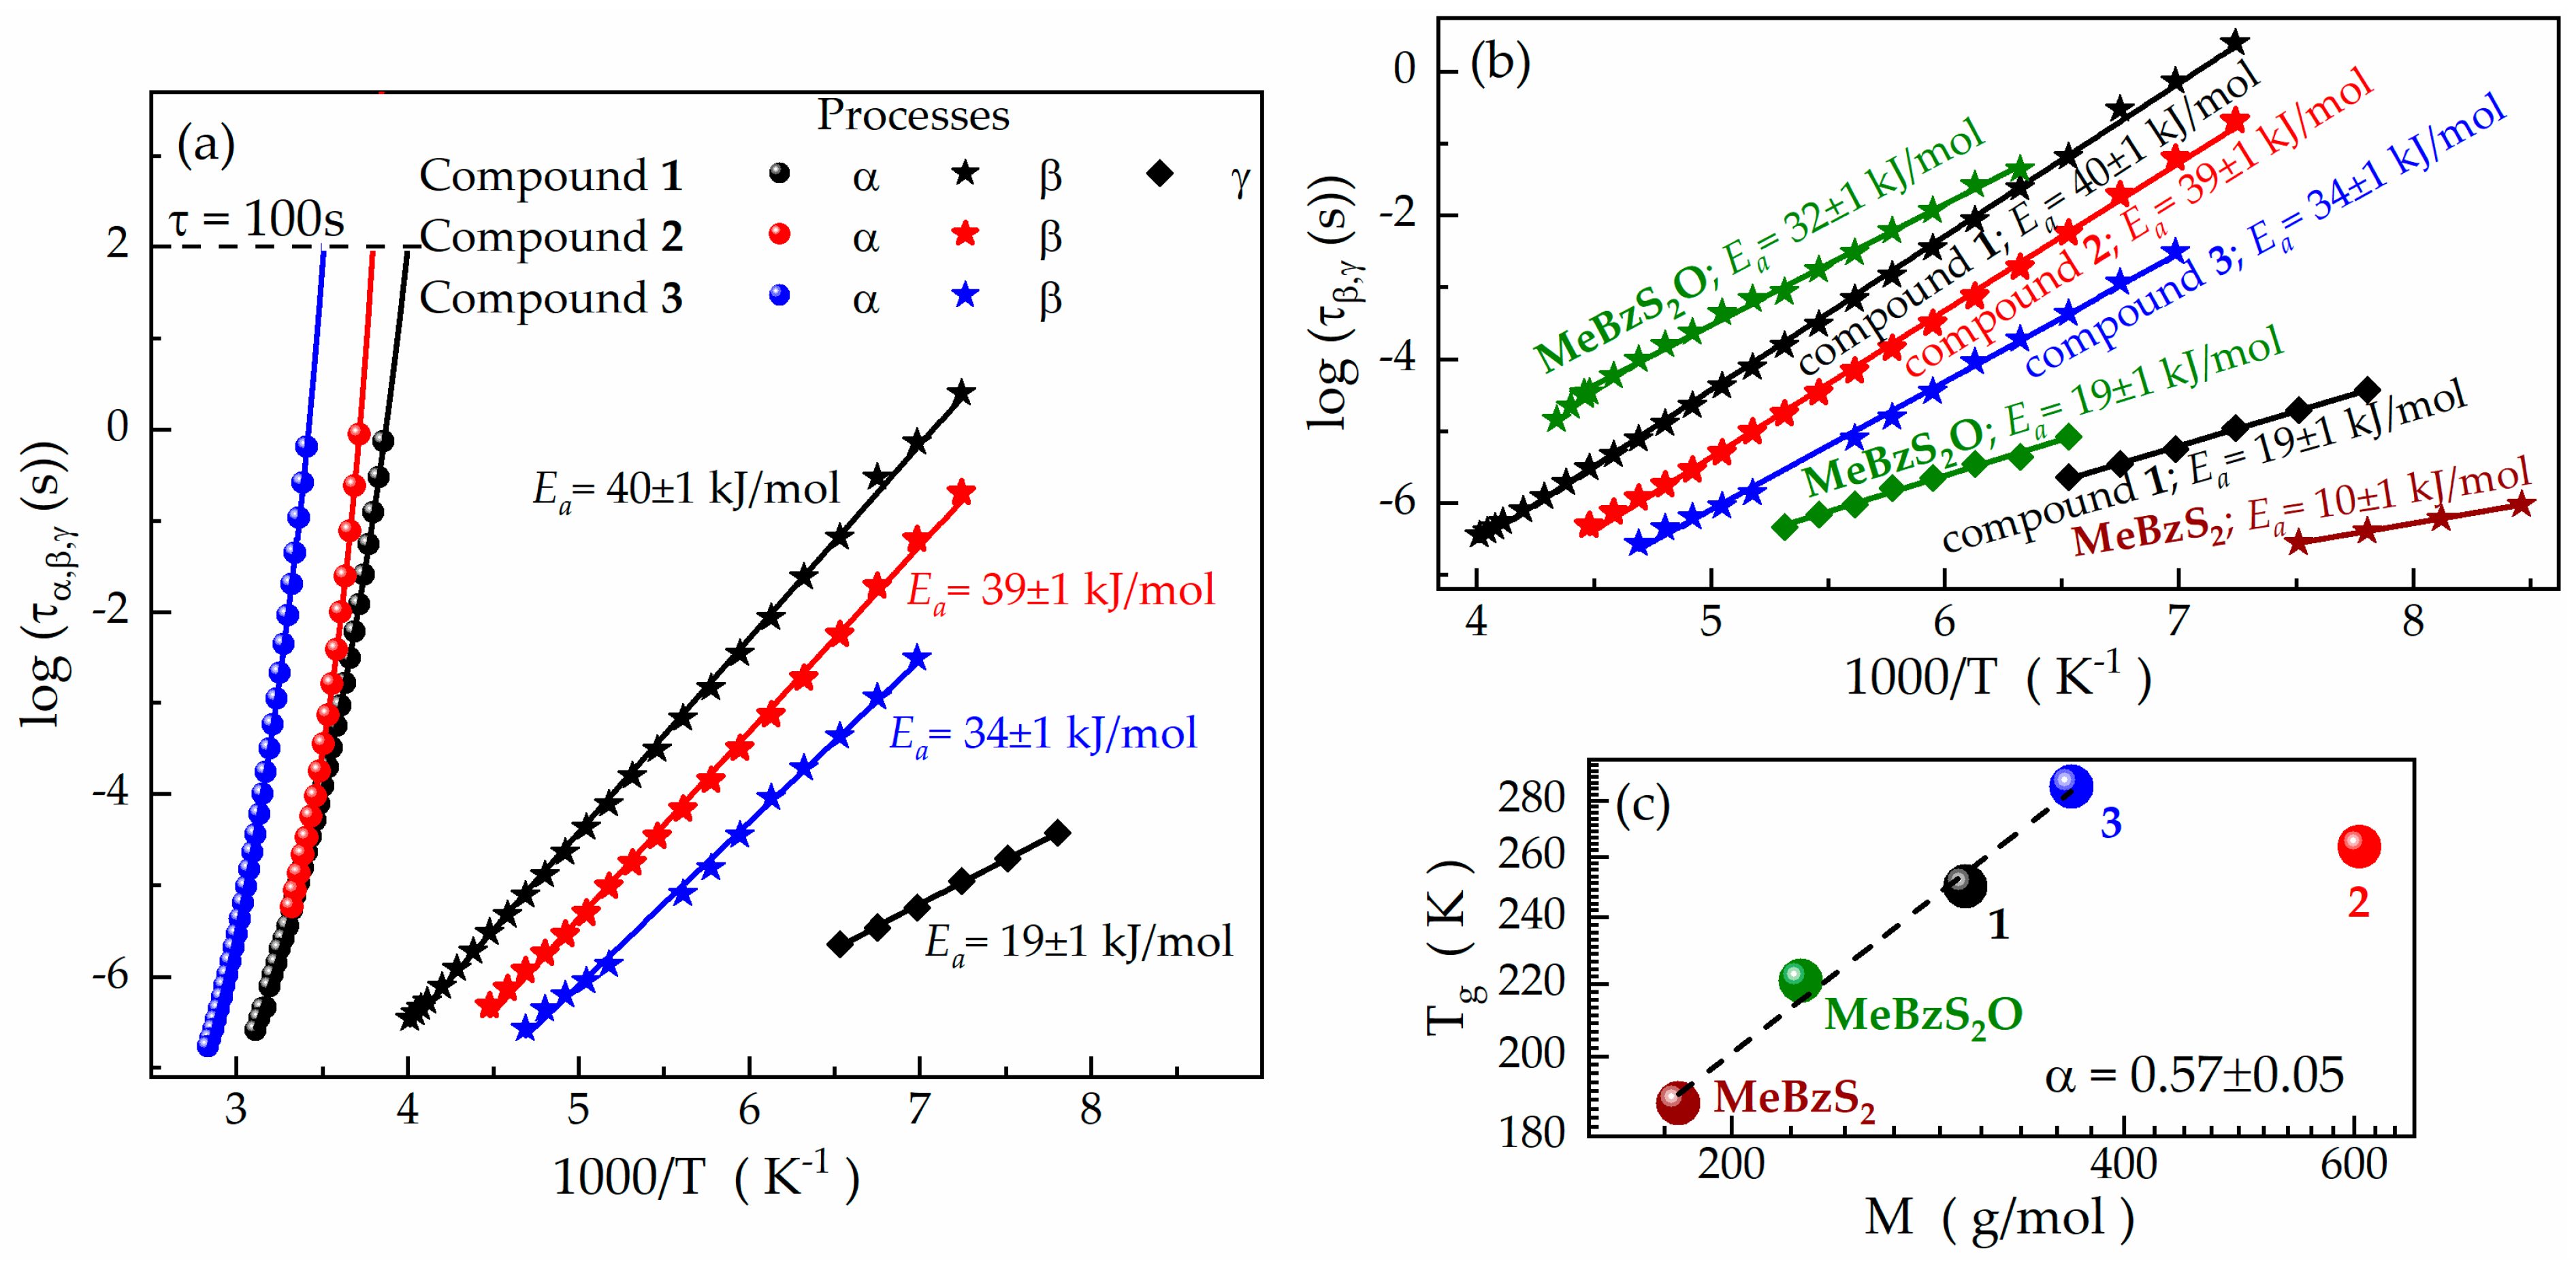
| Compound | Tg (DSC) (K) | Tg (BDS) (K) | VFT Fitting Parameters | mp | ||
|---|---|---|---|---|---|---|
| log(A (s)) | B (K) | T0 (K) | ||||
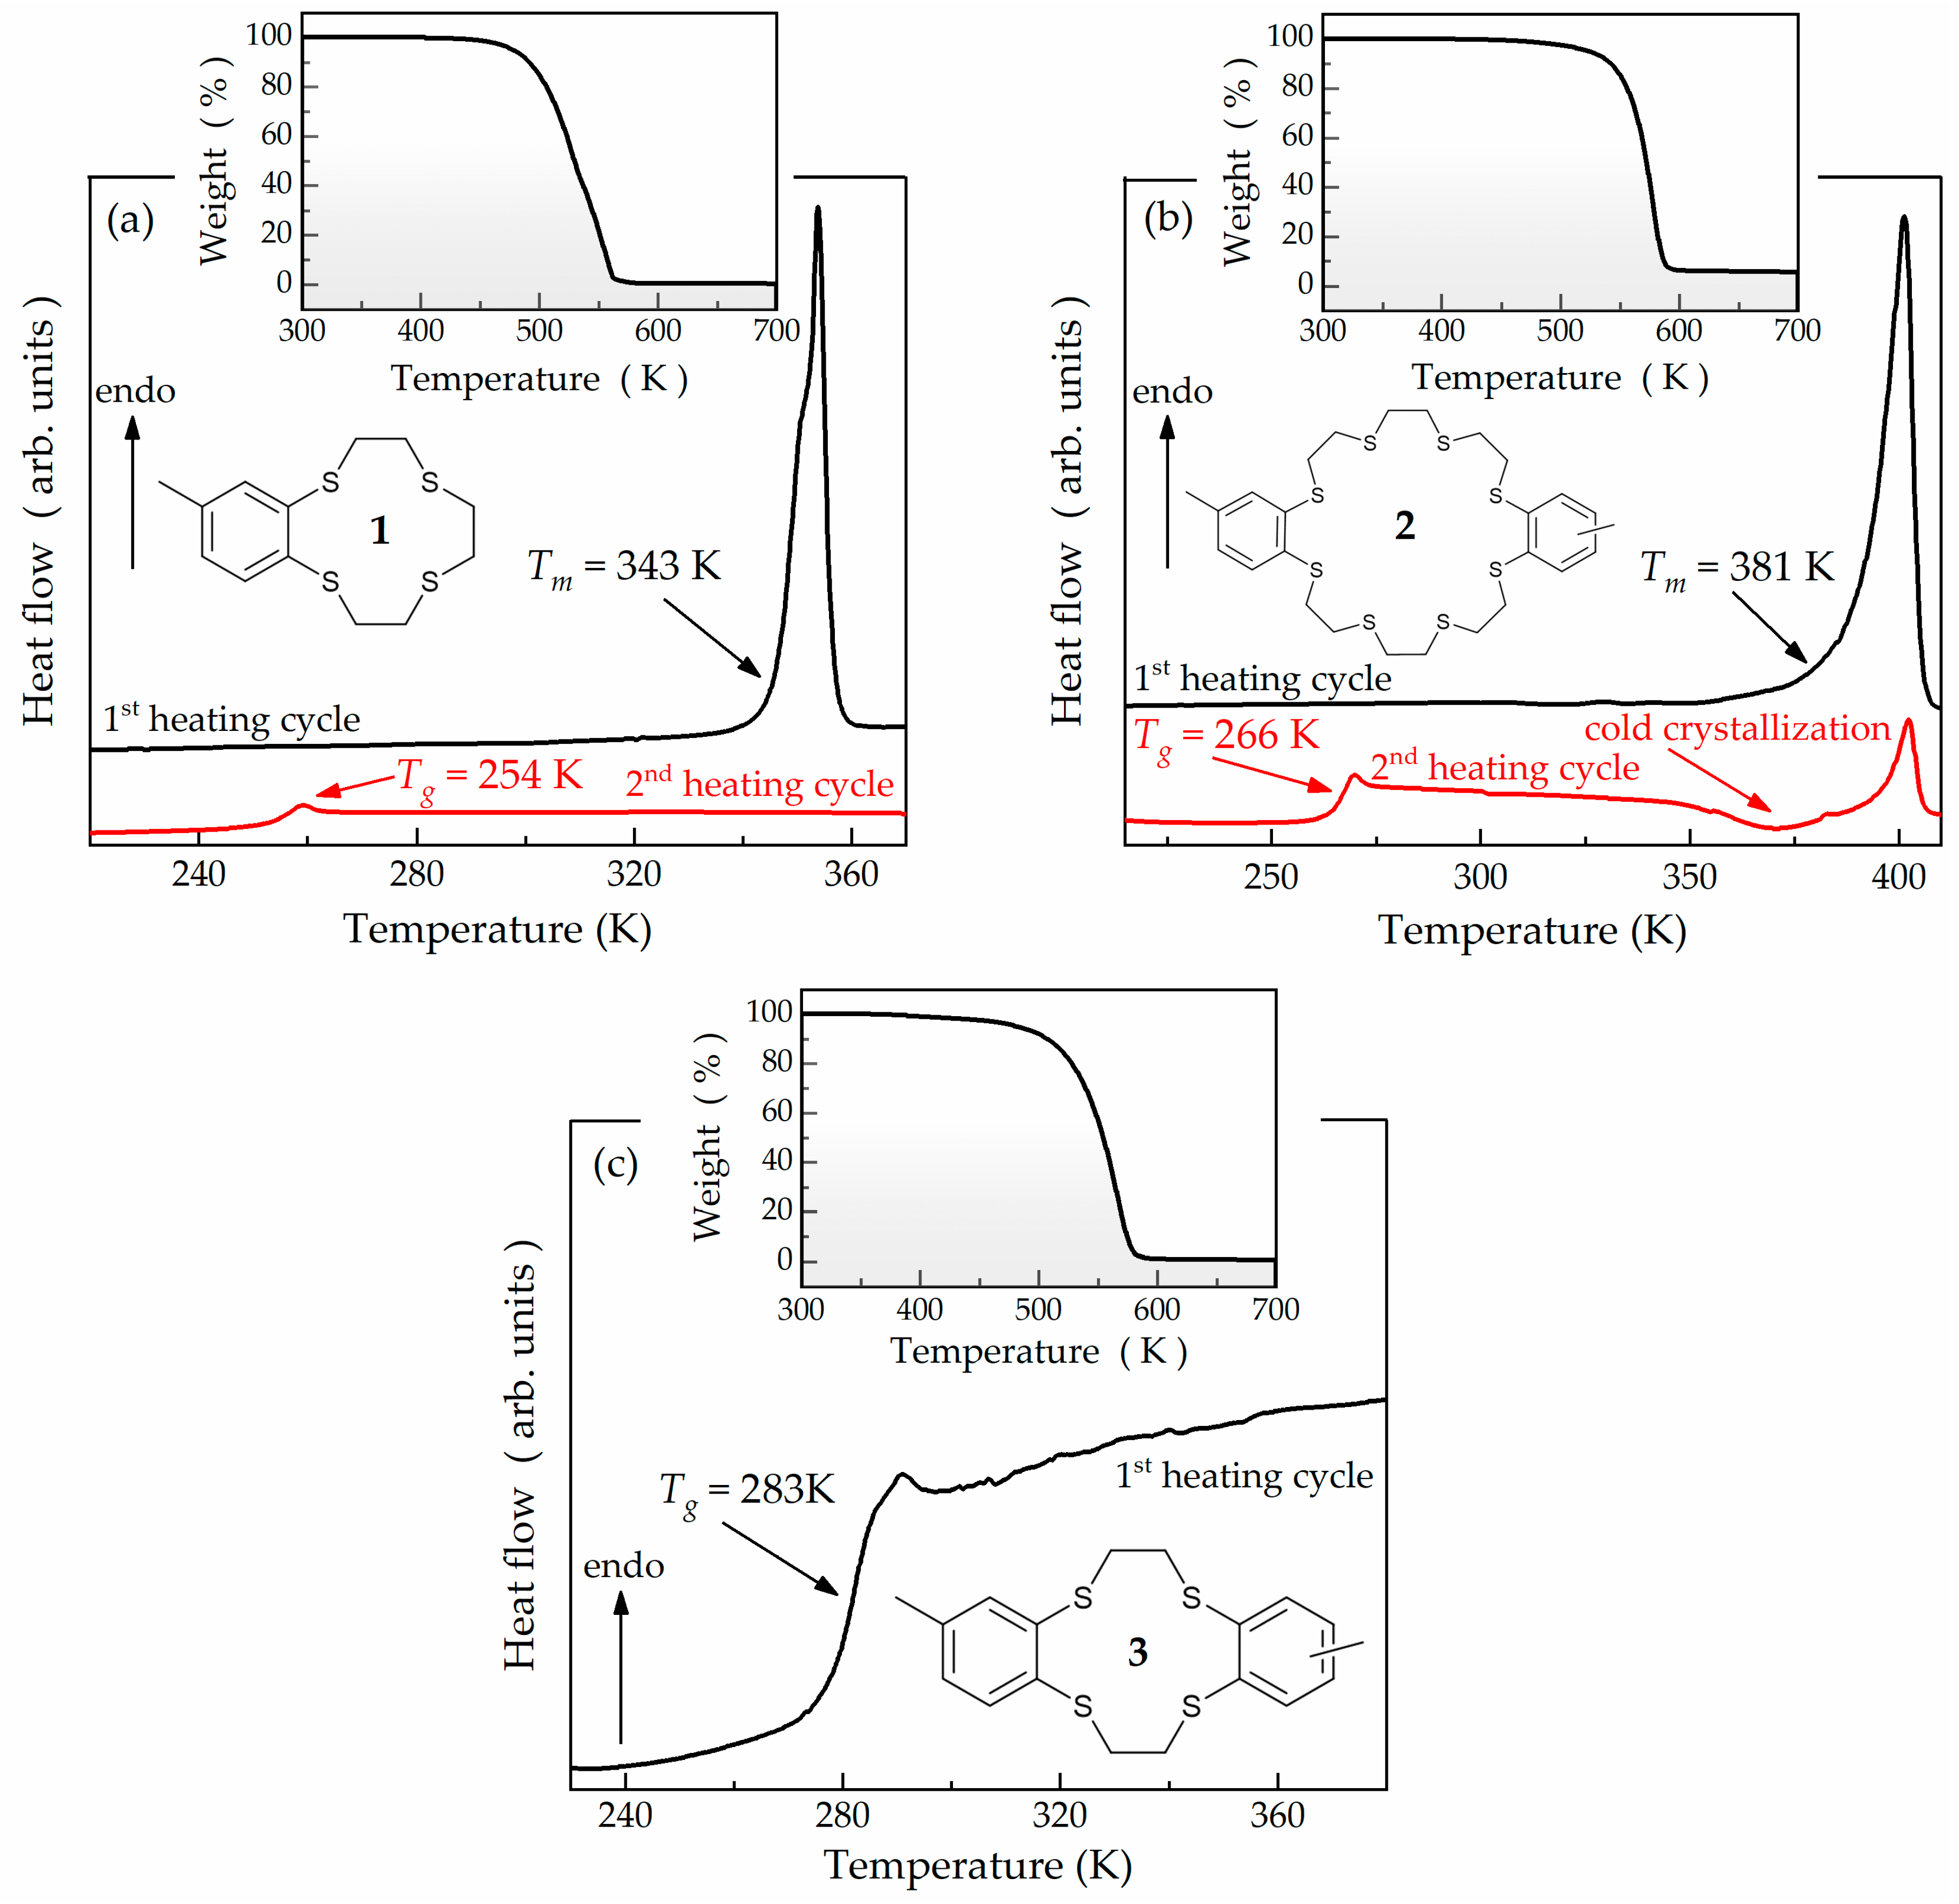
| 1 | 254 | 250 | −13.2 ± 0.2 | 1940 ± 60 | 195 ± 2 | 69 |
| 2 | 266 | 263.5 | −11.2 ± 0.2 | 940 ± 30 | 233 ± 1 | 113 |
| 3 | 283 | 285 | −13.2 ± 0.1 | 1740 ± 40 | 236 ± 1 | 88 |
| Compound | Relaxation | log(τ0 (s)) | Ea (kJ/mol) | Ea/(RTg) |
|---|---|---|---|---|
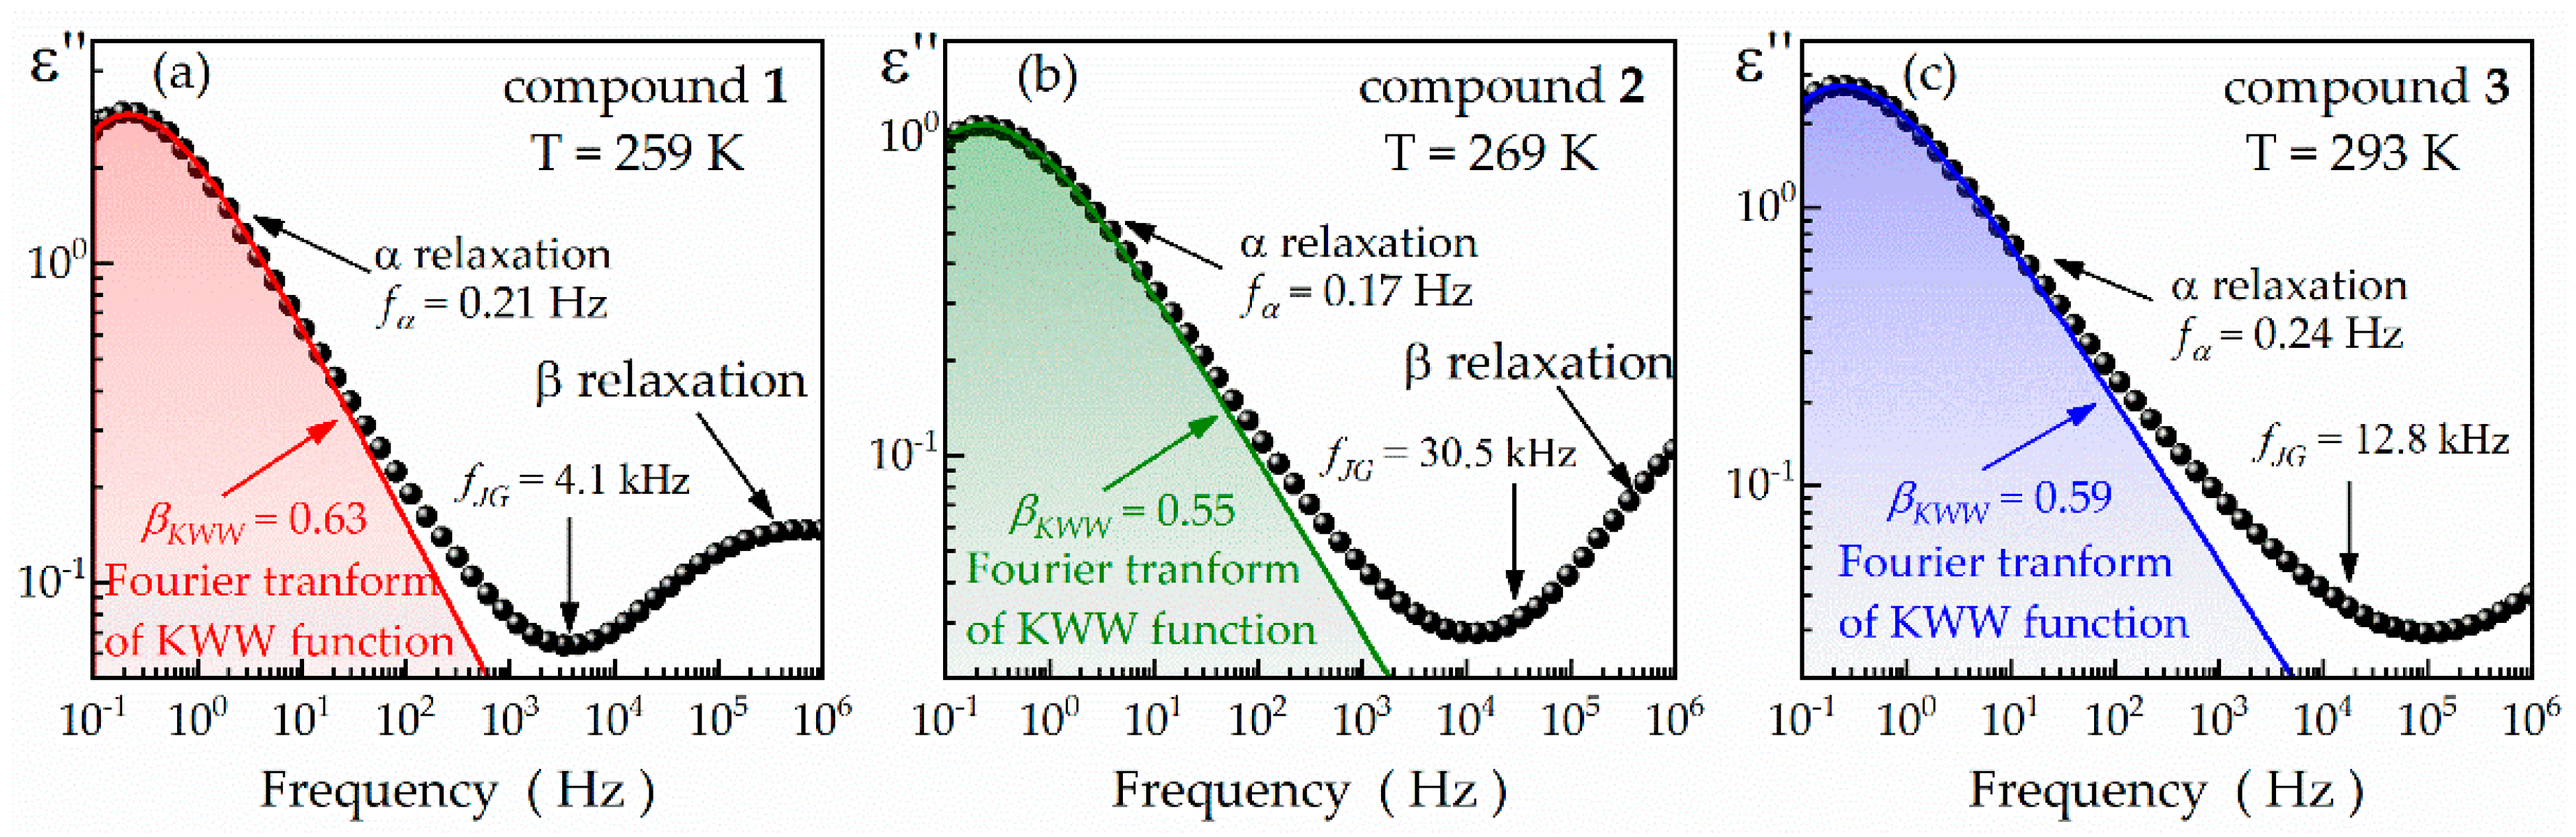
| 1 | β | −15.0 ± 0.1 | 40 ± 1 | 19.2 |
| γ | −12.0 ± 0.1 | 19 ± 1 | 9.1 | |
| 2 | β | −15.6 ± 0.1 | 39 ± 1 | 17.8 |
| 3 | β | −15.0 ± 0.1 | 34 ± 1 | 14.4 |
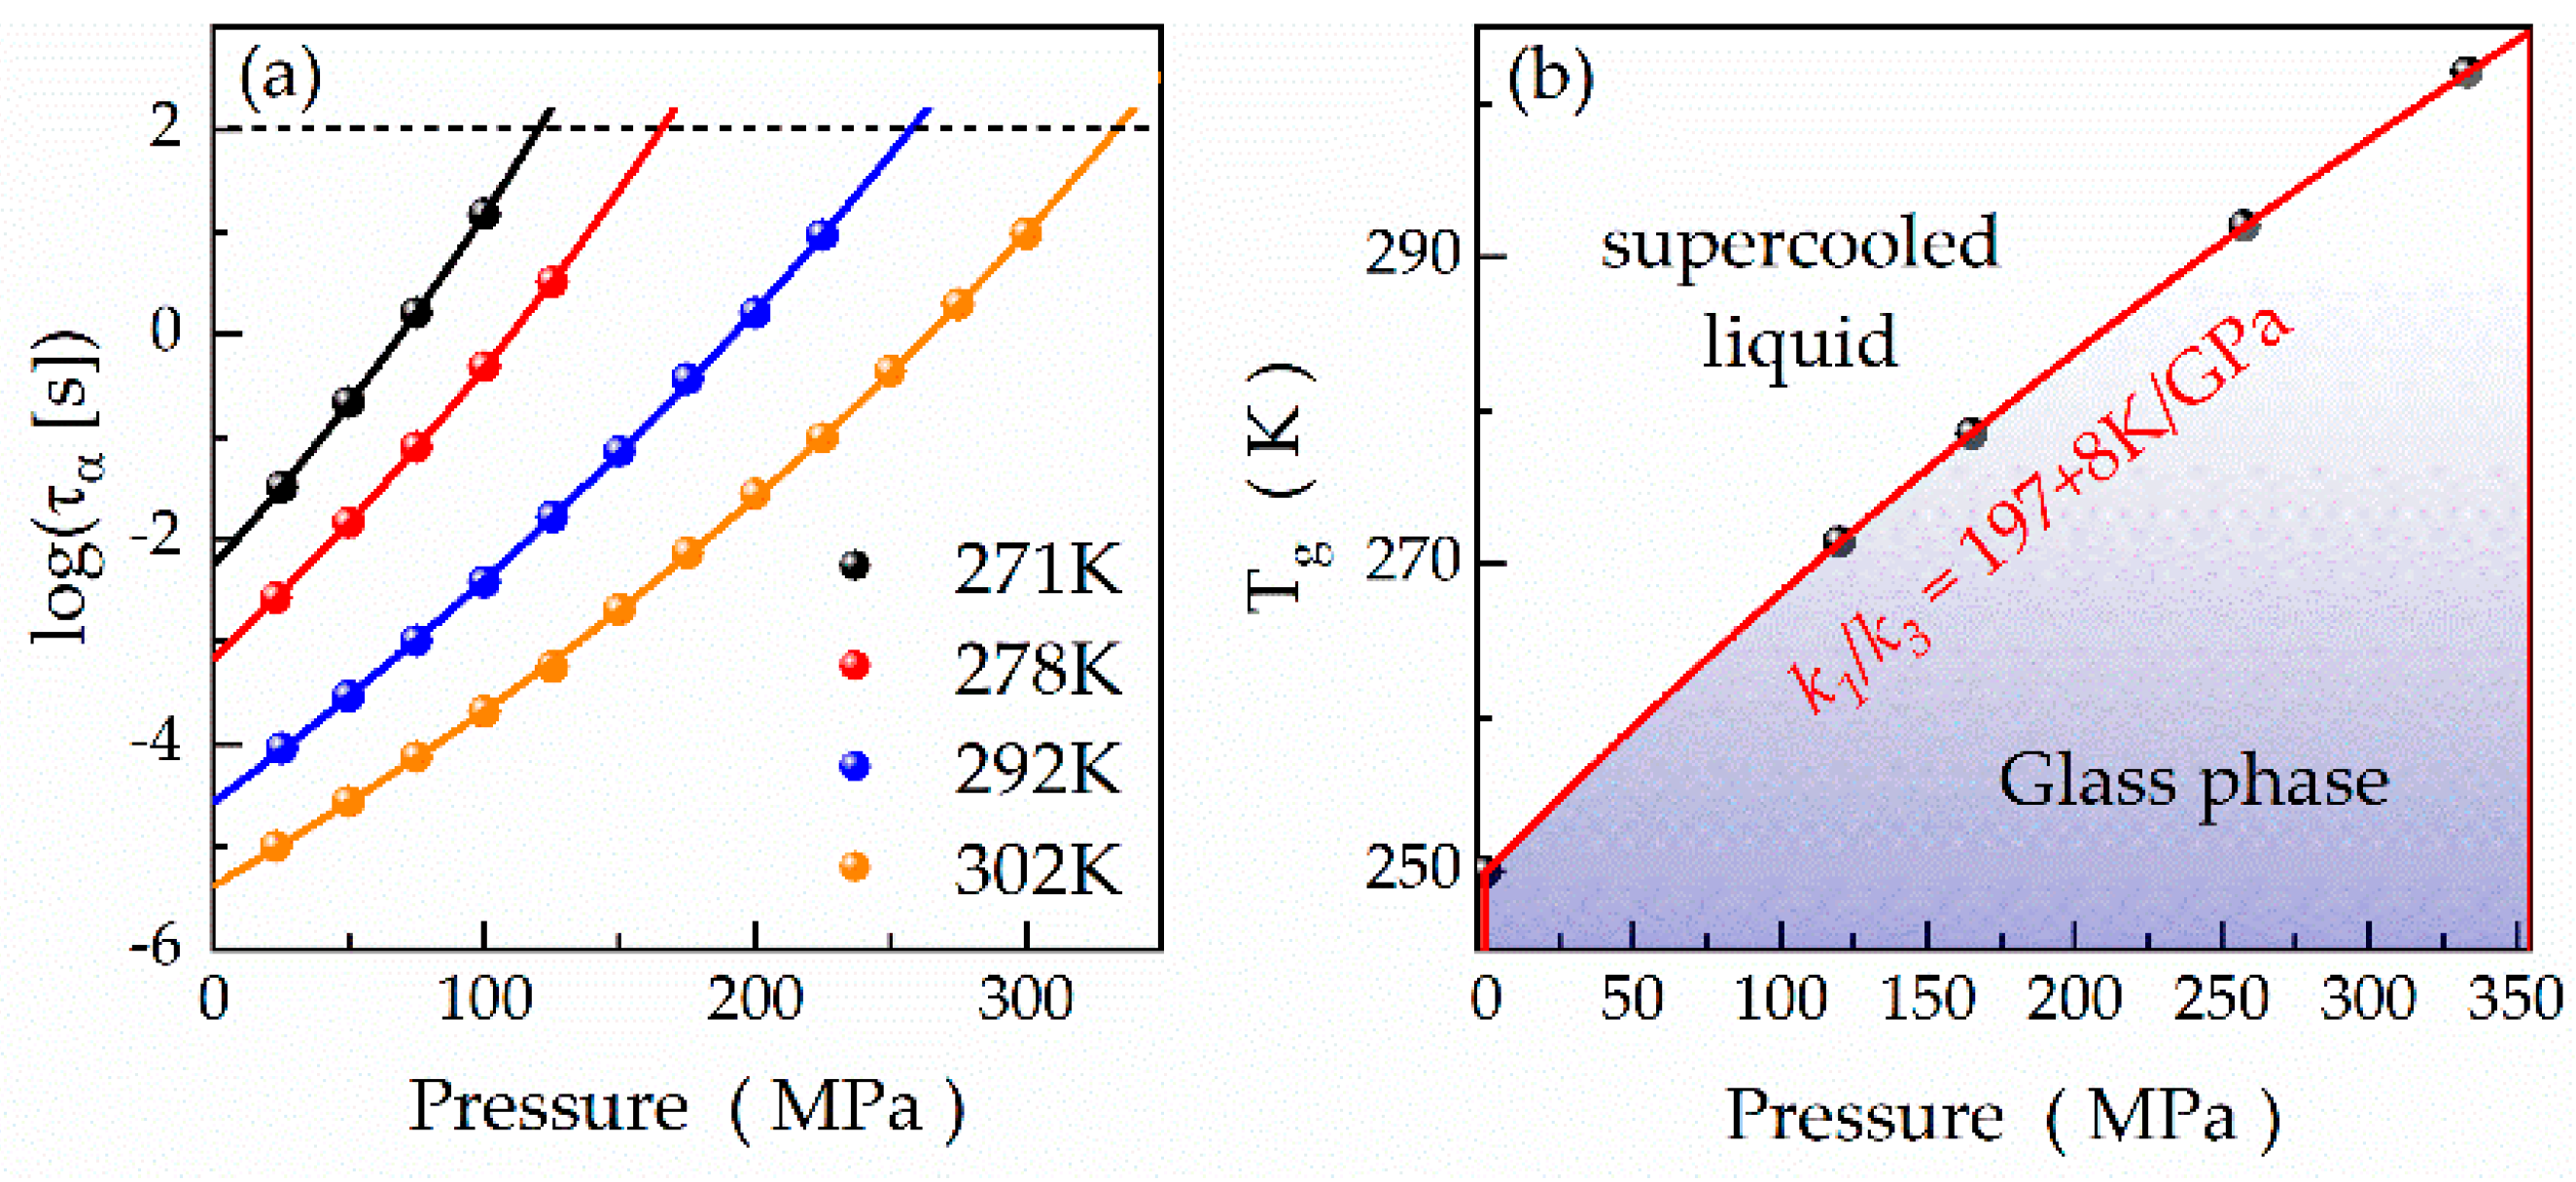
| Temperature (K) | log(τα,0.1MPa (s)) | Dp | P0 (MPa) |
|---|---|---|---|
| 271 | −2.25 ± 0.02 | 46 ± 5 | 680 ± 60 |
| 278 | −3.16 ± 0.01 | 46 ± 4 | 810 ± 60 |
| 292 | −4.57 ± 0.03 | 53 ± 5 | 1100 ± 100 |
| 302 | −5.38 ± 0.02 | 40 ± 2 | 1120 ± 40 |
Disclaimer/Publisher’s Note: The statements, opinions and data contained in all publications are solely those of the individual author(s) and contributor(s) and not of MDPI and/or the editor(s). MDPI and/or the editor(s) disclaim responsibility for any injury to people or property resulting from any ideas, methods, instructions or products referred to in the content. |
© 2023 by the authors. Licensee MDPI, Basel, Switzerland. This article is an open access article distributed under the terms and conditions of the Creative Commons Attribution (CC BY) license (https://creativecommons.org/licenses/by/4.0/).
Share and Cite
Hellwig, H.; Nowok, A.; Peksa, P.; Dulski, M.; Musioł, R.; Pawlus, S.; Kuś, P. Molecular Dynamics and Near-Tg Phenomena of Cyclic Thioethers. Int. J. Mol. Sci. 2023, 24, 17166. https://doi.org/10.3390/ijms242417166
Hellwig H, Nowok A, Peksa P, Dulski M, Musioł R, Pawlus S, Kuś P. Molecular Dynamics and Near-Tg Phenomena of Cyclic Thioethers. International Journal of Molecular Sciences. 2023; 24(24):17166. https://doi.org/10.3390/ijms242417166
Chicago/Turabian StyleHellwig, Hubert, Andrzej Nowok, Paulina Peksa, Mateusz Dulski, Robert Musioł, Sebastian Pawlus, and Piotr Kuś. 2023. "Molecular Dynamics and Near-Tg Phenomena of Cyclic Thioethers" International Journal of Molecular Sciences 24, no. 24: 17166. https://doi.org/10.3390/ijms242417166
APA StyleHellwig, H., Nowok, A., Peksa, P., Dulski, M., Musioł, R., Pawlus, S., & Kuś, P. (2023). Molecular Dynamics and Near-Tg Phenomena of Cyclic Thioethers. International Journal of Molecular Sciences, 24(24), 17166. https://doi.org/10.3390/ijms242417166