
Development of Visible Spectrophotometric Methods for the Determination of Tricyclic Antidepressants Based on Formation of Molecular Complexes with p-Benzoquinones


Abstract
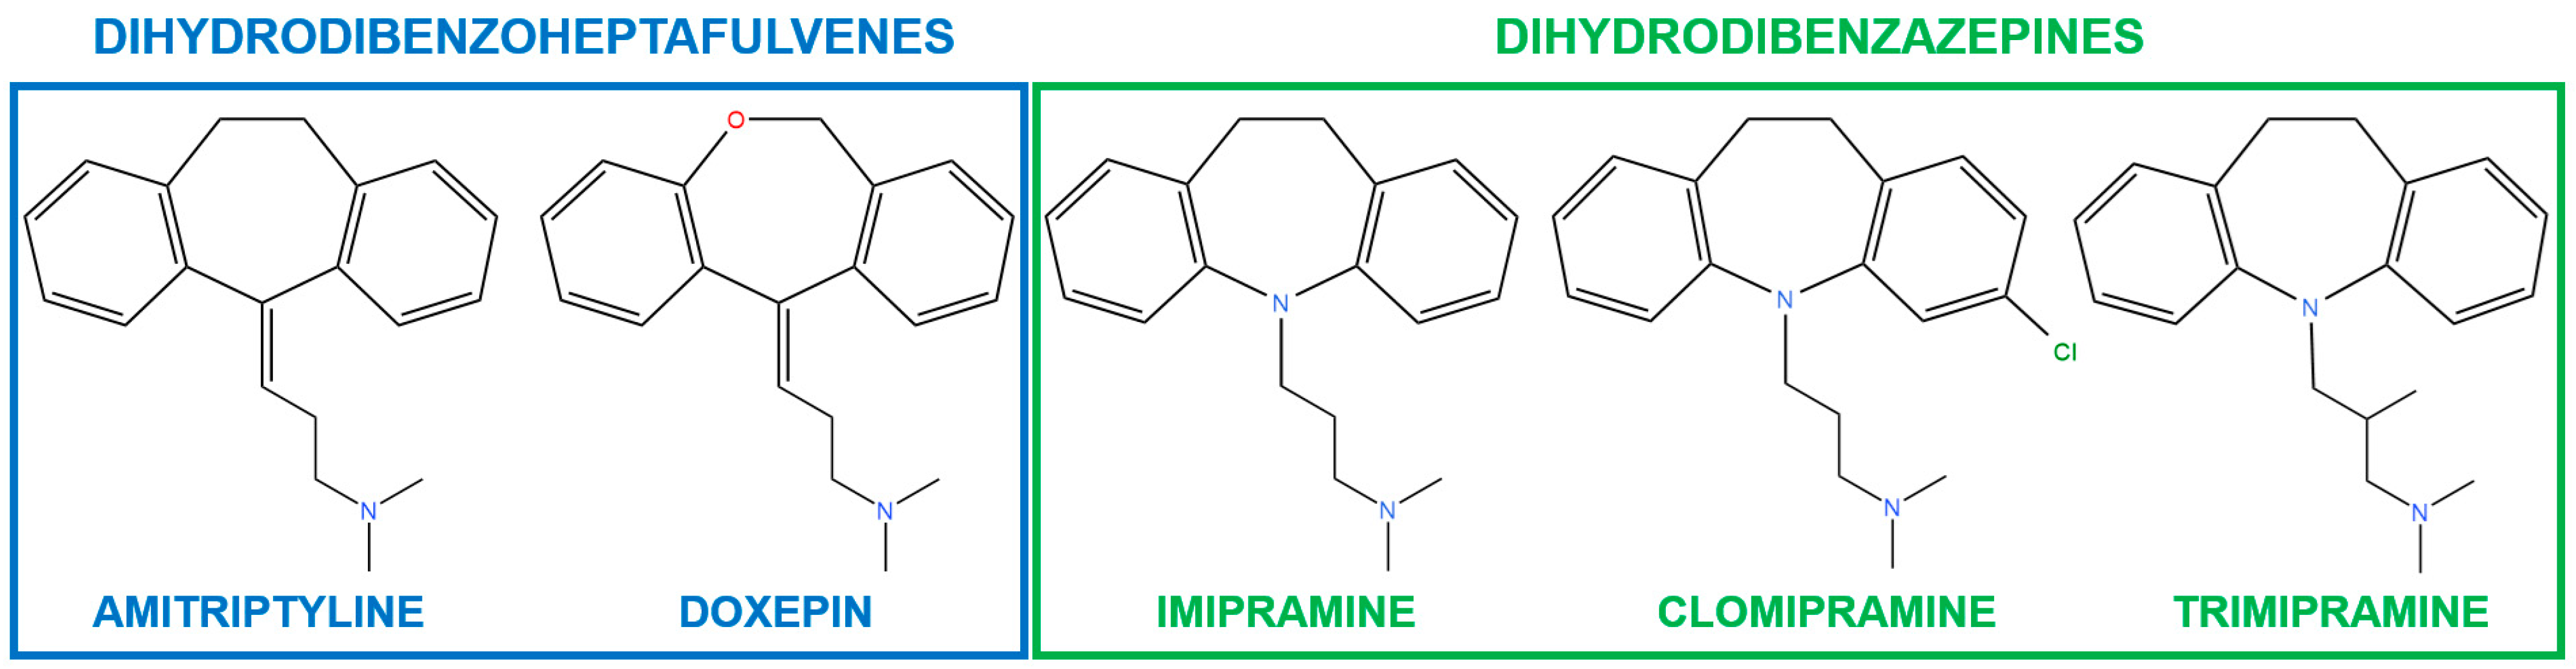
1. Introduction
2. Results and Discussion
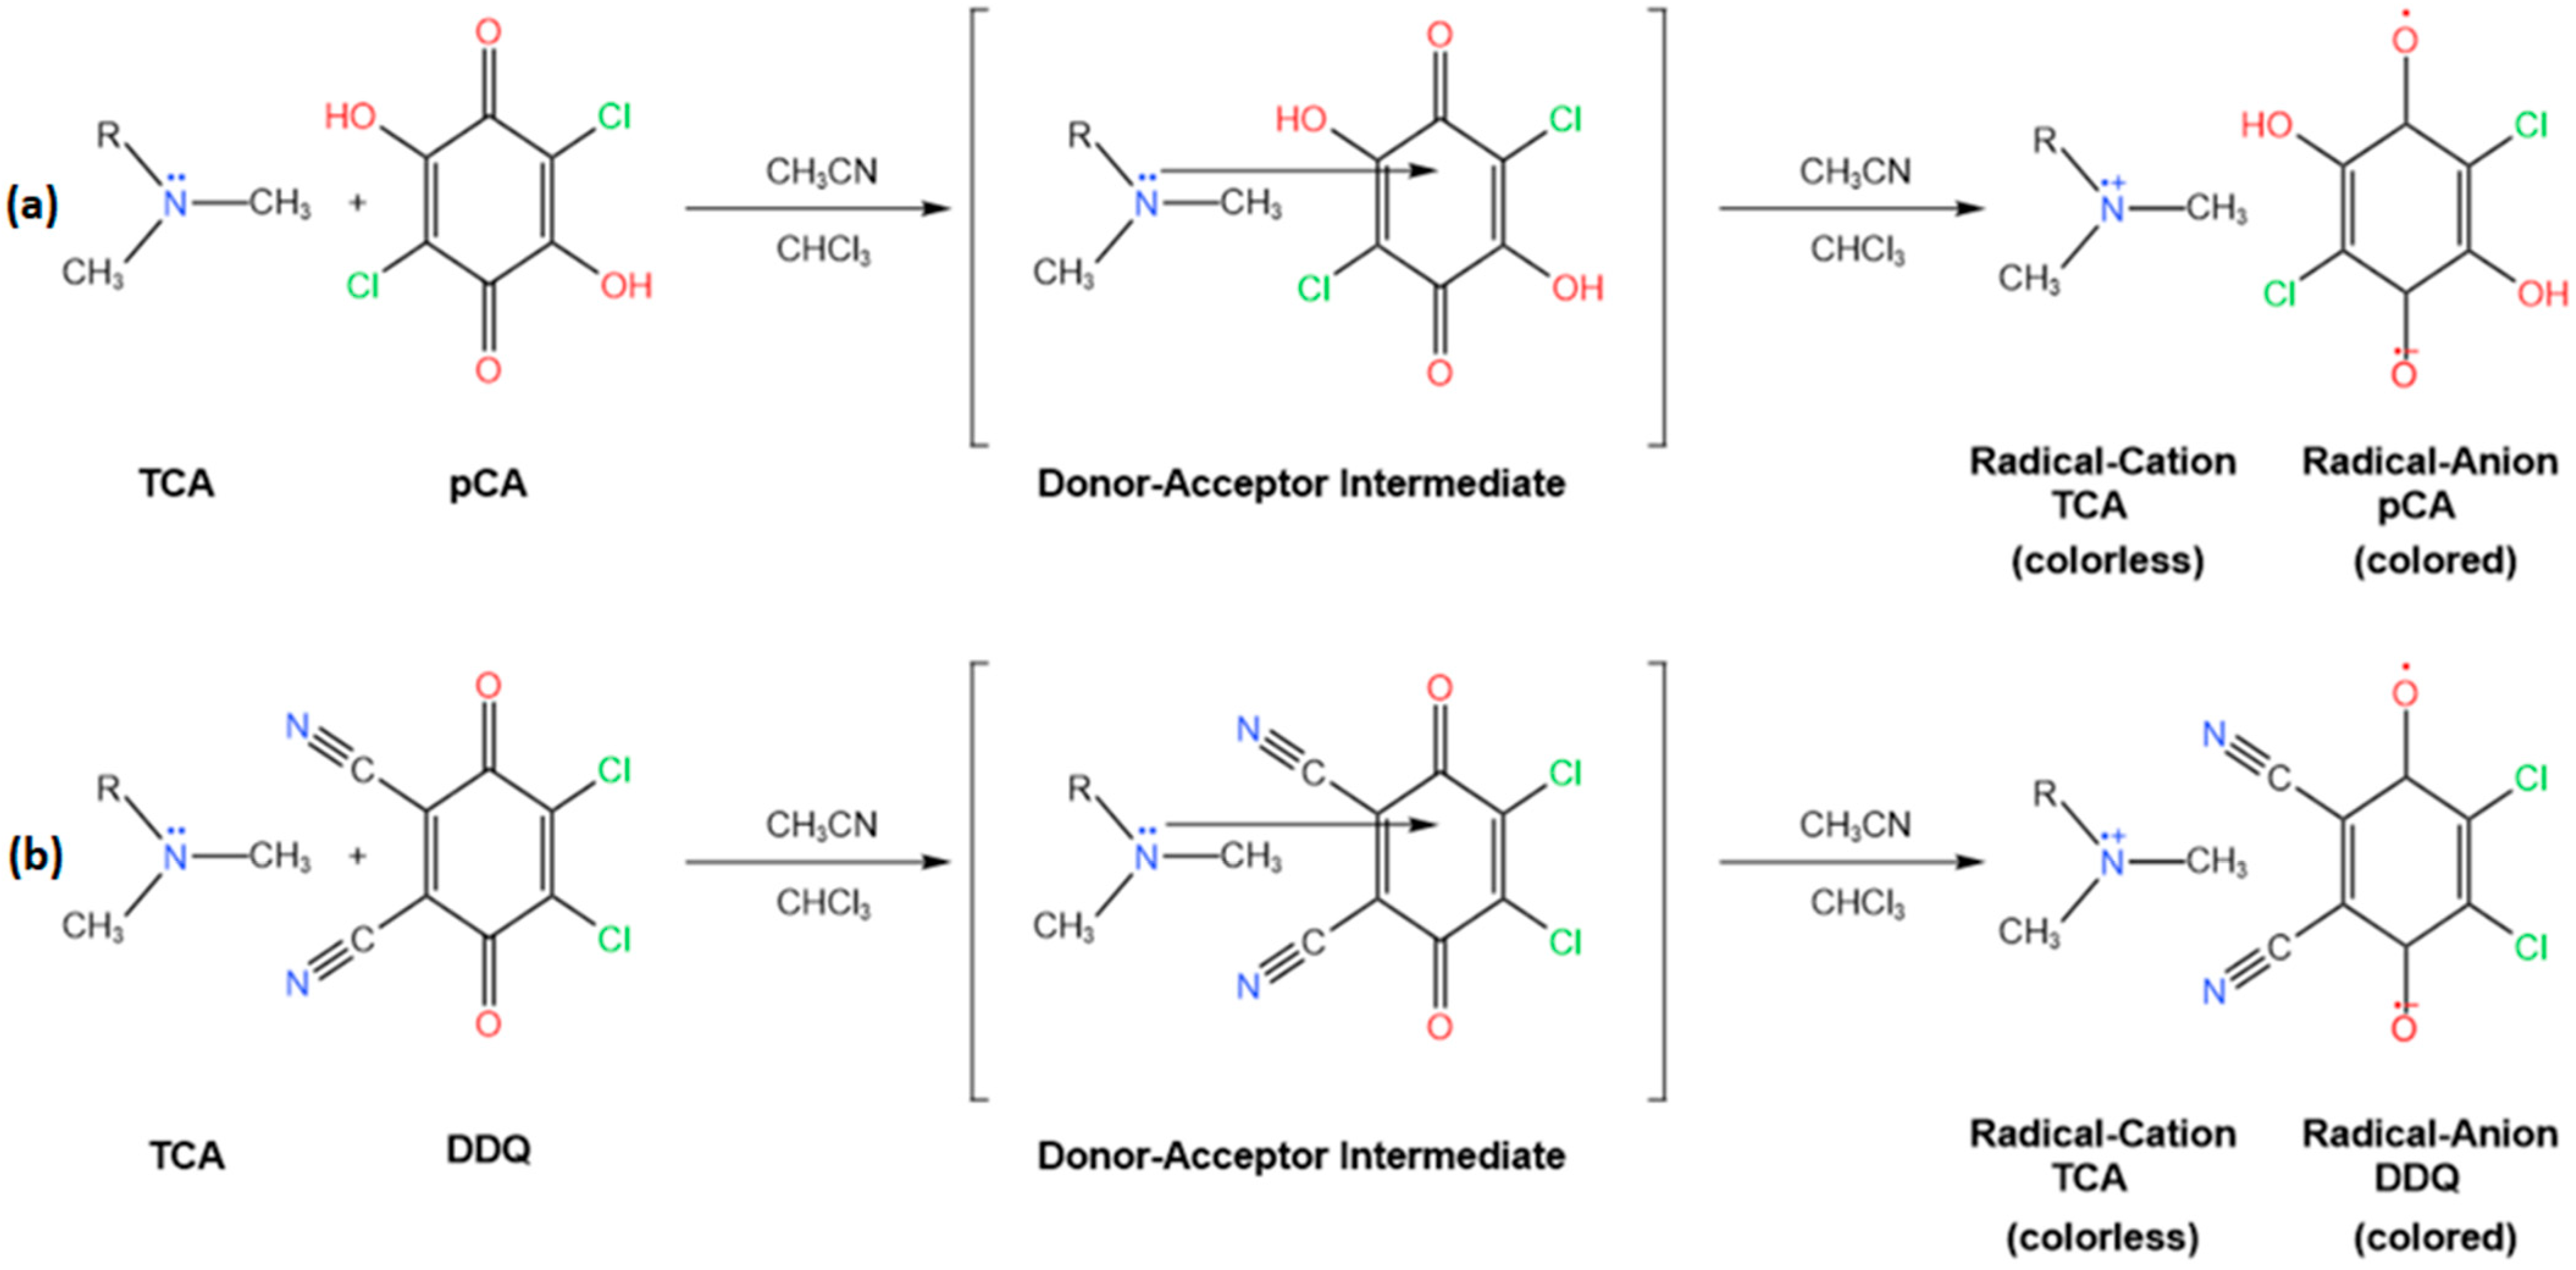
2.1. Absorption Spectra of Reagents and of Resulting TCA-pCA/DDQ Complexes
2.2. The Molecular Compositions of TCA-pCA/DDQ Complexes
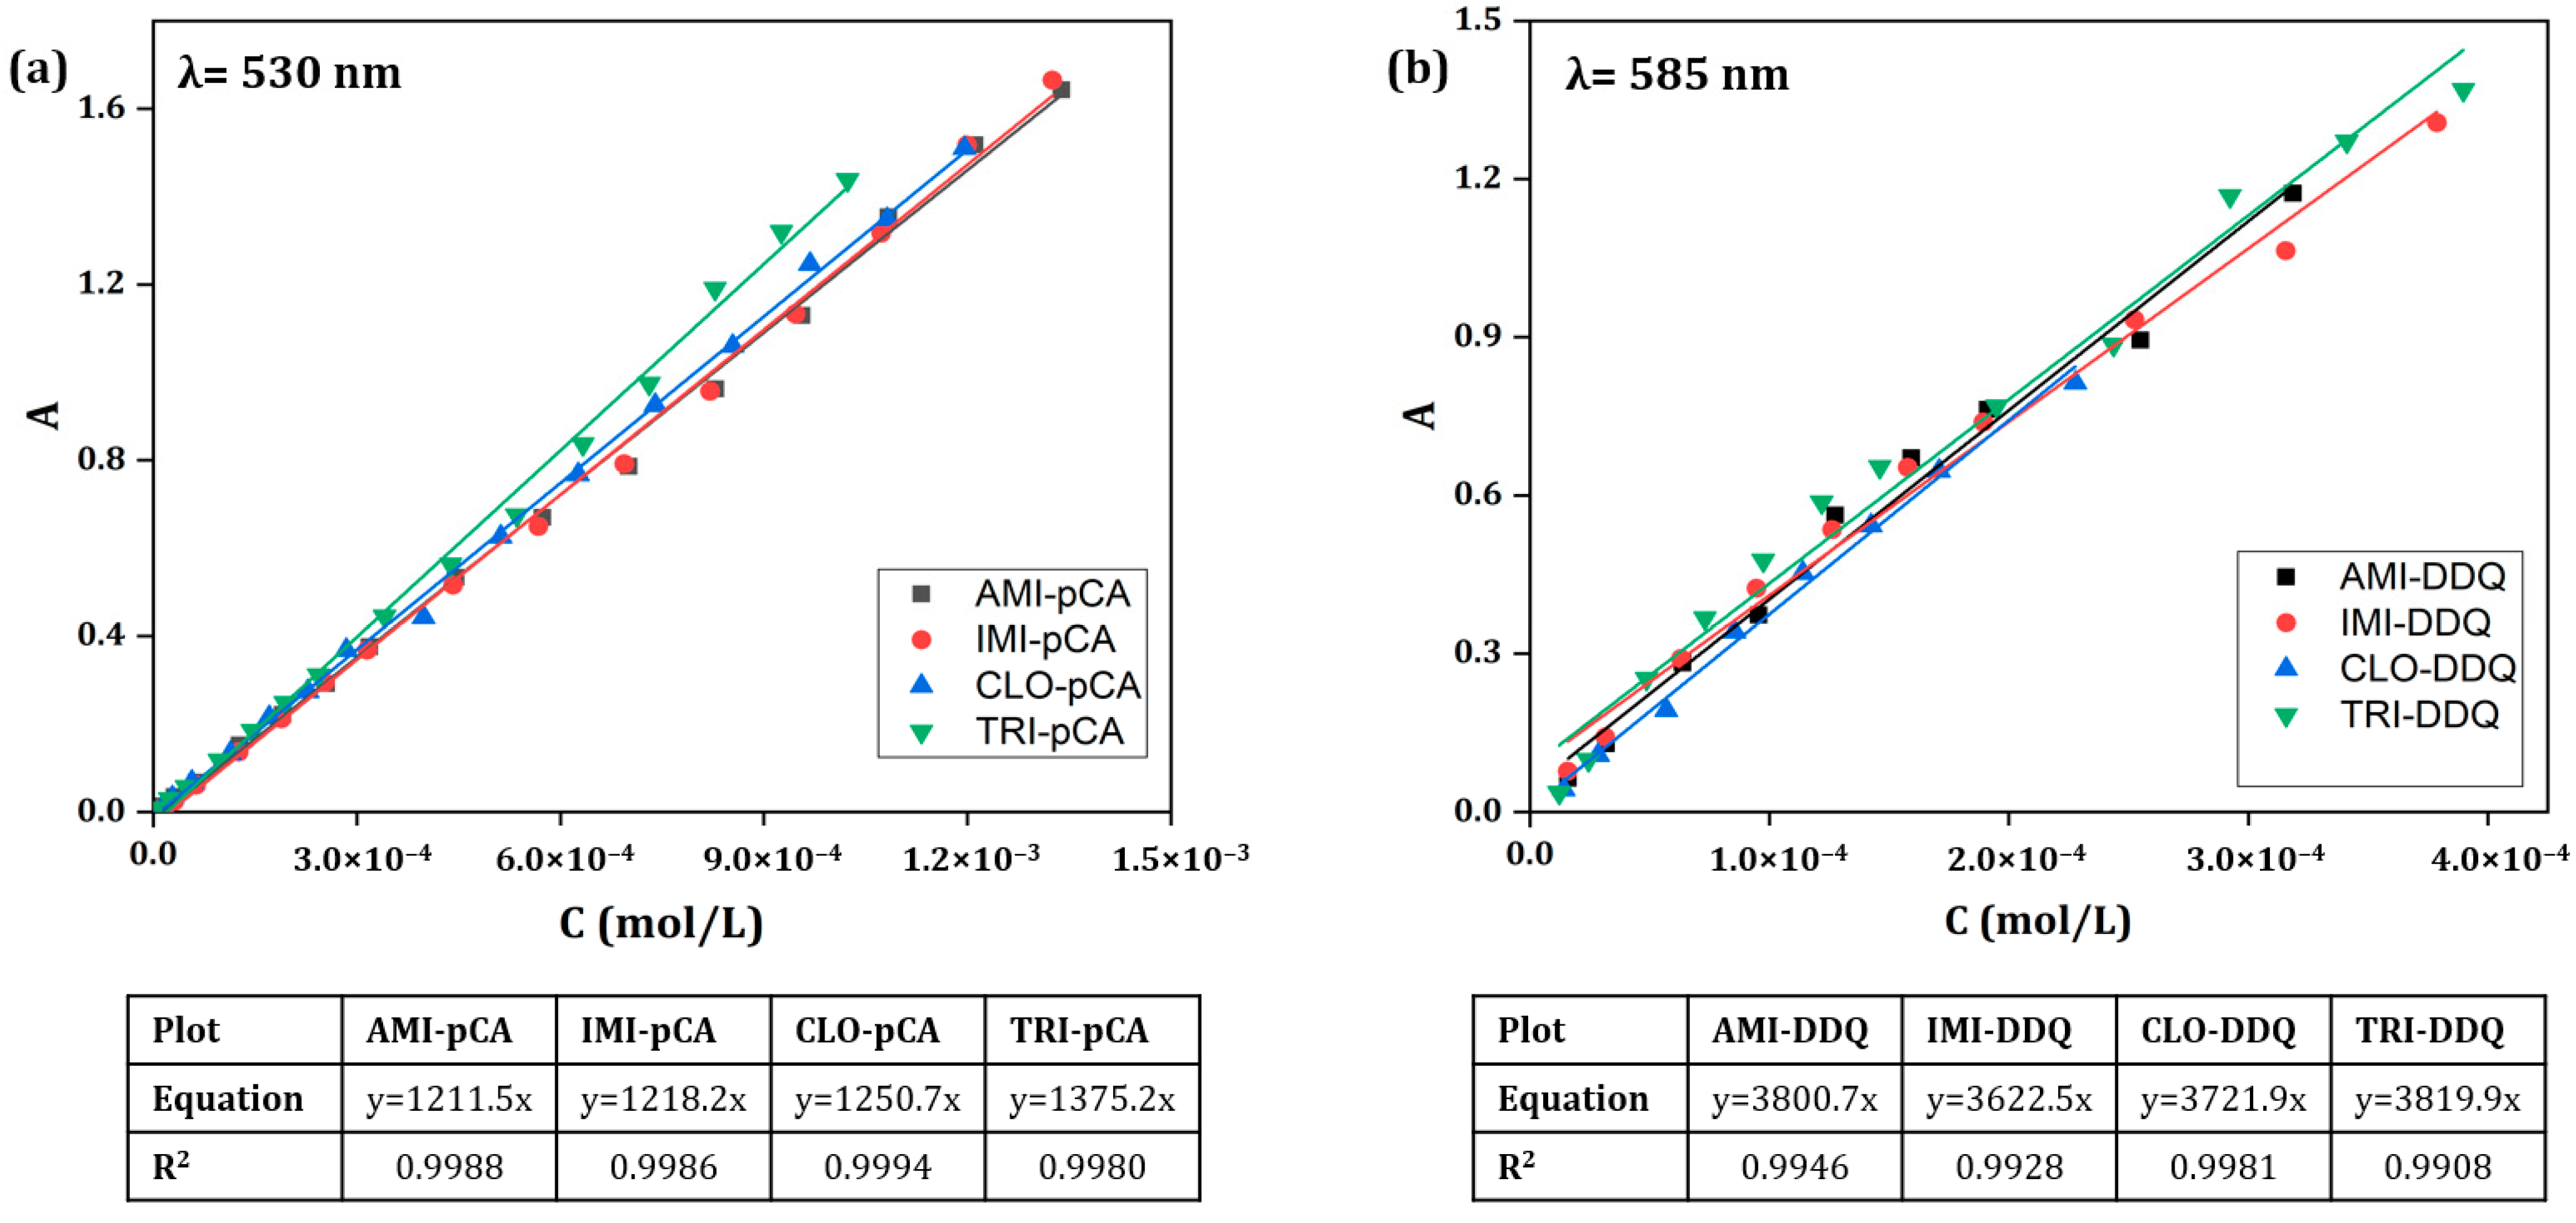
2.3. Molar Absorptivities of TCA-pCA/DDQ Complexes
2.4. Formation (Stability) Constants of TCA-pCA/DDQ Complexes
- -
- CC is the concentration of complex formed at equilibrium (mol/L), determined by dividing the measured absorbances of equimolar mixtures of donor and acceptor by the molar absorptivity of the complex and by the optical path length of the cuvette (1 cm);
- -
- CD is the initial concentration of the TCA donor (mol/L);
- -
- CA is the initial concentration of the pCA or DDQ acceptor, respectively (mol/L).
2.5. Spectroscopic Physical Parameters of TCA-pCA/DDQ Complexes
2.5.1. Oscillator Strength and Transition Dipole Moment
- -
- εmax is the molar absorptivity of the CT complex at the absorption maximum;
- -
- is the band width at half of the maximum absorbance;
- -
- is the maximum absorption wavenumber.
2.5.2. Ionization Potential
2.5.3. Resonance Energy
- -
- εmax is the molar absorptivity of the CT complex at the absorption maximum;
- -
- h is Planck’s constant;
- -
- νCT is the frequency corresponding to the absorption maximum.
2.6. Gibbs Free Energy Change in Complex Formation Reaction
- -
- R is the ideal gas constant;
- -
- T is the absolute temperature;
- -
- K is the formation (stability) constant of the charge transfer complex.
2.7. Validation of the Spectrophotometric Methods
2.7.1. Figures of Merit
2.7.2. Precision and Accuracy
2.8. Comparison with Other Spectrophotometric Methods Published in the Literature

| Reagent(s) Used | TCA | λmax, nm | ε, L mol−1 cm−1 | Linear Range, µg mL−1 | Sandell’s Sensitivity, µg cm−2 | Remarks | Ref. |
|---|---|---|---|---|---|---|---|
| K2Cr2O7 + H2SO4 | IMI CLO TRI | 670 | 3.30 × 10⁴ 1.17 × 10⁴ 2.01 × 10⁴ | 2–14 2–25 2–25 | NR * | Requires heating at 50 °C for 25 min to achieve a stable color, narrow linear range | [60] |
| Ammonium molybdate + H2SO4 | AMI | 660 | 2.41 × 10³ | 1–140 | NR | Requires heating at 100 °C for at least 20 min to achieve stable color | [61] |
| Diazotized p-phenylenediamine dihydrochloride + H2SO4 | IMI CLO TRI | 565 | 5.86 × 10⁴ 6.89 × 10⁴ 8.01 × 10⁴ | 0.1–4.0 0.1–3.6 0.1–3.2 | 0.005 0.005 0.005 | Requires cooling to temperatures below 5 °C for preparation of the diazotized amine, narrow linear range | [66] |
| Niobium (V) thiocyanate + HCl+ butanol extractant | AMI | 360 | 2.17 × 10⁴ | 1–12 | NR | Absorbance maximum is in the UVA domain, narrow linear range, extractive method | [55] |
| Molybdenum (V) thiocyanate + HCl+ CH2Cl2 extractant | AMI | 470 | 1.09 × 10⁴ | 2–30 | 0.1181 | Narrow linear range, extractive method | [69] |
| Excess Br2 + Methyl red | AMI IMI CLO | 520 | 0.65 × 10⁵ 1.41 × 10⁵ 1.93 × 10⁵ | 0.0–2.5 0.0–1.4 0.0–1.4 | 0.0048 0.0022 0.0018 | Indirect method based on partial bleaching of methyl red color by excess Br2 after TCA bromination, narrow linear range | [67] |
| Excess Br2 + Eriochrome blue black R | IMI CLO | 530 | 1.57 × 10⁴ 1.62 × 10⁴ | 0.0–9.0 0.0–10.0 | 0.0202 0.0216 | Indirect method based on partial bleaching of erio R color by excess Br2 after TCA bromination, narrow linear range | [68] |
| Fe(III) + NH4SCN + HNO3 | AMI | 460 | 2.82 × 10³ | 1.0–10.0 | NR | Narrow linear range | [29] |
| Ce(SO4)2 + HClO4 | TRI | 620 | 3.0 × 10⁴ | 0.4–10.0 | NR | Narrow linear range | [62] |
| KIO4 + H2SO4 | TRI | 670 | 1.1 × 10⁴ | 4–42 | NR | Requires heating at 75 °C for 30 min to achieve stable color | [62] |
| β-Cyclodextrine + PEG | AMI | 242 | 2.2 × 10⁴ | 0.1–1.0 | NR | Absorbance maximum is in the UVC domain, narrow linear range | [56] |
| I2 | IMI | 366 | 2.05 × 10³ | 2.0–25 | 0.0141 | Absorbance maximum is in the UVA domain | [57] |
| 3-methylbenzothiazolin-2-one hydrazone + ammonium iron (III) sulfate + HCl | IMI TRI CLO | 630 630 620 | 8.15 × 10⁴ 7.80 × 10⁴ 4.23 × 10⁴ | 0.5–4 1–5 1–8 | NR | Requires heating at 30 °C for 15 min, narrow linear range | [63] |
| I2 | TRI | 292 | 7.1 × 10⁴ | 1–5 | 0.0057 | Absorbance maximum is in the UVC domain, narrow linear range, color obtained after 30 min and stable for only 30 min | [58] |
| Chloranil | TRI | 220 | 1.6 × 10⁴ | 5–50 | 0.0256 | Absorbance maximum is in UVC domain, stable color is obtained after 30 min | [58] |
| 2,2′-bipyridine + CH3COOH | IMI CLO TRI | 530 | 6.59 × 10⁴ 6.55 × 10⁴ 6.80 × 10⁴ | 0.2–2.4 0.2–3.2 0.2–2.0 | 0.0048 0.0022 0.0018 | Requires boiling the solution for 30 min to achieve stable color, narrow linear range, applicable only to dibenzazepines | [64] |
| Diazotized p-nitroaniline + HCl | IMI TRI CLO | 575 | 3.3 × 10⁴ 4.8 × 10⁴ 1.9 × 10⁴ | 1–10 1–10 3–20 | NR | Requires storing the solution in ice bath and must be freshly prepared every 5 h, requires heating at 75 °C for 20 min and cooling to achieve color, narrow linear range | [63] |
| Bromocresol green + CH2Cl2 extractant | CLO | 402 | 1.11 × 10⁴ | 1.65–34.78 | 0.03 | Absorbance maximum almost in the UV, extractive method | [59] |
| Ammonium molybdate + CH3COOH | CLO | 712 | 7.11 × 10³ | 1–250 | NR | Requires heating at 90 °C for 35 min and cooling to achieve stable color | [65] |
| pCA/CH3CN + CHCl3 | AMI IMI CLO TRI | 530 | 1.21 × 10³ 1.22 × 10³ 1.25 × 10³ 1.38 × 10³ | 5–420 5–420 5–420 5–420 | 0.2591 0.2601 0.2809 0.2985 | Extractive method | This work |
| DDQ/CH3CN + CHCl3 | AMI IMI CLO TRI | 585 | 3.80 × 10³ 3.62 × 10³ 3.72 × 10³ 3.95 × 10³ | 5-100 5–120 5–80 5–140 | 0.0826 0.0875 0.0944 0.1039 | Extractive method | This work |
2.9. Application of the Proposed Spectrophotometric Methods
3. Materials and Methods
3.1. Chemicals
3.2. Pharmaceutical Products
3.3. Analytical Instrumentation
3.4. Preparation of Stock Solutions
3.5. Preparation of Antidepressant Base form Standard Solutions
3.6. Extraction of Pharmaceutically Active Ingredients from Commercial Tablets and Preparation of Their Base form Solutions
3.7. General Procedure for Spectrophotometric Measurements
3.8. Molar Ratio Determination for the Charge Transfer Complexes TCA-pCA and TCA-DDQ
4. Conclusions
Author Contributions
Funding
Institutional Review Board Statement
Informed Consent Statement
Data Availability Statement
Conflicts of Interest
References
- Mehdi, S.; Manohar, K.; Shariff, A.; Wani, S.U.D.; Almuqbil, M.; Alshehri, S.; Shakeel, F.; Imam, M.T.; Krishna, K.L. Analysis of Antidepressants Utilization for Patients Visiting Psychiatric Out-Patient Clinic in a Tertiary Care Hospital. Healthcare 2022, 10, 2081. [Google Scholar] [CrossRef]
- Soares, S.; Rosado, T.; Barroso, M.; Gallardo, E. New Method for the Monitoring of Antidepressants in Oral Fluid Using Dried Spot Sampling. Pharmaceuticals 2021, 14, 1284. [Google Scholar] [CrossRef]
- Matic, T.; Pregelj, P.; Sadikov, A.; Rus Prelog, P. Depression, Anxiety, Stress, and Suicidality Levels in Young Adults Increased Two Years into the COVID-19 Pandemic. Int. J. Environ. Res. Public Health 2022, 20, 339. [Google Scholar] [CrossRef] [PubMed]
- Arias-de la Torre, J.; Ronaldson, A.; Prina, M.; Matcham, F.; Pinto Pereira, S.M.; Hatch, S.L.; Armstrong, D.; Pickles, A.; Hotopf, M.; Dregan, A. Depressive symptoms during early adulthood and the development of physical multimorbidity in the UK: An observational cohort study. Lancet Healthy Longev. 2021, 2, e801–e810. [Google Scholar] [CrossRef] [PubMed]
- Hudson, D.; Collins-Anderson, A. Understanding Perceptions of Depression and Depression Care across Culture and Context. Int. J. Environ. Res. Public Health 2022, 19, 11720. [Google Scholar] [CrossRef] [PubMed]
- Ciuca, M.D.; Racovita, R.C. Curcumin: Overview of Extraction Methods, Health Benefits, and Encapsulation and Delivery Using Microemulsions and Nanoemulsions. Int. J. Mol. Sci. 2023, 24, 8874. [Google Scholar] [CrossRef] [PubMed]
- Moitra, M.; Santomauro, D.; Degenhardt, L.; Collins, P.Y.; Whiteford, H.; Vos, T.; Ferrari, A. Estimating the risk of suicide associated with mental disorders: A systematic review and meta-regression analysis. J. Psychiatr. Res. 2021, 137, 242–249. [Google Scholar] [CrossRef] [PubMed]
- Polak, M.; Nowicki, G.J.; Naylor, K.; Piekarski, R.; Slusarska, B. The Prevalence of Depression Symptoms and Their Socioeconomic and Health Predictors in a Local Community with a High Deprivation: A Cross-Sectional Studies. Int. J. Environ. Res. Public Health 2022, 19, 11797. [Google Scholar] [CrossRef]
- Zalewska, A.; Galczyk, M.; Van Damme-Ostapowicz, K. Level of Depression during the COVID-19 Pandemic in Poland—A Cross-Sectional Study. Healthcare 2022, 10, 1123. [Google Scholar] [CrossRef]
- Aveiro-Robalo, T.R.; Garlisi-Torales, L.D.; Chuman-Sanchez, M.; Pereira-Victorio, C.J.; Huaman-Garcia, M.; Failoc-Rojas, V.E.; Valladares-Garrido, M.J. Prevalence and Associated Factors of Depression, Anxiety, and Stress in University Students in Paraguay during the COVID-19 Pandemic. Int. J. Environ. Res. Public Health 2022, 19, 12930. [Google Scholar] [CrossRef]
- Balakrishnan, V.; Ng, K.S.; Kaur, W.; Govaichelvan, K.; Lee, Z.L. COVID-19 depression and its risk factors in Asia Pacific—A systematic review and meta-analysis. J. Affect. Disord. 2022, 298, 47–56. [Google Scholar] [CrossRef]
- Stephenson, E.; O’Neill, B.; Kalia, S.; Ji, C.; Crampton, N.; Butt, D.A.; Tu, K. Effects of COVID-19 pandemic on anxiety and depression in primary care: A retrospective cohort study. J. Affect. Disord. 2022, 303, 216–222. [Google Scholar] [CrossRef]
- Manousi, N.; Samanidou, V.F. Applications of Gas Chromatography for the Analysis of Tricyclic Antidepressants in Biological Matrices. Separations 2019, 6, 24. [Google Scholar] [CrossRef]
- Achenbach, J.; Saft, C.; Faissner, S. Longitudinal Evaluation of the Effect of Tricyclic Antidepressants and Neuroleptics on the Course of Huntington’s Disease-Data from a Real World Cohort. Brain Sci. 2021, 11, 413. [Google Scholar] [CrossRef]
- Asensi-Canto, A.; Lopez-Abellan, M.D.; Castillo-Guardiola, V.; Hurtado, A.M.; Martinez-Penella, M.; Luengo-Gil, G.; Conesa-Zamora, P. Antitumoral Effects of Tricyclic Antidepressants: Beyond Neuropathic Pain Treatment. Cancers 2022, 14, 3248. [Google Scholar] [CrossRef] [PubMed]
- Wu, Q.; Xu, Y.; Bao, Y.; Alvarez, J.; Gonzales, M.L. Tricyclic Antidepressant Use and Risk of Fractures: A Meta-Analysis of Cohort Studies through the Use of Both Frequentist and Bayesian Approaches. J. Clin. Med. 2020, 9, 2584. [Google Scholar] [CrossRef]
- Enescu, L. Medicamente, Sinteze si Utilizari; Printech: Bucharest, Romania, 2005; pp. 73–76. [Google Scholar]
- Malfara, W.R.; Bertucci, C.; Costa Queiroz, M.E.; Dreossi Carvalho, S.A.; Pires Bianchi Mde, L.; Cesarino, E.J.; Crippa, J.A.; Costa Queiroz, R.H. Reliable HPLC method for therapeutic drug monitoring of frequently prescribed tricyclic and nontricyclic antidepressants. J. Pharm. Biomed. Anal. 2007, 44, 955–962. [Google Scholar] [CrossRef] [PubMed]
- Dziurkowska, E.; Wesolowski, M. Isolation of Antidepressants and Their Metabolites from Saliva Using Supported Liquid Extraction (SLE). Biomedicines 2023, 11, 708. [Google Scholar] [CrossRef]
- Breaud, A.R.; Harlan, R.; Kozak, M.; Clarke, W. A rapid and reliable method for the quantitation of tricyclic antidepressants in serum using HPLC-MS/MS. Clin. Biochem. 2009, 42, 1300–1307. [Google Scholar] [CrossRef]
- Poklis, J.L.; Wolf, C.E.; Goldstein, A.; Wolfe, M.L.; Poklis, A. Detection and quantification of tricyclic antidepressants and other psychoactive drugs in urine by HPLC/MS/MS for pain management compliance testing. J. Clin. Lab. Anal. 2012, 26, 286–294. [Google Scholar] [CrossRef] [PubMed]
- Fisichella, M.; Morini, L.; Sempio, C.; Groppi, A. Validation of a multi-analyte LC-MS/MS method for screening and quantification of 87 psychoactive drugs and their metabolites in hair. Anal. Bioanal. Chem. 2014, 406, 3497–3506. [Google Scholar] [CrossRef]
- Racovita, R.C.; Ciuca, M.D.; Catana, D.; Comanescu, C.; Ciocirlan, O. Microemulsions of Nonionic Surfactant with Water and Various Homologous Esters: Preparation, Phase Transitions, Physical Property Measurements, and Application for Extraction of Tricyclic Antidepressant Drugs from Aqueous Media. Nanomaterials 2023, 13, 2311. [Google Scholar] [CrossRef] [PubMed]
- Guzinski, M.; Lindner, E.; Pendley, B.; Chaum, E. Electrochemical sensor for tricyclic antidepressants with low nanomolar detection limit: Quantitative Determination of Amitriptyline and Nortriptyline in blood. Talanta 2022, 239, 123072. [Google Scholar] [CrossRef]
- Madej, K.; Wozniakiewicz, M.; Karabinowska, K. Capillary electrophoresis screening method for six tricyclic antidepressants in human serum. Acta Pol. Pharm. Drug Res. 2012, 69, 1023–1029. [Google Scholar]
- Dell’Aquila, C. Separation of tricyclic antidepressants by capillary zone electrophoresis with N,N,N′,N′-tetramethyl-1,3-butanediamine (TMBD) as an effective electrolyte additive. J. Pharm. Biomed. Anal. 2002, 30, 341–350. [Google Scholar] [CrossRef]
- Rahman, N.; Sameen, S.; Kashif, M. Spectroscopic study of charge transfer complexation between doxepin and π–acceptors and its application in quantitative analysis. J. Mol. Liq. 2016, 222, 944–952. [Google Scholar] [CrossRef]
- Azmi, S.N.H.; Al-Masrouri, Z.N.; Al-Lamki, I.R.; Al-Jabri, A.K.; Rahman, N.; Nasir, M.; Abdelrahman, K.; Fnais, M.S.; Alam, M. Development and validation of spectrophotometric method for determination of imipramine hydrochloride in tablets (solid materials). J. King Saud Univ. Sci. 2022, 34, 101823. [Google Scholar] [CrossRef]
- Soni, P.; Sinha, D.; Patel, R. Simple, Rapid and Sensitive UV-Visible Spectrophotometric Method for Determination of Antidepressant Amitriptyline in Pharmaceutical Dosage Forms. J. Spectrosc. 2013, 2013, 1–5. [Google Scholar] [CrossRef]
- Kirova, G.K.; Velkova, Z.Y.; Delchev, V.B.; Gavazov, K.B. Vanadium-Containing Anionic Chelate for Spectrophotometric Determination of Hydroxyzine Hydrochloride in Pharmaceuticals. Molecules 2023, 28, 2484. [Google Scholar] [CrossRef]
- Gavazov, K.B.; Racheva, P.V.; Milcheva, N.P.; Divarova, V.V.; Kiradzhiyska, D.D.; Genc, F.; Saravanska, A.D. Use of a Hydrophobic Azo Dye for the Centrifuge-Less Cloud Point Extraction-Spectrophotometric Determination of Cobalt. Molecules 2022, 27, 4725. [Google Scholar] [CrossRef]
- Divarova, V.V.; Saravanska, A.; Toncheva, G.; Milcheva, N.; Delchev, V.B.; Gavazov, K. Spectrophotometric Determination of Molybdenum(VI) as a Ternary Complex with 4-Nitrocatechol and Benzalkonium Chloride. Molecules 2022, 27, 1217. [Google Scholar] [CrossRef]
- Gavazov, K.B.; Racheva, P.V.; Saravanska, A.D.; Toncheva, G.K.; Delchev, V.B. Extractive Spectrophotometric Determination and Theoretical Investigations of Two New Vanadium(V) Complexes. Molecules 2023, 28, 6723. [Google Scholar] [CrossRef]
- Shehab, O.R.; Mansour, A.M. Charge transfer complexes of 2-arylaminomethyl-1H-benzimidazole with 2,3-dichloro-5,6-dicyano-1,4-benzoquinone: Experimental and DFT studies. J. Mol. Struct. 2013, 1047, 121–135. [Google Scholar] [CrossRef]
- Rodrigues de Carvalho, F.; da Silva, F.; de Lima, R.; Correia Bellotto, A.; de Souza, V.R.; Caetano, W.; Politi, M.J.; Hioka, N.; Coutinho, K. Spectrophotometric studies of charge-transfer complexes formed with ions N,N’-alkyldiyl-bis(pyridinium) derivatives and iodide. Spectrochim. Acta A Mol. Biomol. Spectrosc. 2022, 268, 120664. [Google Scholar] [CrossRef] [PubMed]
- Niranjani, S.; Venkatachalam, K. Synthesis, spectroscopic, thermal, structural investigations and biological activity studies of charge-transfer complexes of atorvastatin calcium with dihydroxy-p-benzoquinone, quinalizarin and picric acid. J. Mol. Struct. 2020, 1219, 128564. [Google Scholar] [CrossRef]
- Meesala, G.; Syeda, A.H.; Varukolu, M.; Tigulla, P. The Charge Transfer Complex between 2, 3-diamino-5-bromopyridine and Chloranilic acid: Preparation, Spectroscopic Characterization, DNA binding, and DFT/PCM analysis. J. Indian Chem. Soc. 2022, 99, 100799. [Google Scholar] [CrossRef]
- Messiad, H.; Hamamdia, F.Z.; Belguidoum, K.; Lemouari, N.; Amira-Guebailia, H. Synthesis and spectroscopic characterization of charge transfer complexes of the donor hesperidin and π-acceptors; 2,3-dichloro-5,6-dicyano-1,4- benzoquinone and tetracyanoethylene. J. Mol. Struct. 2022, 1264, 133216. [Google Scholar] [CrossRef]
- Al-Hazmi, G.H.; Hassanien, A.M.; Atta, A.A.; Refat, M.S.; Saad, H.A.; Shakya, S.; Adam, A.M.A. Supramolecular charge-transfer complex generated by the interaction between tin(II) 2,3-naphtalocyanine as a donor with DDQ as an acceptor: Spectroscopic studies in solution state and theoretical calculations. J. Mol. Liq. 2022, 362, 119757. [Google Scholar] [CrossRef]
- AlRabiah, H.; Abdel-Aziz, H.A.; Mostafa, G.A.E. Charge transfer complexes of brucine with chloranilic acid, 2,3-dichloro-5,6-dicyano-1,4-benzoquinone and tetracyanoquinodimethane: Synthesis, spectroscopic characterization and antimicrobial activity. J. Mol. Liq. 2019, 286, 110754. [Google Scholar] [CrossRef]
- Mostafa, G.A.E.; Yousef, T.A.; ElGamal, A.A.; Homoda, A.M.A.; AlRabiah, H. Tamoxifen charge transfer complexes with 2,3-dichloro-5,6-dicyano-1,4-benzoquinone and 7,7,8,8-tetracyanoquinodimethan: Synthesis, spectroscopic characterization and theoretical study. Bioorg. Chem. 2022, 120, 105603. [Google Scholar] [CrossRef]
- Mihalache, M.; Oprea, O.; Vasile, B.Ş.; Guran, C.; Ardelean, I.L. Synthesis, Characterization and Biological Activity of Composite Combinations of Cu (II), Fe (III) and Mn (III) with A-Ketoglutaric Acid and 1-(O-Tolyl) Biguanide. Univ. Politeh. Buchar. Sci. Bull. Ser. B Chem. Mater. Sci. 2018, 80, 113–126. [Google Scholar]
- Alghanmi, R.M.; Al-Attas, A.S.; Habeeb, M.M. Spectrophotometric study of the charge transfer complex between 2-amino-4-picoline with chloranilic acid. J. Mol. Struct. 2013, 1034, 223–232. [Google Scholar] [CrossRef]
- Manojkumar, P.; Mahipal, V.; Suresh, G.; Venkatesh, N.; Ramesh, M.; Parthasarathy, T. Exploring Interaction Dynamics of Designed Organic Charge Transfer Complex of 6-Aminoindole and Chloranilic Acid: Spectrophotometric, Characterization, Computational, Antimicrobial, and DNA Binding Properties. J. Mol. Struct. 2022, 1258, 132666. [Google Scholar] [CrossRef]
- Ali, M.M.; Ali, M.; Gaballa, A.S.; El-Korashy, S.A.; Teleb, S.M. Preparation, spectroscopic, characterizations and biological studies of new charge transfer complexes formed between fluconazole drug with various acceptors. Bioorg. Chem. 2021, 115, 105190. [Google Scholar] [CrossRef] [PubMed]
- Job, P. Formation and Stability of Inorganic Complexes in Solution. Ann. Chim. 1928, 9, 113–203. [Google Scholar]
- Pandeeswaran, M.; Elango, K.P. Solvent effect on the charge transfer complex of oxatomide with 2,3-dichloro-5,6-dicyanobenzoquinone. Spectrochim. Acta A Mol. Biomol. Spectrosc. 2006, 65, 1148–1153. [Google Scholar] [CrossRef] [PubMed]
- Nampally, V.; Palnati, M.K.; Baindla, N.; Varukolu, M.; Gangadhari, S.; Tigulla, P. Charge Transfer Complex between O-Phenylenediamine and 2, 3-Dichloro-5, 6-Dicyano-1, 4-Benzoquinone: Synthesis, Spectrophotometric, Characterization, Computational Analysis, and its Biological Applications. ACS Omega 2022, 7, 16689–16704. [Google Scholar] [CrossRef]
- Aloisi, G.G.; Pignataro, S. Molecular complexes of substituted thiophens with σ and π acceptors. Charge transfer spectra and ionization potentials of the donors. J. Chem. Soc. Faraday Trans. 1 Phys. Chem. Condens. Phases 1973, 69, 534–539. [Google Scholar] [CrossRef]
- Sundarpal, V.; Kanth, B.S.; Rajitha, N.; Yadagiri, B. Synthesis, spectroscopic characterization, DNA binding and DFT/PCM calculations of new Hydrogen-bonded charge transfer complex between 4-dimethylaminopyridine and Chloranilic acid. Results Chem. 2023, 5, 100694. [Google Scholar] [CrossRef]
- Briegleb, G.; Czekalla, J. Intensity of electron transition bands in electron donator–acceptor complexes. Z. Physik. Chem. (Frankf.) 1960, 24, 37–54. [Google Scholar] [CrossRef]
- Abbu, V.; Nampally, V.; Baindla, N.; Tigulla, P. Stoichiometric, Thermodynamic and Computational DFT Analysis of Charge Transfer Complex of 1-Benzoylpiperazine with 2, 3-Dichloro-5, 6-Dicyano-1, 4-benzoquinone. J. Solut. Chem. 2019, 48, 61–81. [Google Scholar] [CrossRef]
- Shehab, O.R.; AlRabiah, H.; Abdel-Aziz, H.A.; Mostafa, G.A.E. Charge-transfer complexes of cefpodoxime proxetil with chloranilic acid and 2,3-dichloro-5,6-dicyano-1,4-benzoquinone: Experimental and theoretical studies. J. Mol. Liq. 2018, 257, 42–51. [Google Scholar] [CrossRef]
- Shetty, D.N.; Narayana, B.; Samshuddin, S. Sensitive methods for the spectrophotometric determinations of some antimalarial drugs. J. Chem. Pharm. Res. 2012, 4, 1647–1653. [Google Scholar]
- Misiuk, W.; Puzanowska-Tarasiewicz, H. Spectrophotometric Determination of Some Antidepressant Drugs. Anal. Lett. 2002, 35, 1163–1170. [Google Scholar] [CrossRef]
- Soni, P.; Sar, S.K.; Patel, R. New Approach for the Determination of Tricyclic Antidepressant Amitriptyline Using beta-Cyclodextrin-PEG System via Spectrophotomerty. J. Anal. Sci. Methods Instrum. 2012, 2, 103–107. [Google Scholar] [CrossRef][Green Version]
- Susmitha, K.; Thirumalachary, M.; Vinod Kumar, T.; Venkateshwarlu, G. Spectrophotometric determination of imipramine HCl in pure and pharmaceutical forms. Der Pharma Chem. 2013, 5, 271–279. [Google Scholar]
- Al-Badr, A.; Mostafa, G.A.H. Spectrophotometric Determination of Trimipramine in Tablet Dosage Form via Charge Transfer Complex Formation. Trop. J. Pharm. Res. 2014, 12, 1057. [Google Scholar] [CrossRef]
- Ali, E.A.; Adawy, A.M.; El-Shahat, M.F.; Amin, A.S. Simple spectrophotometric methods for determination of fluoxetine and clomipramine hydrochlorides in dosage forms and in some post-mortem biological fluids samples. Egypt. J. Forensic Sci. 2016, 6, 370–380. [Google Scholar] [CrossRef]
- Mohamed, H.; Hassan, H.Y.; Mohamed, A.-M.I.; Hussein, S.A. Spectrophotometric Determination of Some Dibenzazepines. Anal. Lett. 1992, 25, 63–71. [Google Scholar] [CrossRef]
- Aman, T.; Kazi, A.A.; Hussain, M.I.; Firdous, S.; Khan, I.U. Spectrophotometry Determination of Amitriptyline-HCl in Pure and Pharmaceutical Preparations. Anal. Lett. 2000, 33, 2477–2490. [Google Scholar] [CrossRef]
- Starczewska, B.; Puzanowska-Tarasiewicz, H. Spectrophotometric Determination of Trimipramine Using Cerium(IV) Sulphate(VI) and Potassium Iodate(VII). Anal. Lett. 1998, 31, 809–818. [Google Scholar] [CrossRef]
- Hussein, S.A.; El-Kommos, M.E.; Hassan, H.Y.; Mohamed, A.-M.I. Spectrophotometric determination of some dibenzazepine drugs by electrophilic coupling. Talanta 1989, 36, 941–944. [Google Scholar] [CrossRef]
- Syeda, A.; Mahesh, H.R.; Syed, A.A. 2,2’-Bipyridine as a new and sensitive spectrophotometric reagent for the determination of nanoamounts of certain dibenzazepine class of tricyclic antidepressant drugs. Farmaco 2005, 60, 47–51. [Google Scholar] [CrossRef]
- Saif, M.J.; Anwar, J.; Nawaz, G. New sensitive spectrophotometric method for the determination of clomipramine-HCl in pure form and pharmaceutical preparations. J. Anal. Chem. 2014, 69, 509–512. [Google Scholar] [CrossRef]
- Nagaraja, P.; Silwadi, M.F.; Syed, A.A. Sensitive Spectrophotometric Determination of Some Dibenzazepine Drugs with Diazotized P-Phenylenediamine Dihydrochloride. Anal. Lett. 2000, 33, 2913–2926. [Google Scholar] [CrossRef]
- Deepakumari, H.N.; Prashanth, M.K.; Kumar, B.C.V.; Revanasiddappa, H.D. Highly Sensitive and Validated Spectrophotometric Technique for the Assay of Some Antidepressant Drugs. J. Appl. Spectrosc. 2015, 81, 1004–1011. [Google Scholar] [CrossRef]
- Deepakumari, H.N.; Prashanth, M.K.; Revanasiddappa, H.D. Antidepressant Drugs: Highly Sensitive and Validated Spectrophotometric Technique. J. Chil. Chem. Soc. 2014, 59, 2382–2388. [Google Scholar] [CrossRef]
- Mohamed, G.G.; Nour El-Dien, F.A.; Khalil, S.M.; Mohamed, N.A. Spectrophotometric determination of trazodone, amineptine and amitriptyline hydrochlorides through ion-pair formation with molybdenum and thiocyanate. Spectrochim. Acta A Mol. Biomol. Spectrosc. 2006, 65, 1221–1226. [Google Scholar] [CrossRef] [PubMed]


| TCA | ε, L mol−1 cm−1 | K, L mol−1 | f | µ, Debyes | Ip, eV | RN, eV | ΔG°, kJ mol−1 |
|---|---|---|---|---|---|---|---|
| AMI | 1211.5 | 10,108.47 | 0.43 | 6.92 | 8.64 | 0.035 | −22.86 |
| IMI | 1218.2 | 10,669.97 | 0.43 | 6.92 | 0.035 | −22.99 | |
| CLO | 1250.7 | 9209.99 | 0.44 | 7.01 | 0.036 | −28.63 | |
| TRI | 1375.2 | 3108.26 | 0.49 | 7.35 | 0.039 | −19.93 | |
| AMI | 3800.7 | 41,929.36 | 0.78 | 9.79 | 8.37 | 0.090 | −26.38 |
| IMI | 3622.5 | 211,733.40 | 0.74 | 9.56 | 0.086 | −30.40 | |
| CLO | 3721.9 | 84,317.50 | 0.76 | 9.69 | 0.089 | −28.12 | |
| TRI | 3952.4 | 65,812.46 | 0.81 | 9.98 | 0.093 | −27.50 |
| Parameters | AMI | IMI | CLO | TRI |
|---|---|---|---|---|
| TCA-pCA | ||||
| λmax, nm | 530 | 530 | 530 | 530 |
| Linear range, µg∙mL−1 | 5–420 | 5–420 | 5–420 | 5–420 |
| R2 | 0.9971 | 0.9966 | 0.9985 | 0.9953 |
| Slope S, mL∙µg−1 | 0.0039 | 0.0038 | 0.0036 | 0.0033 |
| Sandell’s sensitivity, µg∙cm−2 | 0.2591 | 0.2601 | 0.2809 | 0.2985 |
| LOD, µg∙mL−1 | 0.83 | 0.85 | 0.90 | 0.98 |
| LOQ, µg∙mL−1 | 2.52 | 2.58 | 2.73 | 2.97 |
| TCA-DDQ | ||||
| λmax, nm | 585 | 585 | 585 | 585 |
| Linear range, µg∙mL−1 | 5–100 | 5–120 | 5–80 | 5–140 |
| R2 | 0.9946 | 0.9928 | 0.9981 | 0.9915 |
| Slope S, mL∙µg−1 | 0.0121 | 0.0114 | 0.0106 | 0.0096 |
| Sandell’s sensitivity, µg∙cm−2 | 0.0826 | 0.0875 | 0.0944 | 0.1039 |
| LOD, µg∙mL−1 | 0.39 | 0.41 | 0.44 | 0.19 |
| LOQ, µg∙mL−1 | 1.18 | 1.28 | 1.34 | 1.48 |
| TCA | Concentration, mg/L | Intra-Day (n = 7) Recovery ± RSD, % | Inter-Day (n = 5) Recovery ± RSD, % |
|---|---|---|---|
| TCA-pCA | |||
| AMI | 5 | 99.85 ± 0.70 | 99.78 ± 0.82 |
| 210 | 99.93 ± 0.25 | 99.89 ± 0.35 | |
| 420 | 99.96 ± 0.18 | 99.91 ± 0.43 | |
| IMI | 5 | 99.94 ±0.85 | 99.97 ± 0.41 |
| 210 | 99.98 ± 0.15 | 99.87 ±0.35 | |
| 420 | 99.97 ± 0.52 | 99.82 ±0.73 | |
| CLO | 5 | 99.13 ± 0.81 | 99.18 ± 0.61 |
| 210 | 99.27 ± 0.64 | 99.01 ± 0.95 | |
| 420 | 99.63 ± 0.93 | 99.72 ± 0.87 | |
| TRI | 5 | 99.90 ± 0.33 | 99.32 ± 0.39 |
| 210 | 99.83 ± 0.67 | 99.02 ± 0.81 | |
| 420 | 99.87 ± 0.78 | 98.99 ± 0.98 | |
| TCA-DDQ | |||
| AMI | 5 | 100.02 ± 0.38 | 99.18 ± 0.95 |
| 50 | 99.75 ± 0.57 | 99.23 ± 1.02 | |
| 100 | 99.88 ± 0.39 | 99.61 ± 0.99 | |
| IMI | 5 | 99.81 ± 0.43 | 99.56 ± 1.13 |
| 60 | 99.16 ± 0.87 | 99.40 ± 1.65 | |
| 120 | 99.03 ± 0.99 | 99.71 ± 0.72 | |
| CLO | 5 | 98.39 ± 0.72 | 99.01 ± 1.34 |
| 40 | 99.09 ± 0.93 | 99.23 ± 1.72 | |
| 80 | 99.13 ± 0.55 | 99.41 ± 1.06 | |
| TRI | 5 | 98.77 ± 1.12 | 98.32 ± 1.21 |
| 80 | 99.19 ± 1.28 | 99.05 ± 1.04 | |
| 160 | 98.36 ± 0.93 | 99.12 ± 0.97 | |
| Commercial Form | Active Substance | Amount Expected, mg/Dosage Form | Amount Found ± SD, mg/Dosage Form | Recovery ± RSD, % |
|---|---|---|---|---|
| TCA-pCA | ||||
| Commercial form 1 | AMI | 25.00 | 24.95 ± 0.08 | 99.80 ± 0.32 |
| Commercial form 2 | IMI | 10.00 | 9.91 ± 0.02 | 99.12 ± 0.19 |
| Commercial form 3 | CLO | 25.00 | 24.94 ± 0.16 | 99.77 ± 0.64 |
| Commercial form 4 | TRI | 40.00 | 39.17 ± 0.08 | 97.93 ± 0.21 |
| TCA-DDQ | ||||
| Commercial form 1 | AMI | 25.00 | 24.98 ± 0.35 | 99.92 ± 1.40 |
| Commercial form 2 | IMI | 10.00 | 9.97 ± 0.05 | 99.70 ± 0.50 |
| Commercial form 3 | CLO | 25.00 | 24.89 ± 0.27 | 99.56 ± 1.08 |
| Commercial form 4 | TRI | 40.00 | 40.03 ± 0.04 | 100.07 ± 0.16 |
| Commercial Form | Active Substance | Amount of Active Substance Declared, mg/Dosage Form | Excipients |
|---|---|---|---|
| Commercial form 1 | AMI | 25.00 | Film: hypromellose, hydroxypropyl cellulose, talcum, lactose, stearic acid, titanium dioxide, carmoisine aluminum lake 20–26%, quinoline yellow aluminum lake 20–24% Core: lactose, polyvinylpyrrolidone K30, starch, talcum, magnesium stearate |
| Commercial form 2 | IMI | 10.00 | Film: hypromellose, pyrrolidone-vinyl acetate copolymer, microcrystalline cellulose, macrogol 8000, polyvinylpyrrolidone K30, talcum, sucrose, titanium dioxide, red iron oxide dispersed in titanium dioxide 30/70 Core: anhydrous colloidal silica, anhydrous glycerol, lactose, magnesium stearate, starch, talcum, stearic acid |
| Commercial form 3 | CLO | 25.00 | Film: hypromellose 2910, pyrrolidone-vinyl acetate copolymer, talcum, sucrose, macrogol 8000, polyvinylpyrrolidone, yellow iron oxide, titanium dioxide Core: lactose, glycerol 85%, magnesium stearate, starch, silica, talcum, stearic acid |
| Commercial form 4 | TRI | 40.00 | Film: hypromellose, pyrrolidone-vinyl acetate copolymer, talcum, sucrose, macrogol 400, polyvinylpyrrolidone, yellow iron oxide, titanium dioxide Core: lactose, glycerol, calcium hydrogen phosphate, magnesium stearate, starch, silica, talcum, stearic acid |
Disclaimer/Publisher’s Note: The statements, opinions and data contained in all publications are solely those of the individual author(s) and contributor(s) and not of MDPI and/or the editor(s). MDPI and/or the editor(s) disclaim responsibility for any injury to people or property resulting from any ideas, methods, instructions or products referred to in the content. |
© 2023 by the authors. Licensee MDPI, Basel, Switzerland. This article is an open access article distributed under the terms and conditions of the Creative Commons Attribution (CC BY) license (https://creativecommons.org/licenses/by/4.0/).
Share and Cite
Ciuca, M.D.; Racovita, R.C. Development of Visible Spectrophotometric Methods for the Determination of Tricyclic Antidepressants Based on Formation of Molecular Complexes with p-Benzoquinones. Int. J. Mol. Sci. 2023, 24, 16744. https://doi.org/10.3390/ijms242316744
Ciuca MD, Racovita RC. Development of Visible Spectrophotometric Methods for the Determination of Tricyclic Antidepressants Based on Formation of Molecular Complexes with p-Benzoquinones. International Journal of Molecular Sciences. 2023; 24(23):16744. https://doi.org/10.3390/ijms242316744
Chicago/Turabian StyleCiuca, Maria D., and Radu C. Racovita. 2023. "Development of Visible Spectrophotometric Methods for the Determination of Tricyclic Antidepressants Based on Formation of Molecular Complexes with p-Benzoquinones" International Journal of Molecular Sciences 24, no. 23: 16744. https://doi.org/10.3390/ijms242316744
APA StyleCiuca, M. D., & Racovita, R. C. (2023). Development of Visible Spectrophotometric Methods for the Determination of Tricyclic Antidepressants Based on Formation of Molecular Complexes with p-Benzoquinones. International Journal of Molecular Sciences, 24(23), 16744. https://doi.org/10.3390/ijms242316744