Abstract
The interleukin-1 gene cluster encodes cytokines, which modulate mesangial cell proliferation and matrix expansion, both constituting central factors in the development and progression of immunoglobulin A nephropathy (IgAN). A candidate-gene study was performed to examine the association of polymorphisms of the interleukin-1 gene cluster with the risk of progressive IgAN. To gain deeper insights into the involvement of interleukin genes in IgAN, a meta-analysis of genetic association studies (GAS) that examine the association between interleukin variants and IgAN was conducted. Association study: The case-control study consisted of 121 unrelated Caucasians with sporadic, histologically diagnosed IgAN and of 246 age- and sex-matched healthy controls. Persistent proteinuria (>2 g/24 h) and/or impaired kidney function (serum creatinine > 1.5 mg/dL) defined progressive (n = 67) vs. non-progressive (n = 54) IgAN cases. Genotypes were assessed for two promoter-region single-nucleotide polymorphisms, C-899T (rs1800587) in IL1A and C-511T (rs16944) in IL1B, and for one penta-allelic variable-length tandem repeat polymorphism (VNTR 86 bp intron 2) in IL1RN. The association of these variants with the susceptibility of IgAN and the development of progressive IgAN (healthy status, IgAN, progressive IgAN) was tested using the generalized odds ratio (ORG) metric. Linkage disequilibrium and haplotype analysis were also performed. Meta-analysis: We included in the meta-analysis 15 studies investigating association between 14 interleukin variants harbored in eight different genes and IgAN. The ORG was used to evaluate the association between interleukin variants and IgAN using random effects models. The present case-control study revealed association of IL1B C-511T (rs16944) with the progression of IgAN (p = 0.041; ORG = 2.11 (1.09–4.07)). On haplotype analysis, significant results were derived for the haplotypes C-C-1 (p = 0.005; OR = 0.456 (0.261~0.797)) and C-T-2 (p = 0.003; OR = 4.208 (1.545–11.50)). Regarding association and meta-analysis results, variants in IL1B (rs1143627 and rs16944), IL1RN (rs928940, rs439154, and rs315951) and IL10 (rs1800871) were associated with IgAN based on either genotype or allele counts. Genetic variants and haplotypes in the IL1B, IL1RN, and IL10 genes might contribute to an increased risk for development and progression of IgAN.
1. Introduction
Immunoglobulin A nephropathy (IgAN) is one of the leading causes of end-stage renal disease in developed countries [,]. The clinical presentation of IgAN can vary greatly, encompassing a wide spectrum of manifestations. These can range from no apparent symptoms, such as the presence of asymptomatic hematuria and proteinuria, to gross hematuria accompanied by a rapid decline in kidney function []. Renal biopsy is considered the gold standard for diagnosis of IgAN. The typical observations through immunofluorescence microscopy in IgAN primarily involve the presence of IgA deposits within the mesangial region. These deposits are frequently accompanied by IgM, IgG, or complement C3 components []. In the pathophysiology of IgAN a crucial role has been shown for inflammatory cytokines including interleukin-1 (IL-1), a potent mediator with a central role in the inflammatory cascade [].
Interleukin-1 is involved in mesangial cell proliferation and extracellular matrix production in various glomerulopathies [,]. In cases with IgAN, there is significant glomerular interleukin-1 expression [], which may be linked to mesangial cell activation [] in response to nephritogenic immune complexes. Interleukin-1 may act as an autocrine growth factor, enhancing mesangial cell proliferation []. Moreover, experimental evidence suggests that in IgAN, interleukin 1 released by mesangial cells could potentially play a role in the development of tubular damage and interstitial fibrosis [,,], both of which are closely associated with the progression of the disease []. There are findings that indicate an association between the IL1B and IL1RN genes and heightened vulnerability to IgAN in children []. Additionally, a connection between the emergence of proteinuria in IgAN and IL1A has been postulated, while IL1B is linked to podocyte foot process effacement []. IL-1β has been showed to participate in human and experimental human diseases [,,]. The activity of interleukin-1 (IL-1) in the urine has been also observed to be elevated in individuals with IgAN and Henoch–Schönlein nephritis (HSN) compared to those in a healthy control group []. The urinary levels of IL-1ra in IgAN patients were also found to be lower when compared to both healthy controls and HSN patients []. This discovery suggests a potential distinction in the underlying causes of these two diseases. In addition, it has been shown that the pro-inflammatory cytokine IL-1 is elevated in individuals undergoing maintenance hemodialysis (MHD), a population characterized by persistent inflammation, and is linked to heightened mortality rates []. The introduction of IL-1ra to patients undergoing maintenance hemodialysis (MHD) has been reported to be able to decrease markers associated with inflammation [].
Ιt is reasonable, therefore, to propose that the interleukin 1 gene cluster might have a role in the development and progression of IgA nephropathy. In the present candidate-gene study we determined the genotypes for two single-nucleotide polymorphisms, C-899T in the interleukin-1α gene (IL1A; rs1800587) and C-511T in the interleukin-1β gene (IL1B; rs16944), and for one penta-allelic polymorphism with variable numbers of an 86 bp tandem repeat (VNTR *1–*5) in intron 2 of the interleukin-1 receptor antagonist gene (IL1RN) in a homogeneous population of Caucasian origin (Greeks). We then estimated the association between these interleukin-1 gene cluster variants and the risk for development and progression of IgAN (from healthy status, to IgAN and, finally, to progressive IgA nephropathy). This association was calculated by the generalized odds ratio (ORG) as a genetic model-free approach [,]. We also conducted an analysis of haplotypes.
To further investigate the role of interleukins in the development and progression of IgA nephropathy, we searched in the literature for all available genetic association studies (GAS) which test the association between interleukin variants and IgAN and synthesized the results with meta-analysis.
2. Results
2.1. Association Analysis
2.1.1. Clinical Profile of Participants
The study cohort consisted of 121 patients with histologically diagnosed IgAN and of 246 age- and sex-matched healthy controls. All participants were unrelated Caucasians of Greek origin. According to the predefined criteria of progressive IgA nephropathy, i.e., persistent proteinuria (>2 g/24 h) and/or impaired kidney function (serum creatinine > 1.5 mg/dL), 67 participants were categorized as progressive (cases) and 54 participants as non-progressive (diseased controls) IgA nephropathy.
Table 1 includes the demographic and clinical profiles of all participants. Among cases with progressive IgAN, 22.4% (n = 15) were patients with end-stage kidney disease (ESRD), 17.9% (n = 12) who were under chronic renal replacement therapy, and 4.5% (n = 3) with a kidney transplant. The distribution of age was as follows: 74.6% of progressive cases (n = 50), 87% of diseased controls (n = 47), and 84.6% of healthy controls (n = 208) were above 60 years old. In 51.2% of progressive cases and 51.9% of diseased controls, the duration of IgAN was more than 5 years.

Table 1.
Demographic and clinical characteristics of the participants in the case-control study on the risk of IgA nephropathy. p values provided for intergroup comparisons, i.e., between cases (progressive IgA nephropathy) and diseased controls (non-progressive IgA nephropathy), were calculated by the Mann–Whitney U test for continuous variables and by the χ2 test for categorical variables.
Exclusion of patients with ESRD (n = 15) partially changed the clinical profile of cases with progressive IgAN. However, between these cases and the diseased controls there was still no significant difference in disease duration (5.2 ± 4.0 vs. 5.7 ± 4.3 years; p = 0.565). After exclusion of patients with ESRD, frequency of macroscopic hematuria was significantly lower in cases with progressive IgAN than in diseased controls (5.3 vs. 11.9%; OR = 0.239 (0.063–0.915)).
2.1.2. Development of Progressive IgA Nephropathy
The genotype distribution of the three variants of the interleukin-1 gene cluster in cases (progressive IgA nephropathy), diseased controls (non-progressive IgA nephropathy), and healthy controls, as well as the respective ORG, are shown in Table 2. The healthy controls conformed to the HWE for all variants (p ≥ 0.05).
Table 2.
Distribution of genotypes of IL1 gene cluster among cases (progressive IgA nephropathy), disease (non-progressive IgA nephropathy), and healthy control subjects.
There was no significant association between genotype distribution of these variants in comparison of healthy controls versus diseased controls versus cases (Table 2) or in comparison of cases versus healthy controls (p ≥ 0.05) (Table 3). However, there was significant association between IL-1B C-511T (rs16944) polymorphism and disease progression (p = 0.041). The model-free approach (ORG) produced significant results for the IL-1B C-511T (rs16944) variant, indicating that the variant mutational load plays a significant role in the development of progressive IgAN (Table 4).
Table 3.
Distribution of genotypes of IL1 gene cluster among cases (progressive and non-progressive IgA nephropathy) and healthy control subjects.
Table 4.
Distribution of genotypes of IL1 gene cluster among cases (progressive IgA nephropathy) and diseased control subjects (non-progressive IgA nephropathy).
2.1.3. Linkage Disequilibrium Analysis
Table 5 shows the results of the linkage disequilibrium (LD) test between pairs of the interleukin-1 gene cluster variants. All variant pairs were in LD (p < 0.05) in both populations (cases and diseased controls), except for the variants rs1800587 C-899T in IL1A and the penta-allelic variant VNTR (86 bp intron 2) in IL1RN in diseased controls.
Table 5.
Results of linkage disequilibrium (LD) test between pairs of polymorphisms for cases with progressive IgAN and diseased controls with non-progressive IgAN (in brackets).
2.1.4. Analysis of Haplotypes
The distribution of the estimated haplotype frequencies of the three interleukin-1 gene cluster variants (rs1800587 C-899T in IL1A, rs16944 C-511T in IL1B, and VNTR 86 bp in IL1RN) for cases with progressive IgAN and diseased controls is summarized in Table 6. The overall difference between progressive cases and diseased controls is significant (p = 0.003). In the analysis of the individual haplotypes (rs1800587 C/T IL1A, rs16944 C/T IL1B, 86 bp VNTR 1–5 IL1RN), significant results were derived for the haplotypes C-C-1 (p = 0.005; OR = 0.456 (0.261~0.797)) and C-T-2 (p = 0.003; OR = 4.208 (1.545–11.50)). The haplotype C-C-1 may be protective for progressive IgAN, as the allele T of rs16944 C/T in IL1B, which was shown to increase the risk of progressive IgAN, is missing in the haplotype. In contrast, haplotype C-T-2, which includes the risk allele T in IL1B, may increase the risk of progressive IgAN.
Table 6.
Estimated haplotype frequencies for the three IL1 cluster gene polymorphisms (rs1800587, C-899T in IL1A; rs16944, C-511T in IL1B; and the 86 bp tandem repeat, VNTR *1–*5 in IL1RN) in patients with progressive IgAN and in patients with non-progressive IgAN.
AMOVA analysis showed that there was no subdivision between cases and controls (Fst = 0.00).
2.2. Meta-Analysis
Study Characteristics
Research was carried out in diverse population groups with varying racial backgrounds, encompassing 11 studies involving Asian participants and 4 studies involving individuals of Caucasian descent. Figure 1 displays a flowchart illustrating the retrieved articles, along with those excluded and the reasons for their exclusion. Detailed information regarding the characteristics of each study included in the analysis can be found in Table 7.
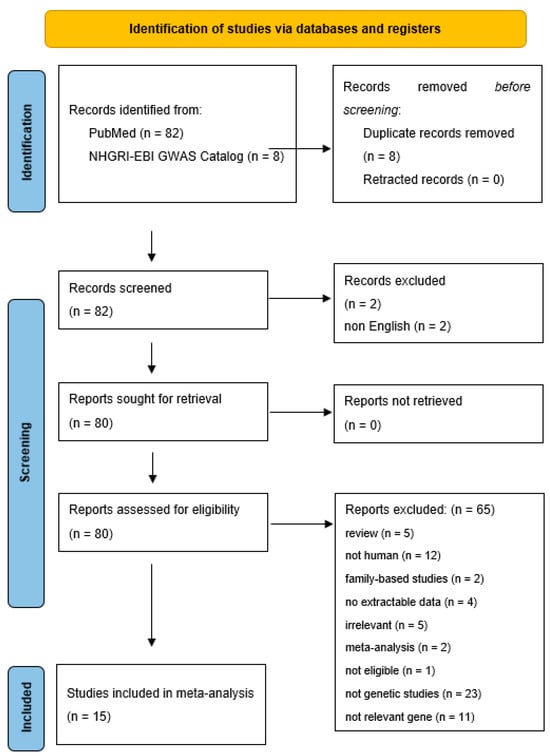
Figure 1.
Flow chart showing how studies were selected for meta-analysis.
Table 7.
Study characteristics.
Among the 8 different interleukin genes for which there are available data, 14 genetic variants were examined for association with IgAN. Table 8 shows the results of both meta-analyses and analyses of single studies based on genotype counts, whereas Table 9 shows the results of both meta-analyses and analyses of single studies based on allele counts.
Table 8.
Results regarding genotype counts.
Table 9.
Results regarding allele counts.
Regarding analyses based on genotype counts, four variants provided significant results in analyses of single studies and one variant was revealed significant in meta-analysis. More specifically, C-819T (rs1800871) in IL10 was significant in meta-analysis with a poοled ORG of 0.79 (95% CI 0.64–0.97), whereas rs1143627 in IL1B (ORG = 1.44 (95% CI 1.08–1.93)0 and rs928940, rs439154, and rs315951 in IL1RN were significant in analyses of single studies [(ORG = 0.72 (95% CI 0.54–0.97), ORG = 0.68 (95% CI 0.50–0.92), and ORG = 0.73 (95% CI 0.55–0.98), respectively)] (Table 8). In analyses based on allele counts, significant association were reported for C-511T in IL-1B with a pooled ORG of 1.35 (95% CI 1.05–1.75) (Table 9).
3. Discussion
The present study had two objectives. Firstly, it investigated whether certain variants of the interleukin-1 gene cluster, C-899T (rs1800587) in IL1A, C-511T (rs16944) in IL1B, and variable-length tandem repeat polymorphism (VNTR 86 bp 1–5) in IL1RN, are associated with the development and progression of IgAN, and afterwards, it synthesizes the available evidence about the involvement of interleukin variants in the development and progression of IgAN. According to the findings of our case-control study, C-511T (rs16944) in IL1B is implicated in progression of the disease. According to the findings of association and meta-analysis results, variants in IL1B (rs1143627 and rs16944), IL1RN (rs928940, rs439154, and rs315951) and IL10 (rs1800871) were associated with IgAN based on either genotype or allele counts. The contribution of the IL-1B gene was also confirmed by another systematic review and meta-analysis, although the aforementioned study revealed significance for another variant (rs1143627) in the IL-1B gene [].
Our study had several strengths. In examining the association between the above variants and progressive IgAN, we selected as a control group a population of diseased controls, i.e., subjects with non-progressive IgAN. This selection took place according to strict and well-defined criteria, i.e., persistent proteinuria (>2 g/24 h) and/or impaired kidney function (serum creatinine > 1.5 mg/dL), in order to clearly separate cases with progressive IgAN from diseased controls []. However, even IgAN with mild histological lesions—presenting with hematuria, only mild proteinuria, and normal renal function—might progress in about 30% of cases to severe kidney disease [,,]. In this context, one third of the diseased control group (i.e., with non-progressive IgAN) is always a candidate to become a future case, i.e., a patient with progressive disease.
In order to categorize a given patient before inclusion in the study, laboratory data were collected on at least two separate occasions, three months apart from one another. However, in IgAN, a glomerulopathy with a characteristic chronic course, these data represent only a snap-shot of the disease status []. Finally, the key for a really strict categorization of patients with IgA nephropathy, having progressive or non-progressive disease, is a long-term follow-up.
In addition, the clinical practice in Europe includes renal biopsy only in patients with a more severe or progressive disease [,]. This fact means that the performance of a kidney biopsy is a priori favoring progressive disease and that histological diagnosis of IgAN is a serious selection bias. More specifically, every patient with IgAN who has undergone a renal biopsy potentially has progressive disease. Vice versa, a patient with microscopic hematuria, who has not undergone kidney biopsy, likely has a non-progressive disease. For these reasons, the diseased control group in our study certainly included only part of the whole spectrum of non-progressive IgAN. In the general population, the prevalence of mesangial IgA deposition and renal histology consistent with IgAN ranges from 3 to 16% [,].
The genotype distributions of the examined variants conformed to the HWE in the healthy control group, indicating lack of population stratification and genotyping mistakes []. The HWE asserts that, in the absence of disruptive factors, the genetic diversity within a population will remain stable across successive generations. Haplotype analyses revealed that two haplotypes are implicated in the susceptibility state “progressive” IgAN.
Another strength in our study was about the metric used to assess significance. We employed the generalized odds ratio (ORG) as a means to assess the magnitude of the association. This particular metric effectively addresses the challenge posed by multiple comparisons across various genetic models, including dominant, recessive, additive, co-dominant, and allele-contrast models. It accomplishes this by utilizing the complete genotypic data, thereby avoiding any ambiguity that may arise when multiple genetic models demonstrate significance. Consequently, the interpretation of the findings becomes more straightforward and robust. Furthermore, it eliminates the need for a predetermined selection of a specific genetic model. It is worth noting that this metric has been successfully applied in diverse research contexts, including studies related to conditions like diabetic nephropathy, IgAN, and chronic kidney disease [,,,,,,].
However, our study also had some limitations. Despite finding some noteworthy associations, the sample size was relatively small, which is a common occurrence in candidate-gene association studies []. It is evident that a single institution cannot provide a sufficient number of patients to establish associations, especially if they truly exist. Therefore, future collaborative studies that pool data may offer more statistical power to detect significant associations []. Additionally, in the future, conducting meta-analyses of multiple studies could overcome the limitations of low statistical power and provide more conclusive evidence regarding the involvement of the interleukin 1 gene cluster in the progression of IgAN. Nevertheless, it is important to replicate the current findings in other gene-candidate or genome-wide association studies (GWAS) to validate their accuracy []. With the present meta-analyses, it is advisable to exercise caution when interpreting the findings, given the limited number of studies included in each meta-analysis. Last, but not least, applying the von Hippel correction for the I2 statistic due to the very small number of studies could offer a new perspective [].
The progression of IgAN is a complex and multifactorial process influenced by epistatic and gene–environment interactions. Consequently, relying solely on single types of genetic studies, like gene-candidate association studies, may not yield definitive conclusions. To gain more conclusive evidence on the significance of the interleukin 1 gene cluster as predictors for progressive IgAN, a combination of hypothesis-driven and hypothesis-free studies is recommended. Hypothesis-driven studies, such as gene-candidate association studies, can be complemented by hypothesis-free studies like GWAS and microarrays gene expression analyses [,]. Integrating the findings from these different types of studies may provide a more comprehensive understanding of the disease’s genetic factors. GWAS, with their ability to unravel genetic complexity, hold promise in identifying significant genetic factors. However, replication of GWAS findings by different investigators and using different methodologies, including gene-candidate association studies, becomes crucial to interpreting the numerous associations that may arise from GWAS. While GWAS are valuable, gene-candidate association studies can support existing evidence and reveal genuine genetic effects that should be prioritized in future investigations. Thus, combining these different approaches can enhance our understanding of the genetic basis of progressive IgAN.
4. Materials and Methods
4.1. Association Study
4.1.1. Participants
The study protocol was approved by the Ethics Committee of the University Hospital of Larissa, School of Medicine, University of Thessaly. All participants were recruited from patients at the University Hospital of Larissa, Greece. All patients attended the outpatient wards of nephrology between January 2019 and October 2019; only Caucasians of Greek origin were recruited after signing an informed-consent form.
The study cohort comprised three groups: cases with progressive IgAN, diseased controls (non-progressive IgAN), and healthy controls. Healthy controls were carefully matched to cases in terms of age and sex. Diagnosis was established based on histological findings from kidney biopsies [,]. The duration of IgAN was measured as the time elapsed (in years) from the date of kidney biopsy to the date of study inclusion. Progressive IgAN was defined by the presence of urinary protein excretion exceeding 2000 mg/24 h, indicative of overt proteinuria, with or without elevated serum creatinine levels (serum creatinine > 1.5 mg/dL). This definition was based on routine examinations conducted on at least two separate occasions, spaced three months apart, before the participant’s inclusion in the study. Infection was ruled out through prior urine dipstick testing. Additionally, the existence of arterial hypertension or cardiovascular disease, as well as recordings of arterial blood pressure (including systolic, diastolic, and mean arterial blood pressure), were noted for each participant []. Blood samples were collected from all individuals for biochemical measurements and DNA extraction.
4.1.2. Genotyping
Genomic DNA was extracted from peripheral blood using a salting-out method. Genomic DNA was resuspended in 10 mM Tris-HCl and 1 mM ethylenediaminetetraacetic acid (EDTA), pH 8.0, and the concentration was measured by spectrophotometry. Enzymatic amplification of DNA was performed by polymerase chain reaction (PCR) and the genotyped variants were located on chromosome 2q14 on each one of the following interleukin-1 cluster genes: IL1A (spanning 112,773,915 to 112,785,394, overall 11,480 Kbp), IL1B (spanning 112,829,751 to 112,836,779, overall 7029 Kbp), and IL1RN (spanning 113,099,365 to 113,134,016, overall 35,652 Kbp).
The regions of the Nco1 polymorphic site at position −899 in the promoter region of the IL1A, of the AvaI polymorphic site at position −511 in the promoter region of IL1B and of the VNTR polymorphism within intron 2 of IL1RN were amplified according to previously described methods [,]. IL1A primers, sense 5′-TGTTCTACCACCTGAACTAGGC-3′ and antisense 5′-TTACATATGAGCCTTCCATG-3′, were used to amplify the PCR product including the C-889T polymorphism []. IL1B primers, sense 5′-TGGCATTGATCTGGTTCATC-3′ and antisense 5′-GTTTAGGAATCTTCCCACTT-3′, were used for the IL1B C-511T polymorphism [].
The IL1RN primers, sense 5′-CTCAGCAACACTCCTAT-3′ and IL1RN antisense 5′-TCCTGGTCTGCAGGTAA-3′, were used to amplify the region within intron 2 of the IL1RN that encompasses the VNTR 86 bp polymorphism []. The PCR products were visualized by ethidium bromide staining on a 2% agarose gel. A band of 410 bp (four repeats of the 86 bp region) was classified as allele 1, a band of 240 bp (two repeats of 86 bp region) as allele 2, a band of 500 bp (five repeats of 86 bp region) as allele 3, a band of 325 bp (three repeats of 86 bp region) as allele 4, and a band of 595 bp (six repeats of 86 bp region) as allele 5 []. Alleles were categorized as L (including the long alleles 1, 3, 4, and 5) and 2 (the shorter allele 2). The respective genotypes were IL1RN L/L (long alleles), IL1RN L/2 (heterozygotes), and IL1RN 2/2 (allele 2 homozygotes).
4.1.3. Data Analysis
Continuous variables were represented using mean values and standard deviations (mean ± SD), while categorical variables were presented as counts (or ratios) and percentages (n (%)). The normality of continuous variables was assessed using the Kolmogorov–Smirnov test. Pair-wise comparisons of continuous variables were conducted using the t-test or the Mann–Whitney U test for unpaired data, depending on the appropriateness. The frequencies of categorical variables were compared using either the χ2 test or Fisher’s exact test.
The study investigated the relationship between genotype distribution and disease progression, specifically the progression to IgA nephropathy, using the generalized linear odds ratio (ORG) [,]. The ORG measures the likelihood of a subject being more diseased compared to less diseased, based on the higher mutational load in more diseased subjects relative to less diseased subjects [,]. Furthermore, the association between genotype distribution and disease status, which included healthy controls, diseased controls, and cases, was assessed using the χ2 test.
For healthy controls, the researchers evaluated the deviation of genotype distribution from the Hardy–Weinberg equilibrium (HWE) and checked for linkage disequilibrium (LD) between polymorphisms using exact tests following the approach by Weir [,]. A result was considered statistically significant when p < 0.05.
The examination of the HWE and LD was conducted using the Genetic Data Analysis (GDA 1.1) software [,], while haplotype frequencies were estimated and compared using SHEsis [,]. The ORG was calculated with the help of ORGGASMA (https://biomath.med.uth.gr/default.aspx?lang=el&id=232164AC-9C6B-4A27-A595-2A22C35B6260&rid=576AB0F4-10AE-4BEA-8D97-C52B8B6BD4DA, accessed on 12 November 2023) [,]. GeneAIEX (v6.5) software was used to perform analysis of molecular variance (AMOVA) [,].
4.2. Meta-Analysis
4.2.1. Identification and Eligibility of Relevant Studies
In order to clarify the role of interleukins in the development and progression of IgA nephropathy, we synthesized the results of all available GAS that examine the association between variants located in interleukin genes and IgAN. The studies were retrieved after extensive search of PubMed using the search terms ((“immunoglobulin A nephropathy” or “IgA nephropathy”) AND interleukin AND (gene OR polymorphism), accessed on 30 May 2023).
The collected publications underwent a comprehensive review to assess their suitability. Additionally, all references from the eligible studies were examined to identify any articles not included in the previously mentioned databases. Abstracts, case reports, editorials, review articles, in vitro studies, and family-based studies were excluded from the analysis. It is essential to mention that the search was limited to articles published in English. The eligibility of the articles was evaluated by two investigators, M.T. and I.S., and any differences in their assessments were resolved through mutual agreement.
The association studies included in the meta-analysis focused on the progression of IgAN. Both cases and controls consisted of patients with sporadic IgAN. Specifically, patients with a progressive form of IgAN were categorized as cases (progressors), while those with a stable nephropathy were categorized as controls (non-progressors). It is important to note that the eligibility criteria did not depend on a predefined definition of IgAN progression. Instead, each study’s own definition of progression was accepted and is presented in Table 7. Participants with other types of IgA nephropathy, such as Henoch–Schönlein purpura, as well as subjects with secondary IgA nephropathy, were excluded.
4.2.2. Data Extraction
The first author, publication year, racial background of the study participants, selection criteria, demographic information, and complete genotype counts or allele counts were extracted from each study.
4.2.3. Data Synthesis and Analysis
To explore the association between genotype distribution and the likelihood of developing sporadic IgAN or the risk of disease progression, we utilized the generalized linear odds ratio (ORG) [,]. When there were at least two studies available, a meta-analysis was performed, and the pooled odds ratio (OR) was calculated using random effects models (DerSimonian and Laird) []. All associations were reported as odds ratios (ORs) with corresponding 95% confidence intervals (CIs). To assess the heterogeneity among the studies, the Q-statistic was employed [], and the degree of heterogeneity was quantified using the I2 metric [].
For the analysis of the control group’s genotype distribution, the Fisher’s exact test was applied to test for deviation from the Hardy–Weinberg equilibrium (HWE). Additionally, the Egger test was used to examine small-study effects [].
To conduct the generalized odds ratio methodology, the researchers utilized the ORGGASMA software (https://biomath.med.uth.gr/default.aspx?lang=el&id=232164AC-9C6B-4A27-A595-2A22C35B6260&rid=576AB0F4-10AE-4BEA-8D97-C52B8B6BD4DA, accessed on 12 November 2023) [,]. For all analyses, the Comprehensive Meta Analysis software package (CMA version 2; http://www.meta-analysis.com (accessed on 12 November 2023); 2005) and StatsDirect software 2013 (StatsDirect Ltd., Birkenhead, UK). StatsDirect statistical software 2008. http://www.statsdirect.com (accessed on 12 November 2023). StatsDirect Ltd.: Birkenhead, UK were employed.
5. Conclusions
In conclusion, the present study showed that genetic variations within the interleukin-1 gene cluster may contribute to an increased risk for “progressive” disease in IgAN. Our results suggest that certain interleukin-1 gene cluster variants (i.e., the T allele of rs16944 in IL1B) and haplotypes may be pathogenically involved in progressive IgAN. However, there exists a significant demand for multi-omics resources to further investigate the present findings and gain biological insights. Additionally, it is imperative to conduct future research involving functional experiments to confirm the significance of potential causal genetic variations of interleukin-1 gene cluster in the progressive IgAN.
Author Contributions
Conceptualization, I.S.; methodology, I.S. and T.E.; software, M.T.; validation, G.P., M.D., T.E. and I.S.; formal analysis, I.C. and M.T.; data curation, I.C., S.G., G.F., E.E.T. and M.T.; writing—original draft preparation, I.C. and M.T.; writing—review and editing, T.E., E.D., P.R.M., V.L., E.E.T. and I.S.; visualization, M.T.; supervision, I.S.; funding acquisition, I.S. and P.R.M. All authors have read and agreed to the published version of the manuscript.
Funding
The study was sponsored by the SFB854 TP01 of the Otto-von-Guericke University of Magdeburg, School of Medicine, Germany and Program Nr. 2498 of the Investigation Committee of the University Thessaly, Greece.
Institutional Review Board Statement
The study was conducted according to the guidelines of the Declaration of Helsinki and approved by the Ethics Committee of the University Hospital of Larissa, School of Medicine, University of Thessaly (date of approval on 17 March 2014).
Informed Consent Statement
Informed consent was obtained from all subjects involved in the study.
Data Availability Statement
The datasets used and/or analyzed during the current study are available from the corresponding author on reasonable request.
Conflicts of Interest
The authors declare no conflict of interest.
References
- Lai, K.N.; Tang, S.C.W.; Schena, F.P.; Novak, J.; Tomino, Y.; Fogo, A.B.; Glassock, R.J. IgA nephropathy. Nat. Rev. Dis. Primer 2016, 2, 16001. [Google Scholar] [CrossRef]
- Lai, K.N. Pathogenesis of IgA nephropathy. Nat. Rev. Nephrol. 2012, 8, 275–283. [Google Scholar] [CrossRef]
- Mucha, K.; Pac, M.; Pączek, L. Omics are Getting Us Closer to Understanding IgA Nephropathy. Arch. Immunol. Ther. Exp. 2023, 71, 12. [Google Scholar] [CrossRef] [PubMed]
- A Working Group of the International IgA Nephropathy Network and the Renal Pathology Society; Roberts, I.S.D.; Cook, H.T.; Troyanov, S.; Alpers, C.E.; Amore, A.; Barratt, J.; Berthoux, F.; Bonsib, S.; Bruijn, J.A.; et al. The Oxford classification of IgA nephropathy: Pathology definitions, correlations, and reproducibility. Kidney Int. 2009, 76, 546–556. [Google Scholar] [CrossRef] [PubMed]
- Gentile, M.; Sanchez-Russo, L.; Riella, L.V.; Verlato, A.; Manrique, J.; Granata, S.; Fiaccadori, E.; Pesce, F.; Zaza, G.; Cravedi, P. Immune abnormalities in IgA nephropathy. Clin. Kidney J. 2023, 16, 1059–1070. [Google Scholar] [CrossRef]
- Montinaro, V.; Hevey, K.; Aventaggiato, L.; Fadden, K.; Esparza, A.; Chen, A.; Finbloom, D.S.; Rifai, A. Extrarenal cytokines modulate the glomerular response to IgA immune complexes. Kidney Int. 1992, 42, 341–353. [Google Scholar] [CrossRef] [PubMed]
- Schena, F.P.; Gesualdo, L.; Montinaro, V.; Schena, F.P.; Gesualdo, L.; Montinaro, V. Immunopathological Aspects of Immunoglobulin A Nephropathy and Other Mesangial Proliferative Glomerulonephritides. J. Am. Soc. Nephrol. 1992, 2, S167–S172. [Google Scholar] [CrossRef]
- Yoshioka, K.; Takemura, T.; Murakami, K.; Okada, M.; Yagi, K.; Miyazato, H.; Matsushima, K.; Maki, S. In situ expression of cytokines in IgA nephritis. Kidney Int. 1993, 44, 825–833. [Google Scholar] [CrossRef][Green Version]
- Chen, A.; Chen, W.-P.; Sheu, L.-F.; Lin, C.-Y. Pathogenesis of IgA nephropathy: In vitro activation of human mesangial cells by IgA immune complex leads to cytokine secretion. J. Pathol. 1994, 173, 119–126. [Google Scholar] [CrossRef]
- Lovett, D.H.; Larsen, A. Cell cycle-dependent interleukin 1 gene expression by cultured glomerular mesangial cells. J. Clin. Investig. 1988, 82, 115–122. [Google Scholar] [CrossRef]
- Myllymäki, J.M.; Honkanen, T.T.; Syrjänen, J.T.; Helin, H.J.; Rantala, I.S.; Pasternack, A.I.; Mustonen, J.T. Severity of tubulointerstitial inflammation and prognosis in immunoglobulin A nephropathy. Kidney Int. 2007, 71, 343–348. [Google Scholar] [CrossRef]
- Chan, L.Y.Y.; Leung, J.C.K.; Tsang, A.W.L.; Tang, S.C.W.; Lai, K.N. Activation of tubular epithelial cells by mesangial-derived TNF-a: Glomerulotubular communication in IgA nephropathy. Kidney Int. 2005, 67, 602–612. [Google Scholar] [CrossRef] [PubMed]
- Lai, K.N.; Leung, J.C.K.; Chan, L.Y.Y.; Saleem, M.A.; Mathieson, P.W.; Lai, F.M.; Tang, S.C.W. Activation of podocytes by mesangial-derived TNF-α: Glomerulo-podocytic communication in IgA nephropathy. Am. J. Physiol. Ren. Physiol. 2008, 294, F945–F955. [Google Scholar] [CrossRef] [PubMed]
- Radford, M.G.; Donadio, J.V.; Bergstralh, E.J.; Grandet, J.P. Predicting Renal Outcome in IgA Nephropathy. J. Am. Soc. Nephrol. 1997, 8, 199–207. [Google Scholar] [CrossRef] [PubMed]
- Hahn, W.; Cho, B.; Kim, S.; Kim, S.; Kang, S. Interleukin-1 cluster gene polymorphisms in childhood IgA nephropathy. Pediatr. Nephrol. 2009, 24, 1329–1336. [Google Scholar] [CrossRef]
- Liu, H.; Liang, D.; Wang, L.; Zhou, N.; Yao, C.; Hong, T.; Tang, D.; Chen, X. Effects of specific interleukin-1beta-converting enzyme inhibitor on ischemic acute renal failure in murine models. Acta Pharmacol. Sin. 2005, 26, 1345–1351. [Google Scholar] [CrossRef][Green Version]
- Akash, M.S.H.; Rehman, K.; Sun, H.; Chen, S. Sustained delivery of IL-1Ra from PF127-gel reduces hyperglycemia in diabetic GK-rats. PLoS ONE 2013, 8, e55925. [Google Scholar] [CrossRef]
- Berry, M.; Clatworthy, M.R. Immunotherapy for acute kidney injury. Immunotherapy 2012, 4, 323–334. [Google Scholar] [CrossRef]
- Wu, T.H.; Wu, S.C.; Huang, T.P.; Yu, C.L.; Tsai, C.Y. Increased excretion of tumor necrosis factor alpha and interleukin 1 beta in urine from patients with IgA nephropathy and Schönlein-Henoch purpura. Nephron 1996, 74, 79–88. [Google Scholar] [CrossRef]
- Rauta, V.; Teppo, A.-M.; Törnroth, T.; Honkanen, E.; Grönhagen-Riska, C. Lower urinary-interleukin-1 receptor-antagonist excretion in IgA nephropathy than in Henoch-Schönlein nephritis. Nephrol. Dial. Transplant. 2003, 18, 1785–1791. [Google Scholar] [CrossRef][Green Version]
- Hung, A.M.; Ellis, C.D.; Shintani, A.; Booker, C.; Ikizler, T.A. IL-1β receptor antagonist reduces inflammation in hemodialysis patients. J. Am. Soc. Nephrol. 2011, 22, 437–442. [Google Scholar] [CrossRef] [PubMed]
- Zintzaras, E. The power of generalized odds ratio in assessing association in genetic studies. J. Appl. Stat. 2012, 39, 2569–2581. [Google Scholar] [CrossRef]
- Zintzaras, E. The generalized odds ratio as a measure of genetic risk effect in the analysis and meta-analysis of association studies. Stat. Appl. Genet. Mol. Biol. 2010, 9, 21. [Google Scholar] [CrossRef]
- Liu, Z.-H.; Cheng, Z.-H.; Yu, Y.-S.; Tang, Z.; Li, L.-S. Interleukin-1 receptor antagonist allele: Is it a genetic link between Henoch-Schönlein nephritis and IgA nephropathy? Kidney Int. 1997, 51, 1938–1942. [Google Scholar] [CrossRef] [PubMed]
- Shu, K.H.; Lee, S.H.; Cheng, C.H.; Wu, M.J.; Lian, J.D. Impact of interleukin-1 receptor antagonist and tumor necrosis factor-alpha gene polymorphism on IgA nephropathy. Kidney Int. 2000, 58, 783–789. [Google Scholar] [CrossRef] [PubMed]
- Syrjänen, J.; Hurme, M.; Lehtimäki, T.; Mustonen, J.; Pasternack, A. Polymorphism of the cytokine genes and IgA nephropathy. Kidney Int. 2002, 61, 1079–1085. [Google Scholar] [CrossRef] [PubMed][Green Version]
- Watanabe, M.; Iwano, M.; Akai, Y.; Kurioka, H.; Nishitani, Y.; Harada, K.; Hamano, K.; Shiiki, H. Association of Interleukin-1 Receptor Antagonist Gene Polymorphism with IgA Nephropathy. Nephron 2002, 91, 744–746. [Google Scholar] [CrossRef] [PubMed]
- Bantis, C.; Heering, P.J.; Aker, S.; Klein-Vehne, N.; Grabensee, B.; Ivens, K. Association of interleukin-10 gene G-1082A polymorphism with the progression of primary glomerulonephritis. Kidney Int. 2004, 66, 288–294. [Google Scholar] [CrossRef]
- Chin, H.J.; Na, K.Y.; Kim, S.J.; Oh, K.-H.; Kim, Y.S.; Lim, C.S.; Kim, S.; Chae, D.-W. Interleukin-10 promoter polymorphism is associated with the predisposition to the development of IgA nephropathy and focal segmental glomerulosclerosis in Korea. J. Korean Med. Sci. 2005, 20, 989–993. [Google Scholar] [CrossRef]
- Liu, X.-Q.; Paterson, A.D.; He, N.; St George-Hyslop, P.; Rauta, V.; Gronhagen-Riska, C.; Laakso, M.; Thibaudin, L.; Berthoux, F.; Cattran, D.; et al. IL5RA and TNFRSF6B gene variants are associated with sporadic IgA nephropathy. J. Am. Soc. Nephrol. 2008, 19, 1025–1033. [Google Scholar] [CrossRef]
- Jung, H.Y.; Cho, J.H.; Lim, J.H.; Yu, C.H.; Choi, J.Y.; Yoon, S.H.; Park, S.H.; Kim, Y.L.; Kim, C.D. Impact of gene polymorphisms of interleukin-18, transforming growth factor-β, and vascular endothelial growth factor on development of IgA nephropathy and thin glomerular basement membrane disease. Kidney Res. Clin. Pract. 2012, 31, 234–241. [Google Scholar] [CrossRef]
- Yamamoto, R.; Nagasawa, Y.; Shoji, T.; Katakami, N.; Ohtoshi, K.; Hayaishi-okano, R.; Yamasaki, Y.; Yamauchi, A.; Tsubakihara, Y.; Imai, E.; et al. A candidate gene approach to genetic contributors to the development of IgA nephropathy. Nephrol. Dial. Transplant. 2012, 27, 1020–1030. [Google Scholar] [CrossRef]
- Wang, W.; Sun, Y.; Fu, Y.; Yu, X.; Li, M. Interaction of C1GALT1-IL5RA on the susceptibility to IgA nephropathy in Southern Han Chinese. J. Hum. Genet. 2013, 58, 40–46. [Google Scholar] [CrossRef] [PubMed]
- Yang, B.; Feng, W.; Li, Y.; Shi, Y.; Cai, B.; Liao, Y.; Zhang, J.; Huang, Z.; Wang, L. Interleukin 18-607 A/C Gene Polymorphism is Associated with Susceptibility to IgA Nephropathy in a Chinese Han Population. Appl. Immunohistochem. Mol. Morphol. 2016, 25, 725–730. [Google Scholar] [CrossRef] [PubMed]
- Gao, J.; Wei, L.; Fu, R.; Wei, J.; Niu, D.; Wang, L.; Ge, H.; Yu, Q.; Wang, M.; Liu, X.; et al. Association of interleukin-10 polymorphisms (rs1800872, rs1800871, and rs1800896) with predisposition to IgA nephropathy in a Chinese han population: A case-control study. Kidney Blood Press. Res. 2017, 42, 89–98. [Google Scholar] [CrossRef] [PubMed]
- Zhang, D.; Xie, M.; Yang, X.; Zhang, Y.; Su, Y.; Wang, Y.; Huang, H.; Han, H.; Li, W.; Fu, K.; et al. Determination of IL-1B (rs16944) and IL-6 (rs1800796) genetic polymorphisms in IgA nephropathy in a northwest Chinese Han population. Oncotarget 2017, 8, 71750–71758. [Google Scholar] [CrossRef][Green Version]
- Ding, X.; Mei, Y.; Mao, Z.; Long, L.; Han, Q.; You, Y.; Zhu, H. Association of Immune and Inflammatory Gene Polymorphism with the Risk of IgA Nephropathy: A Systematic Review and Meta-Analysis of 45 Studies. Front. Immunol. 2021, 12, 683913. [Google Scholar] [CrossRef]
- Goto, M.; Wakai, K.; Kawamura, T.; Ando, M.; Endoh, M.; Tomino, Y. A scoring system to predict renal outcome in IgA nephropathy: A nationwide 10-year prospective cohort study. Nephrol. Dial. Transplant. 2009, 24, 3068–3074. [Google Scholar] [CrossRef]
- Shen, P.; He, L.; Li, Y.; Wang, Y.; Chan, M. Natural history and prognostic factors of IgA nephropathy presented with isolated microscopic hematuria in Chinese patients. Nephron Clin. Pract. 2007, 106, c157–c161. [Google Scholar] [CrossRef]
- Imai, H.; Miura, N. A treatment dilemma in adult immunoglobulin A nephropathy: What is the appropriate target, preservation of kidney function or induction of clinical remission? Clin. Exp. Nephrol. 2012, 16, 195–201. [Google Scholar] [CrossRef]
- Szeto, C.-C.; Fernand, M.-M.; Lai, K.-F.; To, T.; Wong, Y.-H.; Chow, K.-M.; Cheung-Lung, P.; Choi, S.-F.; Lui, P.; Li, K.-T. The Natural History of Immunoglobulin A Nephropathy among Patients with Hematuria and Minimal Proteinuria. Am. J. Med. 2001, 110, 434–437. [Google Scholar] [CrossRef]
- Neelakantappa, K.; Gallo, G.R.; Baldwin, D.S. Proteinuria in IgA nephropathy. Kidney Int. 1988, 33, 716–721. [Google Scholar] [CrossRef]
- Waldherr, R.; Rambausek, M.; Duncker, W.D.; Ritz, E. Nephrology Dialysis Transplantation Original Article Frequency of Mesangial IgA Deposits in a Non-Selected Autopsy Series. Nephrol. Dial. Transplant. 1989, 4, 943–946. [Google Scholar] [CrossRef]
- Suzuki, K.; Honda, K.; Tanabe, K.; Toma, H.; Nihei, H.; Yamaguchi, Y. Incidence of latent mesangial IgA deposition in renal allograft donors in Japan. Kidney Int. 2003, 63, 2286–2294. [Google Scholar] [CrossRef]
- Hosking, L.; Lumsden, S.; Lewis, K.; Yeo, A.; McCarthy, L.; Bansal, A.; Riley, J.; Purvis, I.; Xu, C.-F. Detection of genotyping errors by Hardy-Weinberg equilibrium testing. Eur. J. Hum. Genet. 2004, 12, 395–399. [Google Scholar] [CrossRef] [PubMed]
- Tziastoudi, M.; Chronopoulou, I.; Pissas, G.; Cholevas, C.; Eleftheriadis, T.; Stefanidis, I. Tumor Necrosis Factor-α G-308A Polymorphism and Sporadic IgA Nephropathy: A Meta-Analysis Using a Genetic Model-Free Approach. Genes 2023, 14, 1488. [Google Scholar] [CrossRef]
- Tziastoudi, M.; Stefanidis, I.; Hadjigeorgiou, G.M.; Stravodimos, K.; Zintzaras, E. A systematic review and meta-analysis of genetic association studies for the role of inflammation and the immune system in diabetic nephropathy. Clin. Kidney J. 2017, 10, 293–300. [Google Scholar] [CrossRef] [PubMed]
- Tziastoudi, M.; Stefanidis, I.; Zintzaras, E. The genetic map of diabetic nephropathy: Evidence from a systematic review and meta-analysis of genetic association studies. Clin. Kidney J. 2020, 13, 768–781. [Google Scholar] [CrossRef]
- Tziastoudi, M.; Dardiotis, E.; Pissas, G.; Filippidis, G.; Golfinopoulos, S.; Siokas, V.; Tachmitzi, S.V.; Eleftheriadis, T.; Hadjigeorgiou, G.M.; Tsironi, E.; et al. Serpin Family E Member 1 Tag Single-Nucleotide Polymorphisms in Patients with Diabetic Nephropathy: An Association Study and Meta-Analysis Using a Genetic Model-Free Approach. Genes 2021, 12, 1887. [Google Scholar] [CrossRef] [PubMed]
- Tziastoudi, M.; Theoharides, T.C.; Nikolaou, E.; Efthymiadi, M.; Eleftheriadis, T.; Stefanidis, I. Key Genetic Components of Fibrosis in Diabetic Nephropathy: An Updated Systematic Review and Meta-Analysis. Int. J. Mol. Sci. 2022, 23, 5331. [Google Scholar] [CrossRef]
- Stefanidis, I.; Tziastoudi, M.; Tsironi, E.E.; Dardiotis, E.; Tachmitzi, S.V.; Fotiadou, A.; Pissas, G.; Kytoudis, K.; Sounidaki, M.; Ampatzis, G.; et al. The contribution of genetic variants of SLC2A1 gene in T2DM and T2DM-nephropathy: Association study and meta-analysis. Ren. Fail. 2018, 40, 561–576. [Google Scholar] [CrossRef] [PubMed]
- Tziastoudi, M.; Pissas, G.; Raptis, G.; Cholevas, C.; Eleftheriadis, T.; Dounousi, E.; Stefanidis, I.; Theoharides, T.C. A Systematic Review and Meta-Analysis of Pharmacogenetic Studies in Patients with Chronic Kidney Disease. Int. J. Mol. Sci. 2021, 22, 4480. [Google Scholar] [CrossRef] [PubMed]
- Cordell, H.J.; Clayton, D.G. Genetic association studies. Lancet 2005, 366, 1121–1131. [Google Scholar] [CrossRef] [PubMed]
- Burton, P.R.; Hansell, A.L.; Fortier, I.; Manolio, T.A.; Khoury, M.J.; Little, J.; Elliott, P. Size matters: Just how big is BIG?: Quantifying realistic sample size requirements for human genome epidemiology. Int. J. Epidemiol. 2009, 38, 263–273. [Google Scholar] [CrossRef]
- McCarthy, M.I.; Abecasis, G.R.; Cardon, L.R.; Goldstein, D.B.; Little, J.; Ioannidis, J.P.A.; Hirschhorn, J.N. Genome-wide association studies for complex traits: Consensus, uncertainty and challenges. Nat. Rev. Genet. 2008, 9, 356–369. [Google Scholar] [CrossRef]
- Von Hippel, P.T. The heterogeneity statistic I(2) can be biased in small meta-analyses. BMC Med. Res. Methodol. 2015, 15, 35. [Google Scholar] [CrossRef]
- Storey, J.D.; Tibshirani, R. Statistical significance for genomewide studies. Proc. Natl. Acad. Sci. USA 2003, 100, 9440–9445. [Google Scholar] [CrossRef]
- Thomas, D.C. Are we ready for genome-wide association studies? Cancer Epidemiol. Biomark. Prev. 2006, 15, 595–598. [Google Scholar] [CrossRef]
- D’Amico, G. Natural history of idiopathic IgA nephropathy: Role of clinical and histological prognostic factors. Am. J. Kidney Dis. 2000, 36, 227–237. [Google Scholar] [CrossRef]
- Tarlow, J.K.; Blakemore, A.I.F.; Lennard, A.; Solari, R.; Hughes, H.N.; Steinkasserer, A.; Duff, G.W. Polymorphism in human IL-1 receptor antagonist gene intron 2 is caused by variable numbers of an 86-bp tandem repeat. Hum. Genet. 1993, 91, 403–404. [Google Scholar] [CrossRef]
- McDowell, T.L.; Symons, J.A.; Ploski, R.; Førre, O.; Duff, G.W. A genetic association between juvenile rheumatoid arthritis and a novel interleukin-1 alpha polymorphism. Arthritis Rheum. 1995, 38, 221–228. [Google Scholar] [CrossRef] [PubMed]
- Di Giovine, F.S.; Takhsh, E.; Blakemore, A.I.; Duff, G.W. Single base polymorphism at -511 in the human interleukin-1 beta gene (IL1 beta). Hum. Mol. Genet. 1992, 1, 450. [Google Scholar] [CrossRef] [PubMed]
- Li, Z.; Zhang, Z.; He, Z.; Tang, W.; Li, T.; Zeng, Z.; He, L.; Shi, Y. A partition-ligation-combination-subdivision em algorithm for haplotype inference with multiallelic markers: Update of the SHEsis (http://analysis.bio-x.cn). Cell Res. 2009, 19, 519–523. [Google Scholar] [CrossRef] [PubMed]
- Shi, Y.Y.; He, L. SHEsis, a powerful software platform for analyses of linkage disequilibrium, haplotype construction, and genetic association at polymorphism loci. Cell Res. 2005, 15, 97–98. [Google Scholar] [CrossRef] [PubMed]
- Meirmans, P.G. Using the AMOVA framework to estimate a standardized genetic differentiation measure. Evol. Int. J. Org. Evol. 2006, 60, 2399–2402. [Google Scholar] [CrossRef]
- Peakall, R.; Smouse, P.E. GenAlEx 6.5: Genetic analysis in Excel. Population genetic software for teaching and research--an update. Bioinforma. Oxf. Engl. 2012, 28, 2537–2539. [Google Scholar] [CrossRef]
- Dersimonian, R.; Laird, N. Meta-Analysis in Clinical Trials. Control. Clin. Trials 1986, 188, 177–188. [Google Scholar] [CrossRef]
- Cochran, W. The combination of estimates from different experiments. Biometrics 1954, 10, 101–129. [Google Scholar] [CrossRef]
- Higgins, J.P.T.; Thompson, S.G.; Deeks, J.J.; Altman, D.G. Measuring inconsistency in meta-analyses. BMJ 2003, 327, 557–560. [Google Scholar] [CrossRef]
- Egger, M.; Davey Smith, G.; Schneider, M.; Minder, C. Bias in meta-analysis detected by a simple, graphical test. BMJ 1997, 315, 629–634. [Google Scholar] [CrossRef]
Disclaimer/Publisher’s Note: The statements, opinions and data contained in all publications are solely those of the individual author(s) and contributor(s) and not of MDPI and/or the editor(s). MDPI and/or the editor(s) disclaim responsibility for any injury to people or property resulting from any ideas, methods, instructions or products referred to in the content. |
© 2023 by the authors. Licensee MDPI, Basel, Switzerland. This article is an open access article distributed under the terms and conditions of the Creative Commons Attribution (CC BY) license (https://creativecommons.org/licenses/by/4.0/).