
Prostate-Specific Membrane Antigen (PSMA) Expression Predicts Need for Early Treatment in Prostate Cancer Patients Managed with Active Surveillance
 , ,
, ,  , ,
, ,
Abstract
1. Introduction
2. Results
2.1. Patients, Tissues, and Clinicopathological Data
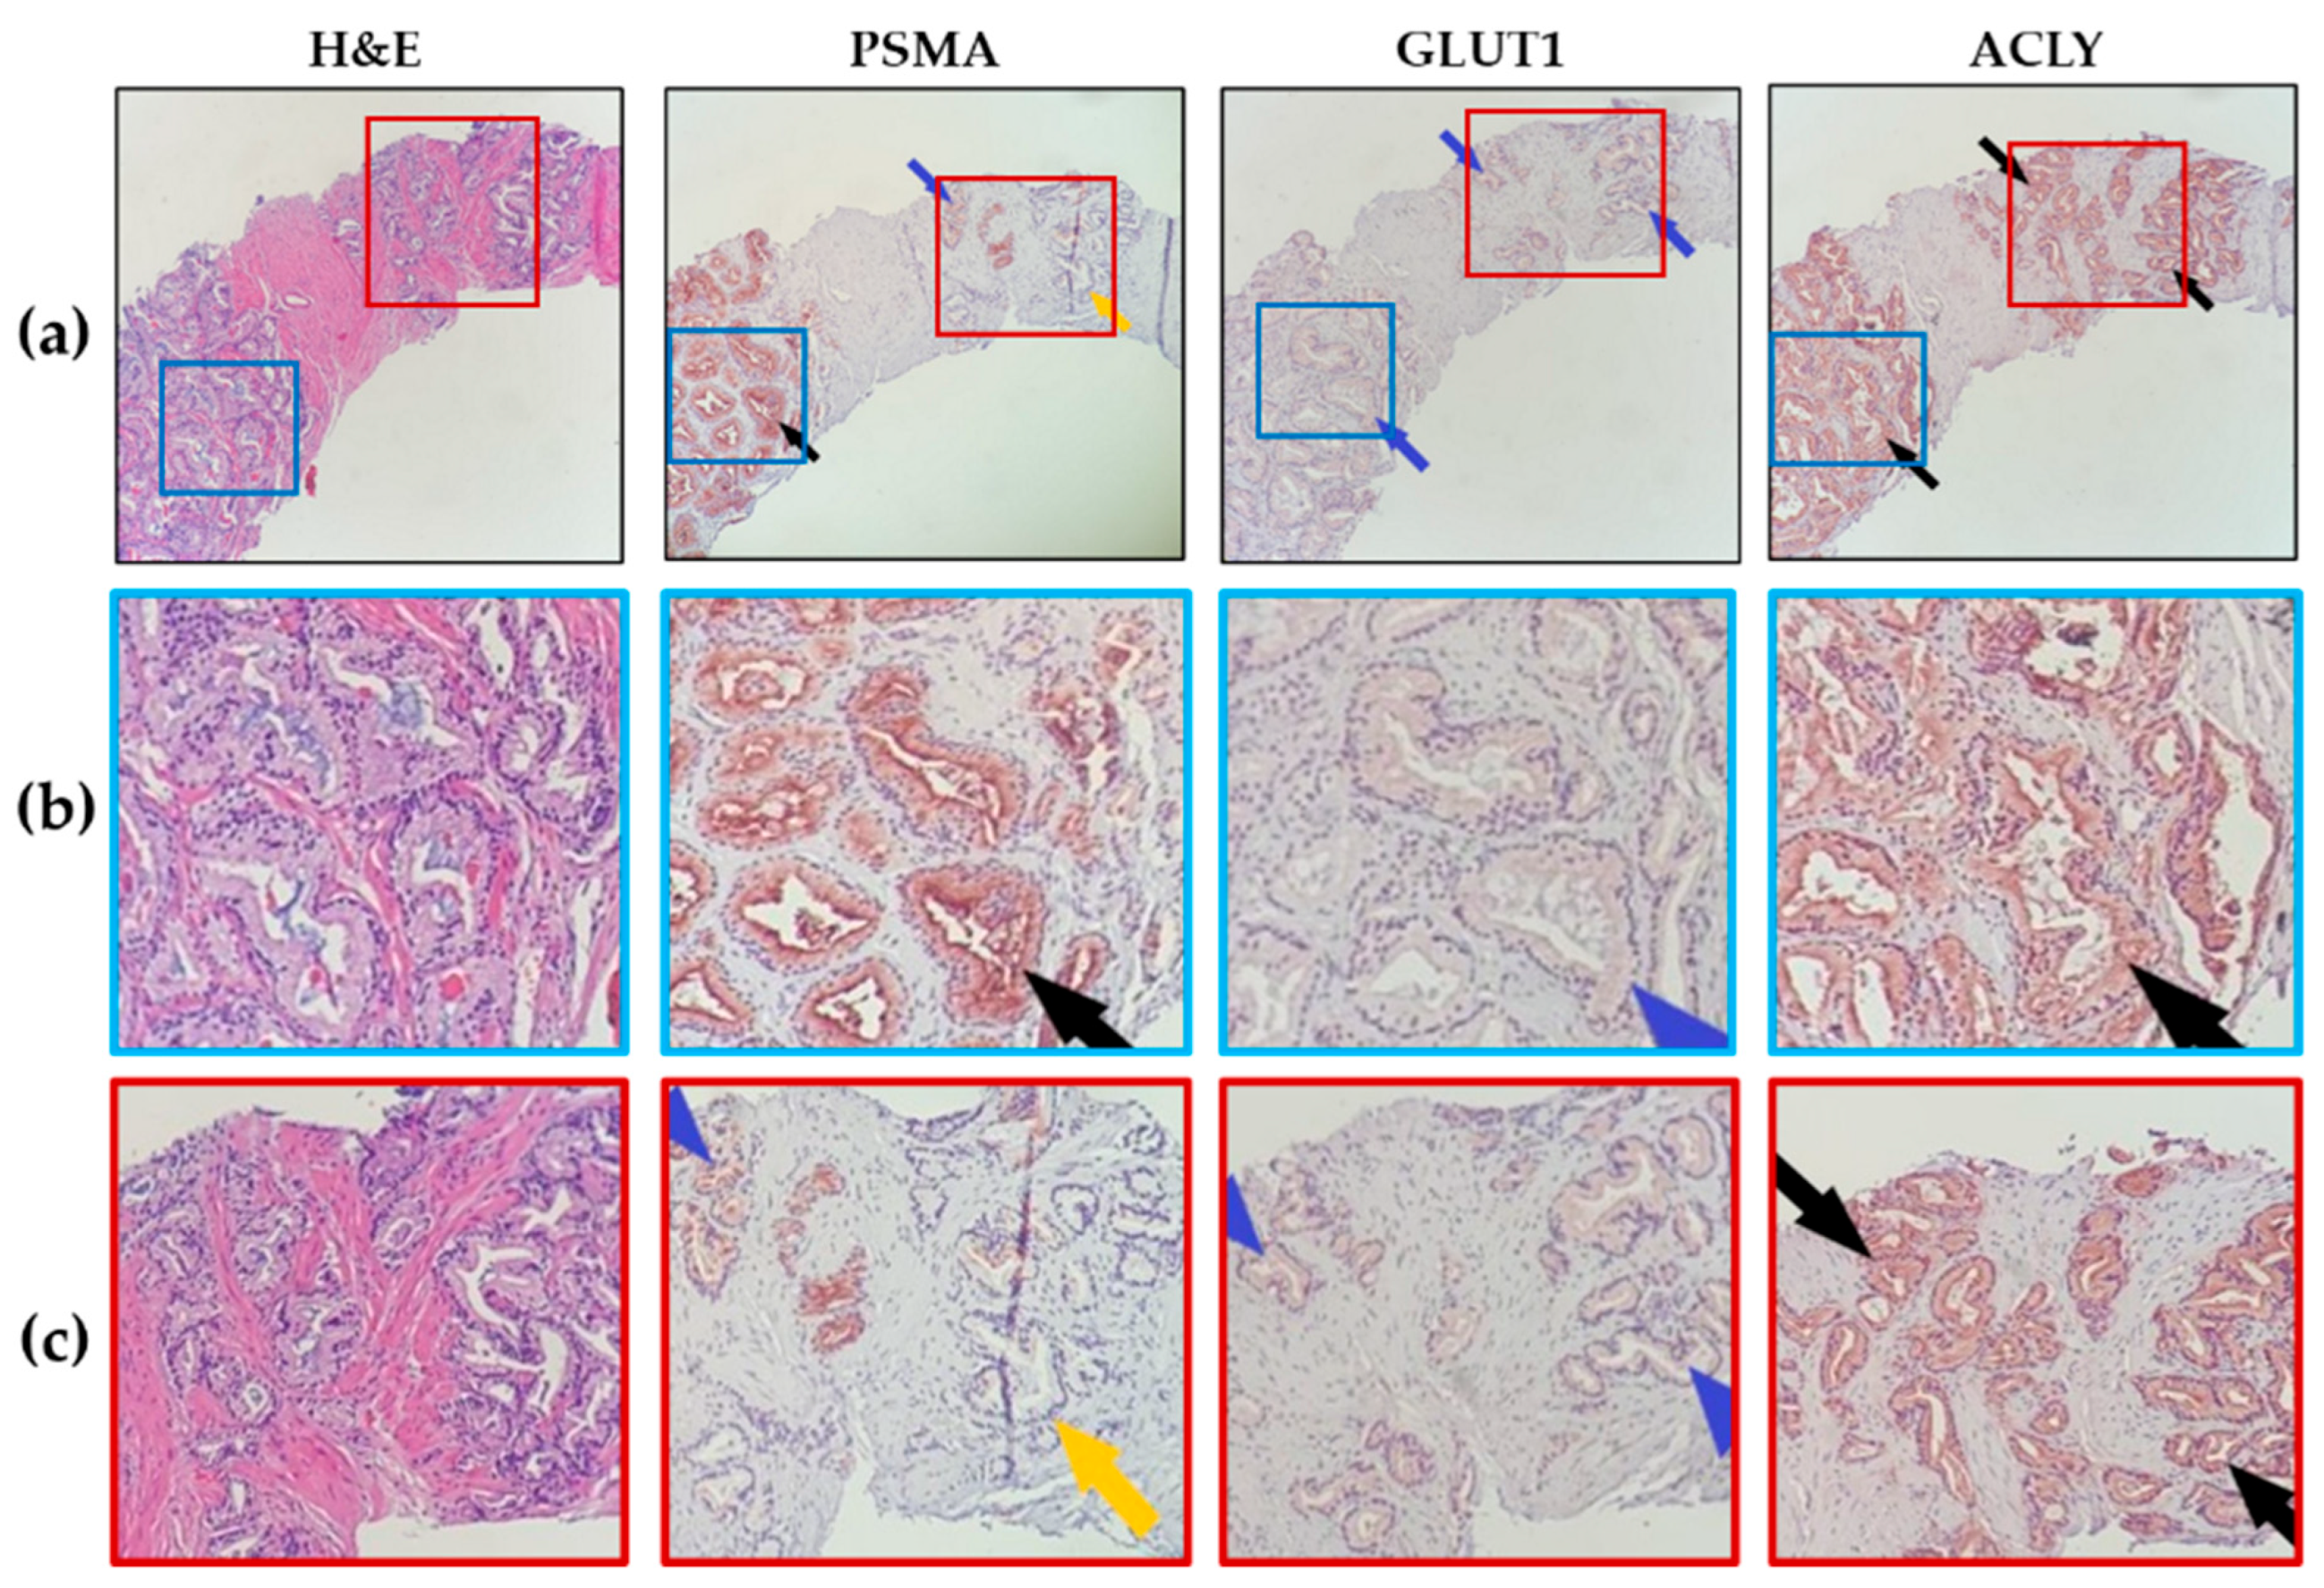
2.2. Patterns of Marker Expression
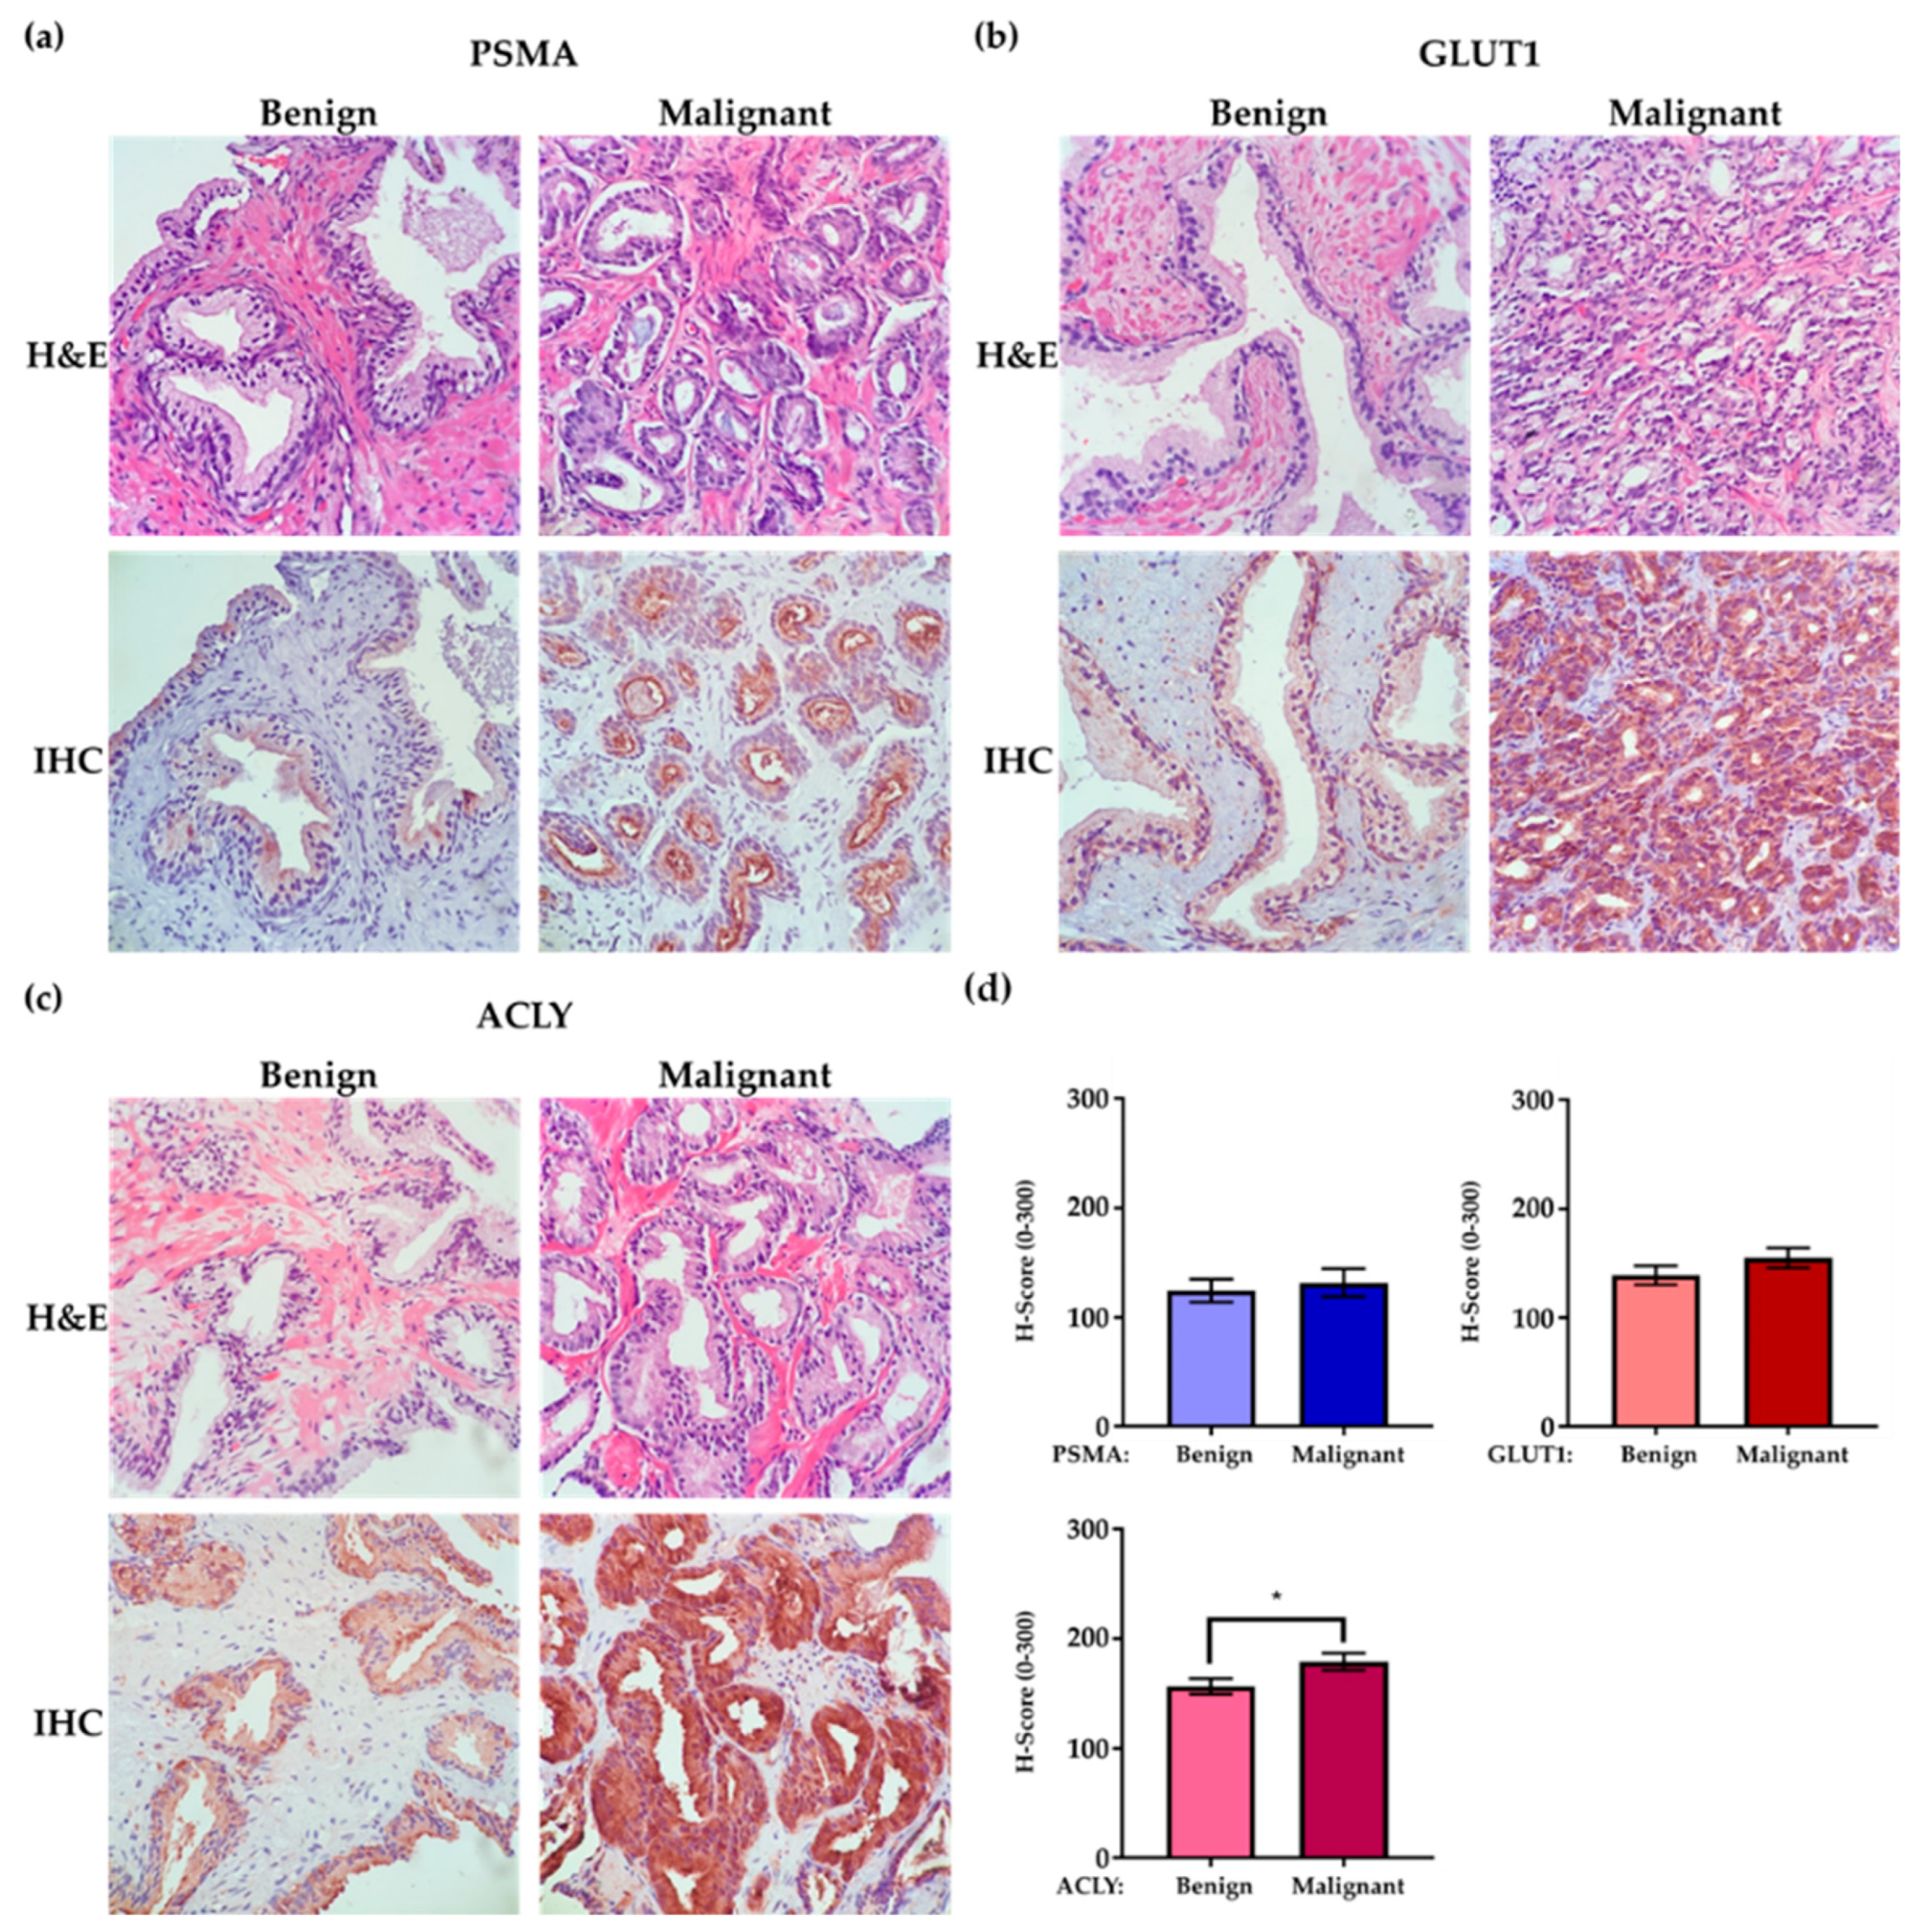
2.3. IHC Evaluation
3. Discussion
Study Limitations
4. Methods and Materials
4.1. Patient Population and Tissue Collection
- (i)
- A higher Gleason score in subsequent biopsies, increasing from Gleason 6 to 7 or from 7 to 8
- (ii)
- Substantial biochemical progression of PSA to >15 ng/mL
- (iii)
- Combined events of >50% increase in the number of involved biopsy cores and PSA progression to >10 ng/mL, or any clinical or imaging indications of progression after initial diagnosis
4.2. H&E and Immunohistochemistry (IHC) Staining
Special Consideration for the Antibody Staining Procedure
4.3. Scoring
4.4. Statistical Analyses
5. Conclusions
Supplementary Materials
Author Contributions
Funding
Institutional Review Board Statement
Informed Consent Statement
Data Availability Statement
Conflicts of Interest
References
- Sung, H.; Ferlay, J.; Siegel, R.L.; Laversanne, M.; Soerjomataram, I.; Jemal, A.; Bray, F. Global Cancer Statistics 2020: GLOBOCAN Estimates of Incidence and Mortality Worldwide for 36 Cancers in 185 Countries. CA Cancer J. Clin. 2021, 71, 209–249. [Google Scholar] [CrossRef] [PubMed]
- de Vos, I.I.; Luiting, H.B.; Roobol, M.J. Active Surveillance for Prostate Cancer: Past, Current, and Future Trends. J. Pers. Med. 2023, 13, 629. [Google Scholar] [CrossRef] [PubMed]
- Klotz, L.; Vesprini, D.; Sethukavalan, P.; Jethava, V.; Zhang, L.; Jain, S.; Yamamoto, T.; Mamedov, A.; Loblaw, A. Long-term follow-up of a large active surveillance cohort of patients with prostate cancer. J. Clin. Oncol. 2015, 33, 272–277. [Google Scholar] [CrossRef] [PubMed]
- Kinsella, N.; Helleman, J.; Bruinsma, S.; Carlsson, S.; Cahill, D.; Brown, C.; Van Hemelrijck, M. Active surveillance for prostate cancer: A systematic review of contemporary worldwide practices. Transl. Androl. Urol. 2018, 7, 83–97. [Google Scholar] [CrossRef]
- Gjertson, C.K.; Albertsen, P.C. Use and assessment of PSA in prostate cancer. Med. Clin. N. Am. 2011, 95, 191–200. [Google Scholar] [CrossRef]
- Welch, H.G.; Albertsen, P.C. Reconsidering Prostate Cancer Mortality—The Future of PSA Screening. N. Engl. J. Med. 2020, 382, 1557–1563. [Google Scholar] [CrossRef]
- Ross, J.S.; Sheehan, C.E.; Fisher, H.A.; Kauffman, R.A.; Dolen, E.M.; Kallakury, B.V. Prognostic markers in prostate cancer. Expert Rev. Mol. Diagn. 2002, 2, 129–142. [Google Scholar] [CrossRef]
- Manceau, C.; Fromont, G.; Beauval, J.B.; Barret, E.; Brureau, L.; Créhange, G.; Dariane, C.; Fiard, G.; Gauthé, M.; Mathieu, R.; et al. Biomarker in Active Surveillance for Prostate Cancer: A Systematic Review. Cancers 2021, 13, 4251. [Google Scholar] [CrossRef]
- Pastor-Navarro, B.; Rubio-Briones, J.; Borque-Fernando, Á.; Esteban, L.M.; Dominguez-Escrig, J.L.; López-Guerrero, J.A. Active Surveillance in Prostate Cancer: Role of Available Biomarkers in Daily Practice. Int. J. Mol. Sci. 2021, 22, 6266. [Google Scholar] [CrossRef]
- Zhao, L.; Yu, N.; Guo, T.; Hou, Y.; Zeng, Z.; Yang, X.; Hu, P.; Tang, X.; Wang, J.; Liu, M. Tissue biomarkers for prognosis of prostate cancer: A systematic review and meta-analysis. Cancer Epidemiol. Biomarkers Prev. 2014, 23, 1047–1054. [Google Scholar] [CrossRef]
- Tosoian, J.J.; Guedes, L.B.; Morais, C.L.; Mamawala, M.; Ross, A.E.; De Marzo, A.M.; Trock, B.J.; Han, M.; Carter, H.B.; Lotan, T.L. PTEN status assessment in the Johns Hopkins active surveillance cohort. Prostate Cancer Prostatic Dis. 2019, 22, 176–181. [Google Scholar] [CrossRef]
- Berg, K.D.; Vainer, B.; Thomsen, F.B.; Røder, M.A.; Gerds, T.A.; Toft, B.G.; Brasso, K.; Iversen, P. ERG protein expression in diagnostic specimens is associated with increased risk of progression during active surveillance for prostate cancer. Eur. Urol. 2014, 66, 851–860. [Google Scholar] [CrossRef] [PubMed]
- Cutruzzolà, F.; Giardina, G.; Marani, M.; Macone, A.; Paiardini, A.; Rinaldo, S.; Paone, A. Glucose Metabolism in the Progression of Prostate Cancer. Front. Physiol. 2017, 8, 97. [Google Scholar] [CrossRef] [PubMed]
- Eidelman, E.; Twum-Ampofo, J.; Ansari, J.; Siddiqui, M.M. The Metabolic Phenotype of Prostate Cancer. Front. Oncol. 2017, 7, 131. [Google Scholar] [CrossRef] [PubMed]
- Wang, J.; Ye, C.; Chen, C.; Xiong, H.; Xie, B.; Zhou, J.; Chen, Y.; Zheng, S.; Wang, L. Glucose transporter GLUT1 expression and clinical outcome in solid tumors: A systematic review and meta-analysis. Oncotarget 2017, 8, 16875–16886. [Google Scholar] [CrossRef]
- Yu, M.; Yongzhi, H.; Chen, S.; Luo, X.; Lin, Y.; Zhou, Y.; Jin, H.; Hou, B.; Deng, Y.; Tu, L.; et al. The prognostic value of GLUT1 in cancers: A systematic review and meta-analysis. Oncotarget 2017, 8, 43356–43367. [Google Scholar] [CrossRef] [PubMed]
- Gasinska, A.; Jaszczynski, J.; Rychlik, U.; Luczynska, E.; Pogodzinski, M.; Palaczynski, M. Prognostic Significance of Serum PSA Level and Telomerase, VEGF and GLUT-1 Protein Expression for the Biochemical Recurrence in Prostate Cancer Patients after Radical Prostatectomy. Pathol. Oncol. Res. 2020, 26, 1049–1056. [Google Scholar] [CrossRef]
- Luczynska, E.; Gasinska, A.; Wilk, W. Expression of Ki-67 (MIB-1) and GLUT-1 proteins in non-advanced prostatic cancer. Pol. J. Pathol. 2012, 63, 272–277. [Google Scholar] [CrossRef]
- Stewart, G.D.; Gray, K.; Pennington, C.J.; Edwards, D.R.; Riddick, A.C.; Ross, J.A.; Habib, F.K. Analysis of hypoxia-associated gene expression in prostate cancer: Lysyl oxidase and glucose transporter-1 expression correlate with Gleason score. Oncol. Rep. 2008, 20, 1561–1567. [Google Scholar] [CrossRef]
- Meziou, S.; Ringuette Goulet, C.; Hovington, H.; Lefebvre, V.; Lavallée, É.; Bergeron, M.; Brisson, H.; Champagne, A.; Neveu, B.; Lacombe, D.; et al. GLUT1 expression in high-risk prostate cancer: Correlation with (18)F-FDG-PET/CT and clinical outcome. Prostate Cancer Prostatic Dis. 2020, 23, 441–448. [Google Scholar] [CrossRef]
- Scaglia, N.; Frontini-López, Y.R.; Zadra, G. Prostate Cancer Progression: As a Matter of Fats. Front. Oncol. 2021, 11, 719865. [Google Scholar] [CrossRef] [PubMed]
- Zadra, G.; Photopoulos, C.; Loda, M. The fat side of prostate cancer. Biochim. Biophys. Acta 2013, 1831, 1518–1532. [Google Scholar] [CrossRef] [PubMed]
- Wu, X.; Daniels, G.; Lee, P.; Monaco, M.E. Lipid metabolism in prostate cancer. Am. J. Clin. Exp. Urol. 2014, 2, 111–120. [Google Scholar]
- Chen, Y.; Li, K.; Gong, D.; Zhang, J.; Li, Q.; Zhao, G.; Lin, P. ACLY: A biomarker of recurrence in breast cancer. Pathol. Res. Pract. 2020, 216, 153076. [Google Scholar] [CrossRef]
- Zaidi, N.; Swinnen, J.V.; Smans, K. ATP-citrate lyase: A key player in cancer metabolism. Cancer Res. 2012, 72, 3709–3714. [Google Scholar] [CrossRef]
- Xin, M.; Qiao, Z.; Li, J.; Liu, J.; Song, S.; Zhao, X.; Miao, P.; Tang, T.; Wang, L.; Liu, W.; et al. miR-22 inhibits tumor growth and metastasis by targeting ATP citrate lyase: Evidence in osteosarcoma, prostate cancer, cervical cancer and lung cancer. Oncotarget 2016, 7, 44252–44265. [Google Scholar] [CrossRef] [PubMed]
- Shah, S.; Carriveau, W.J.; Li, J.; Campbell, S.L.; Kopinski, P.K.; Lim, H.W.; Daurio, N.; Trefely, S.; Won, K.J.; Wallace, D.C.; et al. Targeting ACLY sensitizes castration-resistant prostate cancer cells to AR antagonism by impinging on an ACLY-AMPK-AR feedback mechanism. Oncotarget 2016, 7, 43713–43730. [Google Scholar] [CrossRef] [PubMed]
- Suburu, J.; Chen, Y.Q. Lipids and prostate cancer. Prostaglandins Other Lipid Mediat. 2012, 98, 1–10. [Google Scholar] [CrossRef]
- Van de Sande, T.; Roskams, T.; Lerut, E.; Joniau, S.; Van Poppel, H.; Verhoeven, G.; Swinnen, J.V. High-level expression of fatty acid synthase in human prostate cancer tissues is linked to activation and nuclear localization of Akt/PKB. J. Pathol. 2005, 206, 214–219. [Google Scholar] [CrossRef]
- Swinnen, J.V.; Esquenet, M.; Goossens, K.; Heyns, W.; Verhoeven, G. Androgens stimulate fatty acid synthase in the human prostate cancer cell line LNCaP. Cancer Res. 1997, 57, 1086–1090. [Google Scholar]
- Rhodes, D.R.; Yu, J.; Shanker, K.; Deshpande, N.; Varambally, R.; Ghosh, D.; Barrette, T.; Pandey, A.; Chinnaiyan, A.M. ONCOMINE: A cancer microarray database and integrated data-mining platform. Neoplasia 2004, 6, 1–6. [Google Scholar] [CrossRef] [PubMed]
- Israeli, R.S.; Powell, C.T.; Corr, J.G.; Fair, W.R.; Heston, W.D. Expression of the prostate-specific membrane antigen. Cancer Res. 1994, 54, 1807–1811. [Google Scholar] [PubMed]
- Kaittanis, C.; Andreou, C.; Hieronymus, H.; Mao, N.; Foss, C.A.; Eiber, M.; Weirich, G.; Panchal, P.; Gopalan, A.; Zurita, J.; et al. Prostate-specific membrane antigen cleavage of vitamin B9 stimulates oncogenic signaling through metabotropic glutamate receptors. J. Exp. Med. 2018, 215, 159–175. [Google Scholar] [CrossRef] [PubMed]
- Wright, G.L., Jr.; Haley, C.; Beckett, M.L.; Schellhammer, P.F. Expression of prostate-specific membrane antigen in normal, benign, and malignant prostate tissues. Urol. Oncol. 1995, 1, 18–28. [Google Scholar] [CrossRef] [PubMed]
- Queisser, A.; Hagedorn, S.A.; Braun, M.; Vogel, W.; Duensing, S.; Perner, S. Comparison of different prostatic markers in lymph node and distant metastases of prostate cancer. Mod. Pathol. 2015, 28, 138–145. [Google Scholar] [CrossRef]
- Bravaccini, S.; Puccetti, M.; Bocchini, M.; Ravaioli, S.; Celli, M.; Scarpi, E.; De Giorgi, U.; Tumedei, M.M.; Raulli, G.; Cardinale, L.; et al. PSMA expression: A potential ally for the pathologist in prostate cancer diagnosis. Sci. Rep. 2018, 8, 4254. [Google Scholar] [CrossRef]
- Ross, J.S.; Sheehan, C.E.; Fisher, H.A.; Kaufman, R.P., Jr.; Kaur, P.; Gray, K.; Webb, I.; Gray, G.S.; Mosher, R.; Kallakury, B.V. Correlation of primary tumor prostate-specific membrane antigen expression with disease recurrence in prostate cancer. Clin. Cancer Res. 2003, 9, 6357–6362. [Google Scholar]
- Laidler, P.; Dulińska, J.; Lekka, M.; Lekki, J. Expression of prostate specific membrane antigen in androgen-independent prostate cancer cell line PC-3. Arch. Biochem. Biophys. 2005, 435, 1–14. [Google Scholar] [CrossRef]
- Minner, S.; Wittmer, C.; Graefen, M.; Salomon, G.; Steuber, T.; Haese, A.; Huland, H.; Bokemeyer, C.; Yekebas, E.; Dierlamm, J.; et al. High level PSMA expression is associated with early PSA recurrence in surgically treated prostate cancer. Prostate 2011, 71, 281–288. [Google Scholar] [CrossRef]
- Perner, S.; Hofer, M.D.; Kim, R.; Shah, R.B.; Li, H.; Möller, P.; Hautmann, R.E.; Gschwend, J.E.; Kuefer, R.; Rubin, M.A. Prostate-specific membrane antigen expression as a predictor of prostate cancer progression. Hum. Pathol. 2007, 38, 696–701. [Google Scholar] [CrossRef]
- Hupe, M.C.; Philippi, C.; Roth, D.; Kümpers, C.; Ribbat-Idel, J.; Becker, F.; Joerg, V.; Duensing, S.; Lubczyk, V.H.; Kirfel, J.; et al. Expression of Prostate-Specific Membrane Antigen (PSMA) on Biopsies Is an Independent Risk Stratifier of Prostate Cancer Patients at Time of Initial Diagnosis. Front. Oncol. 2018, 8, 623. [Google Scholar] [CrossRef]
- Eapen, R.S.; Nzenza, T.C.; Murphy, D.G.; Hofman, M.S.; Cooperberg, M.; Lawrentschuk, N. PSMA PET applications in the prostate cancer journey: From diagnosis to theranostics. World J. Urol. 2019, 37, 1255–1261. [Google Scholar] [CrossRef] [PubMed]
- Yao, V.; Parwani, A.; Maier, C.; Heston, W.D.; Bacich, D.J. Moderate expression of prostate-specific membrane antigen, a tissue differentiation antigen and folate hydrolase, facilitates prostate carcinogenesis. Cancer Res. 2008, 68, 9070–9077. [Google Scholar] [CrossRef] [PubMed][Green Version]
- Effert, P.; Beniers, A.J.; Tamimi, Y.; Handt, S.; Jakse, G. Expression of glucose transporter 1 (Glut-1) in cell lines and clinical specimens from human prostate adenocarcinoma. Anticancer Res. 2004, 24, 3057–3063. [Google Scholar] [PubMed]
- De Marzo, A.M.; DeWeese, T.L.; Platz, E.A.; Meeker, A.K.; Nakayama, M.; Epstein, J.I.; Isaacs, W.B.; Nelson, W.G. Pathological and molecular mechanisms of prostate carcinogenesis: Implications for diagnosis, detection, prevention, and treatment. J. Cell. Biochem. 2004, 91, 459–477. [Google Scholar] [CrossRef]
- Lee, H.; Lee, M.; Hong, S.K. CRTC2 as a novel prognostic biomarker for worse pathologic outcomes and biochemical recurrence after radical prostatectomy in patients with prostate cancer. Investig. Clin. Urol. 2019, 60, 84–90. [Google Scholar] [CrossRef] [PubMed]
- Caromile, L.A.; Shapiro, L.H. PSMA redirects MAPK to PI3K-AKT signaling to promote prostate cancer progression. Mol. Cell. Oncol. 2017, 4, e1321168. [Google Scholar] [CrossRef] [PubMed]
- Kim, S.W.; Roh, J.; Park, C.S. Immunohistochemistry for Pathologists: Protocols, Pitfalls, and Tips. J. Pathol. Transl. Med. 2016, 50, 411–418. [Google Scholar] [CrossRef] [PubMed]
- Fedchenko, N.; Reifenrath, J. Different approaches for interpretation and reporting of immunohistochemistry analysis results in the bone tissue—A review. Diagn. Pathol. 2014, 9, 221. [Google Scholar] [CrossRef]
- McCarty, K.S., Jr.; Miller, L.S.; Cox, E.B.; Konrath, J.; McCarty, K.S., Sr. Estrogen receptor analyses. Correlation of biochemical and immunohistochemical methods using monoclonal antireceptor antibodies. Arch. Pathol. Lab. Med. 1985, 109, 716–721. [Google Scholar]


| Clinical Characteristics | Mean (Range) | |
|---|---|---|
| Age at diagnosis (years) | 71.3 (52–84) | |
| Serum PSA level (ng/mL) | 6.43 (1.80–15) | |
| Prostate Cancer Grade | ISUP Grade Group (Gleason Score) | N (%) |
| 1 (3 + 3 = 6) | 24 (71%) | |
| 2 (3 + 4 = 7) | 10 (29%) | |
| Variable | HR (95% CI) | p-Value |
|---|---|---|
| Univariate analysis | ||
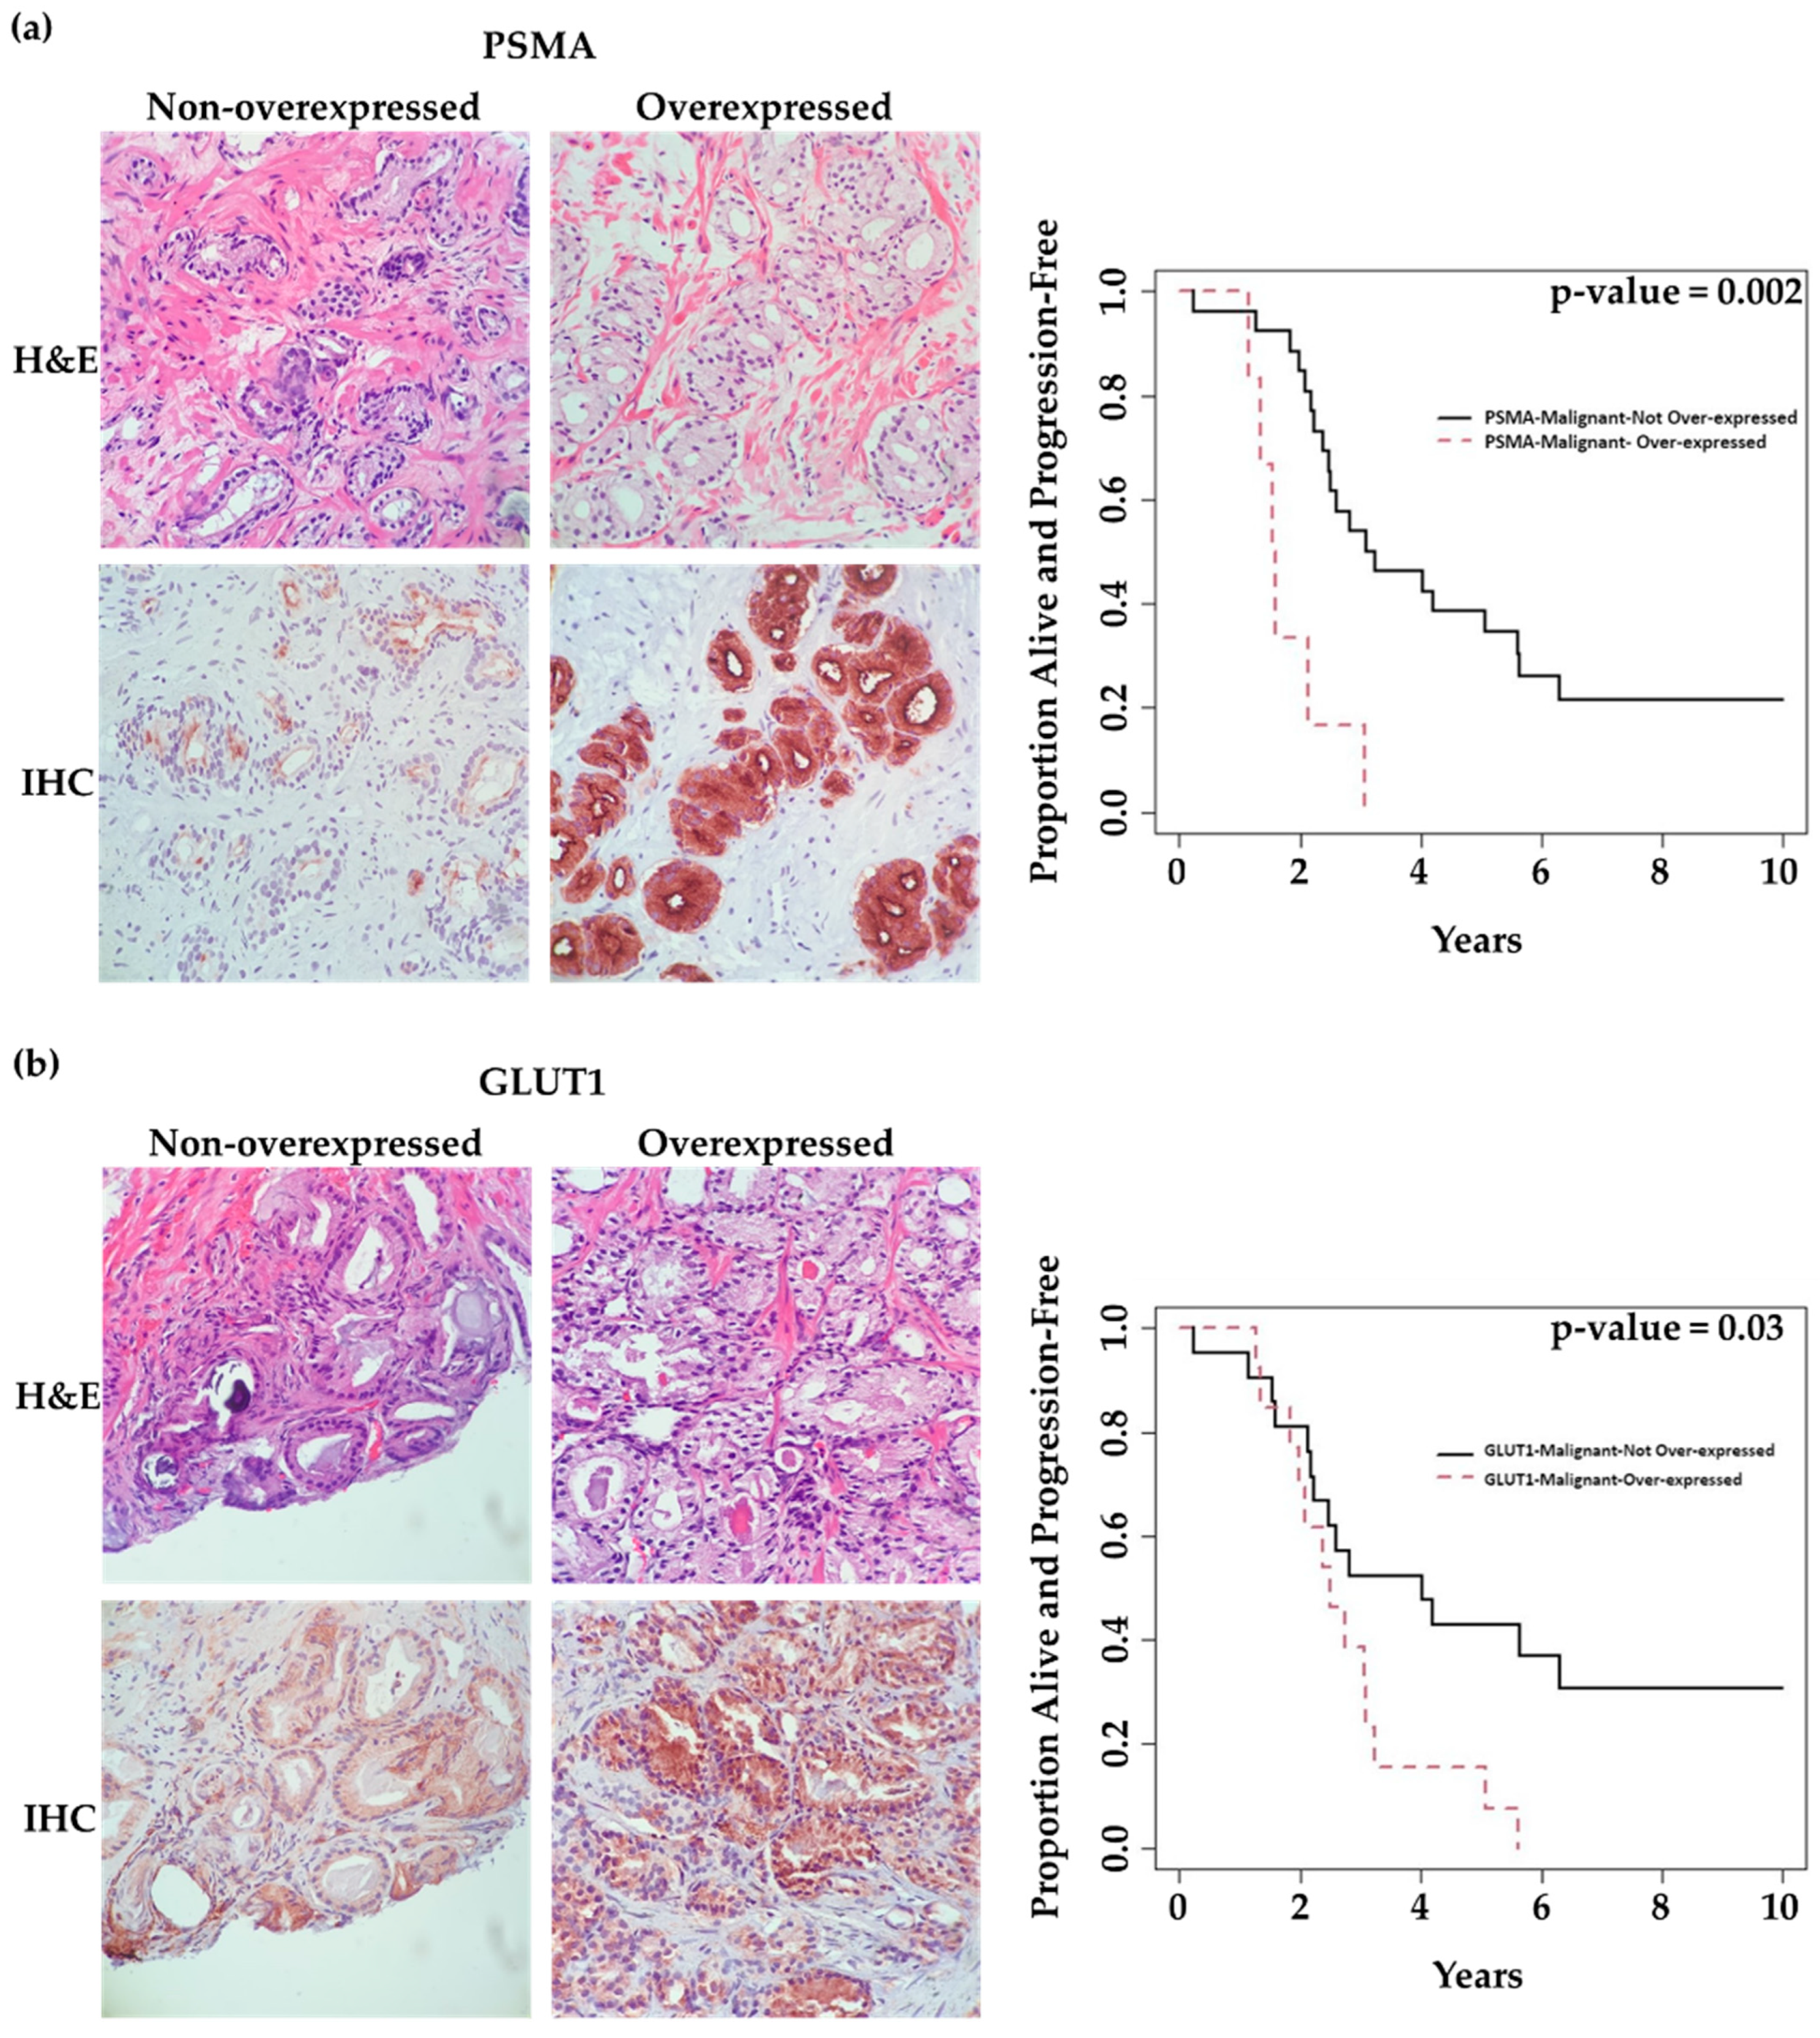
| PSMA-Malignant | 5.06 (1.83, 13.94) | 0.002 |
| PSMA-Benign | 2.10 (0.71, 6.26) | 0.18 |
| GLUT1-Malignant | 2.44 (1.10, 5.44) | 0.03 |
| GLUT1-Benign | 1.65 (0.65, 4.16) | 0.29 |
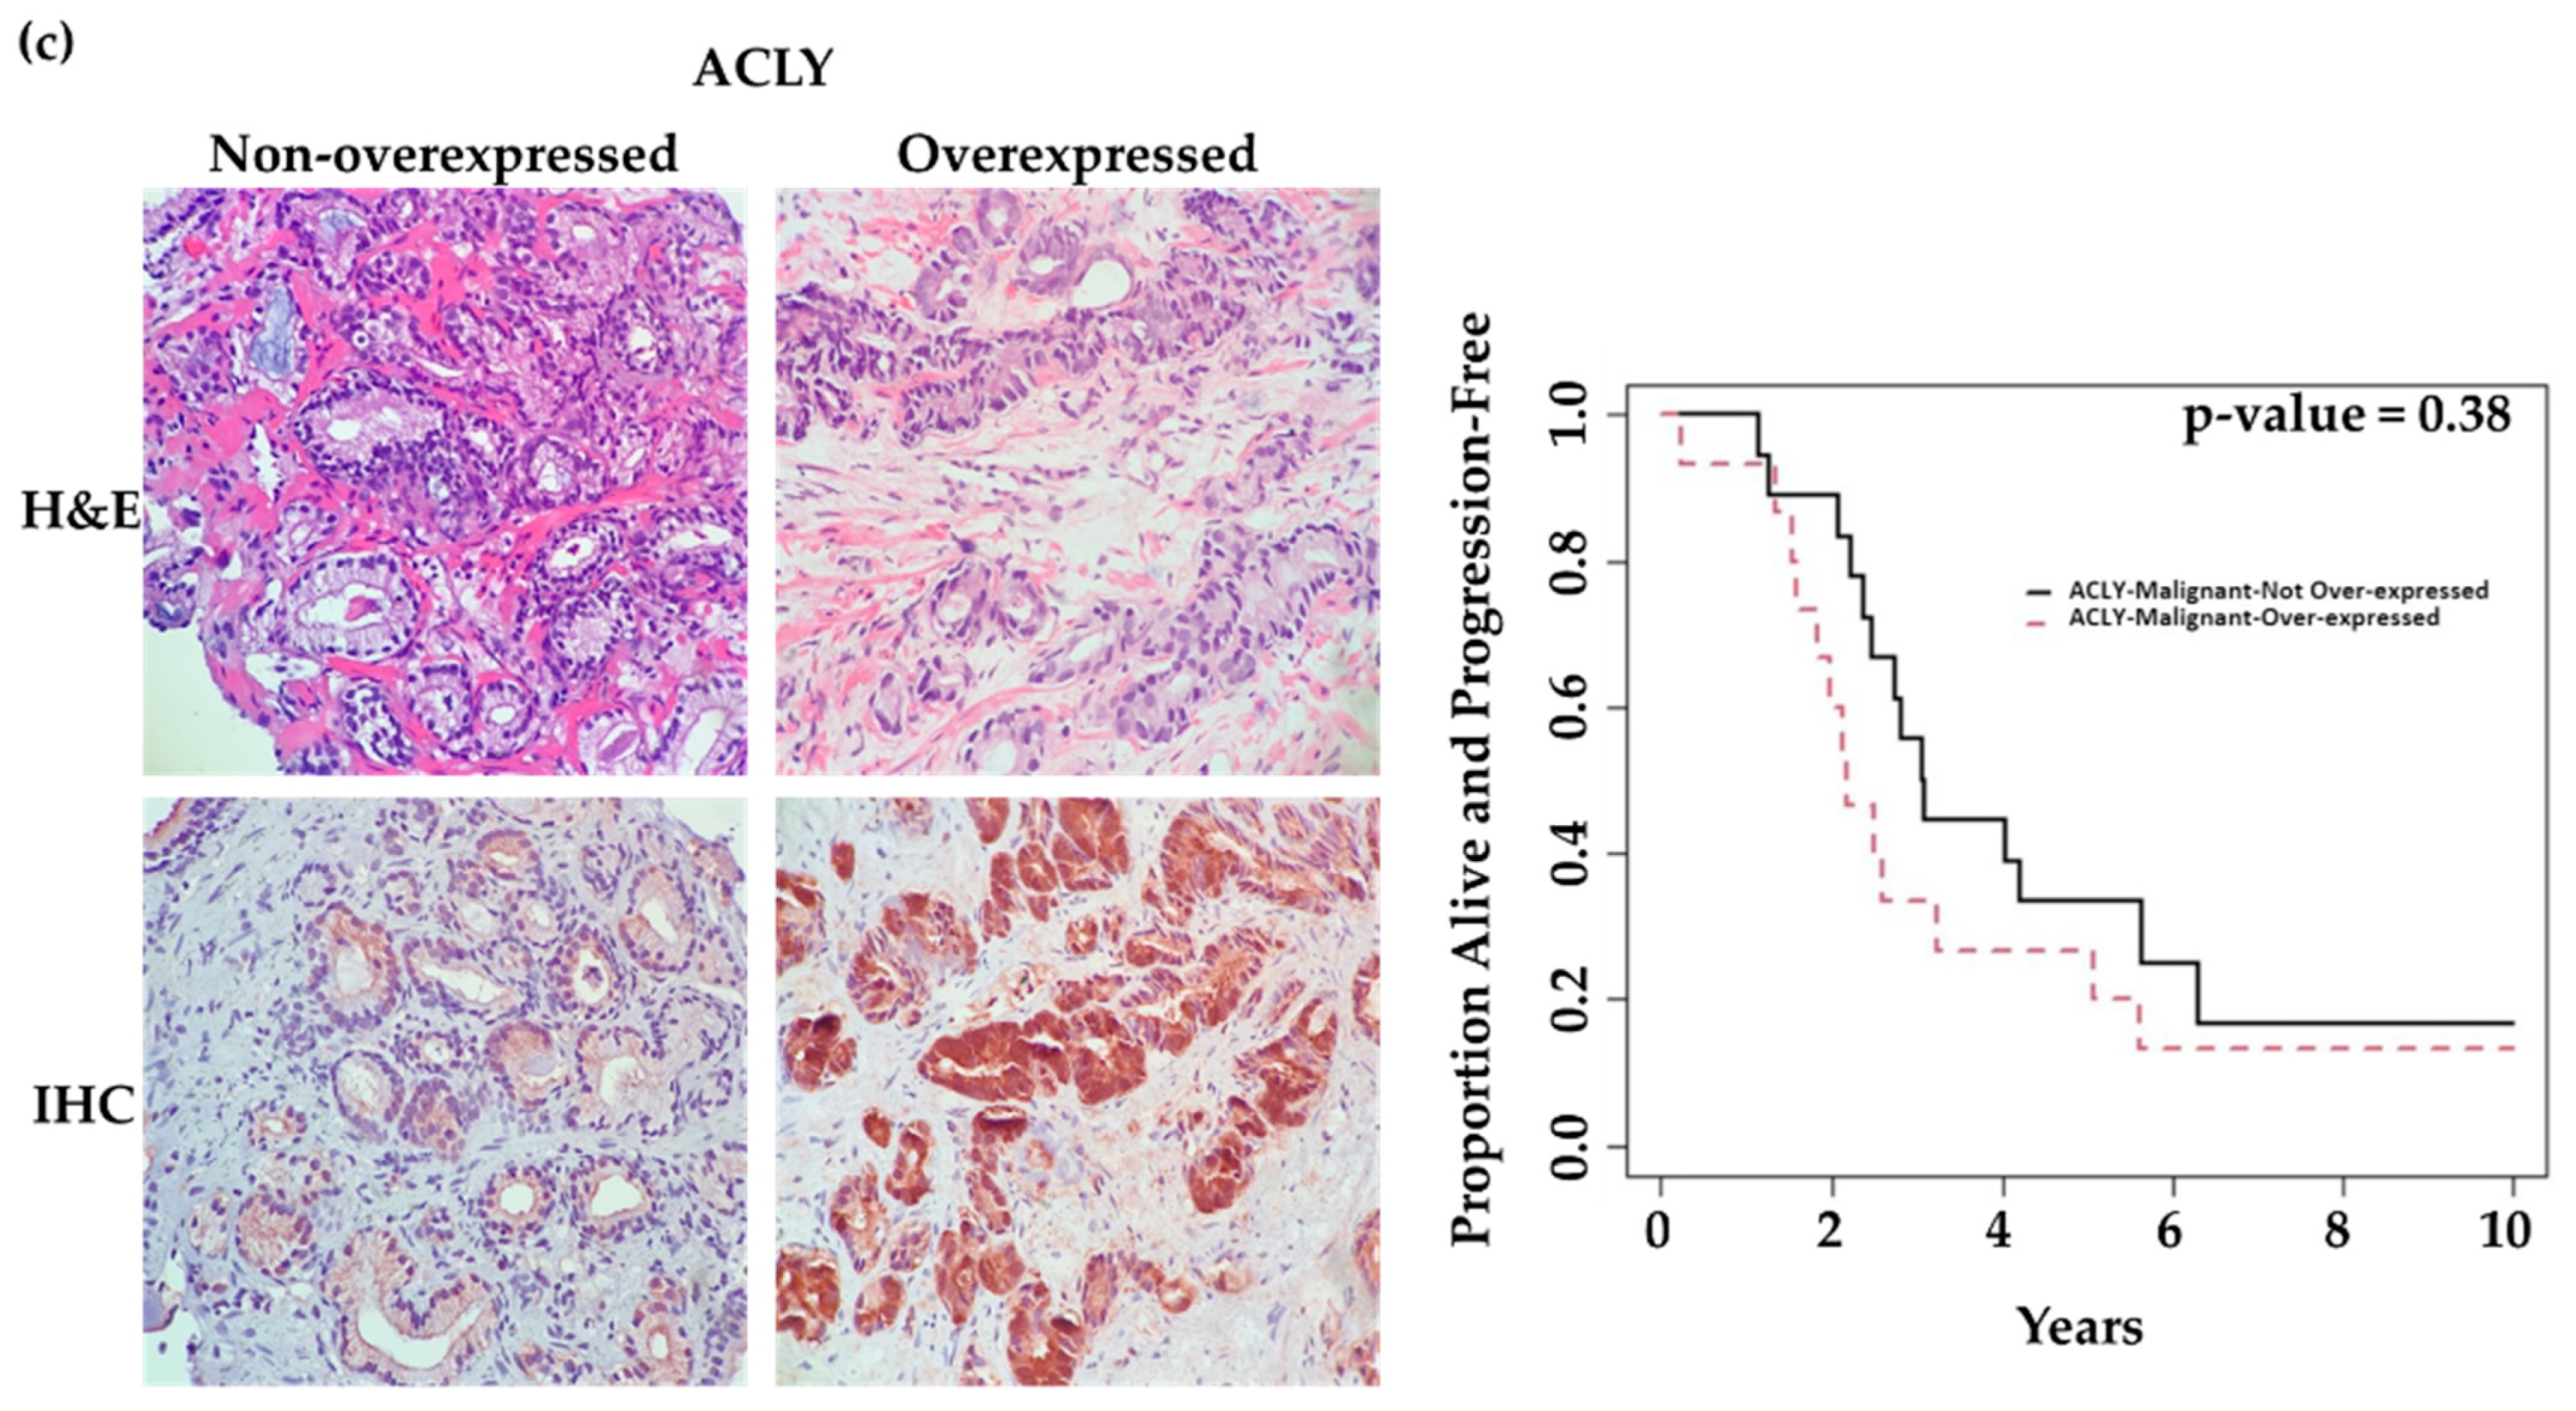
| ACLY-Malignant | 1.40 (0.66, 2.95) | 0.38 |
| ACLY-Benign | 0.65 (0.27, 1.53) | 0.32 |
| Multivariate analysis | ||
| PSMA-Malignant | 4.22 (1.52, 11.67) | 0.006 |
| GLUT1-Malignant | 1.95 (0.84, 4.51) | 0.12 |
Disclaimer/Publisher’s Note: The statements, opinions and data contained in all publications are solely those of the individual author(s) and contributor(s) and not of MDPI and/or the editor(s). MDPI and/or the editor(s) disclaim responsibility for any injury to people or property resulting from any ideas, methods, instructions or products referred to in the content. |
© 2023 by the authors. Licensee MDPI, Basel, Switzerland. This article is an open access article distributed under the terms and conditions of the Creative Commons Attribution (CC BY) license (https://creativecommons.org/licenses/by/4.0/).
Share and Cite
Ahmadi, E.; Wang, S.; Gouran-Savadkoohi, M.; Douvi, G.; Isfahanian, N.; Tsakiridis, N.; Faught, B.E.; Cutz, J.-C.; Sur, M.; Chawla, S.; et al. Prostate-Specific Membrane Antigen (PSMA) Expression Predicts Need for Early Treatment in Prostate Cancer Patients Managed with Active Surveillance. Int. J. Mol. Sci. 2023, 24, 16022. https://doi.org/10.3390/ijms242216022
Ahmadi E, Wang S, Gouran-Savadkoohi M, Douvi G, Isfahanian N, Tsakiridis N, Faught BE, Cutz J-C, Sur M, Chawla S, et al. Prostate-Specific Membrane Antigen (PSMA) Expression Predicts Need for Early Treatment in Prostate Cancer Patients Managed with Active Surveillance. International Journal of Molecular Sciences. 2023; 24(22):16022. https://doi.org/10.3390/ijms242216022
Chicago/Turabian StyleAhmadi, Elham, Simon Wang, Mohammad Gouran-Savadkoohi, Georgia Douvi, Naghmeh Isfahanian, Nicole Tsakiridis, Brent E. Faught, Jean-Claude Cutz, Monalisa Sur, Satish Chawla, and et al. 2023. "Prostate-Specific Membrane Antigen (PSMA) Expression Predicts Need for Early Treatment in Prostate Cancer Patients Managed with Active Surveillance" International Journal of Molecular Sciences 24, no. 22: 16022. https://doi.org/10.3390/ijms242216022
APA StyleAhmadi, E., Wang, S., Gouran-Savadkoohi, M., Douvi, G., Isfahanian, N., Tsakiridis, N., Faught, B. E., Cutz, J.-C., Sur, M., Chawla, S., Pond, G. R., Steinberg, G. R., Brown, I., & Tsakiridis, T. (2023). Prostate-Specific Membrane Antigen (PSMA) Expression Predicts Need for Early Treatment in Prostate Cancer Patients Managed with Active Surveillance. International Journal of Molecular Sciences, 24(22), 16022. https://doi.org/10.3390/ijms242216022