

Emerging Perspectives on the Rare Tubulopathy Dent Disease: Is Glomerular Damage a Direct Consequence of ClC-5 Dysfunction?

 , , , ,
Abstract
1. Introduction
2. Results
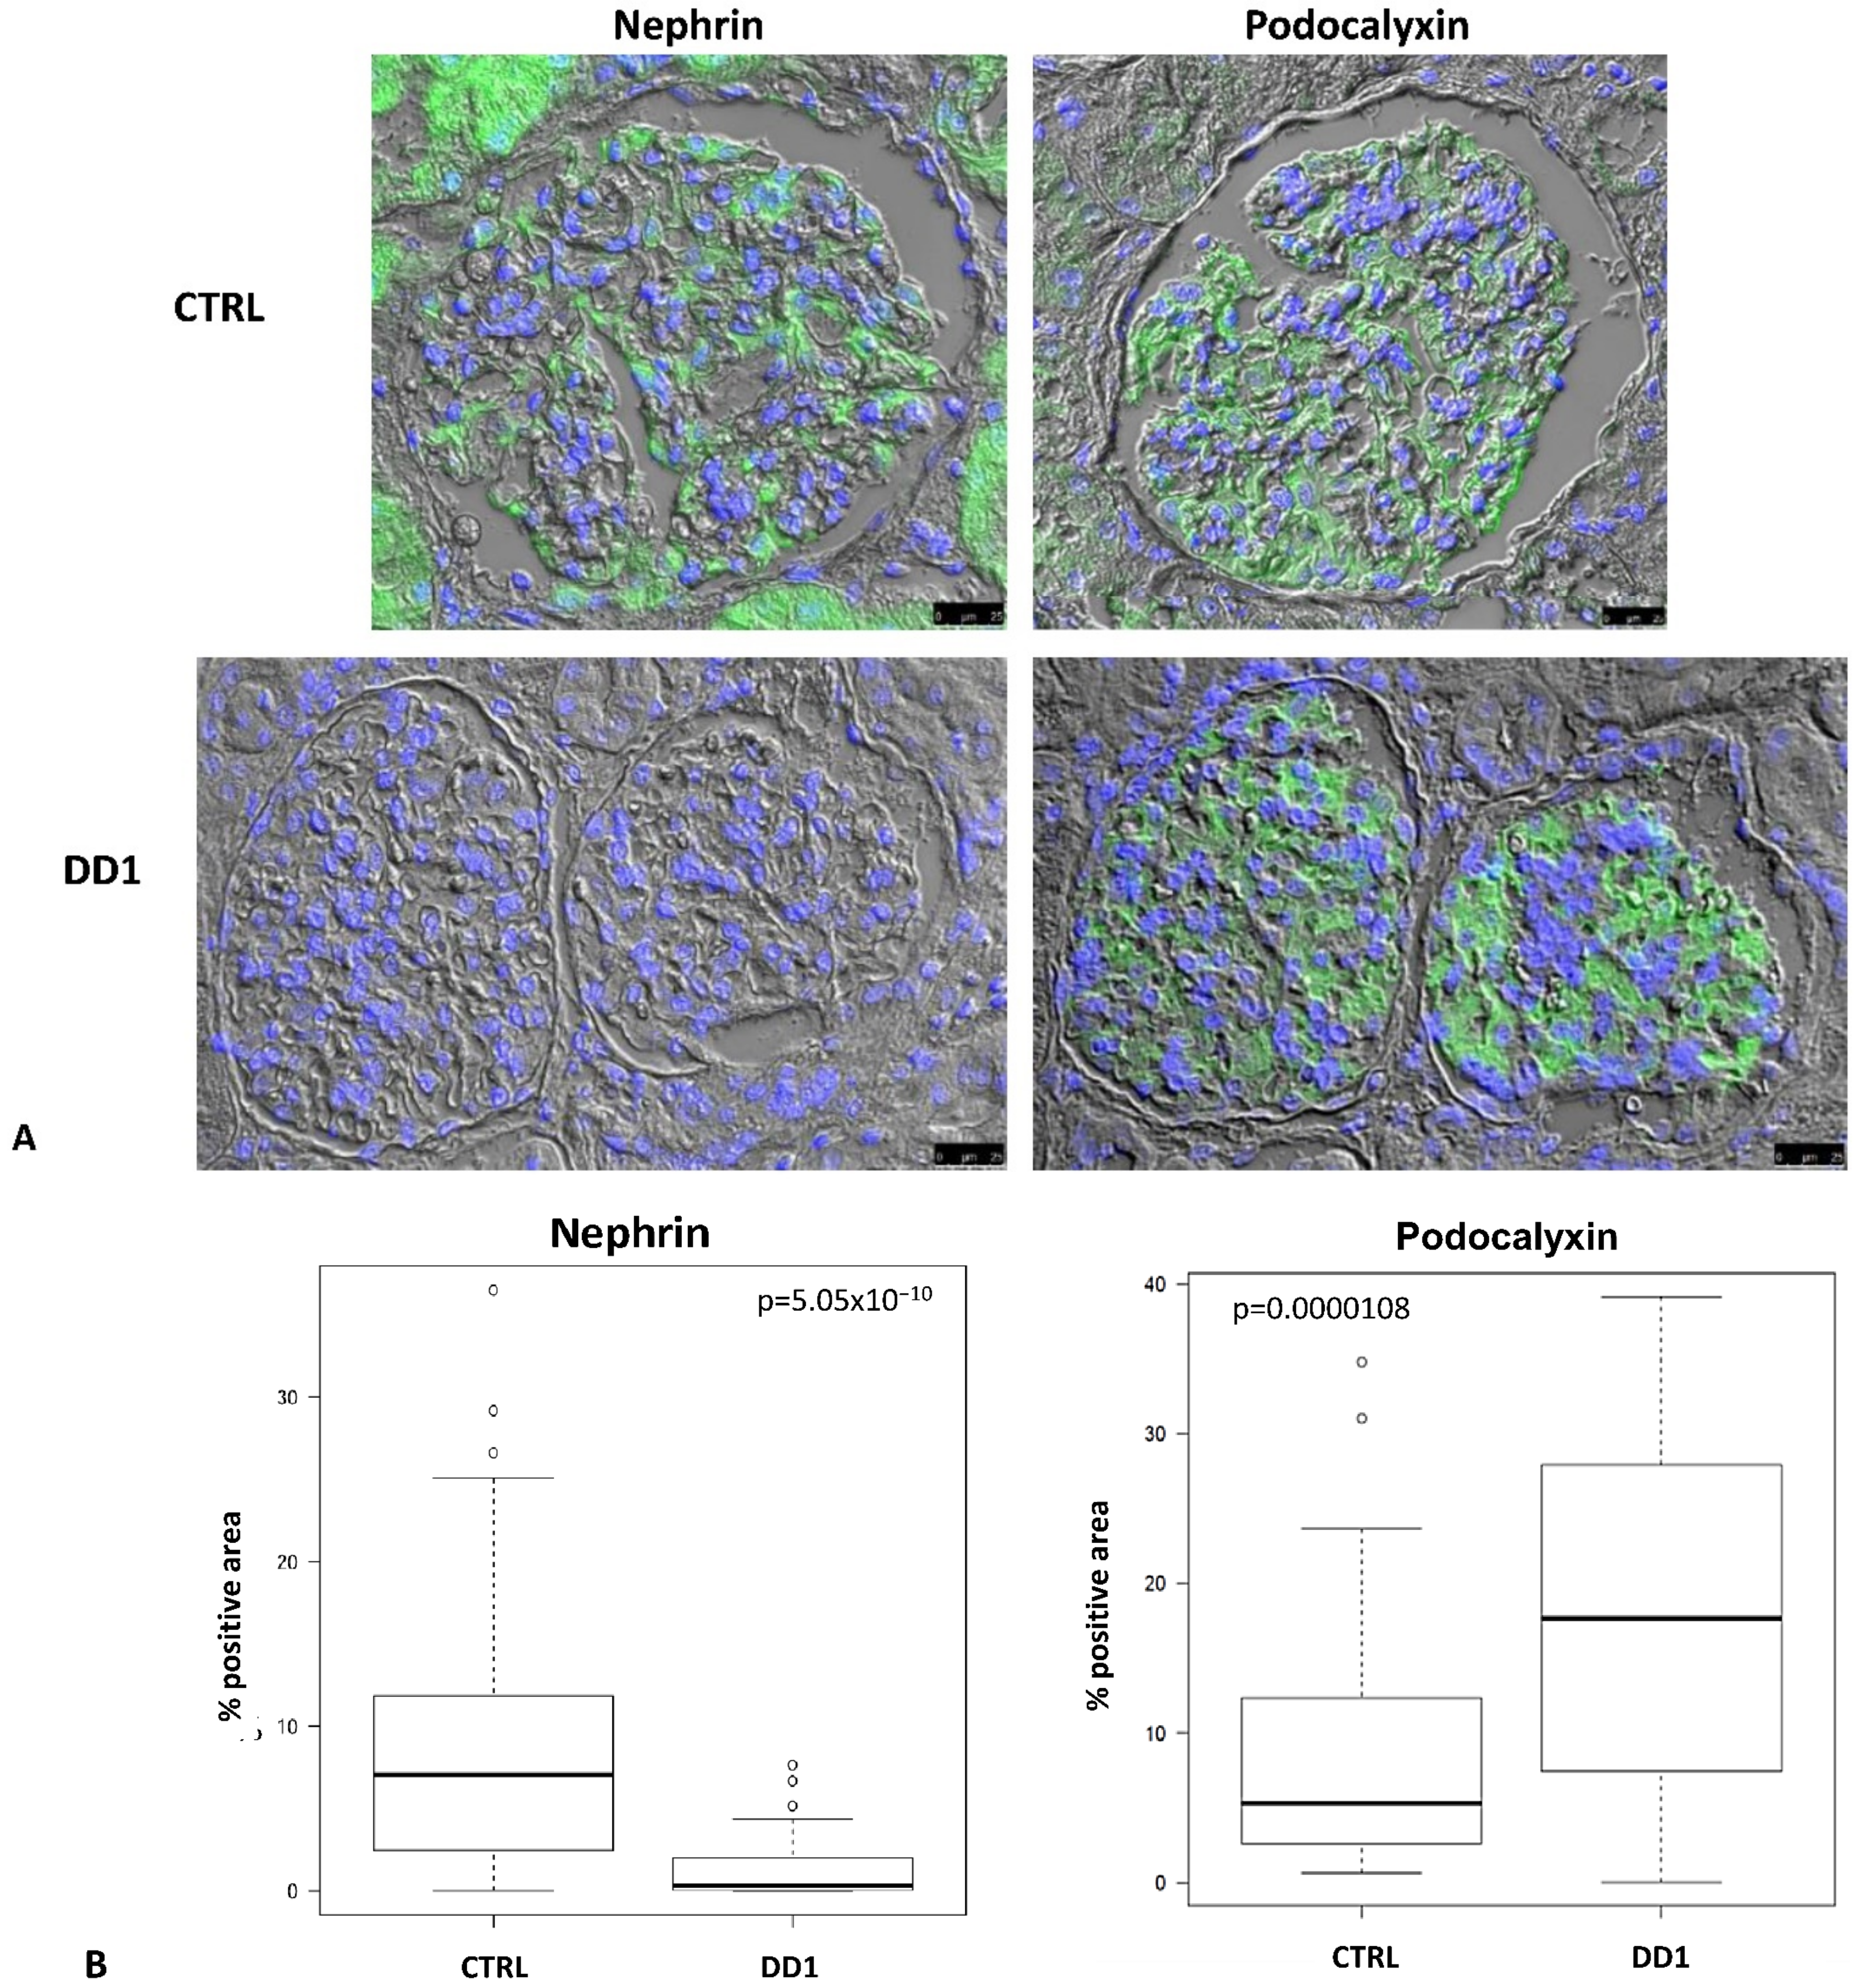
2.1. Biopsies
2.2. Generation of CLCN5 Mutant Human Podocyte Cells through CRISPR/Cas9 Genome Editing
2.3. Qualitative Analysis of CLCN5 mRNA in Mutant Clones
2.4. Effects of CLCN5 Downregulation on Human Podocyte Cells
2.4.1. CLCN5 Downregulation Alters Nephrin Expression
2.4.2. CLCN5 Downregulation Alters Podocyte Actin Cytoskeleton
2.5. Effects of CLCN5 Downregulation on Human Podocyte Cells Treated with Albumin
2.5.1. Albumin Modulates ClC-5, Nephrin and Cubilin Expression
2.5.2. Albumin Alters Podocyte Actin Cytoskeleton
3. Discussion
4. Materials and Methods
4.1. Renal Biopsies
4.1.1. Immunohistochemistry
4.1.2. Immunofluorescence
4.1.3. Morphometric Analysis
4.2. Creation of CLCN5 Mutant Podocyte Cell Clones
4.2.1. Human Podocytes
4.2.2. CRISPR/Cas9-Mediated Genome Editing
4.2.3. CLCN5 Mutation Analysis
High Resolution Melting (HRM) Analysis
Sanger Sequencing
4.3. Albumin Treatment of Podocyte Cell Clones
4.4. Quantitative Analysis of Clones’ mRNA
4.4.1. Reverse Transcription
4.4.2. Real Time PCR
4.5. Qualitative Analysis of CLCN5 mRNA
4.6. Protein Expression in Podocyte Cell Clones
4.6.1. In-Cell Western (ICW)
4.6.2. F-Actin Cytoskeleton Staining
4.7. Cell Viability Assessment
4.8. Statistical Analysis
Supplementary Materials
Author Contributions
Funding
Institutional Review Board Statement
Informed Consent Statement
Data Availability Statement
Acknowledgments
Conflicts of Interest
References
- Jentsch, T.J.; Günther, W.; Pusch, M.; Schwappach, B. Properties of Voltage-Gated Chloride Channels of the ClC Gene Family. J. Physiol. 1995, 482, 19S–25S. [Google Scholar] [CrossRef] [PubMed]
- Thakker, R.V. Chloride Channels Cough Up. Nat. Genet. 1997, 17, 125–127. [Google Scholar] [CrossRef] [PubMed]
- Waldegger, S.; Jentsch, T.J. From Tonus to Tonicity: Physiology of CLC chloride Channels. J. Am. Soc. Nephrol. 2000, 11, 1331–1339. Available online: https://edoc.mdc-berlin.de/10793/ (accessed on 4 October 2022). [CrossRef] [PubMed]
- Hryciw, D.H.; Ekberg, J.; Pollock, C.A.; Poronnik, P. ClC-5: A Chloride Channel with Multiple Roles in Renal Tubular Albumin Uptake. Int. J. Biochem. Cell Biol. 2006, 38, 1036–1042. [Google Scholar] [CrossRef] [PubMed]
- Edvardsson, V.O.; Goldfarb, D.S.; Lieske, J.C.; Beara-Lasic, L.; Anglani, F.; Milliner, D.S.; Palsson, R. Hereditary Causes of Kidney Stones and Chronic Kidney Disease. Pediatr. Nephrol. Berl. Ger. 2013, 28, 1923–1942. [Google Scholar] [CrossRef]
- Christensen, E.I.; Birn, H.; Storm, T.; Weyer, K.; Nielsen, R. Endocytic Receptors in the Renal Proximal Tubule. Physiology 2012, 27, 223–236. [Google Scholar] [CrossRef]
- Gianesello, L.; Ceol, M.; Priante, G.; Anglani, F.; Prete, D.D. Proteins Lost and Found: Not Only a Tubular Matter. J. Clin. Nephrol. Kidney Dis. 2016, 1, 1002. [Google Scholar]
- Copelovitch, L.; Nash, M.A.; Kaplan, B.S. Hypothesis: Dent Disease Is an Underrecognized Cause of Focal Glomerulosclerosis. Clin. J. Am. Soc. Nephrol. 2007, 2, 914–918. [Google Scholar] [CrossRef]
- Frishberg, Y.; Dinour, D.; Belostotsky, R.; Becker-Cohen, R.; Rinat, C.; Feinstein, S.; Navon-Elkan, P.; Ben-Shalom, E. Dent’s Disease Manifesting as Focal Glomerulosclerosis: Is It the Tip of the Iceberg? Pediatr. Nephrol. 2009, 24, 2369–2374. [Google Scholar] [CrossRef]
- Kaneko, K.; Hasui, M.; Hata, A.; Hata, D.; Nozu, K. Focal Segmental Glomerulosclerosis in a Boy with Dent-2 Disease. Pediatr. Nephrol. 2010, 25, 781–783. [Google Scholar] [CrossRef]
- De Mutiis, C.; Pasini, A.; La Scola, C.; Pugliese, F.; Montini, G. Nephrotic-Range Albuminuria as the Presenting Symptom of Dent-2 Disease. Ital. J. Pediatr. 2015, 41, 46. [Google Scholar] [CrossRef]
- Cramer, M.T.; Charlton, J.R.; Fogo, A.B.; Fathallah-Shaykh, S.A.; Askenazi, D.J.; Guay-Woodford, L.M. Expanding the Phenotype of Proteinuria in Dent Disease. A Case Series. Pediatr. Nephrol. 2014, 29, 2051–2054. [Google Scholar] [CrossRef]
- Wang, X.; Anglani, F.; Beara-Lasic, L.; Mehta, A.J.; Vaughan, L.E.; Hernandez, L.H.; Cogal, A.; Scheinman, S.J.; Ariceta, G.; Isom, R.; et al. Glomerular Pathology in Dent Disease and Its Association with Kidney Function. Clin. J. Am. Soc. Nephrol. 2016, 11, 2168–2176. [Google Scholar] [CrossRef]
- Birn, H.; Christensen, E.I. Renal Albumin Absorption in Physiology and Pathology. Kidney Int. 2006, 69, 440–449. [Google Scholar] [CrossRef]
- Pawluczyk, I.Z.A.; Pervez, A.; Ghaderi Najafabadi, M.; Saleem, M.A.; Topham, P.S. The Effect of Albumin on Podocytes: The Role of the Fatty Acid Moiety and the Potential Role of CD36 Scavenger Receptor. Exp. Cell Res. 2014, 326, 251–258. [Google Scholar] [CrossRef]
- Dobrinskikh, E.; Okamura, K.; Kopp, J.B.; Doctor, R.B.; Blaine, J. Human Podocytes Perform Polarized, Caveolae-Dependent Albumin Endocytosis. Am. J. Physiol.-Ren. Physiol. 2014, 306, F941–F951. [Google Scholar] [CrossRef]
- Prabakaran, T.; Nielsen, R.; Larsen, J.V.; Sørensen, S.S.; Rasmussen, U.F.; Saleem, M.A.; Petersen, C.M.; Verroust, P.J.; Christensen, E.I. Receptor-Mediated Endocytosis of α-Galactosidase A in Human Podocytes in Fabry Disease. PLoS ONE 2011, 6, e25065. [Google Scholar] [CrossRef]
- Prabakaran, T.; Christensen, E.I.; Nielsen, R.; Verroust, P.J. Cubilin Is Expressed in Rat and Human Glomerular Podocytes. Nephrol. Dial. Transplant. 2012, 27, 3156–3159. [Google Scholar] [CrossRef]
- Ceol, M.; Tiralongo, E.; Baelde, H.J.; Vianello, D.; Betto, G.; Marangelli, A.; Bonfante, L.; Valente, M.; Della Barbera, M.; D’Angelo, A.; et al. Involvement of the Tubular ClC-Type Exchanger ClC-5 in Glomeruli of Human Proteinuric Nephropathies. PLoS ONE 2012, 7, e45605. [Google Scholar] [CrossRef]
- Gianesello, L.; Priante, G.; Ceol, M.; Radu, C.M.; Saleem, M.A.; Simioni, P.; Terrin, L.; Anglani, F.; Del Prete, D. Albumin Uptake in Human Podocytes: A Possible Role for the Cubilin-Amnionless (CUBAM) Complex. Sci. Rep. 2017, 7, 13705. [Google Scholar] [CrossRef]
- Inoue, K.; Ishibe, S. Podocyte Endocytosis in the Regulation of the Glomerular Filtration Barrier. Am. J. Physiol.-Ren. Physiol. 2015, 309, F398–F405. [Google Scholar] [CrossRef] [PubMed]
- Huber, T.B.; Benzing, T. The Slit Diaphragm: A Signaling Platform to Regulate Podocyte Function. Curr. Opin. Nephrol. Hypertens. 2005, 14, 211–216. [Google Scholar] [CrossRef] [PubMed]
- Tryggvason, K.; Patrakka, J.; Wartiovaara, J. Hereditary Proteinuria Syndromes and Mechanisms of Proteinuria. N. Engl. J. Med. 2006, 354, 1387–1401. [Google Scholar] [CrossRef] [PubMed]
- Brinkkoetter, P.T.; Ising, C.; Benzing, T. The Role of the Podocyte in Albumin Filtration. Nat. Rev. Nephrol. 2013, 9, 328–336. [Google Scholar] [CrossRef] [PubMed]
- Gianesello, L.; Del Prete, D.; Anglani, F.; Calò, L.A. Genetics and Phenotypic Heterogeneity of Dent Disease: The Dark Side of the Moon. Hum. Genet. 2021, 140, 401–421. [Google Scholar] [CrossRef]
- Dabrowski, M.; Bukowy-Bieryllo, Z.; Zietkiewicz, E. Translational Readthrough Potential of Natural Termination Codons in Eucaryotes—The Impact of RNA Sequence. RNA Biol. 2015, 12, 950–958. [Google Scholar] [CrossRef]
- Zhu, Y.; Deng, H.; Chen, X.; Li, H.; Yang, C.; Li, S.; Pan, X.; Tian, S.; Feng, S.; Tan, X.; et al. Skipping of an Exon with a Nonsense Mutation in the DMD Gene Is Induced by the Conversion of a Splicing Enhancer to a Splicing Silencer. Hum. Genet. 2019, 138, 771–785. [Google Scholar] [CrossRef]
- Frischmeyer, P.A.; Dietz, H.C. Nonsense-Mediated MRNA Decay in Health and Disease. Hum. Mol. Genet. 1999, 8, 1893–1900. [Google Scholar] [CrossRef]
- Jentsch, T.J.; Pusch, M. CLC Chloride Channels and Transporters: Structure, Function, Physiology, and Disease. Physiol. Rev. 2018, 98, 1493–1590. [Google Scholar] [CrossRef]
- Morigi, M.; Buelli, S.; Angioletti, S.; Zanchi, C.; Longaretti, L.; Zoja, C.; Galbusera, M.; Gastoldi, S.; Mundel, P.; Remuzzi, G.; et al. In Response to Protein Load Podocytes Reorganize Cytoskeleton and Modulate Endothelin-1 Gene. Am. J. Pathol. 2005, 166, 1309–1320. [Google Scholar] [CrossRef]
- Perico, L.; Conti, S.; Benigni, A.; Remuzzi, G. Podocyte–Actin Dynamics in Health and Disease. Nat. Rev. Nephrol. 2016, 12, 692–710. [Google Scholar] [CrossRef]
- Hryciw, D.H.; Wang, Y.; Devuyst, O.; Pollock, C.A.; Poronnik, P.; Guggino, W.B. Cofilin Interacts with ClC-5 and Regulates Albumin Uptake in Proximal Tubule Cell Lines. J. Biol. Chem. 2003, 278, 40169–40176. [Google Scholar] [CrossRef]
- Solanki, A.K.; Arif, E.; Morinelli, T.; Wilson, R.C.; Hardiman, G.; Deng, P.; Arthur, J.M.; Velez, J.C.; Nihalani, D.; Janech, M.G.; et al. A Novel CLCN5 Mutation Associated With Focal Segmental Glomerulosclerosis and Podocyte Injury. Kidney Int. Rep. 2018, 3, 1443–1453. [Google Scholar] [CrossRef]
- Gianesello, L.; Ceol, M.; Bertoldi, L.; Terrin, L.; Priante, G.; Murer, L.; Peruzzi, L.; Giordano, M.; Paglialonga, F.; Cantaluppi, V.; et al. Genetic Analyses in Dent Disease and Characterization of CLCN5 Mutations in Kidney Biopsies. Int. J. Mol. Sci. 2020, 21, 516. [Google Scholar] [CrossRef]
- Saleem, M.A.; O’Hare, M.J.; Reiser, J.; Coward, R.J.; Inward, C.D.; Farren, T.; Xing, C.Y.; Ni, L.; Mathieson, P.W.; Mundel, P. A Conditionally Immortalized Human Podocyte Cell Line Demonstrating Nephrin and Podocin Expression. J. Am. Soc. Nephrol. 2002, 13, 630–638. [Google Scholar] [CrossRef]
- Oliveros, J.C.; Franch, M.; Tabas-Madrid, D.; San-León, D.; Montoliu, L.; Cubas, P.; Pazos, F. Breaking-Cas-Interactive Design of Guide RNAs for CRISPR-Cas Experiments for ENSEMBL Genomes. Nucleic Acids Res. 2016, 44, W267–W271. [Google Scholar] [CrossRef]
- Tosetto, E.; Ghiggeri, G.M.; Emma, F.; Barbano, G.; Carrea, A.; Vezzoli, G.; Torregrossa, R.; Cara, M.; Ripanti, G.; Ammenti, A.; et al. Phenotypic and Genetic Heterogeneity in Dent’s Disease--the Results of an Italian Collaborative Study. Nephrol. Dial. Transplant. 2006, 21, 2452–2463. [Google Scholar] [CrossRef]
- Bustin, S.A.; Benes, V.; Garson, J.A.; Hellemans, J.; Huggett, J.; Kubista, M.; Mueller, R.; Nolan, T.; Pfaffl, M.W.; Shipley, G.L.; et al. The MIQE Guidelines: Minimum Information for Publication of Quantitative Real-Time PCR Experiments. Clin. Chem. 2009, 55, 611–622. [Google Scholar] [CrossRef]
- Oliver, M.H.; Harrison, N.K.; Bishop, J.E.; Cole, P.J.; Laurent, G.J. A Rapid and Convenient Assay for Counting Cells Cultured in Microwell Plates: Application for Assessment of Growth Factors. J. Cell Sci. 1989, 92, 513–518. [Google Scholar] [CrossRef]
- Priante, G.; Quaggio, F.; Gianesello, L.; Ceol, M.; Cristofaro, R.; Terrin, L.; Furlan, C.; Del Prete, D.; Anglani, F. Caspase-Independent Programmed Cell Death Triggers Ca2PO4 Deposition in an in Vitro Model of Nephrocalcinosis. Biosci. Rep. 2018, 38, BSR20171228. [Google Scholar] [CrossRef]
- R Core Team. R: A Language and Environment for Statistical Computing; R Foundation for Statistical Computing: Vienna, Austria, 2020. [Google Scholar]


| DD1 | ClC-5 Mutation | Age at Biopsy (Years) | Indication for Biopsy | Proteinuria | Number of Glomeruli Examined | Number of Glomeruli with Global Sclerosis | Podocytes Structure (TEM) |
|---|---|---|---|---|---|---|---|
| a | p.(Q600*) | 6 | proteinuria | 1.2 g/day | 18 | 5 | foot process effacement |
| b | p.(R34*) | 11 | Nephrotic syndrome | 1.6 g/day | 16 | 8 | foot process effacement |
| c | p.(V308M) | 9 | proteinuria and hematuria | 0.5 g/day | 29 | 1 | normal |
| CTRL (n = 4) | N/A | 55 (range 41–67) | N/A | N/A | 47 | 0 | N/A |
| Target | Clone | Host | Manufacturer | Code | Conjugation | Dilution IHC | Dilution IF | Dilution ICW | |
|---|---|---|---|---|---|---|---|---|---|
| primary antibody | ClC-5 | - | rabbit | ATLAS ANTIBODY | HPA000401 | 1:200 | 1:200 | ||
| ClC-3 | K-17 | goat | Santa Cruz Biotechnology | sc-17572 | 1:50 | ||||
| ClC-4 | - | rabbit | ATLAS ANTIBODY | HPA063637 | 1:150 | ||||
| Cubilin | - | sheep | R&D Systems | AF3700 | 1:200 | ||||
| Nephrin | - | guinea pig | Progen | GP-N2 | 1:25 | 1:25 | |||
| Podocalyxin | 4F10 | mouse | Santa Cruz Biothecnology | sc-23903 | 1:100 | ||||
| IHC | anti-rabbit | - | - | Dako | K4002 | EnVision + System-HRP Labeled Polymer | Reedy to use | ||
| IF secondary antibody | Anti-rabbit | - | donkey | Santa Cruz Biotechnology | sc-362291 | CFL 647 | 1:100 | ||
| Anti-guinea pig | donkey | Jackson ImmunoResearch laboratory | 706-545-148 | Alexa 488 | 1:100 | ||||
| Anti-mouse | goat | ThermoFisher Scientific | A-11001 | Alexa 488 | 1:1000 | ||||
| ICW secondary antibody | Anti-rabbit | - | donkey | LI-COR | 926-32213 | IRDye 800CW | 1:800 | ||
| Anti-sheep | - | donkey | ThermoFisher Scientific | A-21102 | Alexa Fluor 680 | 1:1000 | |||
| Anti-goat | - | donkey | LI-COR | 926-32214 | IRDye 800CW | 1:800 | |||
| Anti-guinea pig | - | donkey | LI-COR | 925-32411 | IRDye 800CW | 1:600 |
| Name | NCBI Reference Sequence | Sequence (5′-3′) | [PRIMER] µM | Ta (°C) | Size (bp) | Efficiency (%) |
|---|---|---|---|---|---|---|
| GAPDH For | NM_17851.1 | GAAGGTGAAGGTCGGAGT | 0.4 | 62 | 92 | 96 |
| GAPDH Rev | TGGCAACAATATCCACTTTACCA | 0.4 | ||||
| HPRT1 For | NM_000194.2 | CCTGGCGTCGTGATTAGTGA | 0.4 | 62 | 140 | 86 |
| HPRT1 Rev | TCTCGAGCAAGACGTTCAGT | 0.4 | ||||
| CLCN5 For | NM_000084.4 | TGCTGGAACTCTGAGCATGT | 0.2 | 64 | 162 | 99 |
| CLCN5 Rev | TACGGCAAGGAAGGCAAATA | 0.2 | ||||
| CLCN3 For | NM_001829.4 | TGGAGCAGGTGTTATTATGGAC | 0.4 | 62 | 105 | 94 |
| CLCN3 Rev | ATGCTGCCTCCATTTGTCAT | 0.4 | ||||
| CLCN4 For | NM_001830.4 | GTCGCGCTGAAGAAAGGAT | 0.4 | 62 | 122 | 89 |
| CLCN4 Rev | TCAGGTTTCCAGAGCCACTC | 0.4 | ||||
| CUBN For | NM_001081.3 | GCCGTGAGAAAGGATTTCAG | 0.4 | 62 | 118 | 85 |
| CUBN Rev | TCCTTGTTTGGTGGATACCTG | 0.4 | ||||
| NPHS1 For | NM_004646.3 | CAACTGGGAGAGACTGGGAGAA | 0.2 | 64 | 189 | 87 |
| NPHS1 Rev | AATCTGACAACAAGACGGAGCA | 0.2 |
| Name | NCBI Reference Sequence | Sequence (5′-3′) | [PRIMER] µM | Ta (°C) | Size (bp) | |
|---|---|---|---|---|---|---|
| Canonical isoform CLCN5-204 | 1F | NM_000084.4 | AAGCTCCCCAACCTGAATGA | 20 | 56 | 360 |
| 4R | TGTCTATCAAACCAGCTAACGA | 20 | ||||
| Isoform CLCN5-206 | 8F | CAGCCATCACTGCCATCCTG | 20 | 64 | 630 | |
| 10R | CATCTATGATGCCCACATCCGT | 20 | ||||
| nested 206F | GGCAGCTGGTTTAACACTC | 20 | 60 | 110 | ||
| nested 206R | AGCCTGAACTCTCCAGACCA | 20 |
Disclaimer/Publisher’s Note: The statements, opinions and data contained in all publications are solely those of the individual author(s) and contributor(s) and not of MDPI and/or the editor(s). MDPI and/or the editor(s) disclaim responsibility for any injury to people or property resulting from any ideas, methods, instructions or products referred to in the content. |
© 2023 by the authors. Licensee MDPI, Basel, Switzerland. This article is an open access article distributed under the terms and conditions of the Creative Commons Attribution (CC BY) license (https://creativecommons.org/licenses/by/4.0/).
Share and Cite
Priante, G.; Ceol, M.; Gianesello, L.; Bizzotto, D.; Braghetta, P.; Calò, L.A.; Del Prete, D.; Anglani, F. Emerging Perspectives on the Rare Tubulopathy Dent Disease: Is Glomerular Damage a Direct Consequence of ClC-5 Dysfunction? Int. J. Mol. Sci. 2023, 24, 1313. https://doi.org/10.3390/ijms24021313
Priante G, Ceol M, Gianesello L, Bizzotto D, Braghetta P, Calò LA, Del Prete D, Anglani F. Emerging Perspectives on the Rare Tubulopathy Dent Disease: Is Glomerular Damage a Direct Consequence of ClC-5 Dysfunction? International Journal of Molecular Sciences. 2023; 24(2):1313. https://doi.org/10.3390/ijms24021313
Chicago/Turabian StylePriante, Giovanna, Monica Ceol, Lisa Gianesello, Dario Bizzotto, Paola Braghetta, Lorenzo Arcangelo Calò, Dorella Del Prete, and Franca Anglani. 2023. "Emerging Perspectives on the Rare Tubulopathy Dent Disease: Is Glomerular Damage a Direct Consequence of ClC-5 Dysfunction?" International Journal of Molecular Sciences 24, no. 2: 1313. https://doi.org/10.3390/ijms24021313
APA StylePriante, G., Ceol, M., Gianesello, L., Bizzotto, D., Braghetta, P., Calò, L. A., Del Prete, D., & Anglani, F. (2023). Emerging Perspectives on the Rare Tubulopathy Dent Disease: Is Glomerular Damage a Direct Consequence of ClC-5 Dysfunction? International Journal of Molecular Sciences, 24(2), 1313. https://doi.org/10.3390/ijms24021313