Article

Identification of Key Genes Induced by Different Potassium Levels Provides Insight into the Formation of Fruit Quality in Grapes

College of Horticulture, Sichuan Agricultural University, Chengdu 611130, China
*
Authors to whom correspondence should be addressed.
Int. J. Mol. Sci. 2023, 24(2), 1218; https://doi.org/10.3390/ijms24021218
Submission received: 16 December 2022 / Revised: 3 January 2023 / Accepted: 6 January 2023 / Published: 7 January 2023
(This article belongs to the Section Molecular Plant Sciences)

Abstract

:
Inadequate potassium (K) availability is a common abiotic stress that limits the growth and quality of fruit trees. Few studies have investigated the physiological and molecular responses of grapes at different potassium levels. In this study, an integrated approach was developed for grapevines grown at four different potassium fertilization levels [0 (K0-CK), 150 (K150), 300 (K300), and 450 (K450) g/plant] in combination with metabolite measurements and transcript analysis. The results showed that different K levels affected the accumulation of sugars and anthocyanins in the fruit. At 78 days after bloom (DAB), the K150, K300, and K450 treatments increased soluble sugar content by 37.39%, 31.10% and 32.59%, respectively, and anthocyanin content by 49.78%, 24.10%, and 13.06%, respectively, compared to K0. Weighted gene co-expression network analysis (WGCNA) of DEGs identified a network of 11 grapevines involved. During fruit development, potassium application promoted the accumulation of anthocyanins and sugars in fruit by regulating the up-regulation of GST, AT, UFGT and SPS, HT, PK gene expressions. These results suggest that potassium deficiency inhibits anthocyanin and sugar metabolism. In addition, it promotes the up-regulation of KUP expression, which is the main cause of K accumulation in fruits. Together, our data revealed the molecular mechanism in response to different K levels during fruit quality formation and provides the scientific foundation for the improvement of fruit quality by adding K fertilizer.

1. Introduction

Grape (Vitis vinifera L.) is extremely important to the economies of all countries as a fruit, consumed worldwide as fresh fruit, raisins, and wine [1]. It is becoming more and more popular due to its high nutritional value, good taste, versatility, and high profitability [2]. Worldwide consumption of table grapes has been showing steady improvement [3]. However, how to improve quality has always been a hot topic in viticulture.
Potassium, as a necessary nutrient, plays a significant role in the development of plants, such as enzyme activation, photosynthesis, carbohydrate metabolism, and abiotic stress response [4,5]. Therefore, potassium has an important impact on the yield and quality of grapes. Potassium fertilization significantly increased the soluble solids content of the Sharad Seedless grape, while higher concentrations of potassium treatments increased fruit yield, sugar, and anthocyanin content [6,7]. It was found that K had a significant effect on the sugar accumulation and the increase of the soluble solids in the fruit [8]. The application of potassium treatments can also promote the synthesis of anthocyanins in the peel and improve the coloration of the fruit [9].
There are studies that have reported in detail the physiological mechanisms of potassium in various plants and the molecular pathways concerning the transporters and channels that absorb and mobilize potassium from Arabidopsis root to the organ [10]. In Arabidopsis, there are over 30 membrane proteins that have been found to be specialized in K transport, including Shaker, TPK, Kir-like, HAK/KUP/KT, and KEA, and they have been found to be important in soil K uptake and long-range K transport.
RNA-Seq is an emerging research technique in transcriptomics and is now widely used to analyze expression profiles, analyze splice variants, identify differentially expressed genes, etc. [11]. RNA-Seq is now widely used in plant functional genomics and has become an important tool for plant functional genomics research [12]. There are also many studies on transcriptomics in grapes, and one study using a transcriptomic approach found that transient heat treatment could regulate the expression of malic acid and anthocyanin synthesis-related genes in green and ripe grapes, which facilitated sugar accumulation during the trans-color period [13].Grapevine requires an abundance of potassium nutrients throughout its life cycle [4]. However, grape fertilization usually fails to meet K requirements, leading to improper K supply in many orchards [14]. Therefore, it is very important to investigate the mechanism of molecular response of grape to different K reactions. Therefore, in this study, we analyzed the composition and content of metabolites related to fruit quality in ‘summer black’ grapes, integrated metabolites and transcriptomes using homologue alignment and WGCNA methods for comparative genomic analysis, mined candidate genes related to grape fruit quality, constructed transcriptional regulatory networks, and provided important information for subsequent functional validation of related genes. This will provide important information for the subsequent functional validation of the relevant genes and also lay the foundation for breeding and quality control of grape fruit quality. This study will not only reveal the theoretical mechanism of potassium application to improve fruit quality, but it also has important practical implications for the rational application of potassium fertilizer to fruit trees, and it can provide guidance for efficient and high quality production of grapes.

1.1. Plant Materials and Treatments

The experiment was conducted on 8-year-old ‘summer black’ grape colonized in Sichuan Agricultural University farm (30°55′ N, 103°64′ E); the altitude is about 530 m, and the average annual temperature is 15.9 °C. The soil of the trial garden is sandy loam, the grapes are shaped in ‘Y’ shape, and double film cover is used to avoid rain cultivation. The potassium treatment applied in this test ditch is potassium sulfate, K2O ≥ 52%, produced in Nuoshifu (Weifang, Shandong, China) Agrochemical Co., Ltd.
In addition to other normal managements, four potassium fertilization levels [0 (K0-CK), 150 (K150) (low K), 300 (K300) (low K), and 450 (K450) (high K) g per vine]. In the randomized block experiment, every three trees were a treatment, and each treatment was repeated three times; three trees were spaced between treatments as protection plants. Potassium sulfate was applied at 50 DAB. Samples were collected from 50 DAB and every 7 days until maturity, and a total of 5 samples were collected. During the sampling process, 50 berries were randomly removed from different locations in different bunches of several vines in each treatment, replicated three times, and brought back to the laboratory in ice boxes. Each treatment was brought back to the laboratory for the determination of physiological indicators, such as soluble solids content, soluble sugar, and titratable acid content. Samples were frozen in liquid nitrogen and kept in the refrigerator at −80 °C until used for RNA-Seq.

1.2. Potassium Content in Grape Fruits and Soil

Concentration of K was determined by Liang B et al. [15]. In brief, approximately 0.2g per each sample lyophilized (HNO3, AR, 98%), which were digested and analyzed with ICP-AES ICP6300 (Agilent Inc., Santa Clara, CA, USA).

1.3. Berry Skin Color Measurement

The color was assessed by a CM-2600d colorimeter (Konica Minolta Ltd., Tokyo, Japan), using the CIElab color system. Two equidistant color measurements were performed near the equator of each fruit using L*, a*, b*, and color space units. L* is the luminance (0, black; 100, white), a* is the red/green value (a* > 0, red; a* < 0, green), and b* is the yellow/blue value (b* > 0, yellow; b* < 0 blue).

1.4. Fruit Quality Parameters

A digital refractometer (Hybrid PAL-BX/ACID 1; ATAGO, Tokyo, Japan) was used to measure the soluble solids (SSC), and titratable acid (TA) was measured by using a previously reported acid-base titration [16]. Determination of soluble sugar performed with the anthrone colorimetric method [17]. Determination of total anthocyanin content was performed with pH difference spectrophotometry [16].

1.5. Glucose and Fructose Content

The concentration of glucose and fructose was measured in accordance with the method of Liu et al. [18]. In short, 1 g of flesh was homogenized with 5.0 ml of cold ethanol (80%) and incubated at 35 °C for 10 minutes. The supernatant after centrifugation and filtration was analyzed using an Agilent 1260 HPLC system (Agilent Technologies). An Innoval NH2 column (4.6 mm × 250 mm, 5 μm, Agela Technologies, Shanghai, China) was installed in the system. The mobile phase was made up of a mixture of acetonitrile: water (80:20, v/v) at 1 ml·min−1.

1.6. Tartaric Acid and Malic Acid Content

The extraction and determination of organic acids were carried out in accordance with Zhang et al. [19]. An amount of 1 ml of supernatant was filtered with a 0.22 mm organic filter head and it was determined using the Agilent 1100 Series HPLC system. The column was ZORBAX Eclipse XDBC18 (416 mm × 250 mm, 5 μm) with a mobile phase of 2 mg·ml−1 metaphosphate solution at column temperature 25 °C, flow rate 0.5 ml·min−1; the injection volume is 5μl, and the detection wavelength is 214 nm.

1.7. RNA-Seq Data Analysis

The pulp and peel of each treated grape were mixed and immediately placed in liquid nitrogen; each sample was 3 biological replicates, and the sample RNA extraction and transcriptome sequencing were entrusted to ‘Beijing Nuohe Zhiyuan Technology Co., Ltd.’ in Beijing, China. Total RNA was extracted using the RNA prep Pure polysaccharide polyphenol plant total RNA (TIANGEN biotech, Beijing, China), and the cDNA was reverse-transcribed with the M5 Super plus RT-qPCR kit with the gDNA remover kit (Beijing Polymeric Beauty, Beijing, China). All steps were performed according to the reagent instructions. The cDNA library was obtained by reverse transcription and PCR amplification after RNA detection, and after the library inspection was qualified, it was sequenced on the Illumina platform. After obtaining raw data (raw reads) by sequencing, the original data of the sample was processed to obtain high quality data on quality (clean data), and the sequence comparison with the reference genome was used to obtain data for subsequent analysis.

1.8. Functional Classification Enrichment Analyses

Differential expression analysis of samples was performed using the expression difference analysis software DESeq2 by FPKM (Fragments Per Kilobases per Million reads) and |log2fold changes|≥1, and a corrected p-value < 0.05 as the screening criteria, screening for differentially expressed genes between samples. DEGs were combined with GO (Gene Ontology), and the KEGG (Kyoto The Encyclopedia of Genes and Genomes database was compared to obtain functional annotation information corresponding to genes.

1.9. Construction of Gene Co-Expression Network Module

In order to simplify the genes into co-expression modules, a weighted gene co-expression network analysis (WGCNA) was performed using default settings in R [20]. The FPKM values were normalized to create an adjacency matrix, and then the phenotype data were loaded into a WGCNA package to compute the correlation-based association between gene modules and phenotype. In WGCNA, the adjacency matrix was transformed into a topology overlap matrix. Based on the construction of the network, transcripts with similar expression patterns were grouped into a module, and unique genes from these modules were likewise measured. Genes from all modules were exported into Cytoscape with default settings as described by M.J. Umer et al. [21].

1.10. Gene Expression Analysis by Quantitative RT-PCR (RT-qPCR)

Based on the enrichment results and WGCNA analysis, the different expression of genes involved in the metabolic pathways were screened, for example, ion transport and anthocyanin biosynthesis, and 11 key genes were selected for RT-qPCR verification and analysis; all 11 candidate genes were upregulated relative to the K0 treatment group. Primers were designed using Primer BLAST (https://www.ncbi.nlm.nih.gov/tools/primer-blast (accessed on 14 December 2022)) using VvGAPDH as the reference gene (Table 1). The cDNA was reverse-transcribed with the M5 Super plus RT-qPCR kit with the gDNA remover kit (Beijing Polymeric Beauty, Beijing, China), and RT-qPCR was reversed using the 2xM5 HiPer SYBR Premix EsTaq (with Tli RNaseH) Kit (Beijing Polymeric Beauty, Beijing, China). The thermal cycle program for qPCR is 95 °C 30 s, followed by 40 cycles, 95 °C 5 s, 60 °C 30 s. VvGAPDH was used as the reference gene. Analysis of relative gene expression levels used a comparative threshold period (CT) method (2−△△CT) [22].

1.11. Data Statistics and Analysis

Duncan’s method was used to test the significance using SPSS 27.0. Figures were elaborated using SigmaPlot 12.5 and OriginPro 2023 (64-bit learning version).

2. Results

2.1. Grape Fruit Potassium Content

The potassium content of fruit was on the rise during the whole development period, and the effect of potassium treatments at different concentrations on potassium accumulation in fruit was different. Compared with the K0, the concentrations of K150, K300, and K450 increased the potassium content by 11.38%, 15.40%, and 8.37% at 78 DAB, respectively (Table 2).

2.2. Soil Potassium Content

The potassium content of the soil under different treatments was different at 78 DAB. The lower potassium content was, the more potassium was transferred to the aboveground part; the higher potassium content was, the less potassium was transferred to the aboveground part. Therefore, it can be explained that the potassium transferred to the aboveground section under the three treatments (K150, K300, and K450) was higher than K0. In addition, the K150 treatment effect was the best (Table 3).

2.3. Anthocyanin and Soluble Solids Content

The accumulation of anthocyanins is not only related to the color of the fruit skin, but is also an important indicator of fruit ripeness. The anthocyanin content and SSC under the four treatments showed an upward trend in general. Compared with the K0, the concentrations of K150, K300, and K450 increased the anthocyanin content by 49.78%, 24.10%, and 13.06%, respectively, (Figure 1A) and the soluble solids content by 11.80%, 5.60%, and 4.10% at 78 DAB, respectively (Figure 1B).

2.4. Soluble Sugars and TA Content

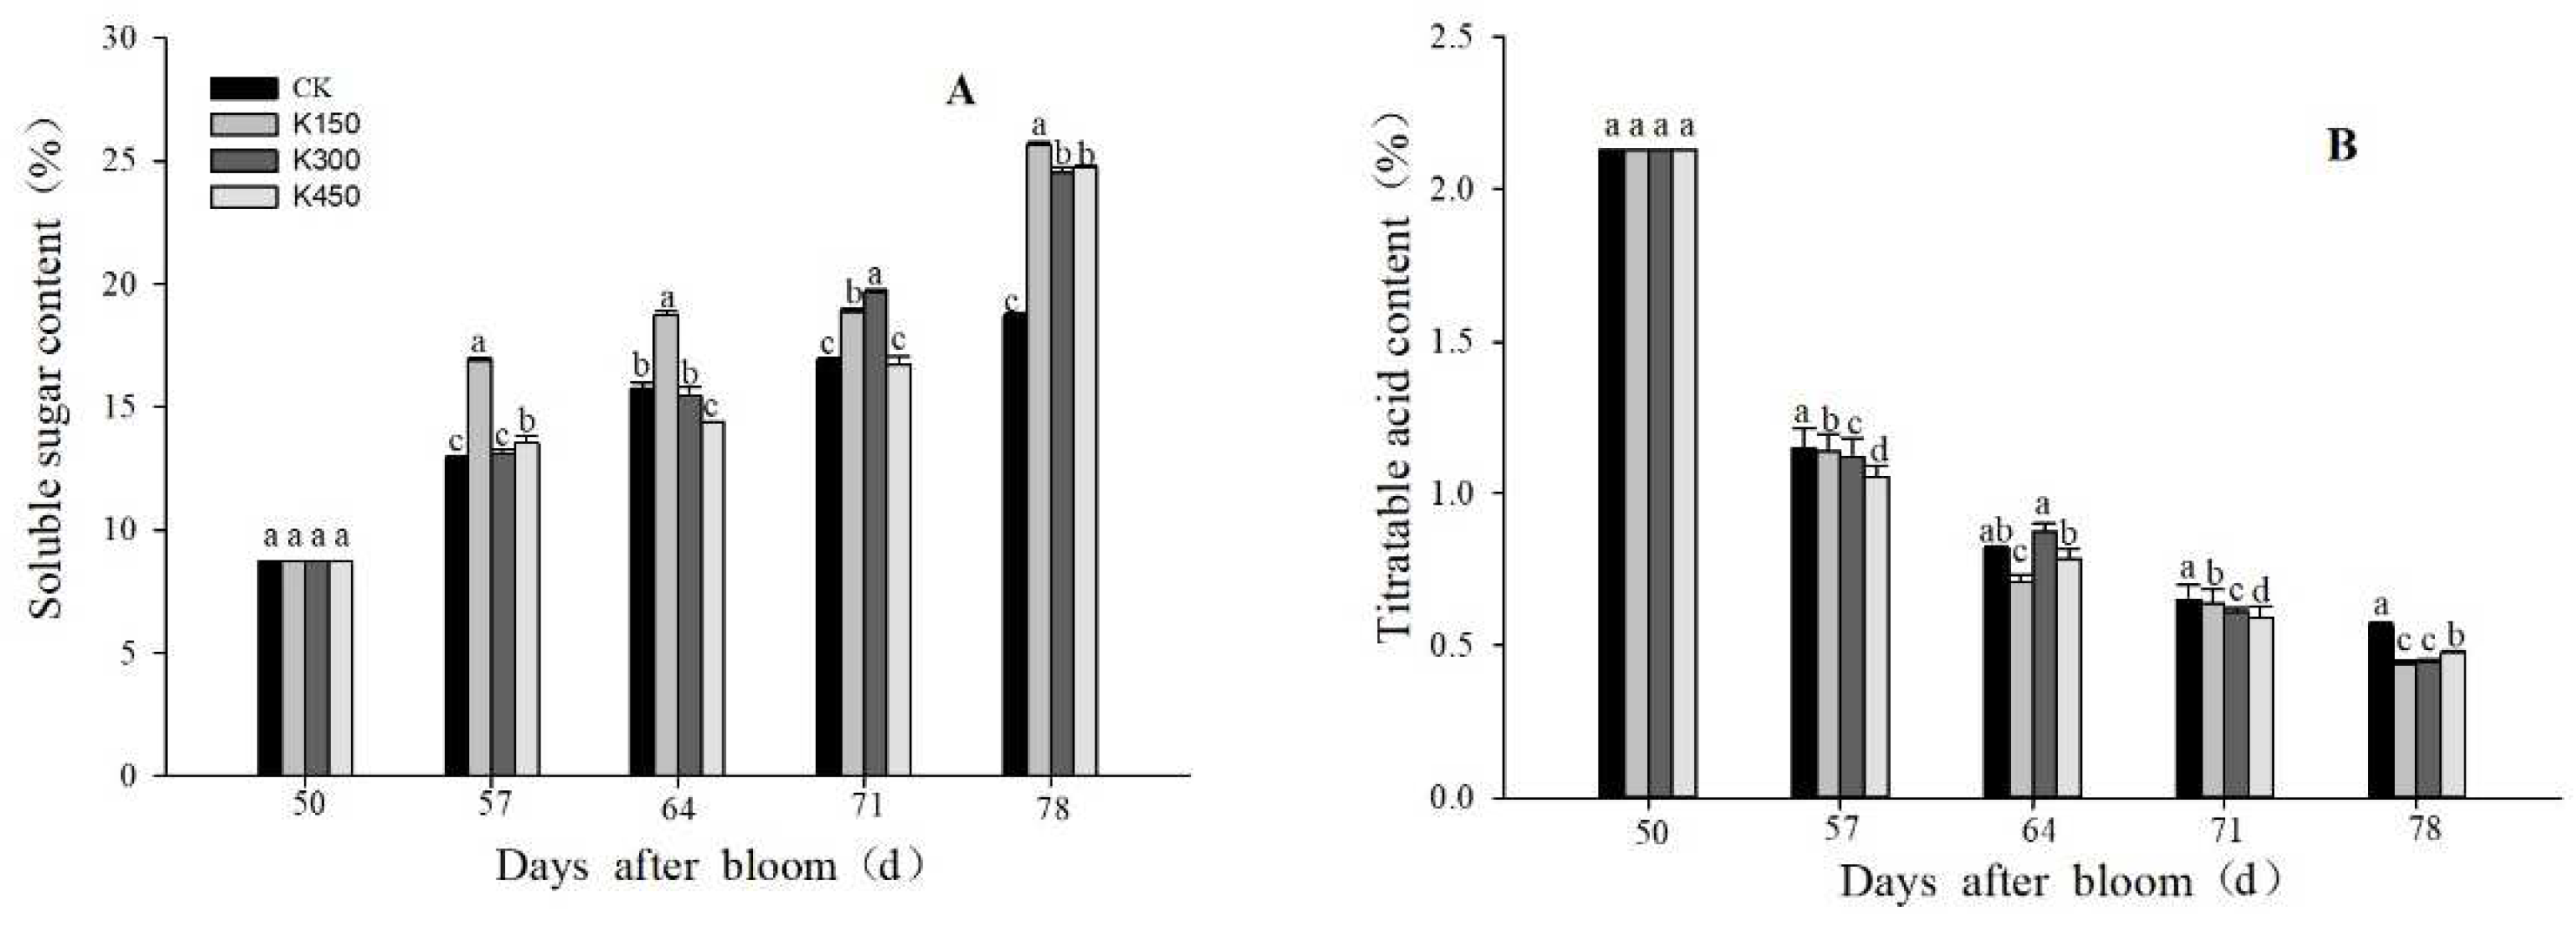
The content of soluble sugars in the fruit was closely related to the quality and ripeness of the fruit. At 57 DAB, the soluble sugar content of fruit was increased, and it increased rapidly at 71–78 DAB. At 78 DAB, the soluble sugar content of K150 treatment was the highest. Compared with the K0, the concentrations of K150, K300, and K450 increased the soluble sugar content by 37.39%, 31,10%, and 32.59%, respectively (Figure 2A).
At 78 DAB, the fruit under K150 and K300 treatments had the lowest TA content. At 50 DAB, the TA content between each treatment was not significant. At 78 DAB, compared with the K0, the concentrations of K150, K300, and K450 decreased the TA content by 22.06%, 21.84%, and 15.98%, respectively (Figure 2B).

2.5. Glucose, Fructose, Tartaric Acid, and Malic Acid Content

Different concentrations of K treatments have a significant impact on the content of glucose, fructose, tartaric acid, and malic acid in the fruits, which can play a role in increasing sugar and reducing acid. The content of glucose and fructose was increased by potassium fertilizer treatments at different concentrations. As the fruit developed, the concentration of sugar components in the fruit gradually increased. Compared with K0, the concentrations of K150, K300, and K450 increased the glucose content by 25.51%, 34.50%, and 19.12%, respectively, (Figure 3A) and the fructose content by 20.76%, 26.27%, and 16.03% at 78 DAB, respectively (Figure 3B).
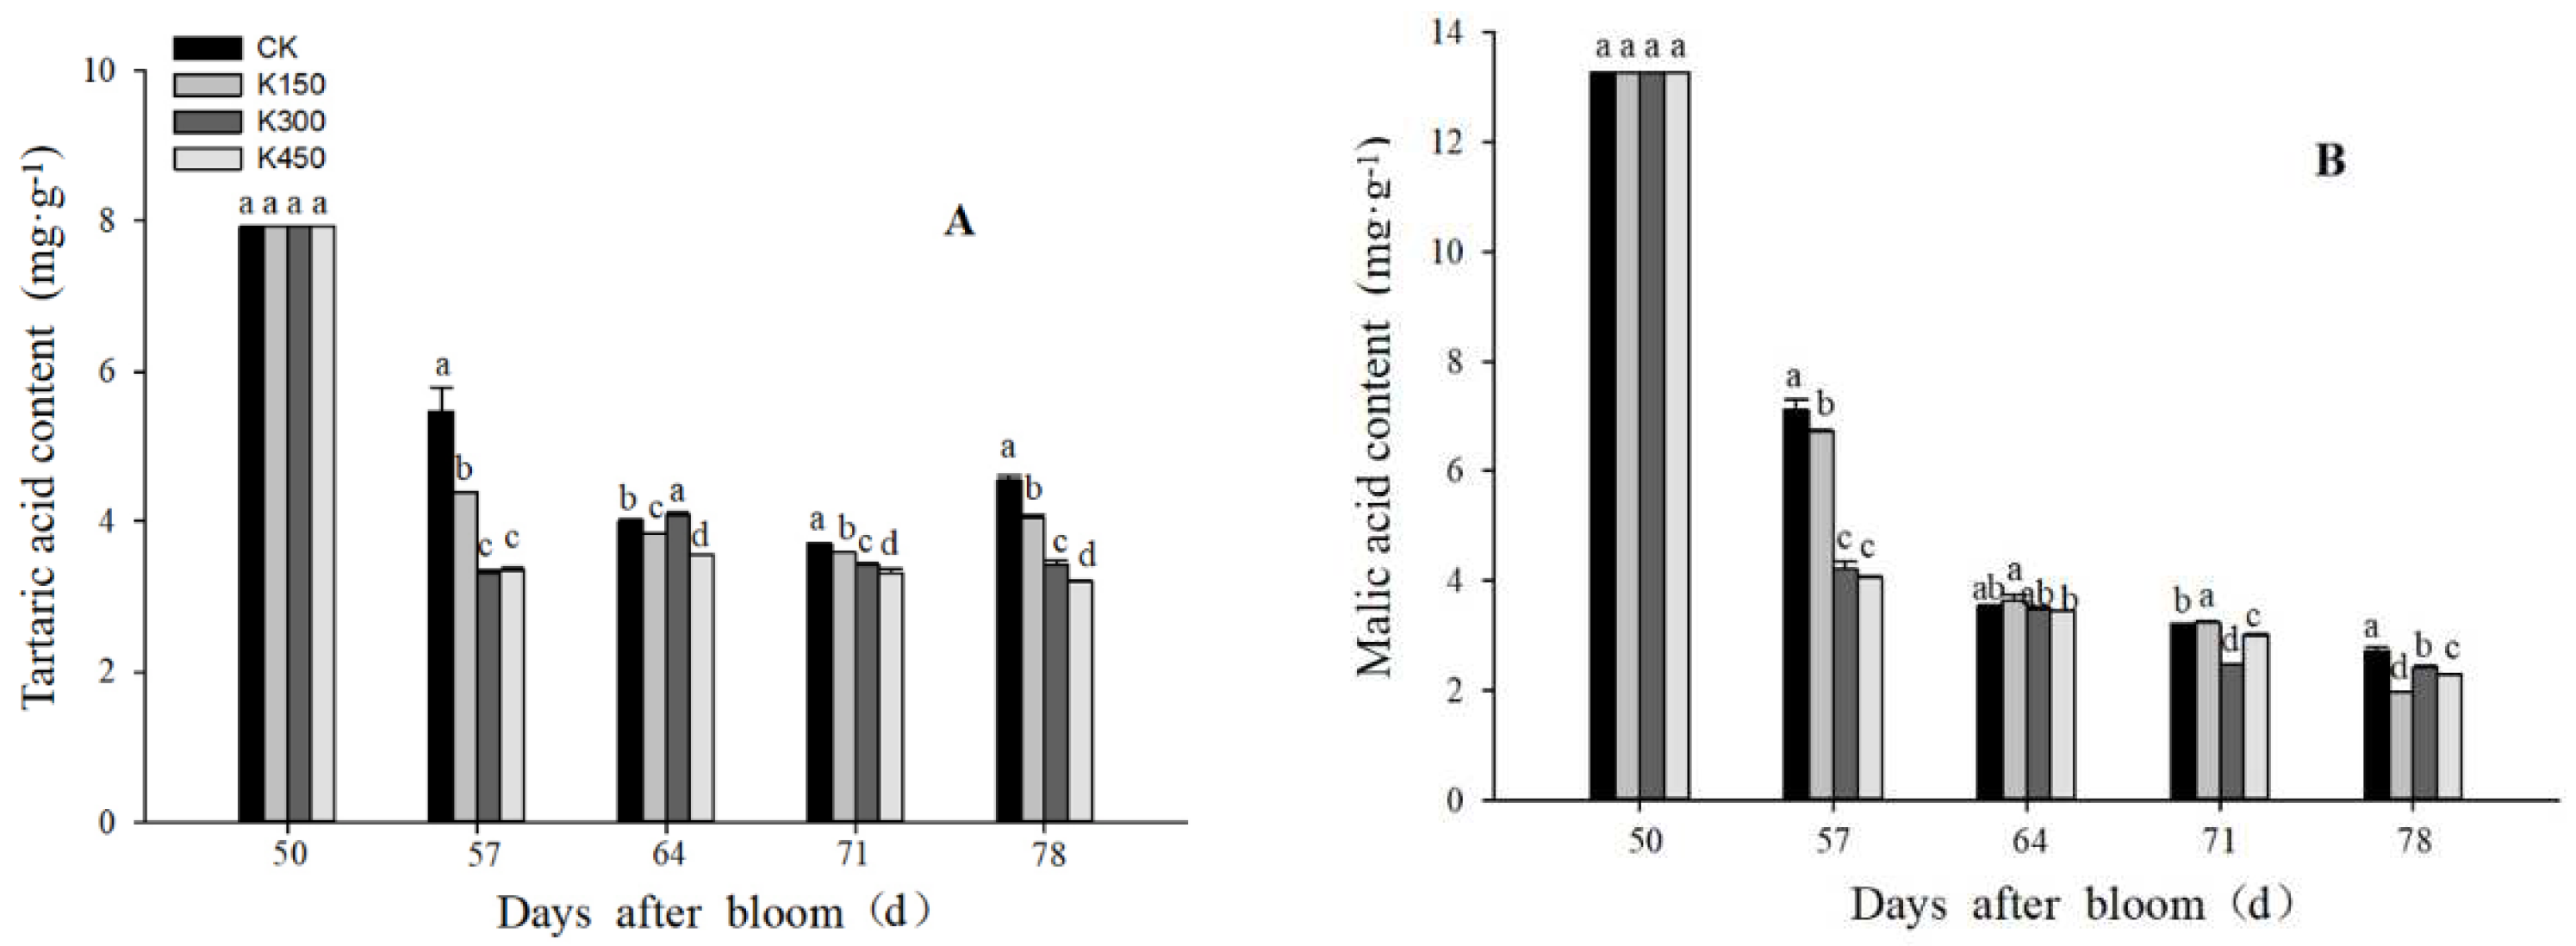
The content of malic acid and tartaric acid in different K treatments was lower than K0. Compared with K0, the concentrations of K150, K300, and K450 decreased the tartaric acid content by 11.15%, 24.84%, and 29.53%, respectively, (Figure 4A) and the malic acid content by 27.44%, 11.01%, and 16.28% at 78 DAB, respectively (Figure 4B).

2.6. Berry Skin Color

The CIElab system is the most widely used and recommended system for color evaluation [23]. L*, a*, b* and CIRG color indices are highly correlated with the color of grape berry, and they have been successfully applied to indicate the color of berry. In general, different concentrations of potassium treatments have an impact on the color of grape fruit: L* value represents brightness—the larger the L* value, the brighter the color, the smaller the L* value, the darker the color, the closer to purple-black; the higher the a* value, the higher the red component of the fruit, that is, the more deviation from the purple-black; the b* value represents the yellow-blue difference index—the larger the positive value, the darker the yellow, the smaller the negative value, the deeper the blue. The test shows that the K150 and K300 treatment color is closer to purple-black (Table 4).

2.7. Principal Component Analysis (PCA) and Correlation Analysis

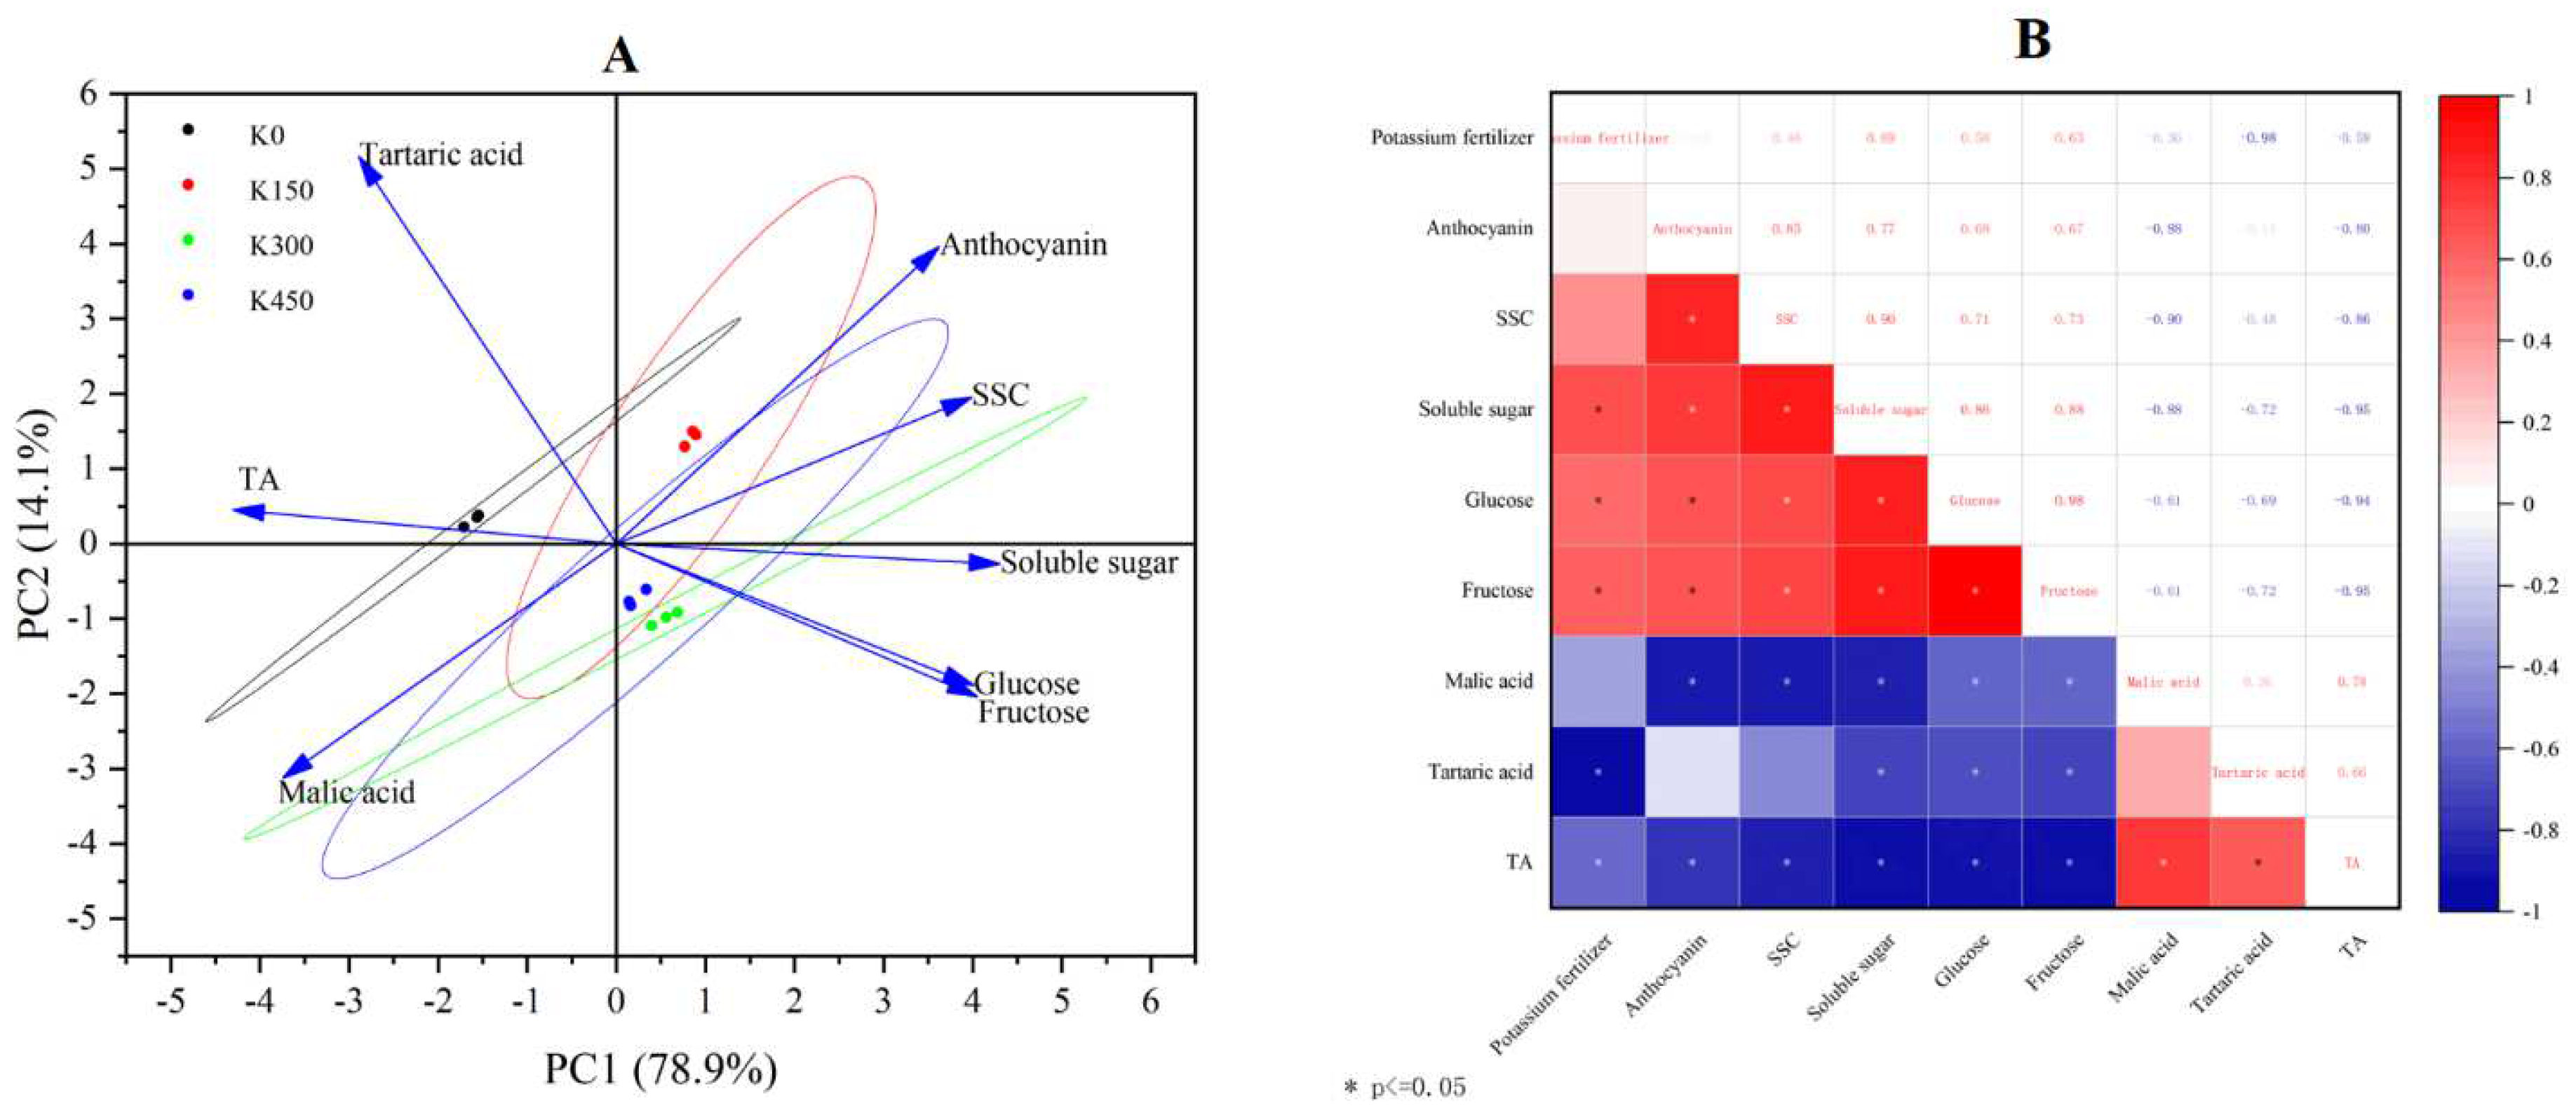
We performed principal component analysis (Figure 5A) as well as correlation analysis for the important qualities of 78DAB fruit (Figure 5B). The eigenvalues and contribution rates of the principal components (PC) are the basis of selecting the PCs; the larger the eigenvalues, the more information the PC contains. In this experiment, PCA was performed with eight measured variables (SSC, TA, anthocyanin, soluble sugar, glucose, fructose, tartaric acid, and malic acid). The contribution of the first PC accounted for 78.90% of the total variation. Soluble solids (SSC), anthocyanins, glucose, fructose, and soluble sugar mainly reflected PC1. These variables are important indicators to evaluate the fruit quality of ‘summer black’. The second PC explained 14.10% of the total variation, and titratable acid (TA), tartaric acid, and malic acid mainly reflected PC2. The results showed that the reproducibility within each sample group was good, and the variability between groups was significant. The sugar as well as anthocyanin content of ‘summer black’ grape fruit were the main source of information for PC2, and exogenous potassium applications associated with fruit sugar as well as anthocyanin concentration were positively correlated.
Correlation analysis showed that exogenous potassium application was significantly and positively correlated with fruit sugars and negatively correlated with fruit acids. Although the direct positive correlation with anthocyanin content was not significant, anthocyanin content was significantly and positively correlated with fruit sugar, so exogenous potassium application could affect the fruit sugar concentration and thus anthocyanin content, enhancing fruit coloration. Thus, it can be concluded that exogenous potassium application had a pond-enhancing and acid-reducing effect on the grapes.

2.8. DEG Identification after K Treatment

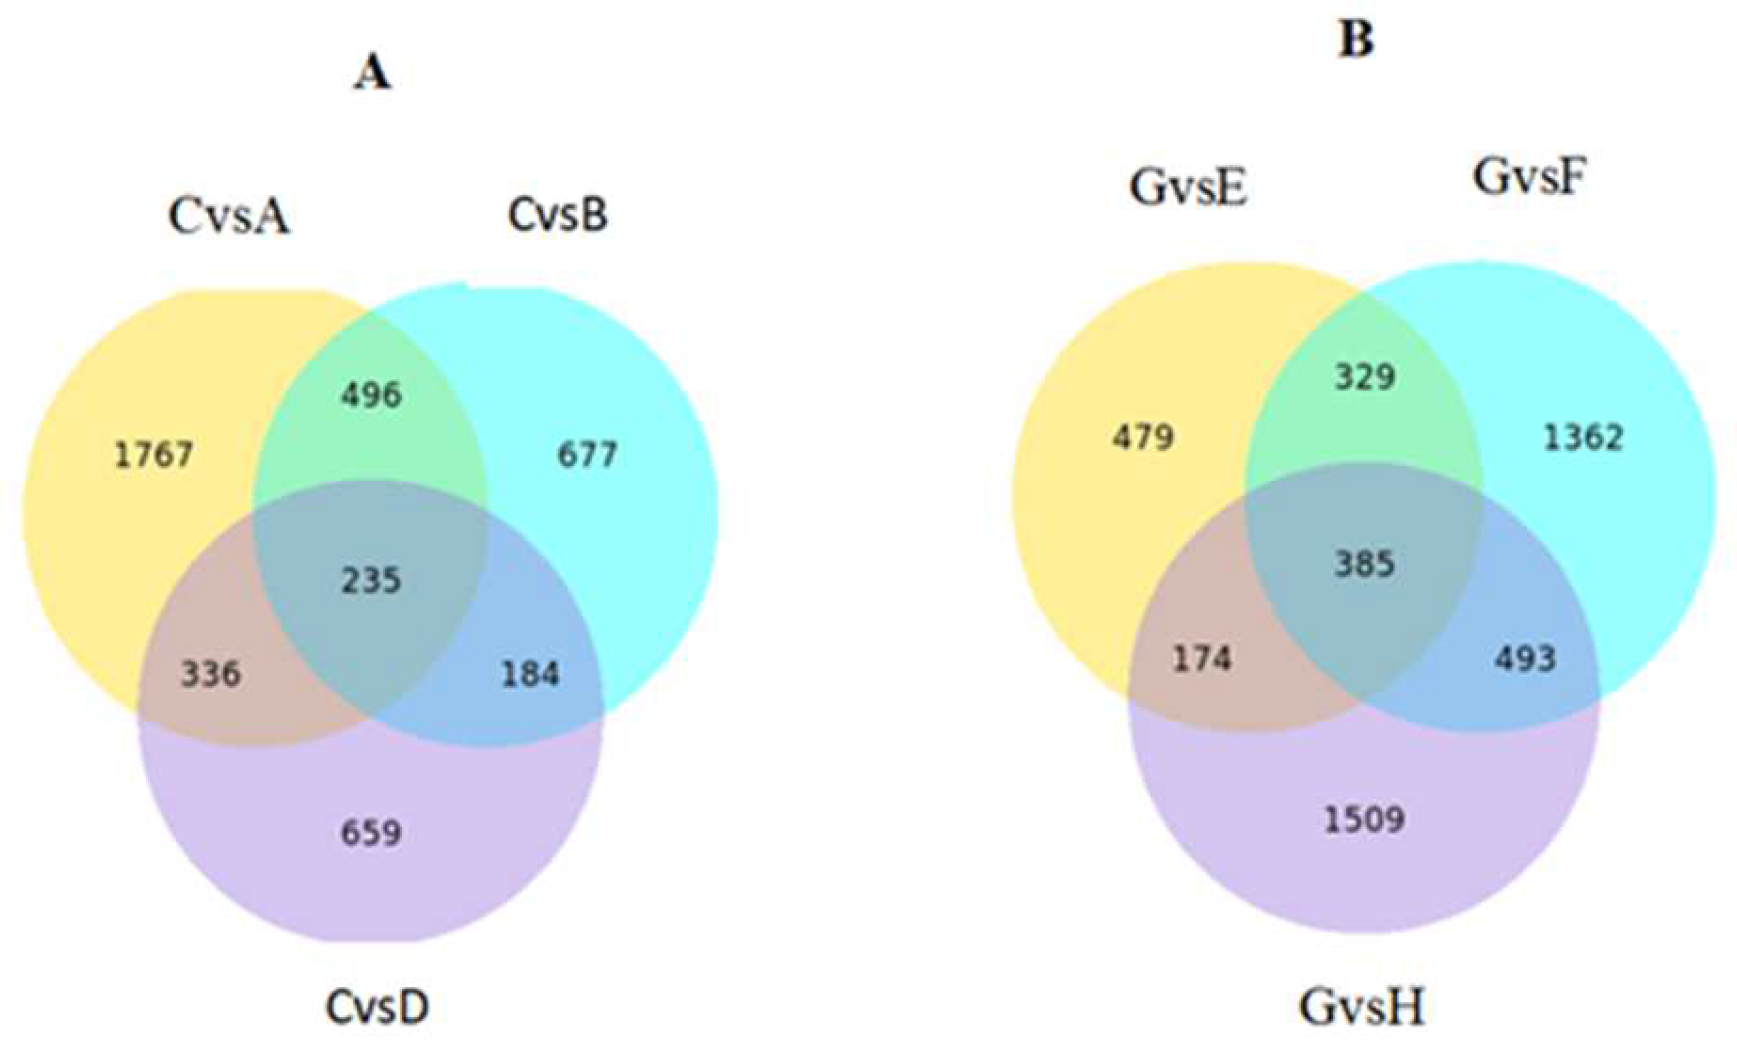
Transcriptome sequencing of a total of 27 samples (T represents 50DAB fruit, A, B, C, D and E, F, G, H represent K0, K150, K300, and K450 of 64 DAB and 78 DAB, respectively) from four treatments was carried out on the Illumina platform, and the Clean Data of each sample reached more than 6.30 Gb. The Q20 and Q30 sequences accounted for more than 95% (the sequencing error rate <1%), and more than 90%, respectively, and the GC content was greater than 45% (Table 5). Pairwise comparisons of samples processed at the same sampling time identified 5840 and 6497 non-redundant DEGs (Figure 6 and Figure 7).

2.9. Functional Classification of DEGs

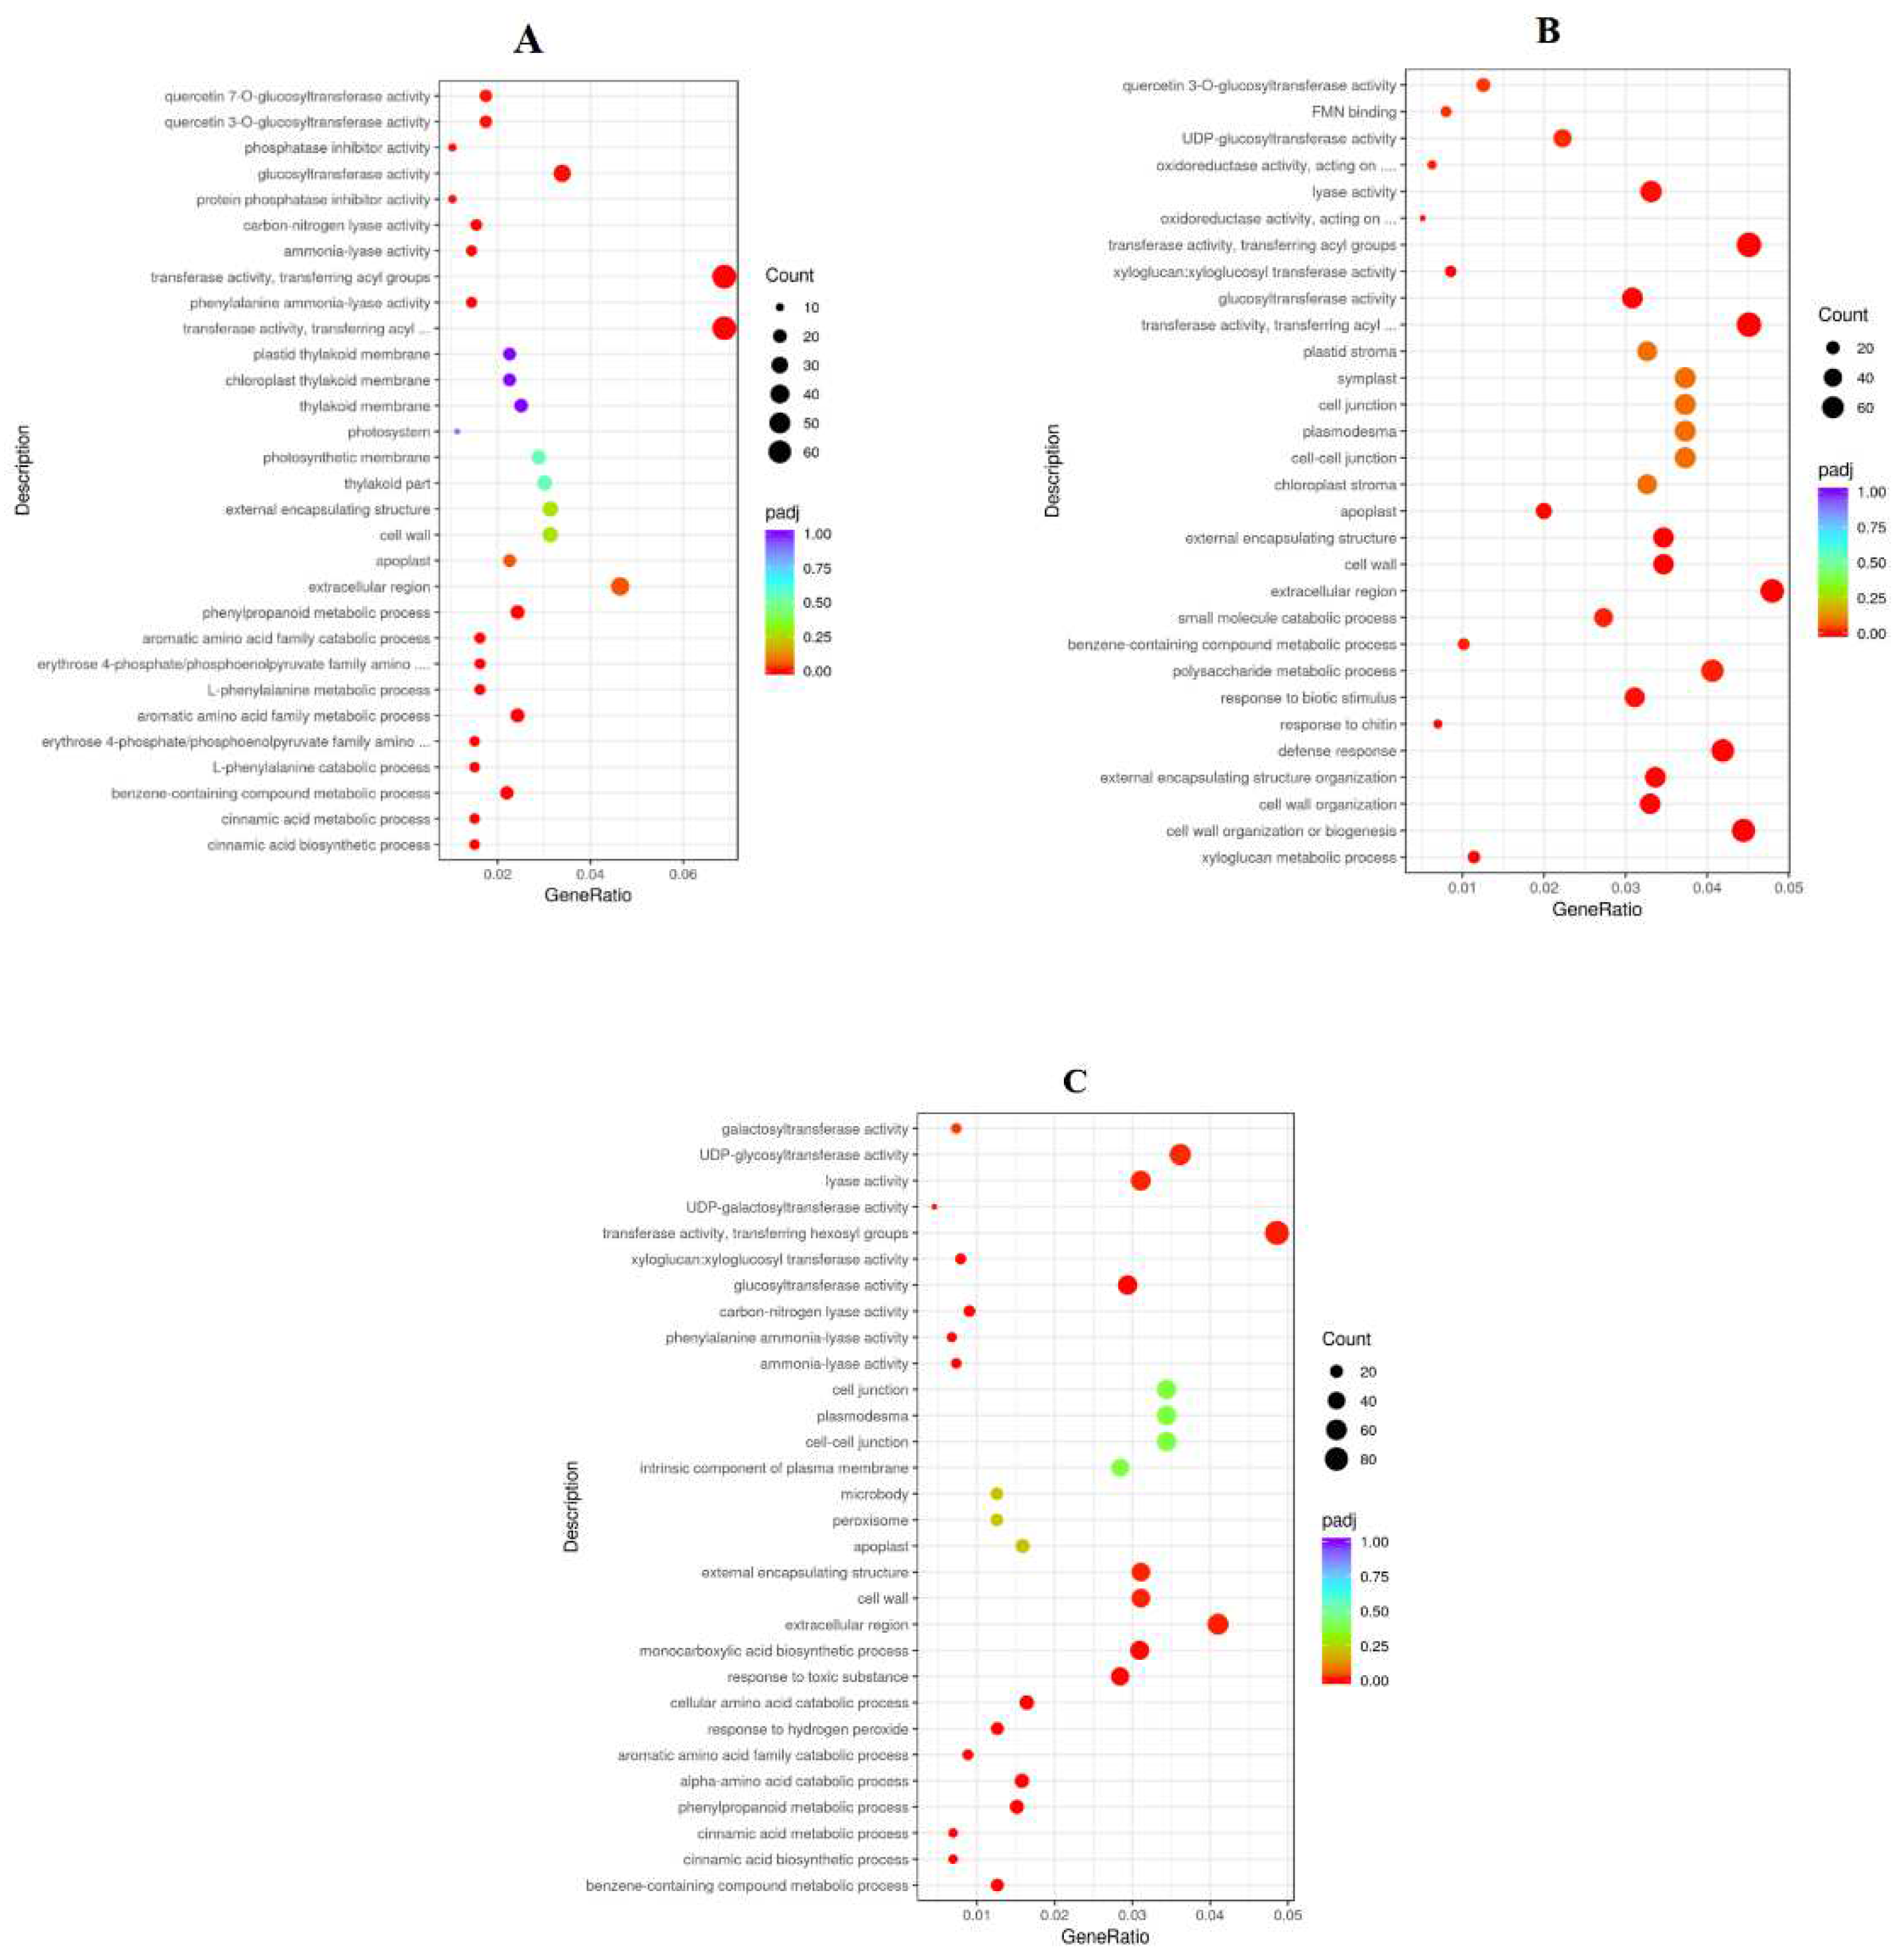
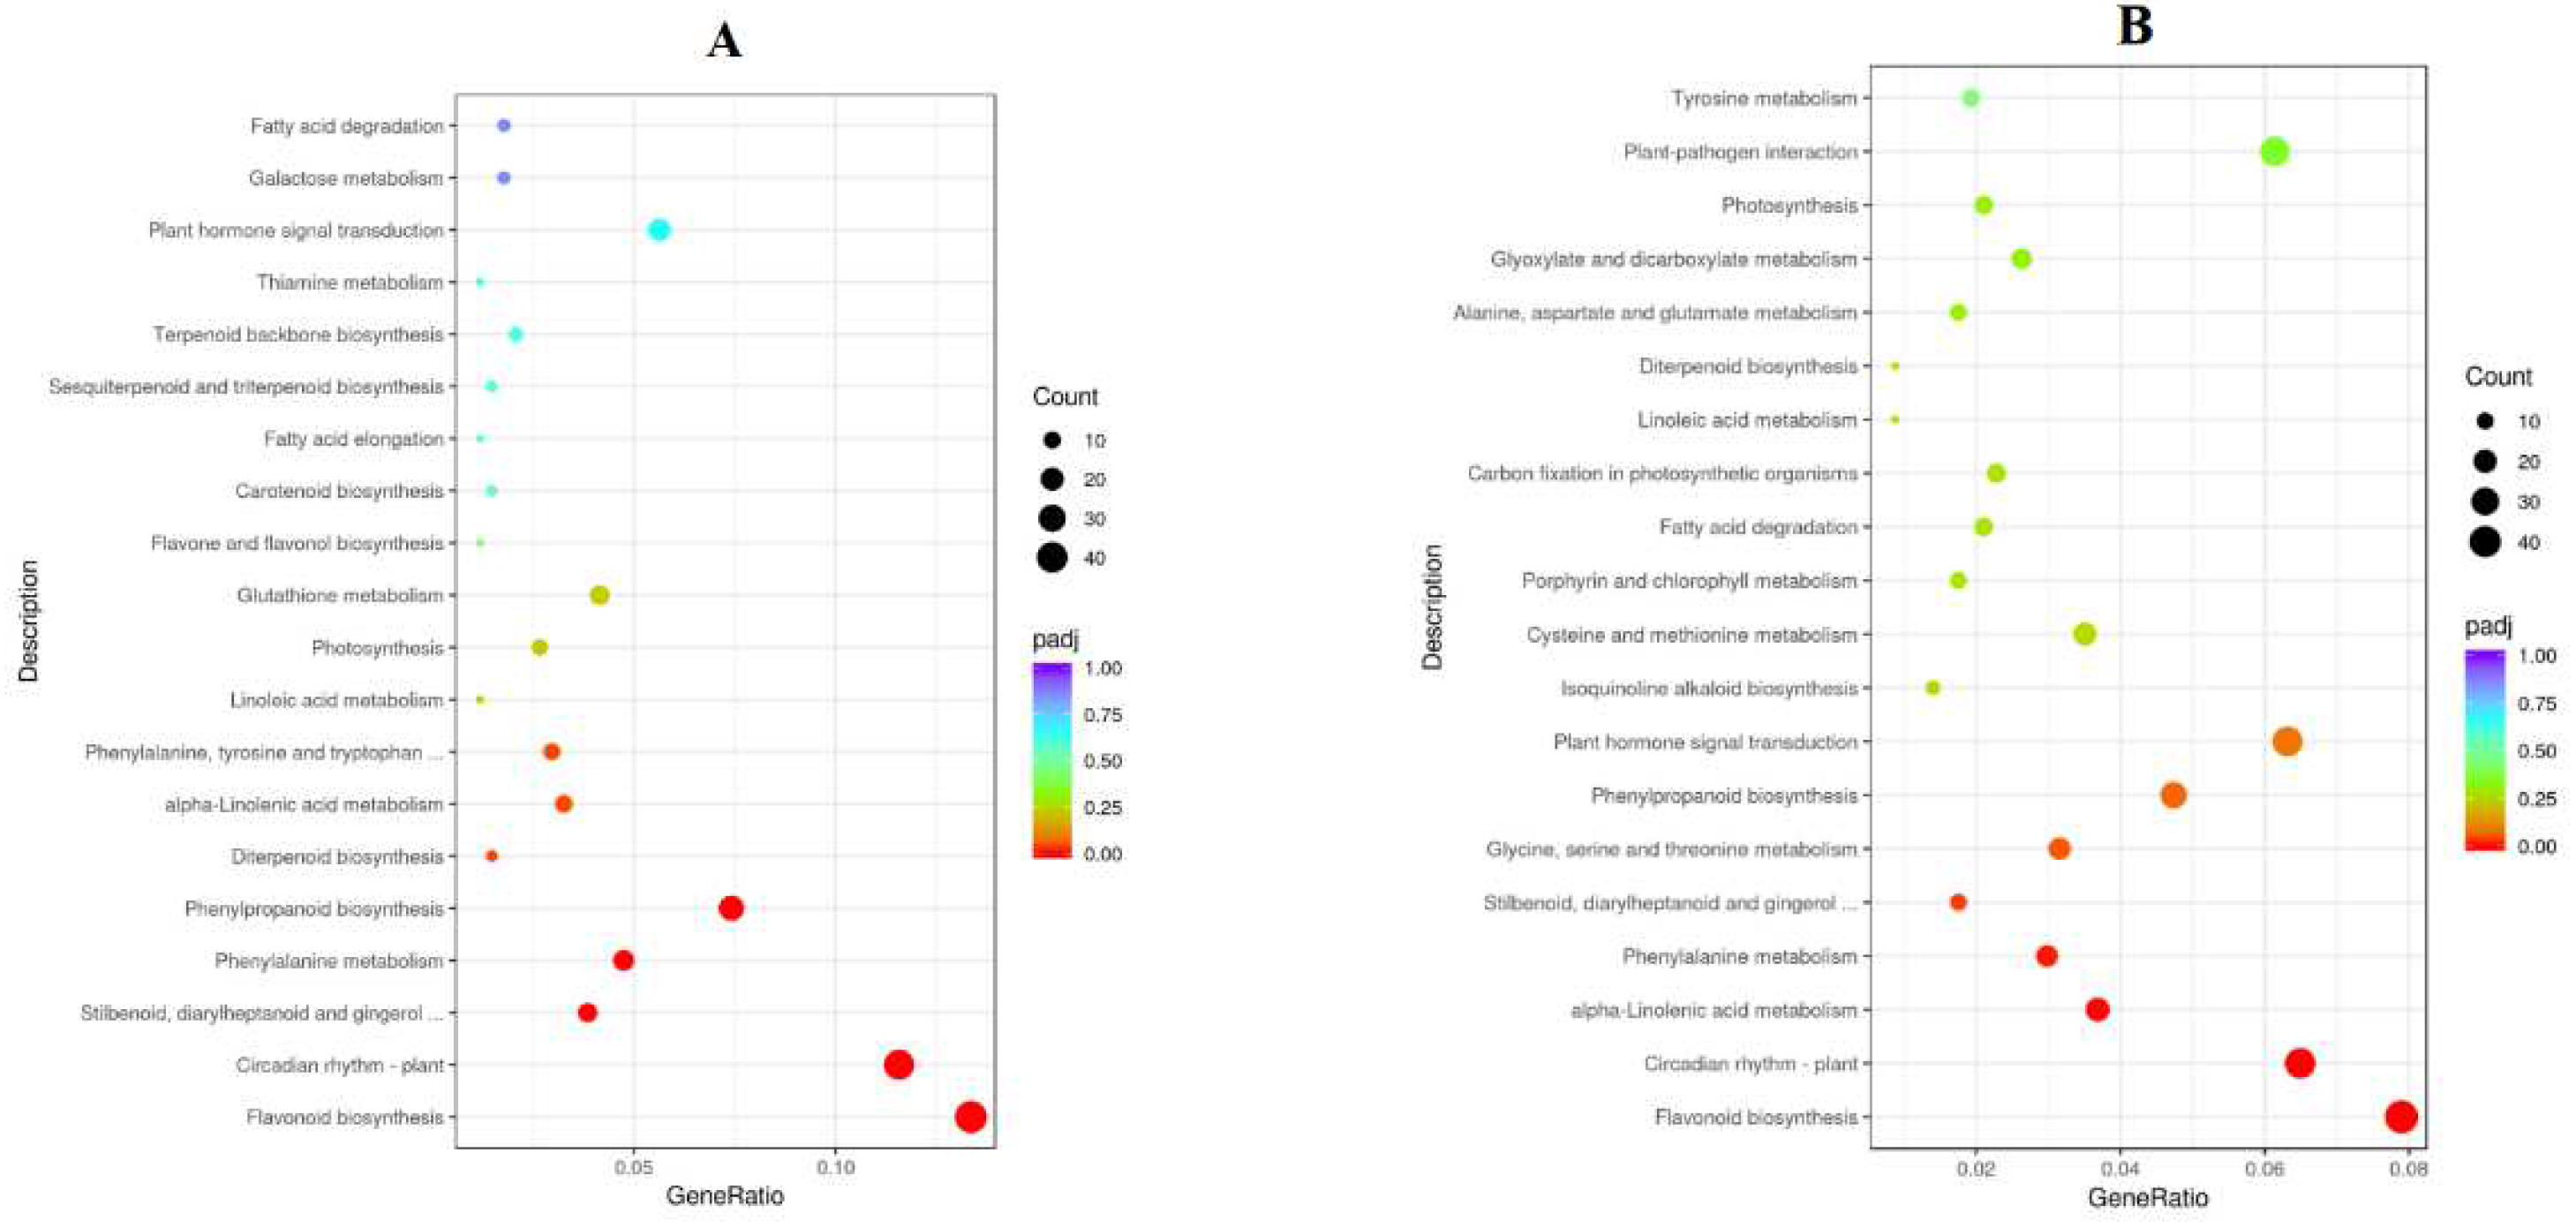
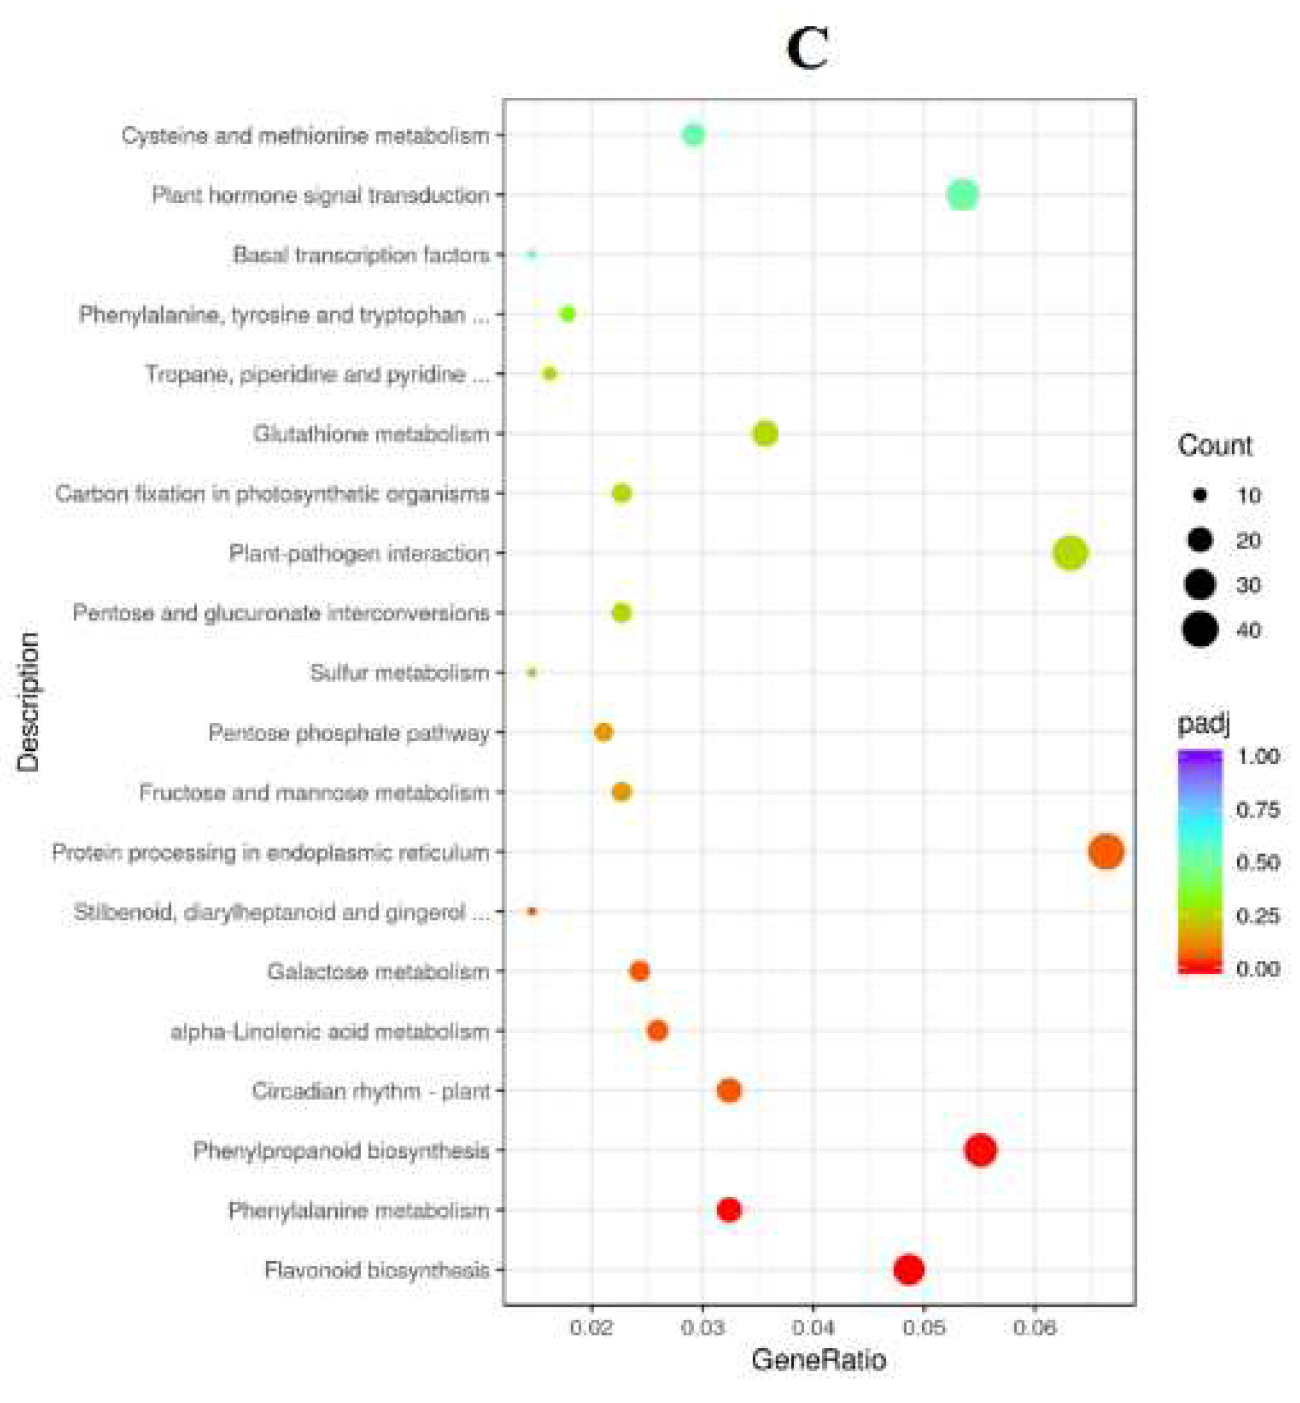
To analyze the function of genes’ different expressions in response to K at 78DAB, the DEGs were enriched with Gene Ontology (GO). The top 20 GO enrichment entries for abundance are shown (Figure 8). In the classification of biological processes, DEGs are mainly enriched into items such as metabolic processes and cellular processes. In the cell composition, it is mainly enriched into membranes, cells, etc. In molecular functions, it mainly includes catalytic activity, binding, and ion transport activity. The KEGG analysis showed that there was significant enrichment of DEGs in several important biological processes, including galactose metabolism, fructose and mannose metabolism, and flavonoid biosynthesis (Figure 9 and Table 6).

2.10. Constructing the Co-Expression Network and Identification of Key Candidates

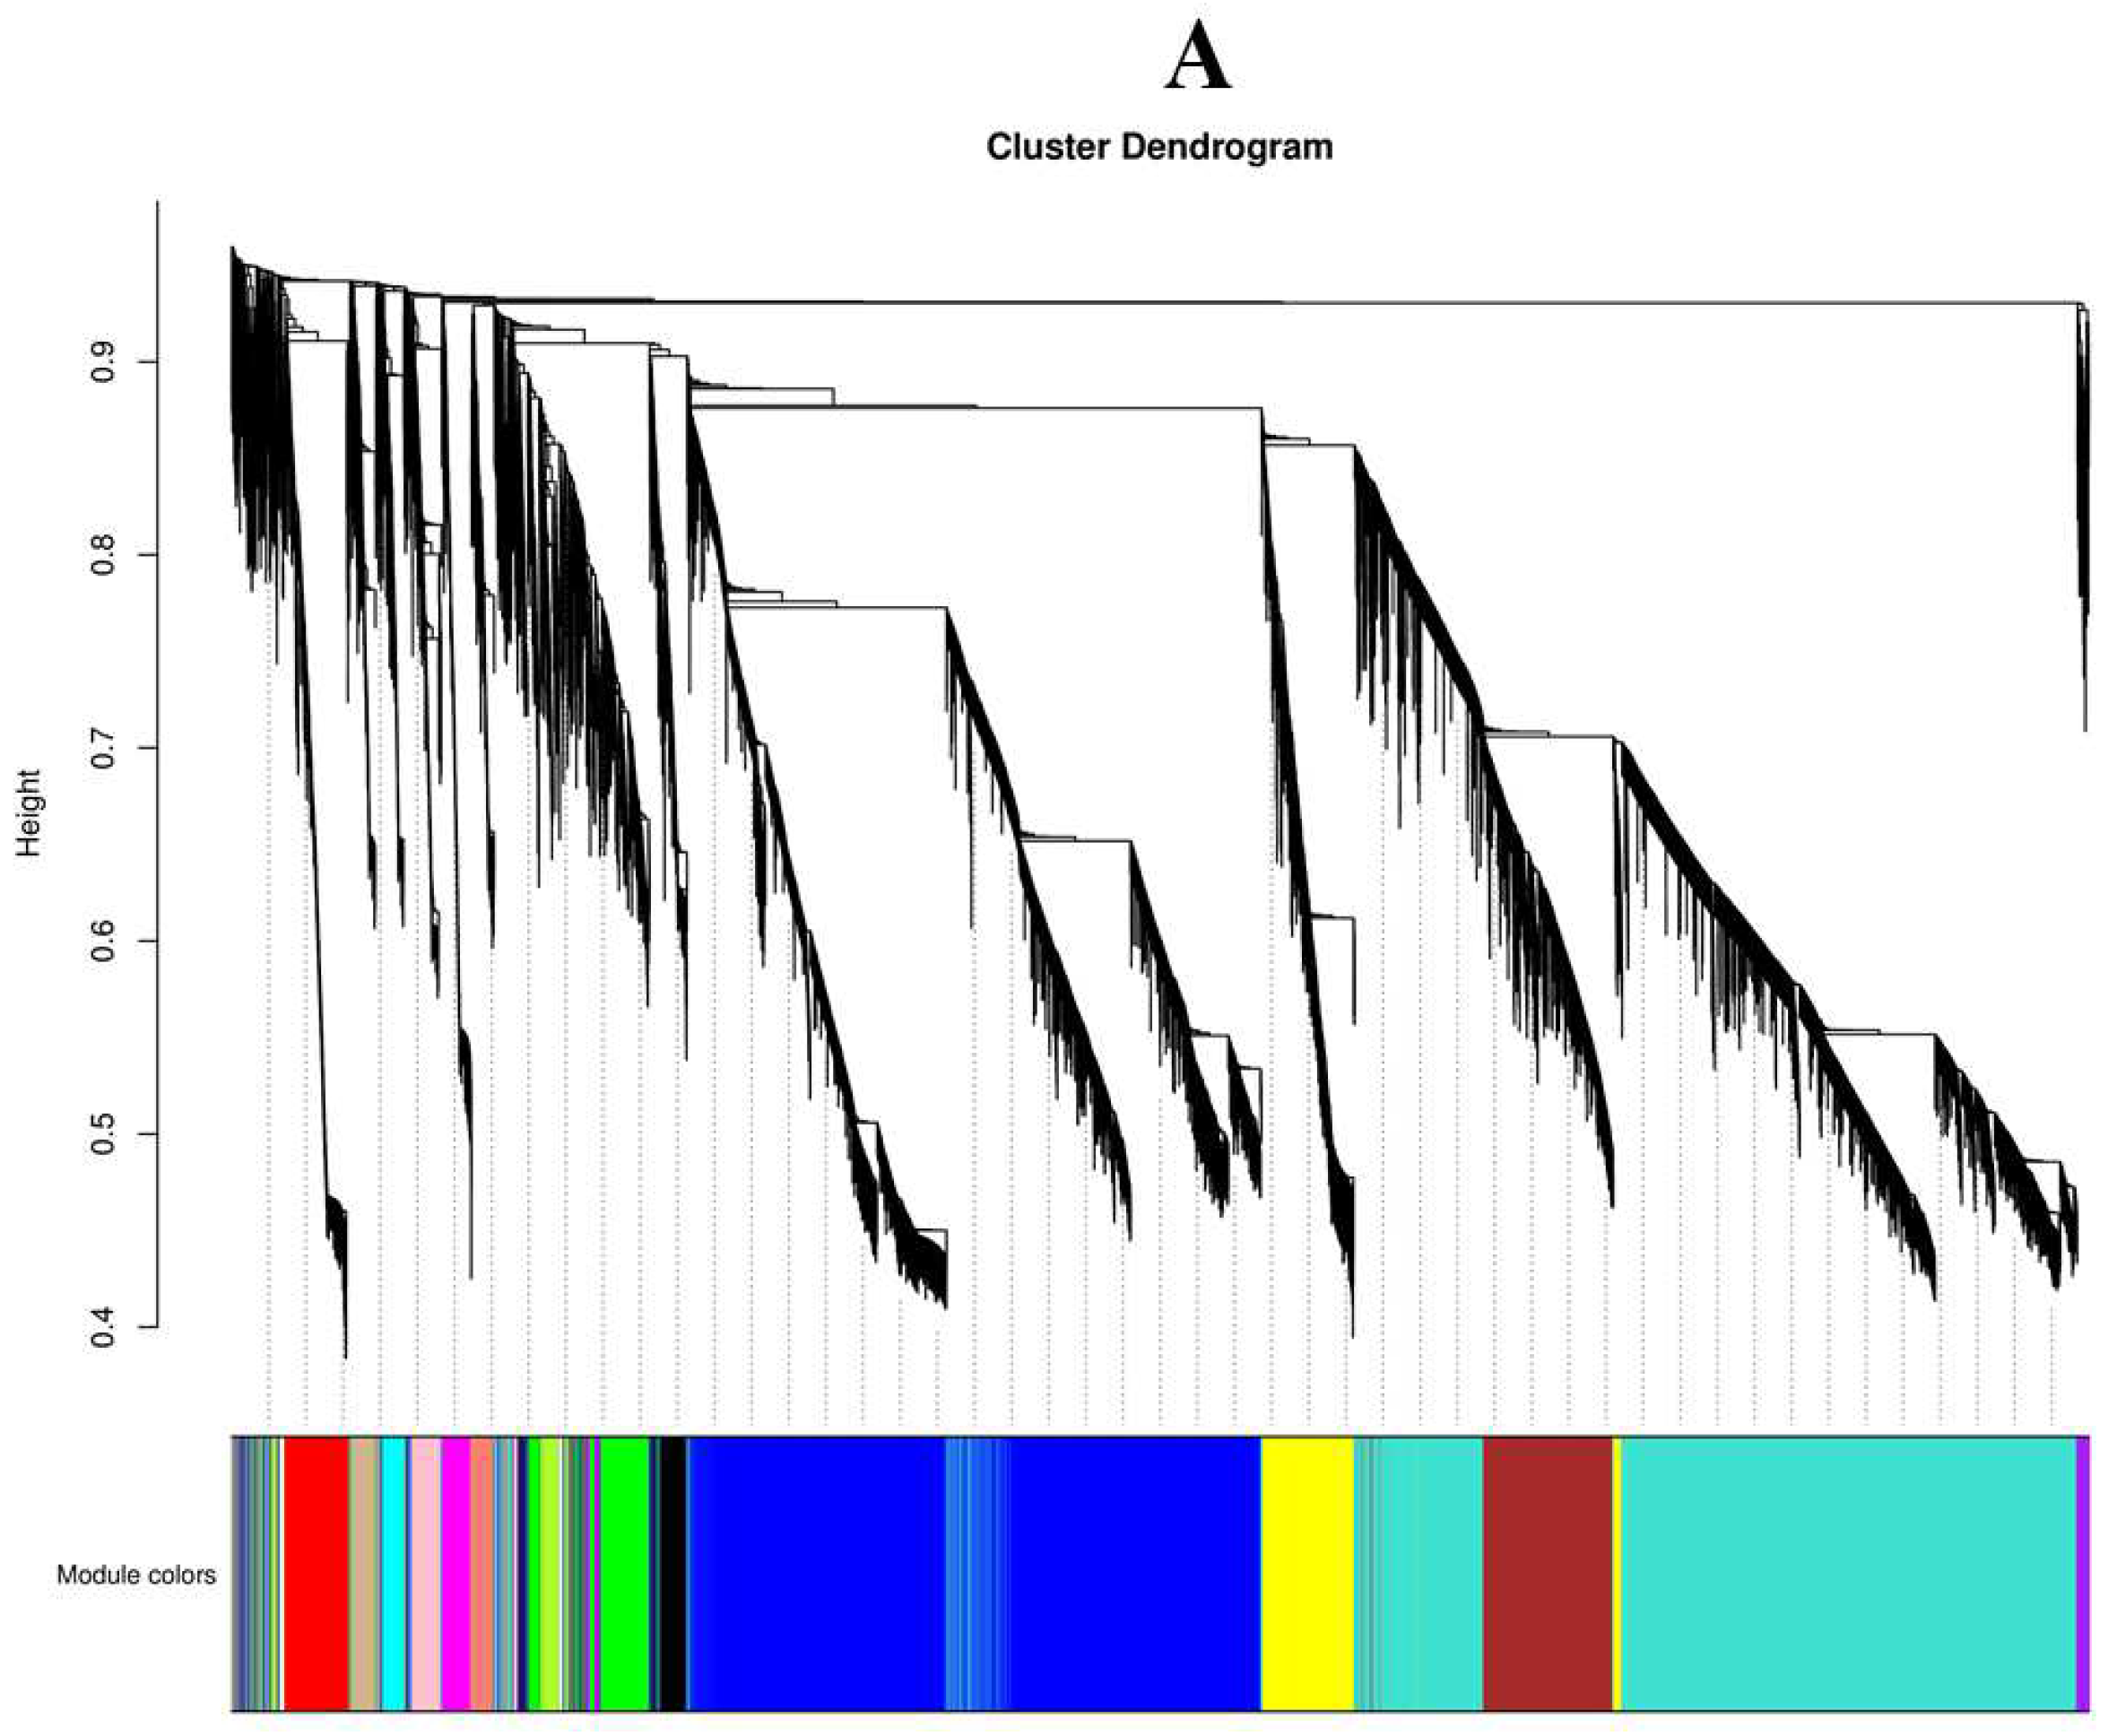
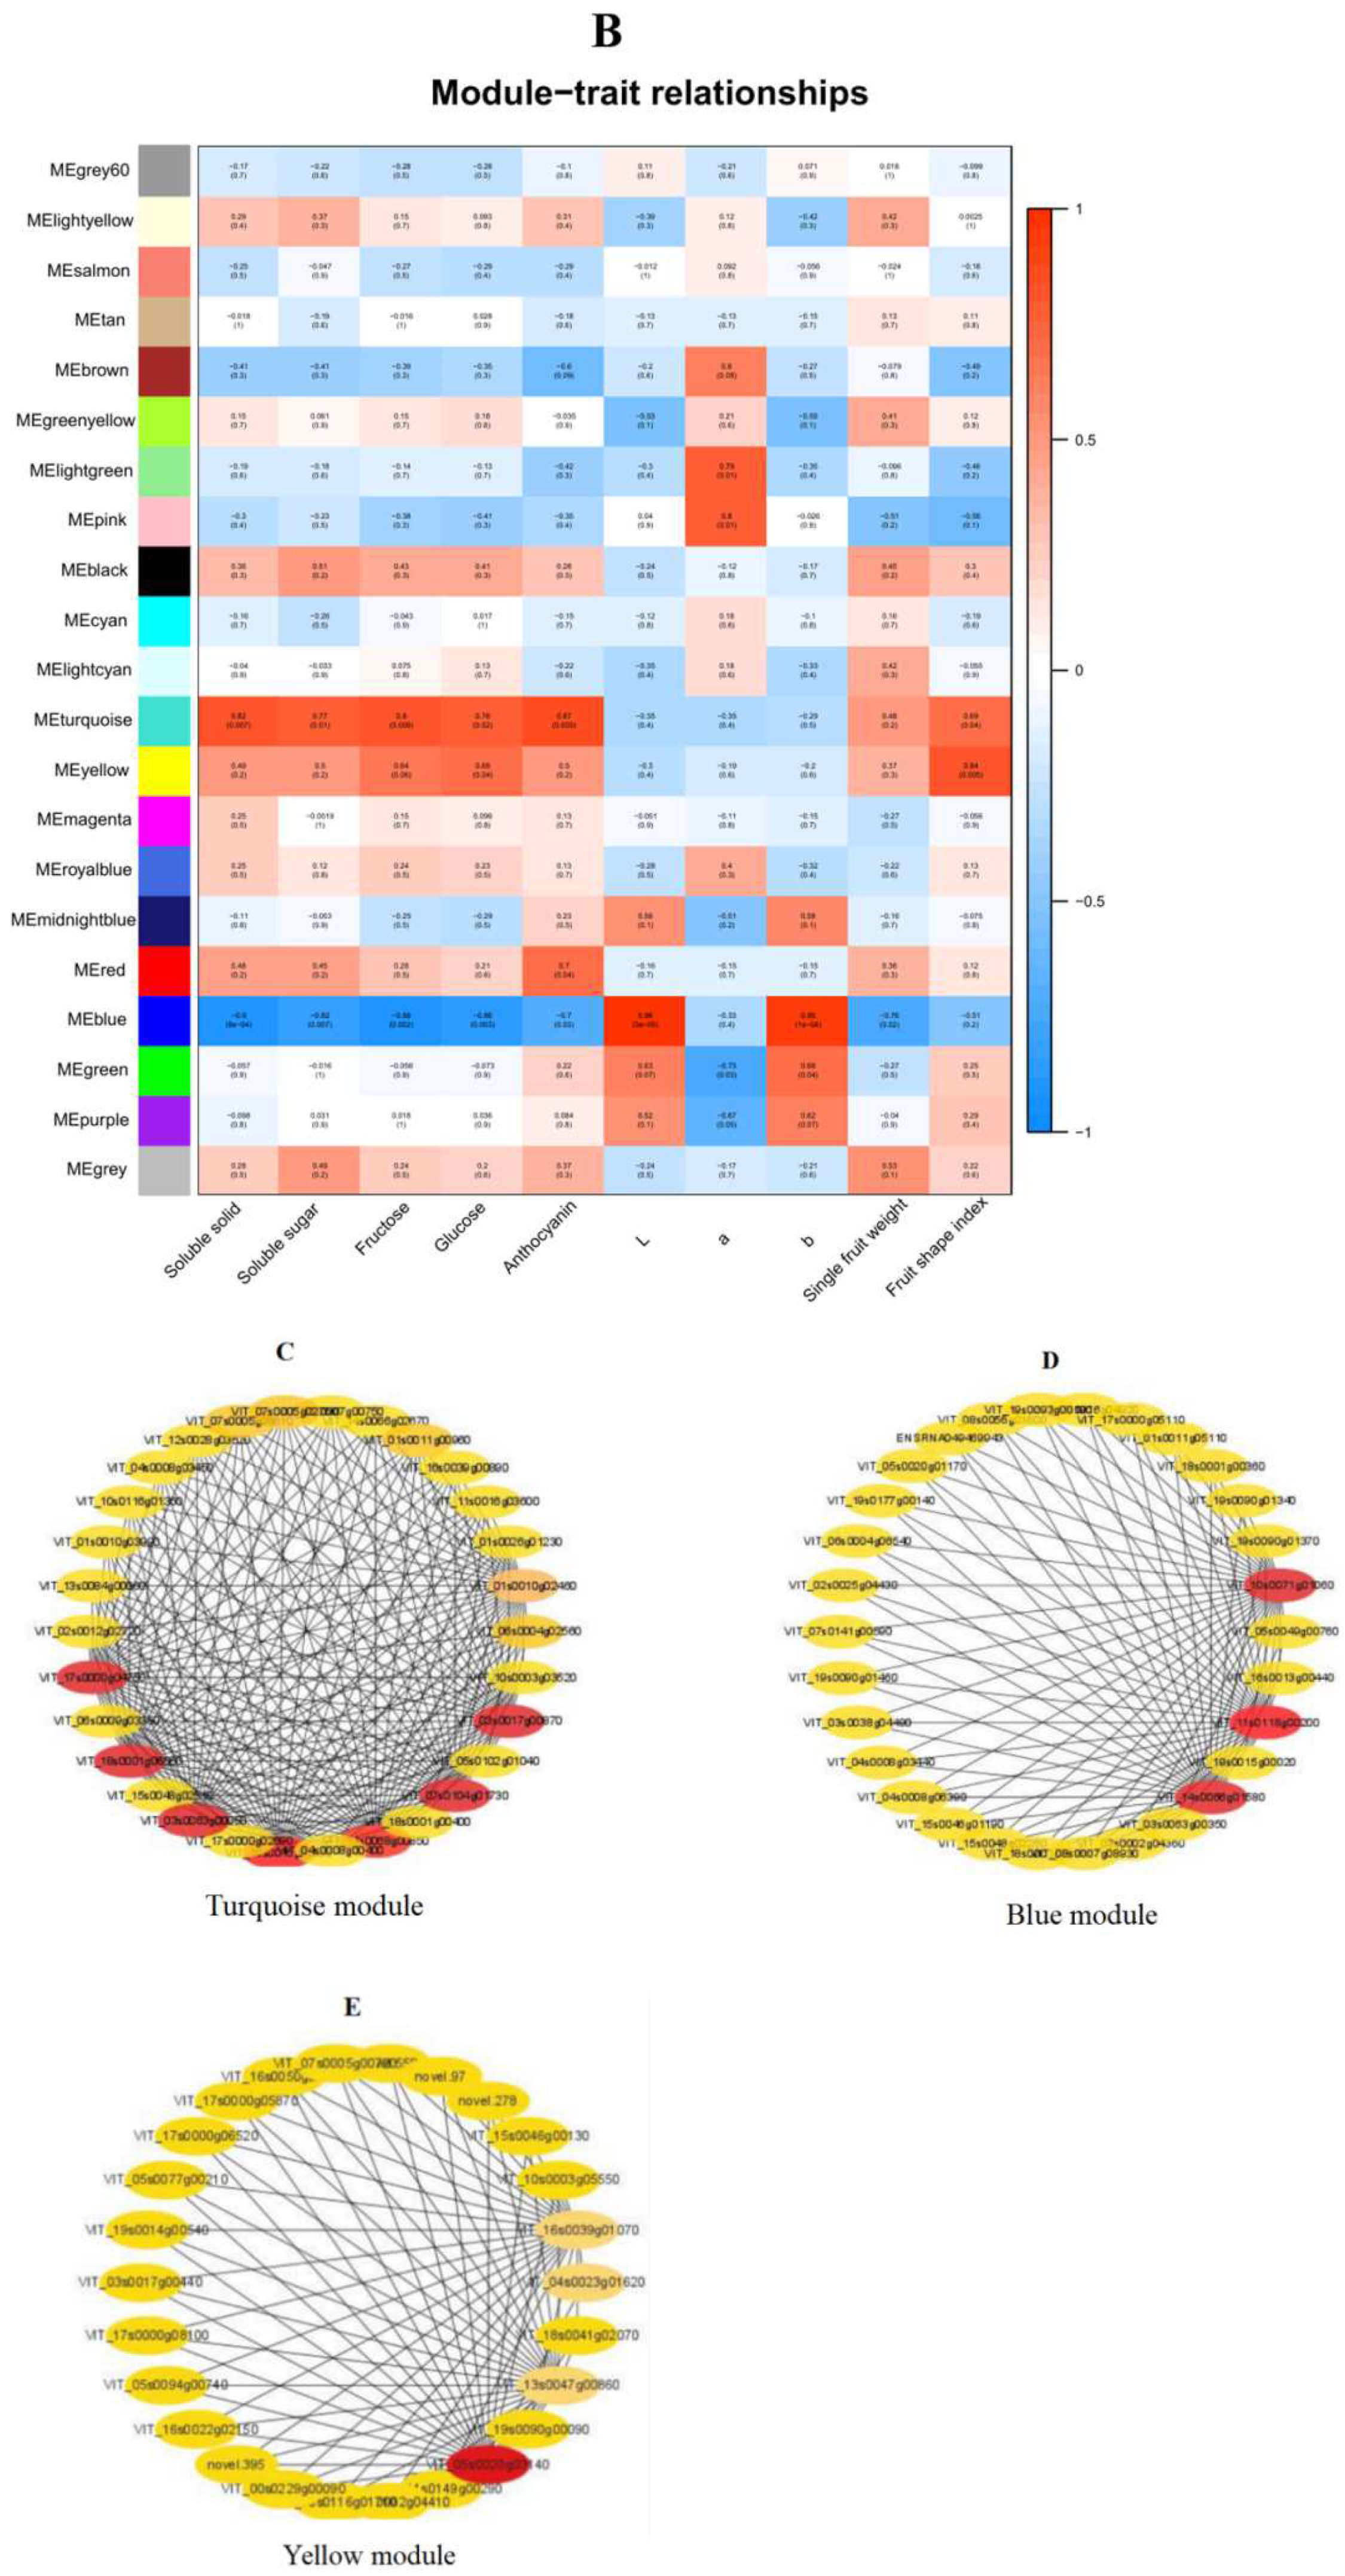
Co-expression networks were constructed using 31,740 DEGs in WGCNA (Figure 10A). FPKM values for 21 different gene modules were determined by entering the RNA-seq data into the WGCNA module. All of the identified modules were highlighted in various colors. Correlation analysis was carried out to study the relationship between module characteristic genes and phenotypes (anthocyanin, sugar, potassium) (Figure 10B). Among 21 co-expressed gene networks, three had significant correlation with anthocyanin, sugar, and potassium content. The turquoise module contained 8754 genes, the blue module contained 7878 genes, and the yellow module contained 1480 genes. The gene network was visualized using the WGCNA R package, and nodes and edges were calculated for the three modules.
To further explore candidate genes that contribute significantly to the gene network, annotation information for all selected genes was obtained from the Grapevine Reference Genome Annotation Database (Figure 10C–E). This comprehensive technique was able to precisely identify important candidate genes by comparing annotation information of pivotal genes in DEGs and validating the selected 11 genes by RT-qPCR. Among them, there are five genes associated with anthocyanin biosynthesis, three of which are associated with sugar metabolism and three of which are responsible for the accumulation of potassium. The results from RT-qPCR were consistent with RNA-Seq. Finally, seven genes (Turquoise.0870, Turquoise.2680, Turquoise.0050, Turquoise.6060, Turquoise.4750, Turquoise.1730, and Turquoise.0850) from the turquoise module, correlated with anthocyanin and potassium accumulation, were identified as anthocyanin acyltransferase (AT), glutathione-S-transferase (GST), UDP-glucuronosyltransferase (UFGT), and potassium transporter (KUP). Three genes from the blue module and one gene from the yellow module (Blue.0200, Blue.1060, Blue.1580 and Yellow.3140) correlated with sugar and potassium transporters were identified as Sucrose-phosphate synthase (SPS), Pyruvate kinase (PK), and potassium transporter (KUP). These alleged main candidates are highlighted in red in the gene pool and selected based on their importance in the module (relation to anthocyanin, sugar, and potassium) and their expression profiles. The 11 major candidate genes predicted from the turquoise, blue, and yellow modules and the annotations are listed in Table 7.

2.11. RT-qPCR Analysis of Differentially Expressed Genes

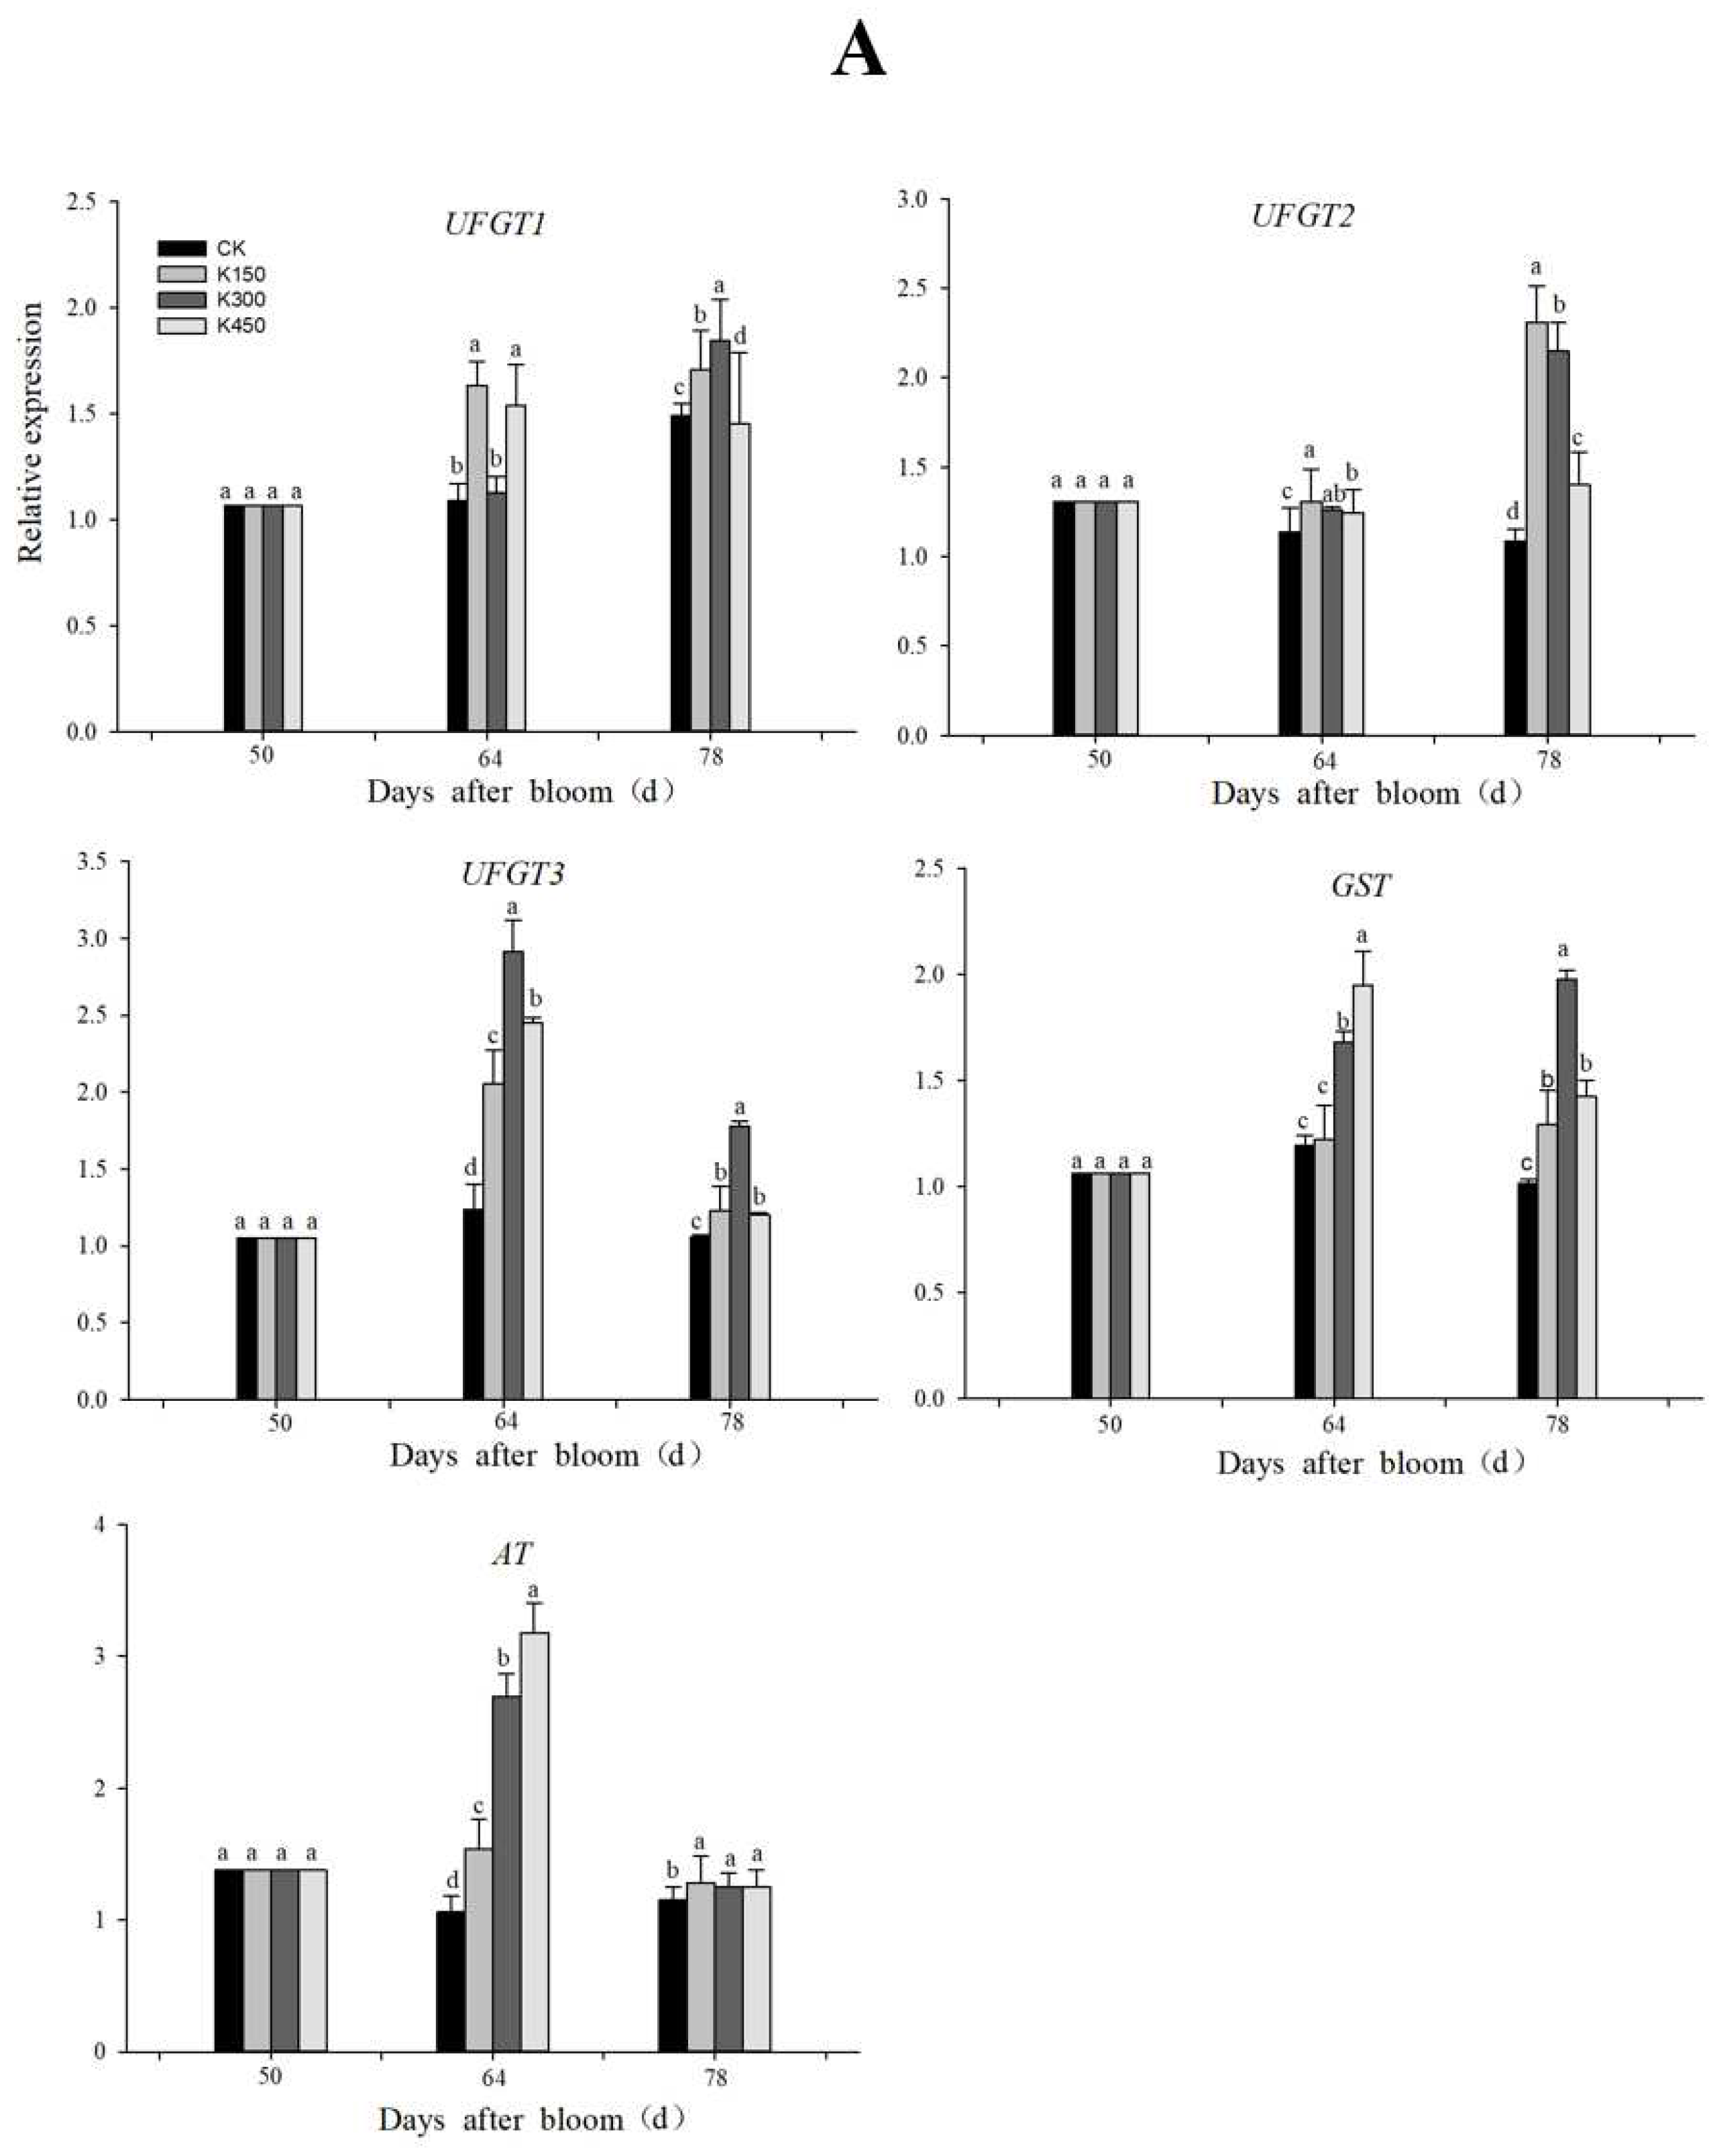
RT-qPCR analysis of 11 differential genes was performed (Figure 11). During the whole fruit development period of grape, compared with 50 DAB, the genes related to potassium transporter, glucose metabolism, and anthocyanin synthesis showed an overall upward trend, indicating that the accumulation of potassium, sugar, and anthocyanin in grape fruits mainly concentrated in the middle and late stage. Up-regulation of UFGT, GST, AT, SPS, PK, HT, and KUP genes promoted the accumulation of anthocyanins, sugars, and potassium in fruits at 64 and 78 DAB. K150 and K300 had significant effects on genes related to potassium transporter, sugar accumulation, and anthocyanin synthesis at 78 DAB.

3. Discussion

3.1. Anthocyanin Synthesis-Related Genes Responses to K Treatment

Flavonoids, especially anthocyanins, are the main pigments that determine the color of the grape fruit. As previously mentioned, anthocyanin accumulation was rapidly induced by K application [8]. Transcriptome analysis showed that the expression of five genes involved in anthocyanin synthesis, GST, AT, and three UFGT genes, were upregulated upon K treatment. Among them, the expression of UFGT is essential for anthocyanin biosynthesis [24]. In the present study, the expression levels of five anthocyanin synthesis genes were determined by RT-qPCR (Figure 11A). Interestingly, the transcript levels of all five anthocyanin synthesis genes were significantly increased after K supplementation compared to K0. The increase in anthocyanin biosynthesis gene expression coincided with the increase in anthocyanin content in potassium-treated fruits (Figure 1A), indicating that external K application affected anthocyanin production, both in terms of gene expression and metabolite levels [25]. All five genes identified in this study are related to anthocyanin synthesis, and GST is involved in anthocyanin transport. UFGT is involved in glycosylation transfer, which transfers UDP-glucose to the C3 hydroxyl group of anthocyanins, producing anthocyanin 3-glucoside, which improves the color of flowers or fruits. Anthocyanin acyltransferases modify the unstable anthocyanins [26]. These results suggest that several genes associated with anthocyanin synthesis respond to exogenous potassium application during berry ripening. This study also found that K150 and K300 treatments showed higher expression of anthocyanin synthesis-related genes at 78 DAB, which also indicated that low K induced better expression of anthocyanin synthesis-related genes than high K treatments. However, the regulation of the K-anthocyanin regulatory complex needs further study.

3.2. Sugar Metabolism-Related Genes Responses to K Treatment

It is well known that K is essential for the activity of many enzymes in plants [24]. Transcriptional analysis studies of genes in Arabidopsis, rice, and sugarcane during low K stress revealed a higher proportion of genes involved in metabolic processes than the sum of stress-responsive genes, such as the expression of many key enzymes essential for metabolism, those involved in pyruvate, sugar metabolism, and flavonoid biosynthesis [25,26]. Some genes of metabolic processes were identified by our transcriptome data, including the metabolism of starch and sucrose, glucose and mannose metabolism, which were expressed in grape fruits (Table 7). Sugar metabolism in the fruit is especially vigorous during ripening, and the majority of sugar comes from the photosynthesis of the leaves. The process of sugar metabolism has been more thoroughly investigated in previous studies [27]. In this paper, we studied different expression levels of the key genes associated with sugar metabolism of fruit maturation at low and high K state (Figure 11B).
In this study, the expression of some genes related to sugar metabolism were influenced by K treatment. Three sugar-related genes (SPS, PK, HT) were detected in this study. SPS, Sucrose phosphate synthase, is the rate-limiting enzyme in sucrose synthesis, and PK, Pyruvate kinase, is the rate-limiting enzyme in glycolysis and regulates C/N metabolism in metabolic enzymes [28]. Following chronic K deficiency, pyruvate kinase activity may be inhibited, resulting in a marked decrease in the amount of pyruvate in the cytoplasm, which may inhibit glycolysis and many downstream metabolic processes (TCA cycle) [29]. For grape berry, the accumulation of hexose is mainly from sucrose, which is exported from the source (leaves) and introduced into the fruit tissue cells [30]. During fruit ripening, sugar transporter (HT) genes also respond to K treatment. In general, compared with the K0 at 78 DAB, the sugar-related genes at different K levels were relatively up-regulated, increasing the concentration of glucose and fructose in grape fruits. This is in line with previous research findings [8].

3.3. Potassium Transporter-Related Genes Responses to K Treatment

It is well known that K deficiency can affect the uptake and accumulation of nutrients and their associated transporters [25], resulting in plant growth retardation [31]. We found that the expression of a number of K transporters were also influenced at both low and high K concentrations compared with K0 at 64 and 78 DAB (Figure 11C). This suggests that the growth and reproduction of grapes were poor in the period of K deficiency and that K transport from grape roots to shoots might have been inhibited. Ma et al. [25] showed that K content in rice roots and shoots was lower than normal K under low K stress, and the expression of OsHAK (1, 7, 11) was significantly increased. In contrast to that study, our study focused mainly on grape fruit. This study found that the levels of gene expression and channels of K transporters significantly up-regulated the K treatment compared with K0 (Figure 11C). Interestingly, the gene expression associated with potassium transporters in the low K was higher than high K at 78 DAB. These data are generally consistent with our physiological data (Table 2). The three potassium transporter proteins identified in this study belong to the HAK/KUP/KT transporter family; it has been shown that the Shaker channel family and the HAK/KUP/KT transporter family, with nine and 13 members in A. thaliana and nine and 27 members in rice, respectively, play a major role in plant K+ uptake from the soil and long-distance transport [31,32]. It has been reported that specific K channels were linked to sugar loading and unloading in Vicia faba and maize [33]. These results indicate the importance of potassium transporter proteins for fruit development, and of course, there are many more than these three potassium transporter proteins at play for fruit development; this should be further studied in future experiments.

4. Conclusions

The results showed that K content, sugar concentration, and anthocyanin content in grapes were significantly affected by K levels, especially when treated with K150 and K300. We performed RNA-Seq on fruit samples collected from 50, 64, and 78 DAB and analyzed gene expression related to sugar, anthocyanin, and potassium concentrations to determine the molecular mechanisms explaining the different responses of fruit to low and high potassium. Based on the analysis of biological functions, the majority of differentially expressed genes were found in the ‘metabolic pathway’, ‘hormonal signal transmission’, ‘ion transmembrane transport’, and ‘ROS reaction’. Different levels of potassium treatment can promote the accumulation of potassium, sugar, and anthocyanin by inducing the up-regulation of potassium transporters genes (3 HAK/KUP/KT genes), sugar metabolism genes (HT, SPS and PK genes), and anthocyanin genes (GST, AT, and 3 UFGT genes), thus improving fruit quality. However, low potassium is better than high potassium. This is the first comprehensive study using transcriptomics to study the response of grape berries to low and high potassium environments. The results of this study will provide a theoretical basis for further research on the regulatory mechanism of some candidate genes, reveal the molecular mechanism of improving fruit quality through potassium addition, and also provide a scientific basis for the rational application of potassium fertilizer by fruit farmers in production; of course, some functional validation is necessary in subsequent studies, which are essential to further elucidate the mechanism of fruit growth in grapes due to K/deficiency conditions of application.

Author Contributions

Conceptualization, D.L. and H.H.; methodology, H.H., J.W., D.L. and X.L.; performed the experiments, H.H., P.W., Q.X., Y.L., X.Z., W.H. and L.L.; software, H.H. and P.W.; validation, H.H., Q.X. and Y.L.; formal analysis, H.H. and X.Z.; investigation, Q.X. and W.H.; writing—original draft preparation, H.H.; writing—review and editing, D.L., L.L. and H.X.; project administration, D.L., X.L. and J.W. All authors have read and agreed to the published version of the manuscript.

Funding

This research was supported by funding from the Sichuan Provincial Science and Technology Program (2022YFN0005, 2020JDPT0004 and 2021YFYZ0010), Sichuan Fruit Innovation Team (sccxtd-04) and National Key R&D Program of China (2019YFD1000103).

Institutional Review Board Statement

Not applicable.

Informed Consent Statement

Not applicable.

Data Availability Statement

Not applicable.

Conflicts of Interest

The authors declare no conflict of interest.

References

  1. Pilati, S.; Bagagli, G.; Sonego, P.; Moretto, M.; Brazzale, D.; Castorina, G.; Simoni, L.; Tonelli, C.; Guella, G.; Engelen, K.; et al. Abscisic Acid Is a Major Regulator of Grape Berry Ripening Onset: New Insights into ABA Signaling Network. Front. Plant Sci. 2017, 8, 1093. [Google Scholar] [CrossRef] [PubMed] [Green Version]
  2. FAO. Available online: https://www.fao.org/faostat/en/#data/QCL (accessed on 19 May 2022).
  3. Colombo, R.C.; Roberto, S.R.; da Cruz, M.A.; de Carvalho, D.U.; Yamamoto, L.Y.; Nixdorf, S.L.; Perez-Navarro, J.; Gomez-Alonso, S.; Shahab, M.; Ahmed, S.; et al. Characterization of the phenolic ripening development of ‘BRS Vitoria’ seedless table grapes using HPLC-DAD-ESI-MS/MS. J. Food Compos. Anal. 2021, 95, 103693. [Google Scholar] [CrossRef]
  4. Villette, J.; Cuellar, T.; Verdeil, J.-L.; Delrot, S.; Gaillard, I. Grapevine Potassium Nutrition and Fruit Quality in the Context of Climate Change. Front. Plant Sci. 2020, 11, 123. [Google Scholar] [CrossRef] [PubMed] [Green Version]
  5. Wang, Y.; Chen, Y.-F.; Wu, W.-H. Potassium and phosphorus transport and signaling in plants. J. Integr. Plant Biol. 2021, 63, 34–52. [Google Scholar] [CrossRef] [PubMed]
  6. Pushpavathi, Y.; Satisha, J.; Satisha, G.C.; Shivashankara, K.S.; Reddy, M.L.; Sriram, S. Influence of different sources and methods of potassium application on the quality of grapes cv. Sharad Seedless (Vitis vinifera L.). Curr. Sci. 2020, 118, 639–643. [Google Scholar] [CrossRef]
  7. Strydom, J. The Effect of Foliar Potassium and Seaweed Products in Combination with a Leonardite Fertigation Product on Flame Seedless Grape Quality. S. Afr. J. Enol. Vitic. 2014, 35, 283–291. [Google Scholar] [CrossRef] [Green Version]
  8. Obenland, D.; Feliziani, E.; Zhu, S.; Zhao, X.; Margosan, D.A.; Gabler, F.M.; Van Zyl, S.; Romanazzi, G.; Smilanick, J.L.; Beno-Moualem, D.; et al. Potassium application to table grape clusters after veraison increases soluble solids by enhancing berry water loss. Sci. Hortic. 2015, 187, 58–64. [Google Scholar] [CrossRef]
  9. Feliziani, E.; Smilanick, J.L.; Margosan, D.A.; Mansour, M.F.; Romanazzi, G.; Gu, S.; Gohil, H.L.; Ames, Z.R. Preharvest Fungicide, Potassium Sorbate, or Chitosan Use on Quality and Storage Decay of Table Grapes. Plant Dis. 2013, 97, 307–314. [Google Scholar] [CrossRef] [Green Version]
  10. Yao, X.; Horie, T.; Xue, S.; Leung, H.-Y.; Katsuhara, M.; Brodsky, D.E.; Wu, Y.; Schroeder, J.I. Differential sodium and potassium transport selectivities of the rice OsHKT2;1 and OsHKT2;2 transporters in plant cells. Plant Physiol. 2009, 152, 341–355. [Google Scholar] [CrossRef] [Green Version]
  11. Camarena, L.; Bruno, V.; Euskirchen, G.; Poggio, S.; Snyder, M. Molecular mechanisms of ethanol-induced pathogenesis revealed by RNA-sequencing. PLoS Pathog. 2010, 6, e1000834. [Google Scholar] [CrossRef]
  12. Venturini, L.; Ferrarini, A.; Zenoni, S.; Tornielli, G.B.; Fasoli, M.; Dal Santo, S.; Minio, A.; Buson, G.; Tononi, P.; Zago, E.D.; et al. De novo transcriptome characterization of Vitis vinifera cv. Corvina unveils varietal diversity. BMC Genom. 2013, 14, 41. [Google Scholar] [CrossRef] [Green Version]
  13. Rienth, M.; Torregrosa, L.; Luchaire, N.; Chatbanyong, R.; Lecourieux, D.; Kelly, M.T.; Romieu, C. Day and night heat stress trigger different transcriptomic responses in green and ripening grapevine (vitis vinifera) fruit. BMC Plant Biol. 2014, 14, 108. [Google Scholar] [CrossRef] [Green Version]
  14. Mpelasoka, B.S.; Schachtman, D.P.; Treeby, M.T.; Thomas, M.R. A review of potassium nutrition in grapevines with special emphasis on berry accumulation. Aust. J. Grape Wine Res. 2003, 9, 154–168. [Google Scholar] [CrossRef]
  15. Liang, B.; Ma, C.; Zhang, Z.; Wei, Z.; Gao, T.; Zhao, Q.; Ma, F.; Li, C. Long-term exogenous application of melatonin improves nutrient uptake fluxes in apple plants under moderate drought stress. Environ. Exp. Bot. 2018, 155, 650–661. [Google Scholar] [CrossRef]
  16. Xia, H.; Wang, X.; Su, W.; Jiang, L.; Lin, L.; Deng, Q.; Wang, J.; Deng, H.; Hu, R.; Liao, M.; et al. Changes in the carotenoids profile of two yellow-fleshed kiwifruit cultivars during storage. Postharvest Biol. Technol. 2020, 164, 111162. [Google Scholar] [CrossRef]
  17. Lin, K.-H.; Huang, M.-Y.; Huang, W.-D.; Hsu, M.-H.; Yang, Z.-W.; Yang, C.-M. The effects of red, blue, and white light-emitting diodes on the growth, development, and edible quality of hydroponically grown lettuce (Lactuca sativa L. var. capitata). Sci. Hortic. 2013, 150, 86–91. [Google Scholar] [CrossRef]
  18. Liu, J.; Yue, R.; Si, M.; Wu, M.; Cong, L.; Zhai, R.; Yang, C.; Wang, Z.; Ma, F.; Xu, L. Effects of Exogenous Application of Melatonin on Quality and Sugar Metabolism in ‘Zaosu’ Pear Fruit. J. Plant Growth Regul. 2019, 38, 1161–1169. [Google Scholar] [CrossRef]
  19. Zhang, J.; Wang, X.; Yu, O.; Tang, J.; Gu, X.; Wan, X.; Fang, C. Metabolic profiling of strawberry (Fragariaxananassa Duch.) during fruit development and maturation. J. Exp. Bot. 2011, 62, 1103–1118. [Google Scholar] [CrossRef]
  20. Langfelder, P.; Horvath, S. WGCNA: An R package for weighted correlation network analysis. BMC Bioinform. 2008, 9, 559. [Google Scholar] [CrossRef] [Green Version]
  21. Umer, M.J.; Bin Safdar, L.; Gebremeskel, H.; Zhao, S.; Yuan, P.; Zhu, H.; Kaseb, M.O.; Anees, M.; Lu, X.; He, N.; et al. Identification of key gene networks controlling organic acid and sugar metabolism during watermelon fruit development by integrating metabolic phenotypes and gene expression profiles. Hortic. Res. 2020, 7, 193. [Google Scholar] [CrossRef]
  22. Livak, K.J.; Schmittgen, T.D. Analysis of relative gene expression data using real-time quantitative PCR and the 2(-Delta Delta C(T)) Method. Methods 2001, 25, 402–408. [Google Scholar] [CrossRef] [PubMed]
  23. Sant’Anna, V.; Gurak, P.D.; Ferreira Marczak, L.D.; Tessaro, I.C. Tracking bioactive compounds with colour changes in foods—A review. Dye. Pigment. 2013, 98, 601–608. [Google Scholar] [CrossRef]
  24. Zoerb, C.; Senbayram, M.; Peiter, E. Potassium in agriculture—Status and perspectives. J. Plant Physiol. 2014, 171, 656–669. [Google Scholar] [CrossRef] [PubMed]
  25. Ma, T.-L.; Wu, W.-H.; Wang, Y. Transcriptome analysis of rice root responses to potassium deficiency. BMC Plant Biol. 2012, 12, 161. [Google Scholar] [CrossRef] [PubMed] [Green Version]
  26. Zeng, Q.; Ling, Q.; Fan, L.; Li, Y.; Hu, F.; Chen, J.; Huang, Z.; Deng, H.; Li, Q.; Qi, Y. Transcriptome Profiling of Sugarcane Roots in Response to Low Potassium Stress. PLoS ONE 2015, 10, e0126306. [Google Scholar] [CrossRef]
  27. Cao, T.; Lahiri, I.; Singh, V.; Louis, J.; Shah, J.; Ayre, B.G. Metabolic engineering of raffinose-family oligosaccharides in the phloem reveals alterations in carbon partitioning and enhances resistance to green peach aphid. Front. Plant Sci. 2013, 4, 263. [Google Scholar] [CrossRef] [Green Version]
  28. Smith, C.R.; Knowles, V.L.; Plaxton, W.C. Purification and characterization of cytosolic pyruvate kinase from Brassica napus (rapeseed) suspension cell cultures: Implications for the integration of glycolysis with nitrogen assimilation. Eur. J. Biochem. 2000, 267, 4477–4485. [Google Scholar] [CrossRef] [Green Version]
  29. Armengaud, P.; Sulpice, R.; Miller, A.J.; Stitt, M.; Amtmann, A.; Gibon, Y. Multilevel Analysis of Primary Metabolism Provides New Insights into the Role of Potassium Nutrition for Glycolysis and Nitrogen Assimilation in Arabidopsis Roots. Plant Physiol. 2009, 150, 772–785. [Google Scholar] [CrossRef] [Green Version]
  30. Lecourieux, F.; Kappel, C.; Lecourieux, D.; Serrano, A.; Torres, E.; Arce-Johnson, P.; Delrot, S. An update on sugar transport and signalling in grapevine. J. Exp. Bot. 2014, 65, 821–832. [Google Scholar] [CrossRef] [Green Version]
  31. Chen, G.; Feng, H.; Hu, Q.; Qu, H.; Chen, A.; Yu, L.; Xu, G. Improving rice tolerance to potassium deficiency by enhancing OsHAK16p:WOX11-controlled root development. Plant Biotechnol. J. 2015, 13, 833–848. [Google Scholar] [CrossRef]
  32. Yang, T.; Zhang, S.; Hu, Y.; Wu, F.; Hu, Q.; Chen, G.; Cai, J.; Wu, T.; Moran, N.; Yu, L.; et al. The Role of a Potassium Transporter OsHAK5 in Potassium Acquisition and Transport from Roots to Shoots in Rice at Low Potassium Supply Levels. Plant Physiol. 2014, 166, 945–959. [Google Scholar] [CrossRef] [Green Version]
  33. Philippar, K.; Buchsenschutz, K.; Abshagen, M.; Fuchs, I.; Geiger, D.; Lacombe, B.; Hedrich, R. The K+ channel KZM1 mediates potassium uptake into the phloem and guard cells of the C4 grass Zea mays. J. Biol. Chem. 2003, 278, 16973–16981. [Google Scholar] [CrossRef]
Figure 1. (A): Anthocyanin content in skin. (B): Soluble solids content in flesh. Different lowercase letters indicate significant differences among the treatments (Duncan’s Multiple Range Test, p < 0.05).
Ijms 24 01218 g001
Figure 2. (A): Soluble sugar content in flesh. (B): Titratable acid content in flesh. Different lowercase letters indicate significant differences among the treatments (Duncan’s Multiple Range Test, p < 0.05).
Ijms 24 01218 g002
Figure 3. (A): Glucose content in flesh. (B): Fructose content in flesh. Different lowercase letters indicate significant differences among the treatments (Duncan’s Multiple Range Test, p < 0.05).
Ijms 24 01218 g003
Figure 4. (A): Tartaric acid content; (B): malic acid content. Different lowercase letters indicate significant differences among the treatments (Duncan’s Multiple Range Test, p < 0.05).
Ijms 24 01218 g004
Figure 5. (A): Principal component analysis; (B): correlation analysis (red represents positive correlation, blue represents negative correlation, the shade of color represents the degree of correlation, and * represents p ≤ 0.05).
Ijms 24 01218 g005
Figure 6. Venn diagram of differentially expressed genes. (A): Venn diagram at 64 DAB. (B): Venn diagram at 78 DAB. (p < 0.05 and fold change equal or greater than 2).
Ijms 24 01218 g006
Figure 7. (A): The total number of DEGs, up-regulated and down-regulated at 64 DAB; (B): the total number of DEGs, up-regulated and down-regulated at 78 DAB.
Ijms 24 01218 g007
Figure 8. Go enrichment analysis of differentially expressed genes at 78 DAB ((A): E vs. G, (B): F vs. G, (C): H vs. G).
Ijms 24 01218 g008
Figure 9. KEGG enrichment analysis of differentially expressed genes at 78 DAB. ((A): E vs. G, (B): F vs. G, (C): H vs. G).
Ijms 24 01218 g009aIjms 24 01218 g009b
Figure 10. WGCNA identified gene networks and key candidate genes during grape fruit development. (A): Hierarchical clusters represent 21 distinct modules with co-expressed genes. Each leaflet in the tree represents an individual gene. (B): Pearson correlation-based module trait relationship. The color grids from blue to red represent the r2 value (−1 to 1). (CE): The red module gene network was significantly correlated with the content of sugar, anthocyanin, and potassium. Key candidates within each network are highlighted in deep red based on highest weight in their respective module and identified for gene descriptors based on annotation results.
Ijms 24 01218 g010aIjms 24 01218 g010b
Figure 11. Comparison of expression profiles of representative genes detected by RT-qPCR, different letters (abcd) indicate the difference is significant (Duncan’s Multiple Range Test, p < 0.05). The column represents the expression detected by RT-qPCR. (A): Relative expression levels of anthocyanin-related genes; (B): relative expression levels of sugar-related genes; (C): relative expression levels of potassium-related genes.
Ijms 24 01218 g011aIjms 24 01218 g011b
Table 1. Gene primers for RT-qPCR.
Gene NumberReference Gene Number in NCBIForward Primer (5′-3′)TM
(°C)
Reverse Primer (5′-3′)TM
(°C)
VIT_11s0118g00200XM_002265437TACTTGGAGGCGATTCTGGA55.4GTGGGACTGAATCTCCCTCT56.5
VIT_03s0063g00050XM_002285067CTCGATGTGGAGAAGACAGC57.5CCTGAGACCTCGTCAATTCG57.5
VIT_14s0068g00850XM_010662357GAAACCCTTCCCAGCTTTCA57.5AAAGTGGTGAAGTGCTCAGG57.5
VIT_03s0017g00870XM_010649854GATGGATTCACTGCTGCTCA55.4TGGCAAGAAAGAGGCCAAAT54.4
VIT_10s0071g01060XM_010657659GCCAGTAGTTACTGCCACTC57.5CTCTCCACTGAGCATGACAC57.5
VIT_14s0066g01580XM_010662640GCTTGCTGATGAGGAACTGT55.4AGCCAGAACAAGCAATACCC55.4
VIT_07s0104g01730NM_001280973TGAGGTGATGGCAGAGAAAG55.4TTGTGTGGAATGTCAAATACCTT54.4
VIT_19s0015g02680XM_003634701GCTTCTTGAGATGAACCCGA57.5GGTATGGGTCACTAGGCAAC57.5
VIT_05s0020g03140NM_001281278CGTCTCTATATCTTGCGGGC57.5CGGTATTAAGCACCACTCCC57.5
VIT_18s0001g06060XM_002285734CCAAACTCAACGACAGAGGT55.4ACTGCACATAGGCCATGAAG55.4
VIT_17s0000g04750XM_002268053GGGCGTGTCACATATTGTCT56.5GGGGAATTGGGAATGCTAGG57.5
VvGAPDHGU585870TTCTCGTTGAGGGCTATTCCA57.5CCACAGACTTCATCGGTGACA57.5
Table 2. Potassium content of grape fruit (mg·g−1).
DaysTreatment
K0-CKK150K300K450
50 DAB1.135 ± 0.029 a1.135 ± 0.029 a1.135 ± 0.029 a1.135 ± 0.029 a
64 DAB1.142 ± 0.002 b1.154 ± 0.006 b1.256 ± 0.017 a1.255 ± 0.002 a
78 DAB1.188 ± 0.013 d1.332 ± 0.002 b1.370 ± 0.019 a1.241 ± 0.020 c
Note: Different letters indicate the difference is significant (Duncan’s Multiple Range Test, p < 0.05).
Table 3. Soil potassium content (mg·g−1).
DaysTreatment
K0-CKK150K300K450
78 DAB27.239 ± 0.156 a24.184 ± 0.099 d25.080 ± 0.086 c25.565 ± 0.166 b
Note: Different letters indicate the difference is significant (Duncan’s Multiple Range Test, p < 0.05).
Table 4. The berry skin color.
TreatmentL*a*b*
K0-CK23.18 ± 0.20 a1.27 ± 0.02 b−1.02 ± 0.14 a
K15022.43 ± 0.12 b −1.69 ± 0.06 d−1.35 ± 0.08 b
K30021.48 ± 0.16 c1.00 ± 0.08 c−1.88 ± 0.09 c
K45022.41 ± 0.25 b1.47 ± 0.03 a−1.48 ± 0.02 b
Note: Different letters indicate the difference is significant (Duncan’s Multiple Range Test, p < 0.05).
Table 5. Summary of sample sequencing data quality.
DaysSampleTotal Raw ReadsTotal Clean ReadsClean BasesGC PercentageQ20 PercentageQ30 Percentage
50 DABT-CK47158728457942246.87 G46.9397.6693.59
64 DABA-CK46651772455471606.83 G47.0497.8994.11
B-K15047439556454963846.82 G47.1297.3792.73
C-K30045645408438789266.58 G47.0897.7193.76
D-K45046533625449515846.74 G47.8497.2892.85
78 DABE-CK47322815459347906.89 G47.6997.4293.11
F-K15049139536474000207.11 G46.8597.5693.38
G-K30043948610424250476.37 G48.4097.1792.95
H-K45045027932434932116.52 G47.2497.5693.54
Table 6. Overview of KEGG analysis of differentially expressed genes.
KEGG IDMetabolic Pathways64 DAB78 DABTotal Number of Differentially Expressed Genes for Pathway Annotations
AVSCBVSCCVSDEVSGFVSGGVSH
vvi0480Glutathione metabolism15165141822137
vvi0052Galactose metabolism17139661590
vvi04075Plant hormone signal transduction36201719361566
vvi0051Fructose and mannose metabolism14766714143
vvi00010Glycolysis/Gluconeogenesis301322891954
vvi00500Starch and sucrose metabolism24201681919101
vvi04626Plant-pathogen interaction301515163539106
vvi00061Fatty acid biosynthesis444375150
vvi00941Flavonoid biosynthesis94445453027
Table 7. Hub genes selected from three co-expressed modules.
Gene NumberModuleWeightAnnotation
VIT_10s0071g01060blue0.3923Pyruvate kinase (PK)
VIT_11s0118g00200blue0.4789Sucrose-phosphate synthase (SPS)
VIT_05s0020g03140yellow0.5734Hexose transporter (HT)
VIT_03s0063g00050turquoise0.5236Glycosyltransferase (UFGT1)
VIT_17s0000g04750turquoise0.4572Glycosyltransferase (UFGT2)
VIT_19s0015g02680turquoise0.5267Glutathione-S-transferase (GST1)
VIT_14s0068g00850turquoise0.5182Potassium transporter (KUP1)
VIT_14s0066g01580blue0.4959Potassium transporter (KUP2)
VIT_03s0017g00870turquoise0.4123Anthocyanin acyltransferase (AT)
VIT_07s0104g01730turquoise0.5097Potassium transporter (KUP3)
VIT_18s0001g06060turquoise0.4996Glycosyltransferase (UFGT3)
Disclaimer/Publisher’s Note: The statements, opinions and data contained in all publications are solely those of the individual author(s) and contributor(s) and not of MDPI and/or the editor(s). MDPI and/or the editor(s) disclaim responsibility for any injury to people or property resulting from any ideas, methods, instructions or products referred to in the content.