1. Introduction
Mental disorders refer to a wide range of mental health conditions that are among the most important health problems of the 21st century, and among them, the soaring incidence of depression is a serious challenge to contemporary medicine [
1]. Despite many years of research and a variety of pharmacological approaches [
2], this disease still produces a long-term negative impact on the quality of life and a significant reduction in life expectancy. Depression is a complex disorder characterized by alterations in several biological systems, including genetic, neuroendocrine, biological, psychosocial, and environmental interactions. Among the factors that raise the incidence of depression, stress plays a particularly important role. Stress exerts many effects on the central nervous system (CNS) and can cause structural changes in different parts of the brain [
3] that have long-term effects, which have been shown in both preclinical and clinical studies [
4]. By activating the hypothalamic–pituitary–adrenal (HPA) axis, stress affects neurotransmission, the immune system, and metabolism and leads to disturbances in the function of CNS cells. The observed neurotransmission deficits in the course of depression are accompanied by an array of other changes that together cause the manifestation of depressive symptoms. It is well known that the prenatal period is especially sensitive to traumatic stress stimuli, and during this period, environmental stress may have adverse effects on offspring and increase the risk of depression during adulthood. However, the nature of this link has not been comprehensively studied, and several mechanisms must be taken into account. Many lines of evidence from human studies indicate that exposure to excessive levels of stress hormones, glucocorticoids (GCs), significantly increases the risk of depression later in life [
5].
The GCs are steroid hormones that act via mineralocorticoid receptors (MRs) and glucocorticoid receptors (GRs) [
6]. The MR has a high affinity for GCs and plays a pivotal role during basal physiological conditions, whereas the GR, a transcriptional regulator, is characterized by a reduced affinity for GCs and responsiveness when their levels are high, which is common in depression [
7]. Disturbances in GR function, mostly in the prefrontal cortex, hippocampus, and hypothalamus, are considered to be involved in the development of depression among those with impaired GR expression/function and HPA axis hyperactivity, both in humans and animal models [
8,
9]. GCs play an important role in neuronal survival processes, neurogenesis, cognitive function, memory formation, and inflammatory processes [
10], and severe or chronic stress exposure at different periods of life can disrupt these processes, cause neural cell death and atrophy of neuronal processes, and affect neurogenesis and plasticity. Moreover, the effects of GCs on brain structure and function vary across the lifespan.
It has been shown that exposure of the brain to high levels of GCs at early stages of life may have long-lasting and dramatic consequences on later HPA function and other glucocorticoid-sensitive processes, such as metabolism, in humans and rodents [
11]. Adverse events in early life (which often result in GC elevation) may exert similar effects [
12]. For example, the widely used, potent GR agonist synthetic glucocorticoid dexamethasone (DEX) treatment in the prenatal period leads to long-term changes in HPA axis activity and in the level of neurotransmitters [
13]. However, the World Health Organization guidelines for procedures followed when there is a risk of a premature delivery recommend antenatal corticosteroid therapy in cases of threatened premature birth between 24 and 34 weeks of pregnancy. In such cases, synthetic glucocorticoids (sGCs) are administered to accelerate the maturation of the alveolar epithelium and to stimulate respiratory system maturation in the fetus [
14]. Notwithstanding, there is evidence from animal models that antenatal corticosteroid treatment may have an adverse impact on the development of the immature brain by inhibiting growth factors and facilitating apoptosis [
15]. However, the effects of exposure to this steroid in the prenatal period on the induction of permanent metabolic alterations in the brain and the mechanism responsible for the majority of changes observed in the offspring remain unclear.
The long-lasting effects of GCs are particularly worth investigating because currently, great importance is attached to metabolic disturbances in CNS cells, which may be one of the main causes of depression [
16]. Glucose metabolism provides fuel for physiological brain function through the generation of ATP. Energy is necessary for the proper function of neurons including the bioenergetic basis for neurotransmission, scavenging of free radicals, regulation of cell death and calcium homeostasis [
17,
18]. Inadequate energy supply and bioenergetic deficits affect almost every level of the cellular or biochemical cascades and predispose individuals to a variety of brain disorders, such as depression.
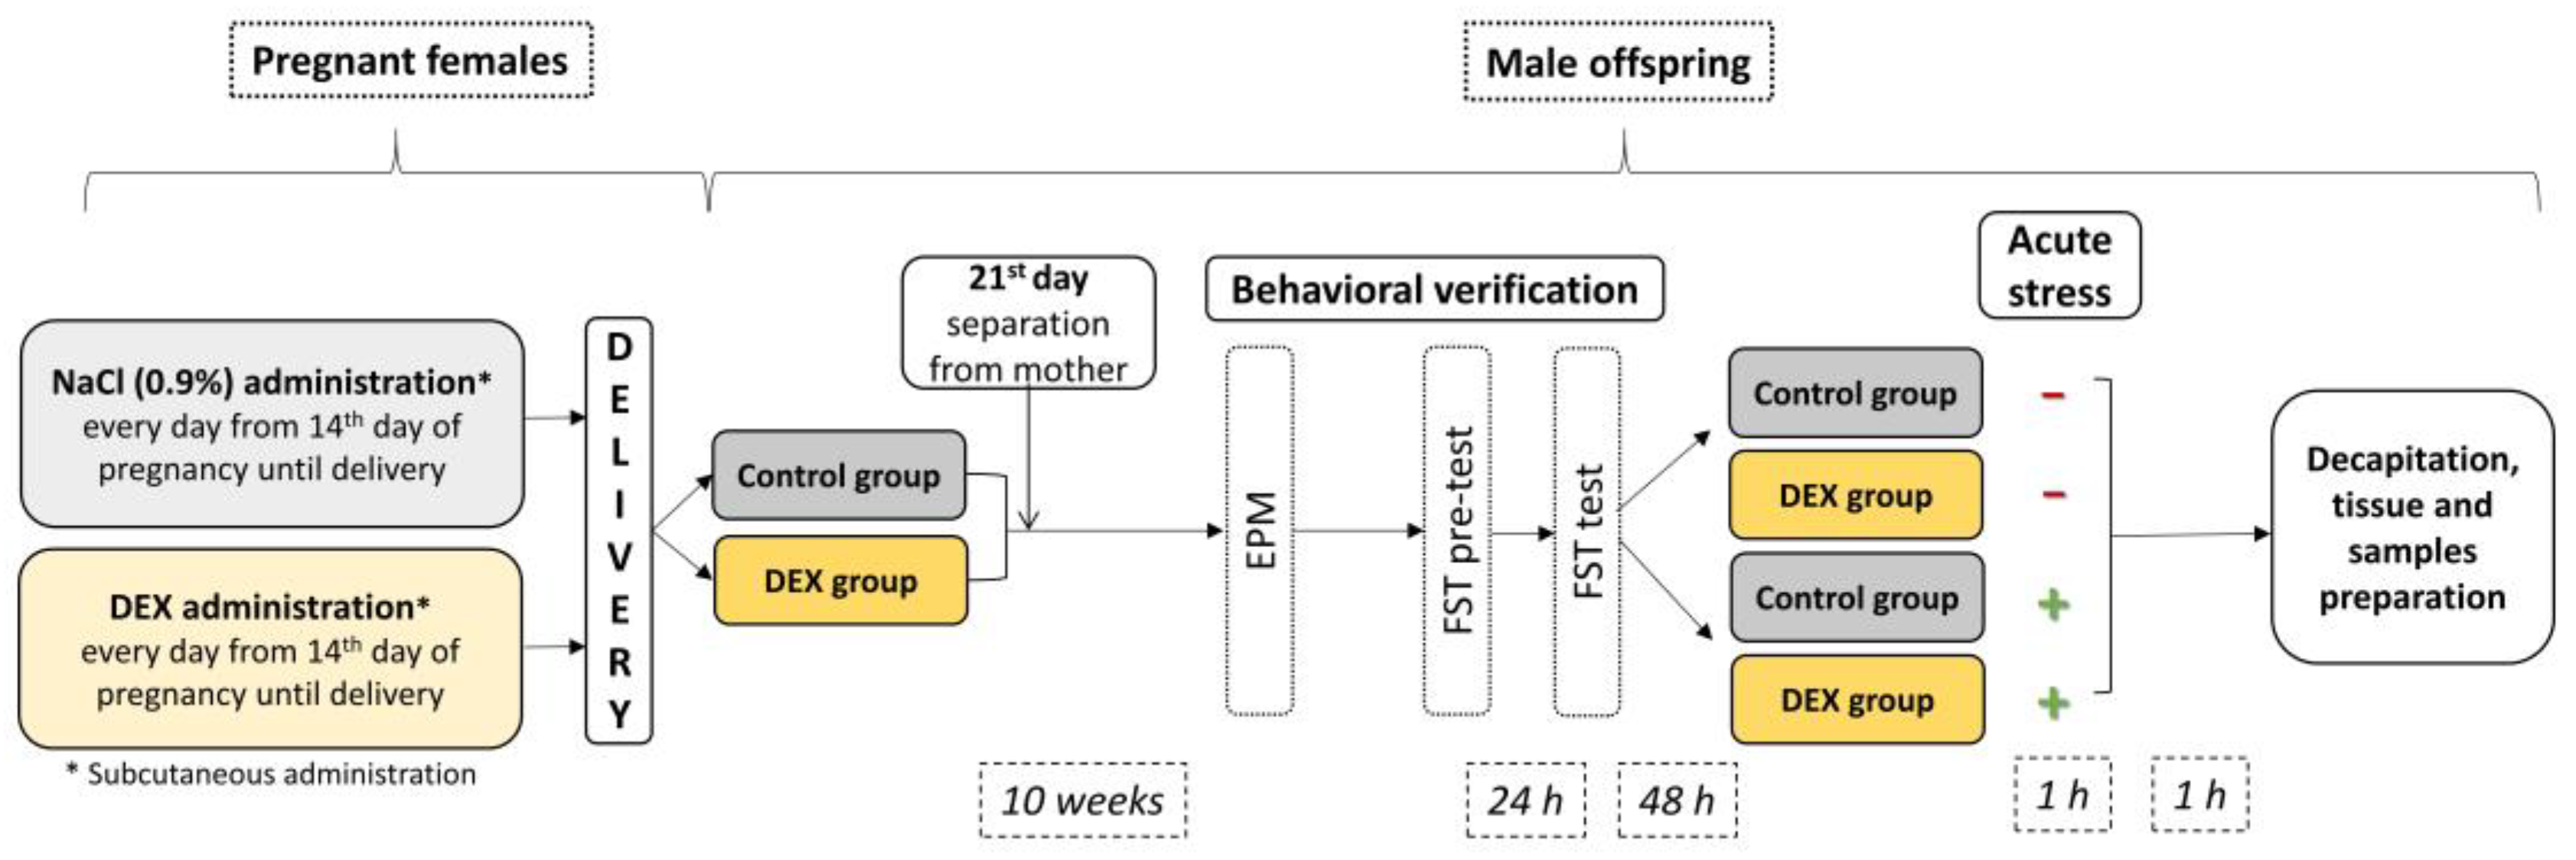
Thus, we investigated whether third-trimester prenatal DEX treatment is associated with metabolic alterations in the brain at adult age using a rat model of depression (
Figure 1). In this study, we used rats prenatally exposed to DEX as a model of depression, which is well characterized. Existing studies on humans and rodents have shown that repeated exposure to DEX in late gestation leads to depression-like behavior, increased HPA axis activity, and immune system alterations in adult offspring, and this phenotype can be reversed by antidepressant drug treatment [
19,
20,
21,
22]. Our aim was to determine not only the impact of DEX on behavioral changes but also on the glycolysis, Krebs cycle, oxidative phosphorylation, and insulin signaling pathway in the brain to bring us closer to understanding the background of depression-like deficits. In the first phase of the experiment, we asked ourselves whether there is an impairment of ATP production in the process of oxidative phosphorylation in animals treated with DEX in the prenatal period, in two brain structures involved in the pathomechanisms of depression: in the frontal cortex and the hippocampus. Then we tried to trace the energy production in the brain also at other stages and found the mechanisms behind the DEX-induced changes. At this stage, we additionally included groups of animals stressed in adulthood, as the structures and processes we study may be sensitive to this factor.
3. Discussion
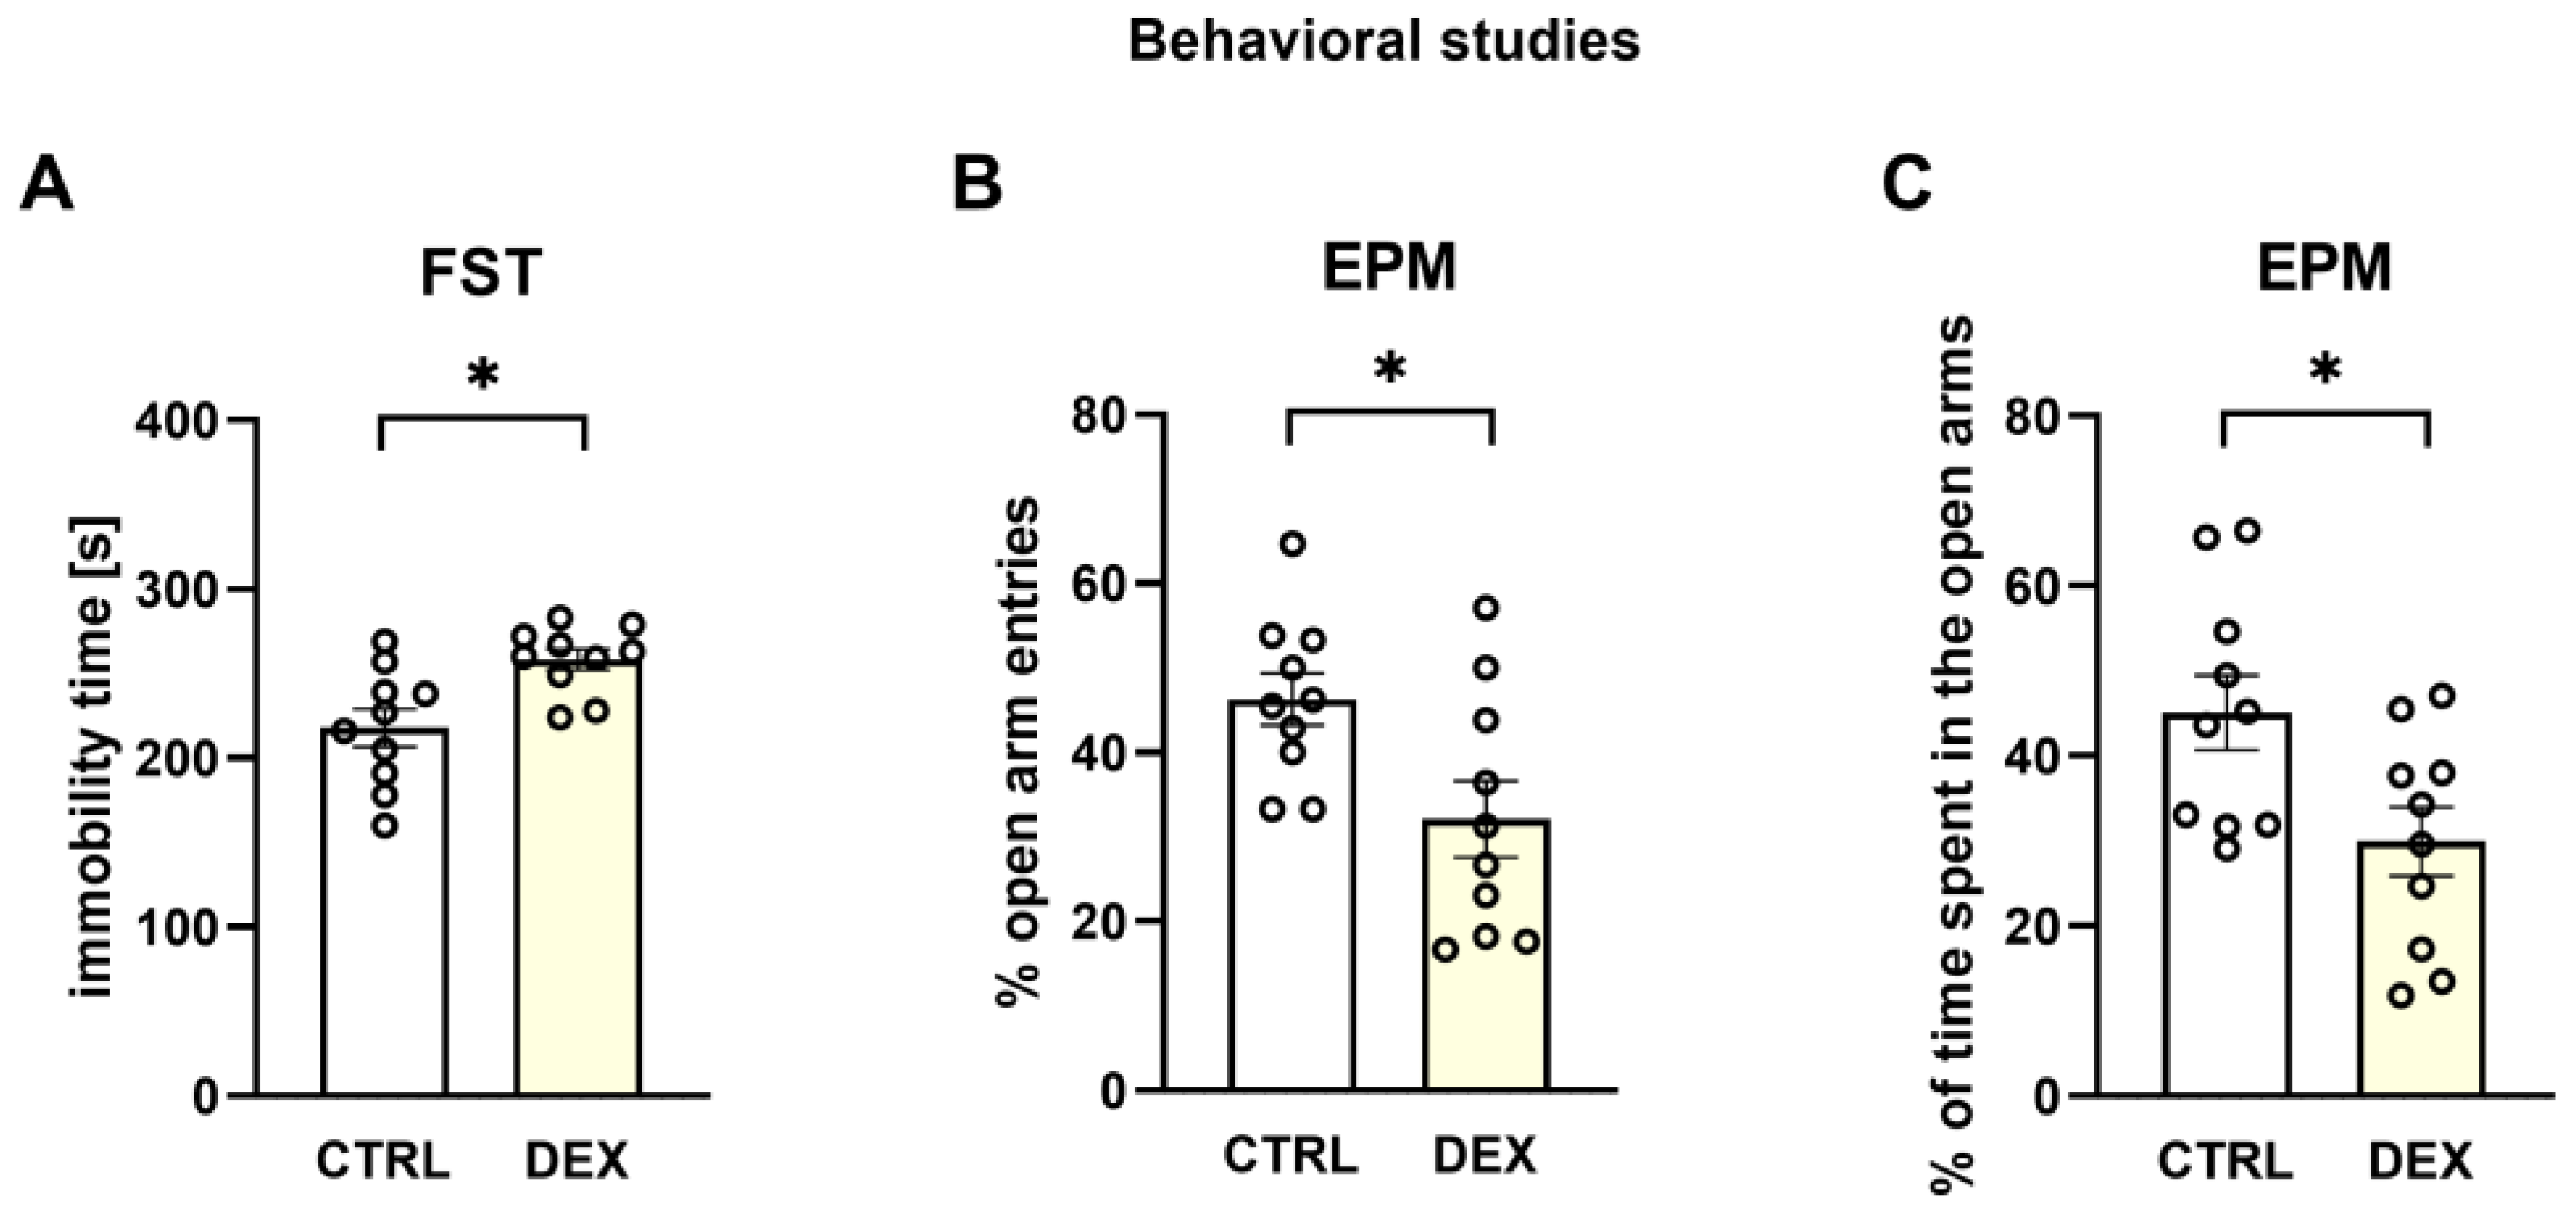
The animal model of depression used in the present study was positively verified in our lab by demonstrating the behavioral changes characteristic of depression in the male offspring of mothers receiving DEX in the third trimester of pregnancy. The presence of depressive-like behaviors was evidenced by the extended immobility time shown in the FST and anxiety behavior, a symptom common in depression, demonstrated by a decrease in the open arm entries and a reduction in the time spent in open arms in the EPM. Moreover, this model of depression based on DEX prenatal administration was previously behaviorally and pharmacologically verified by other authors [
21,
22]. Selected administration time and a low dose (0.1 mg/kg) were intended to simulate the conditions of dexamethasone use in the clinic. However, it should be noted that our schedule of treatment differed from that used in the clinic as dexamethasone was administered 1/3 of the gestation period and in humans it is administered in several divided doses.
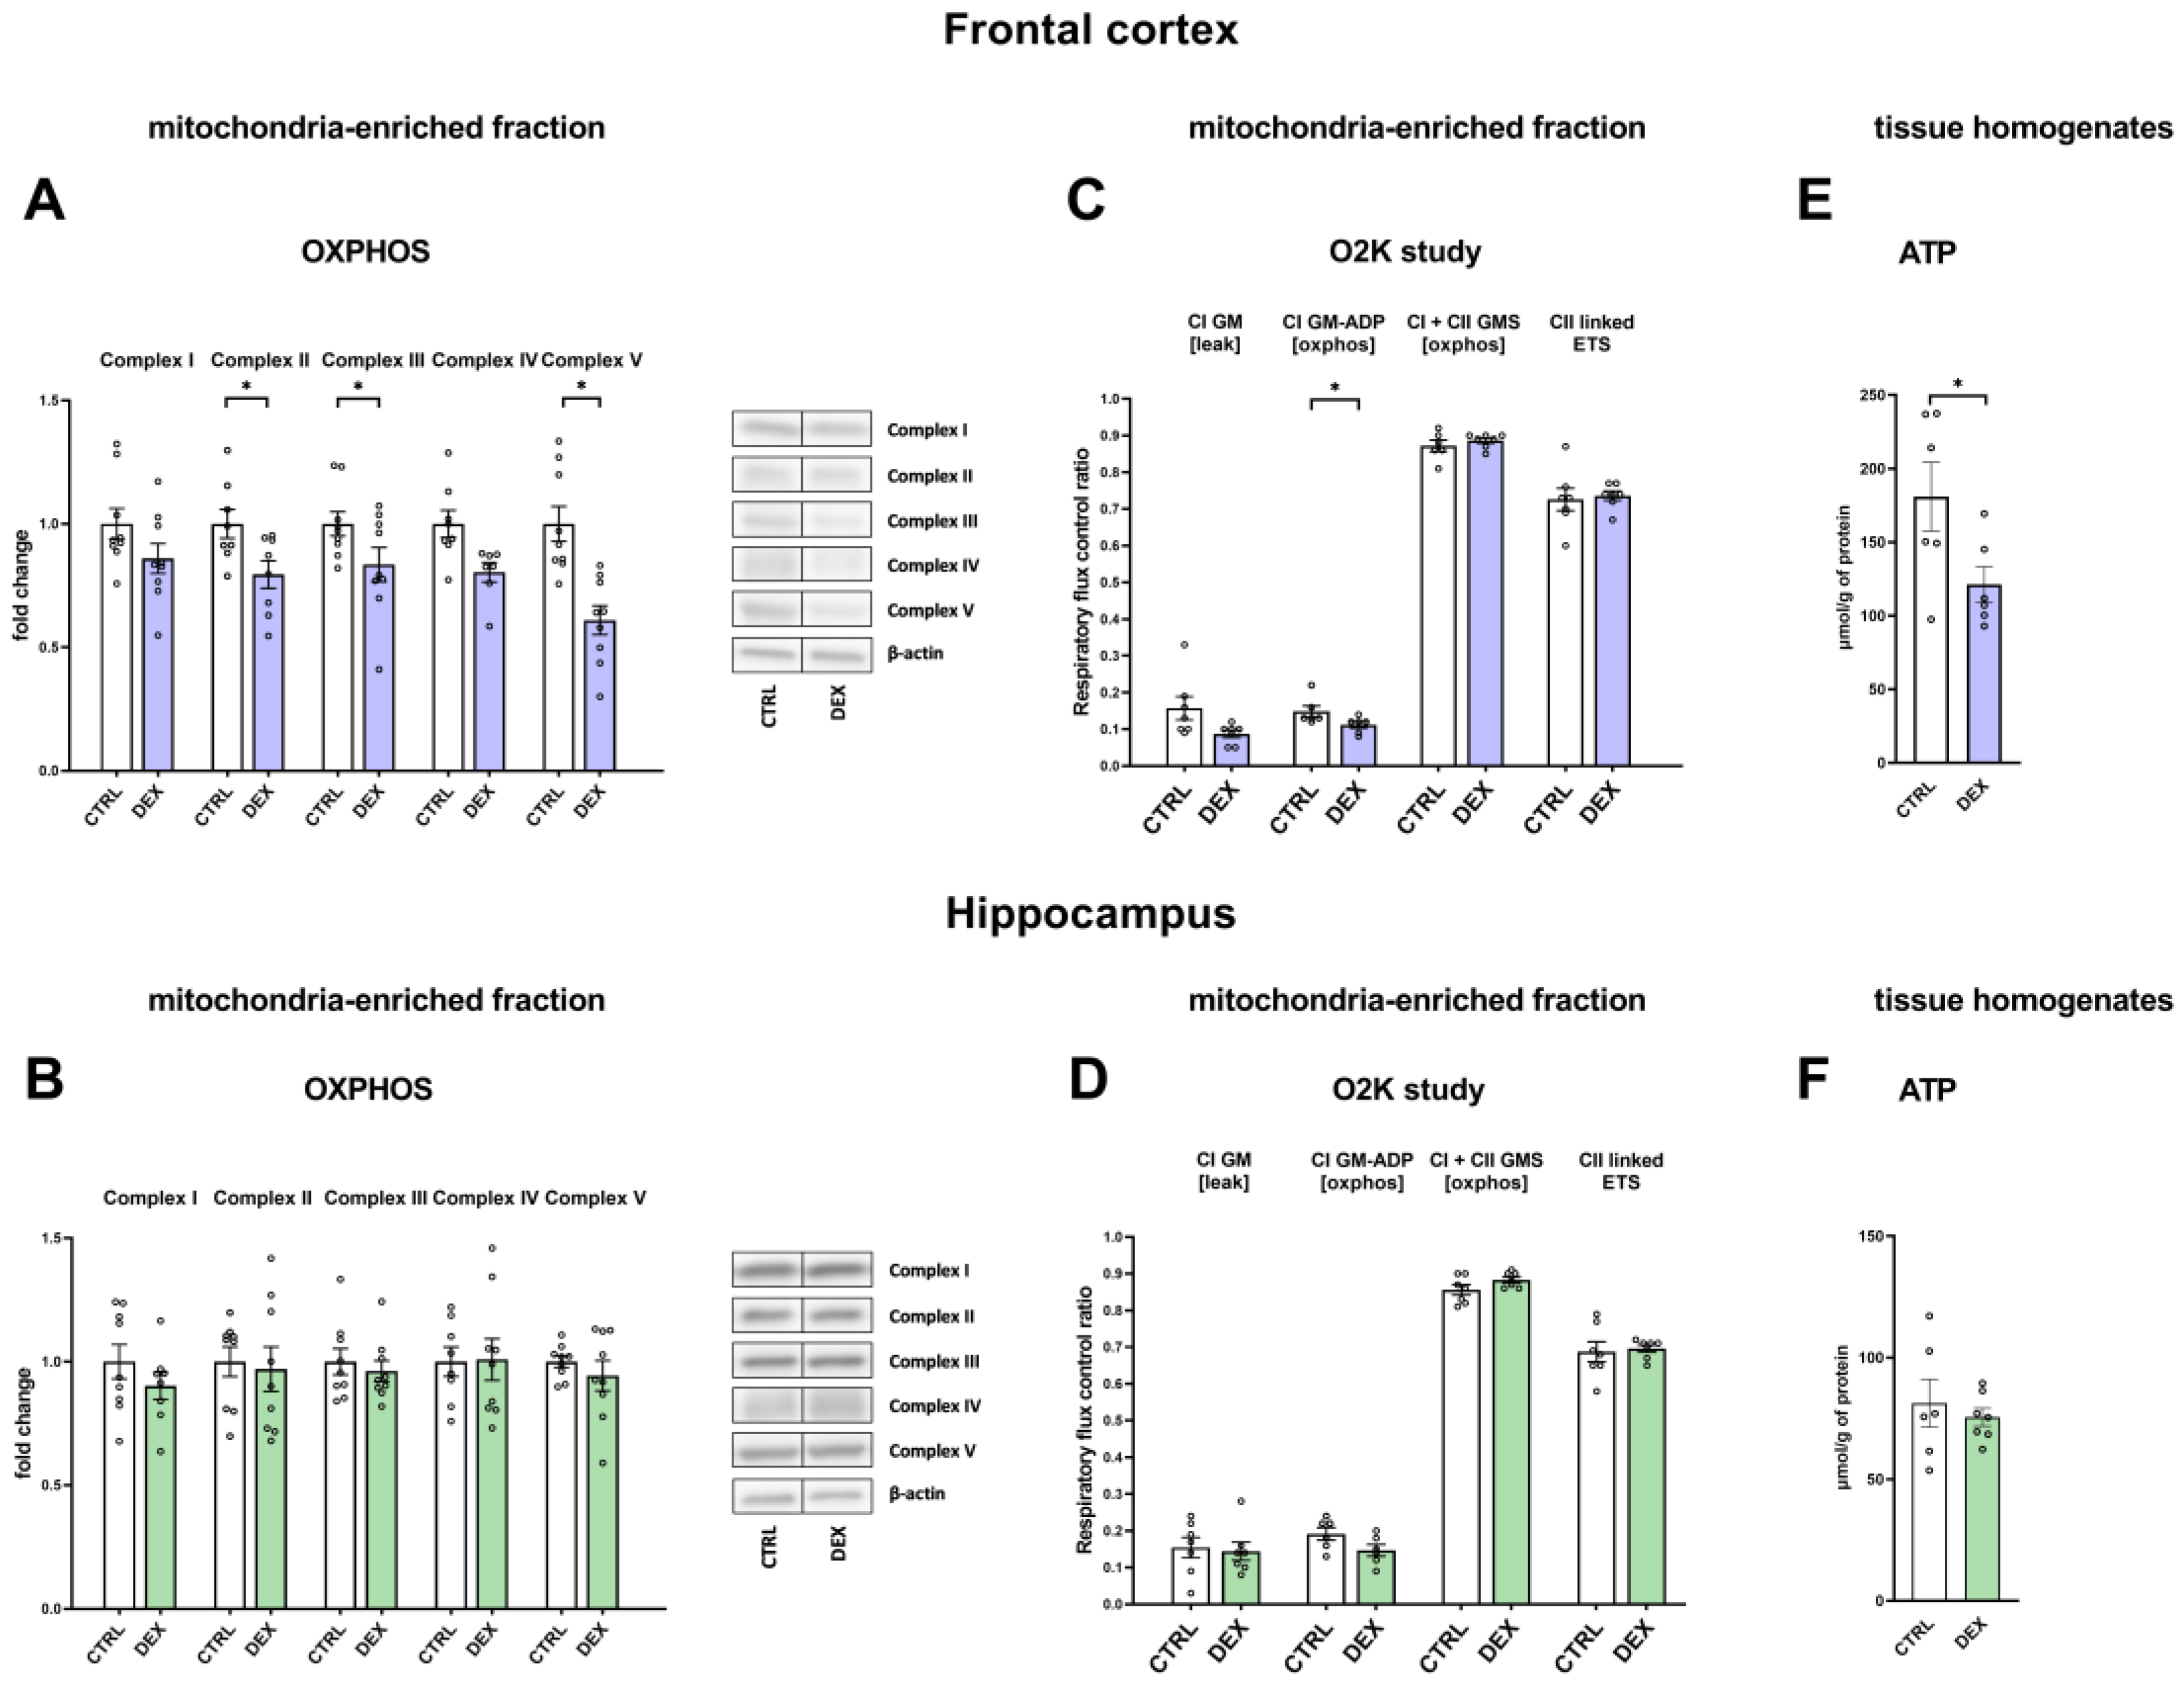
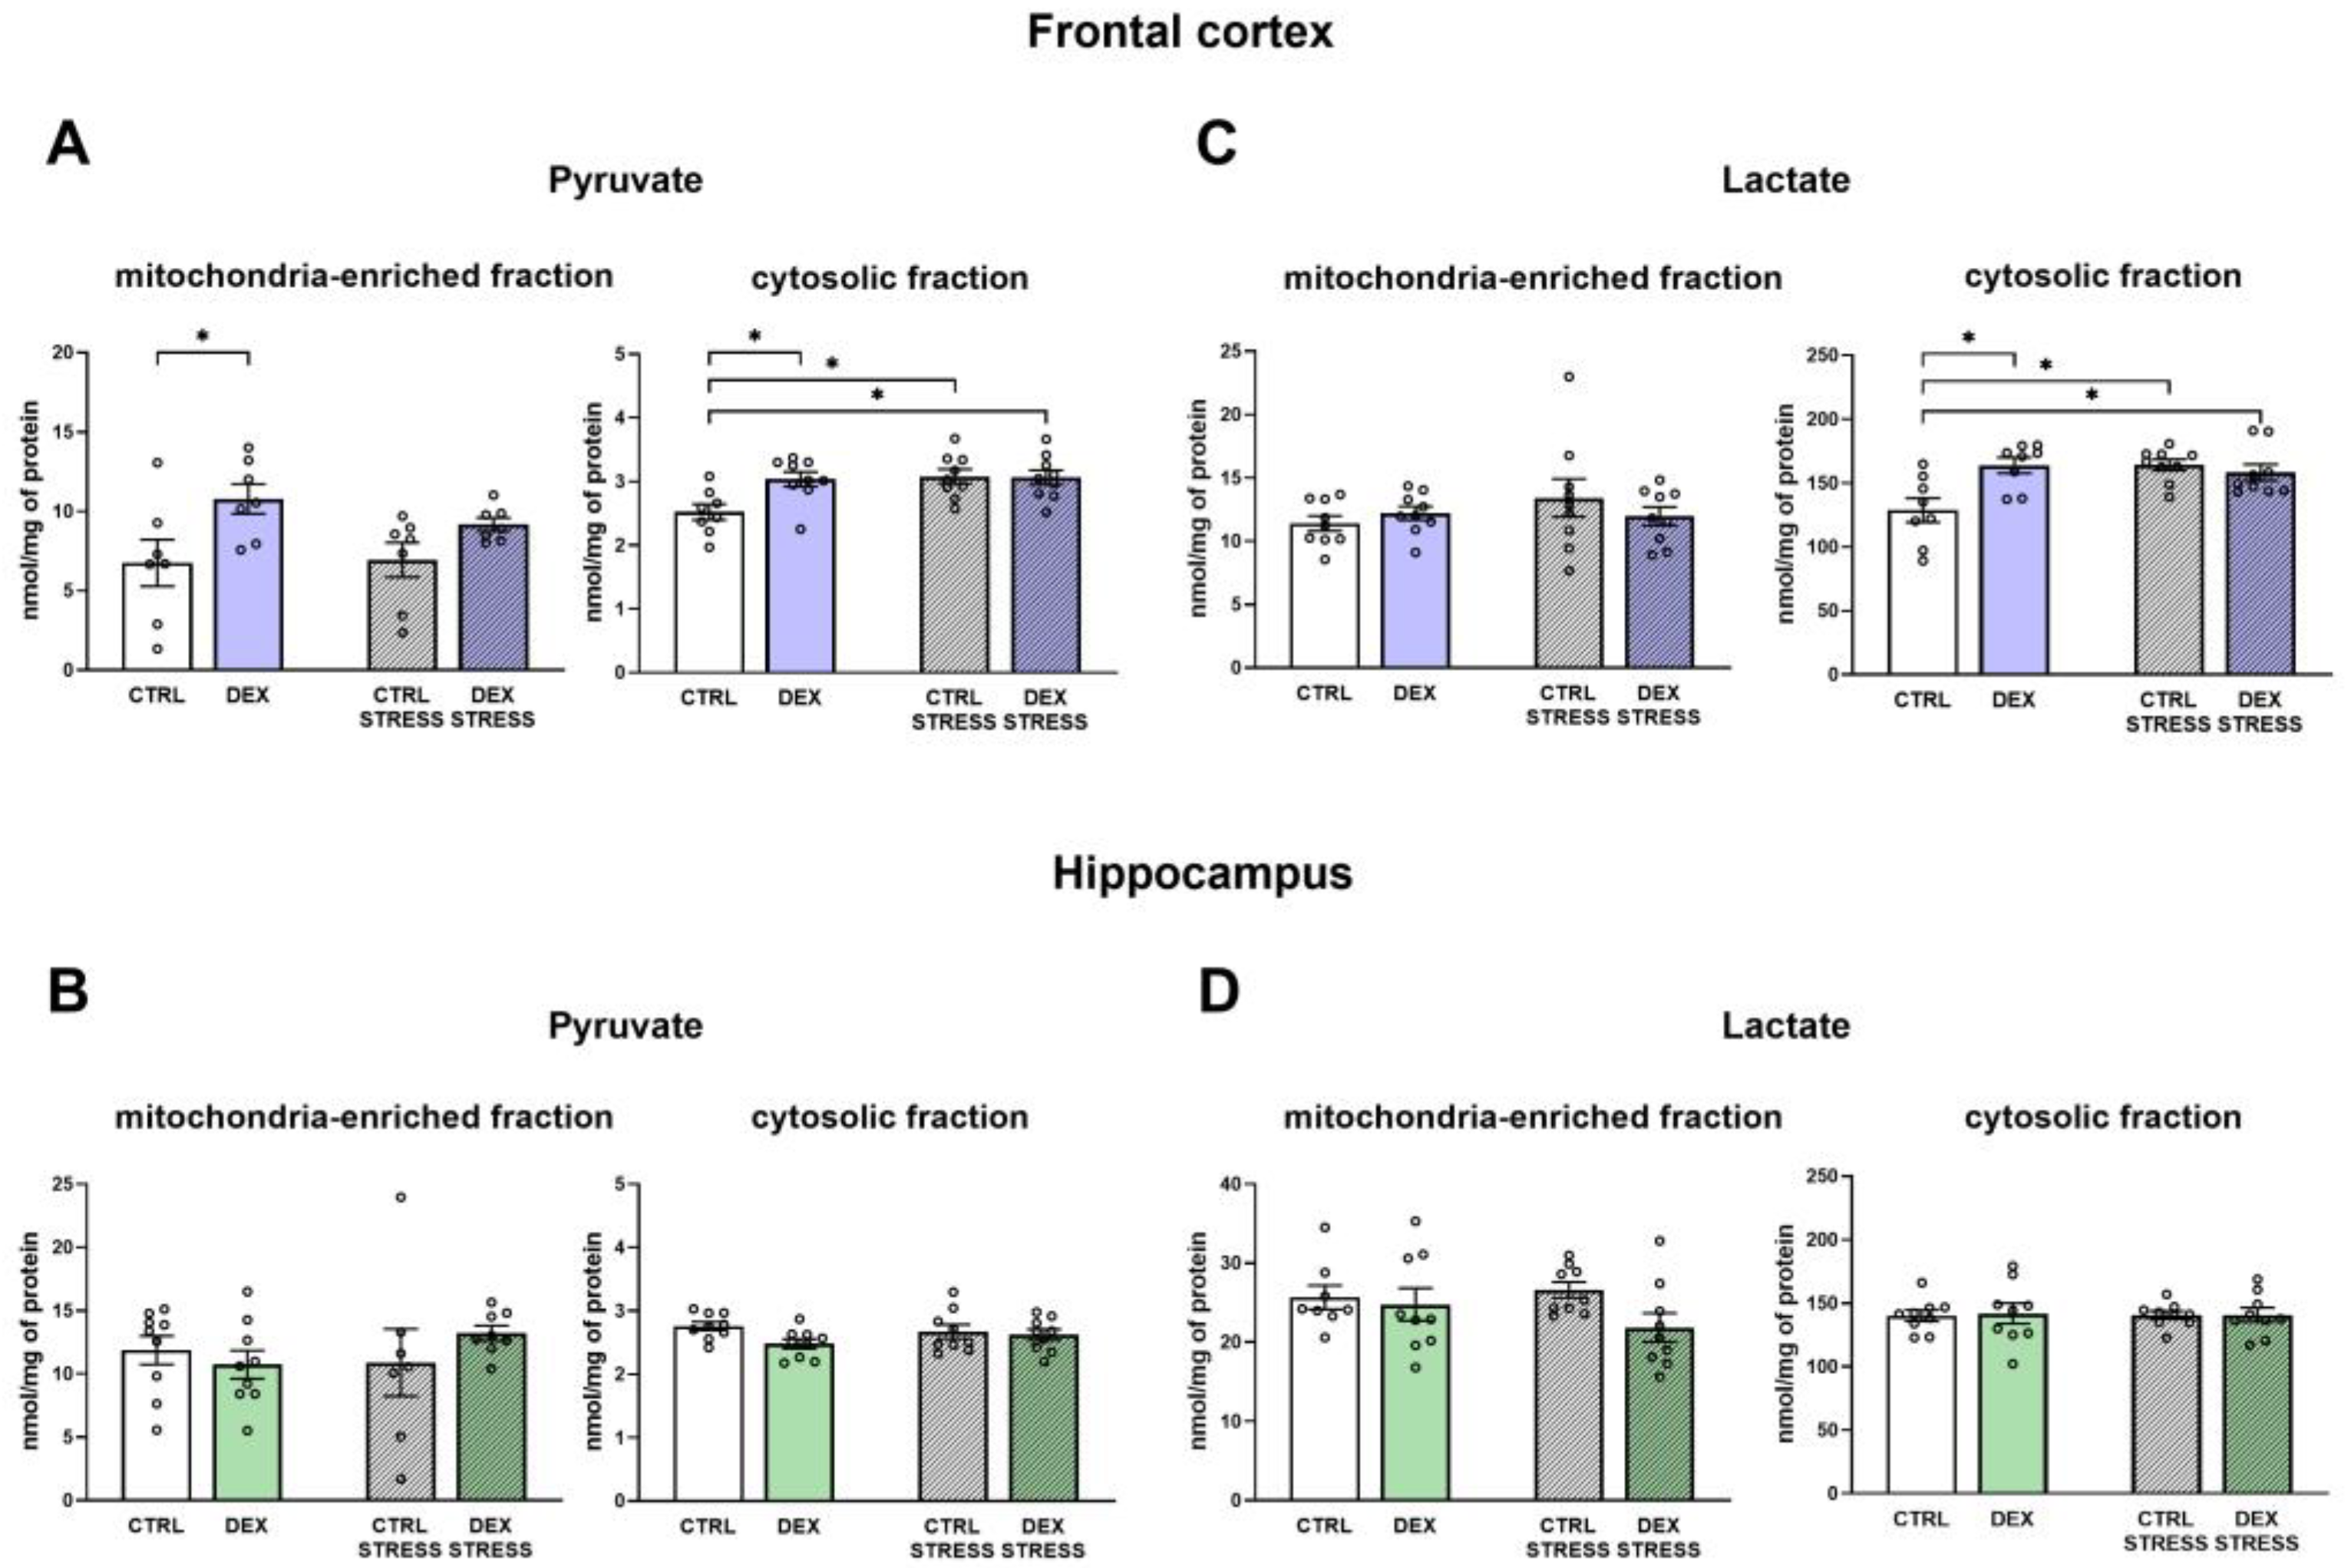
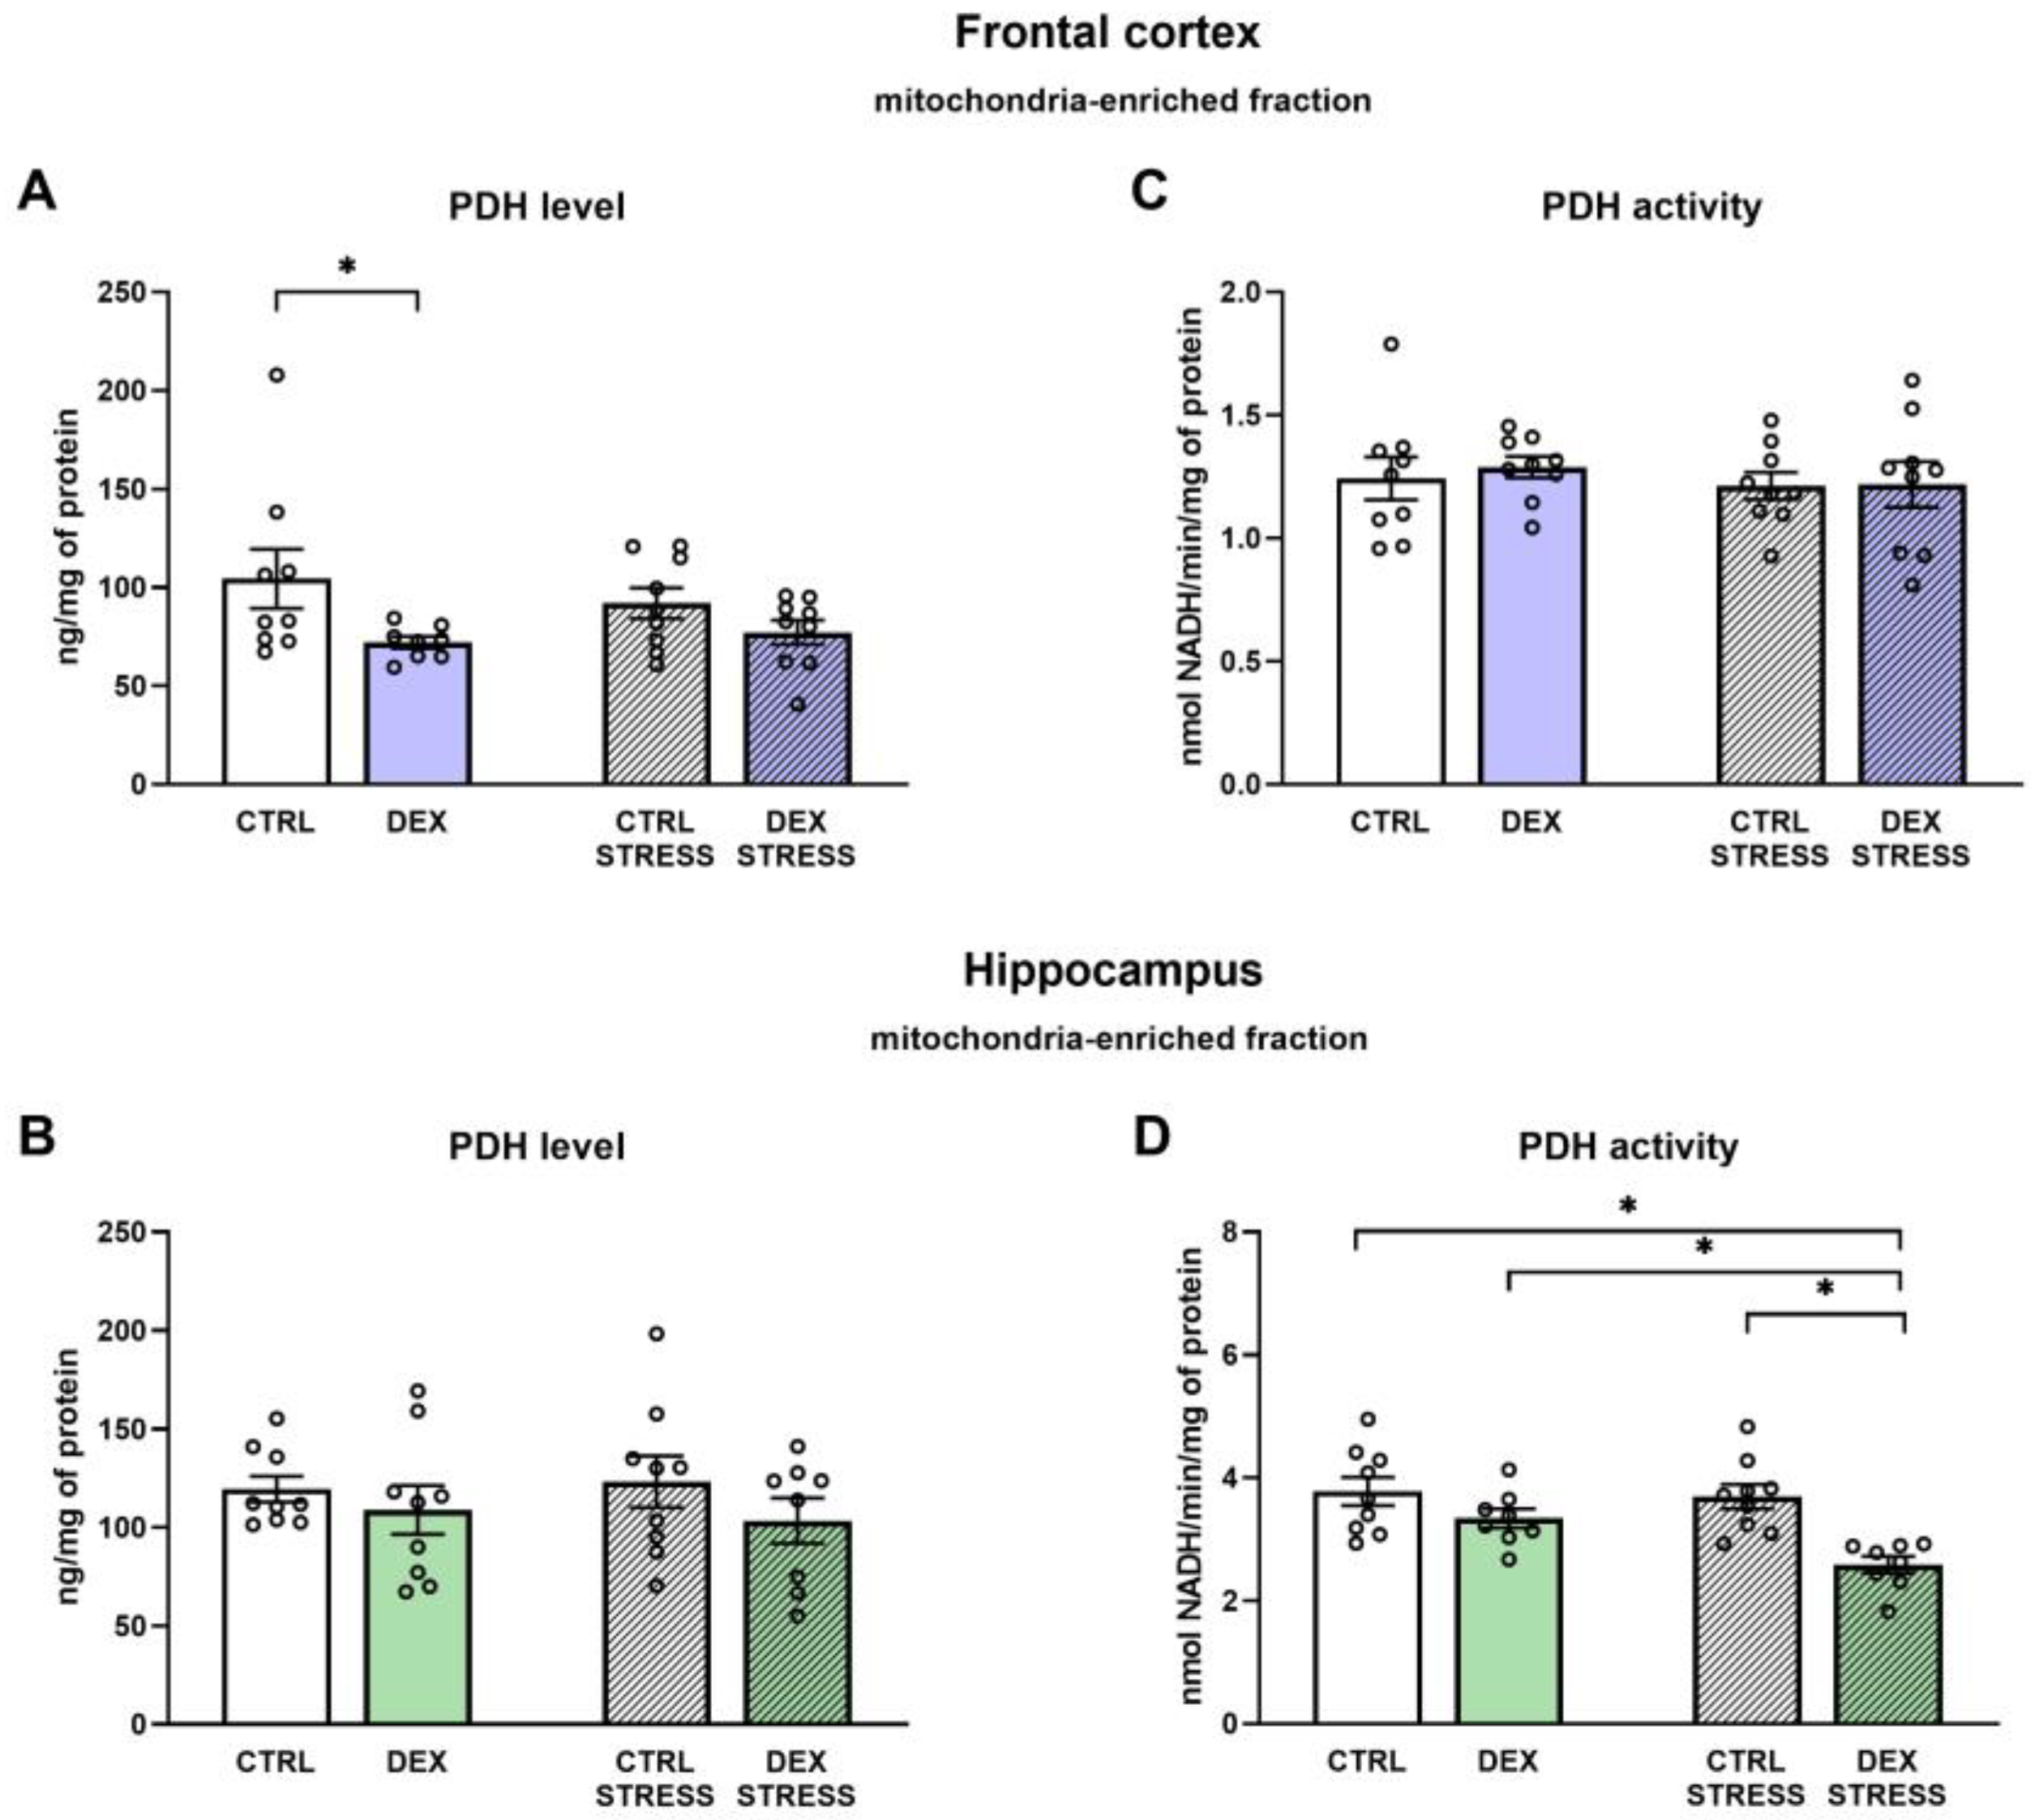
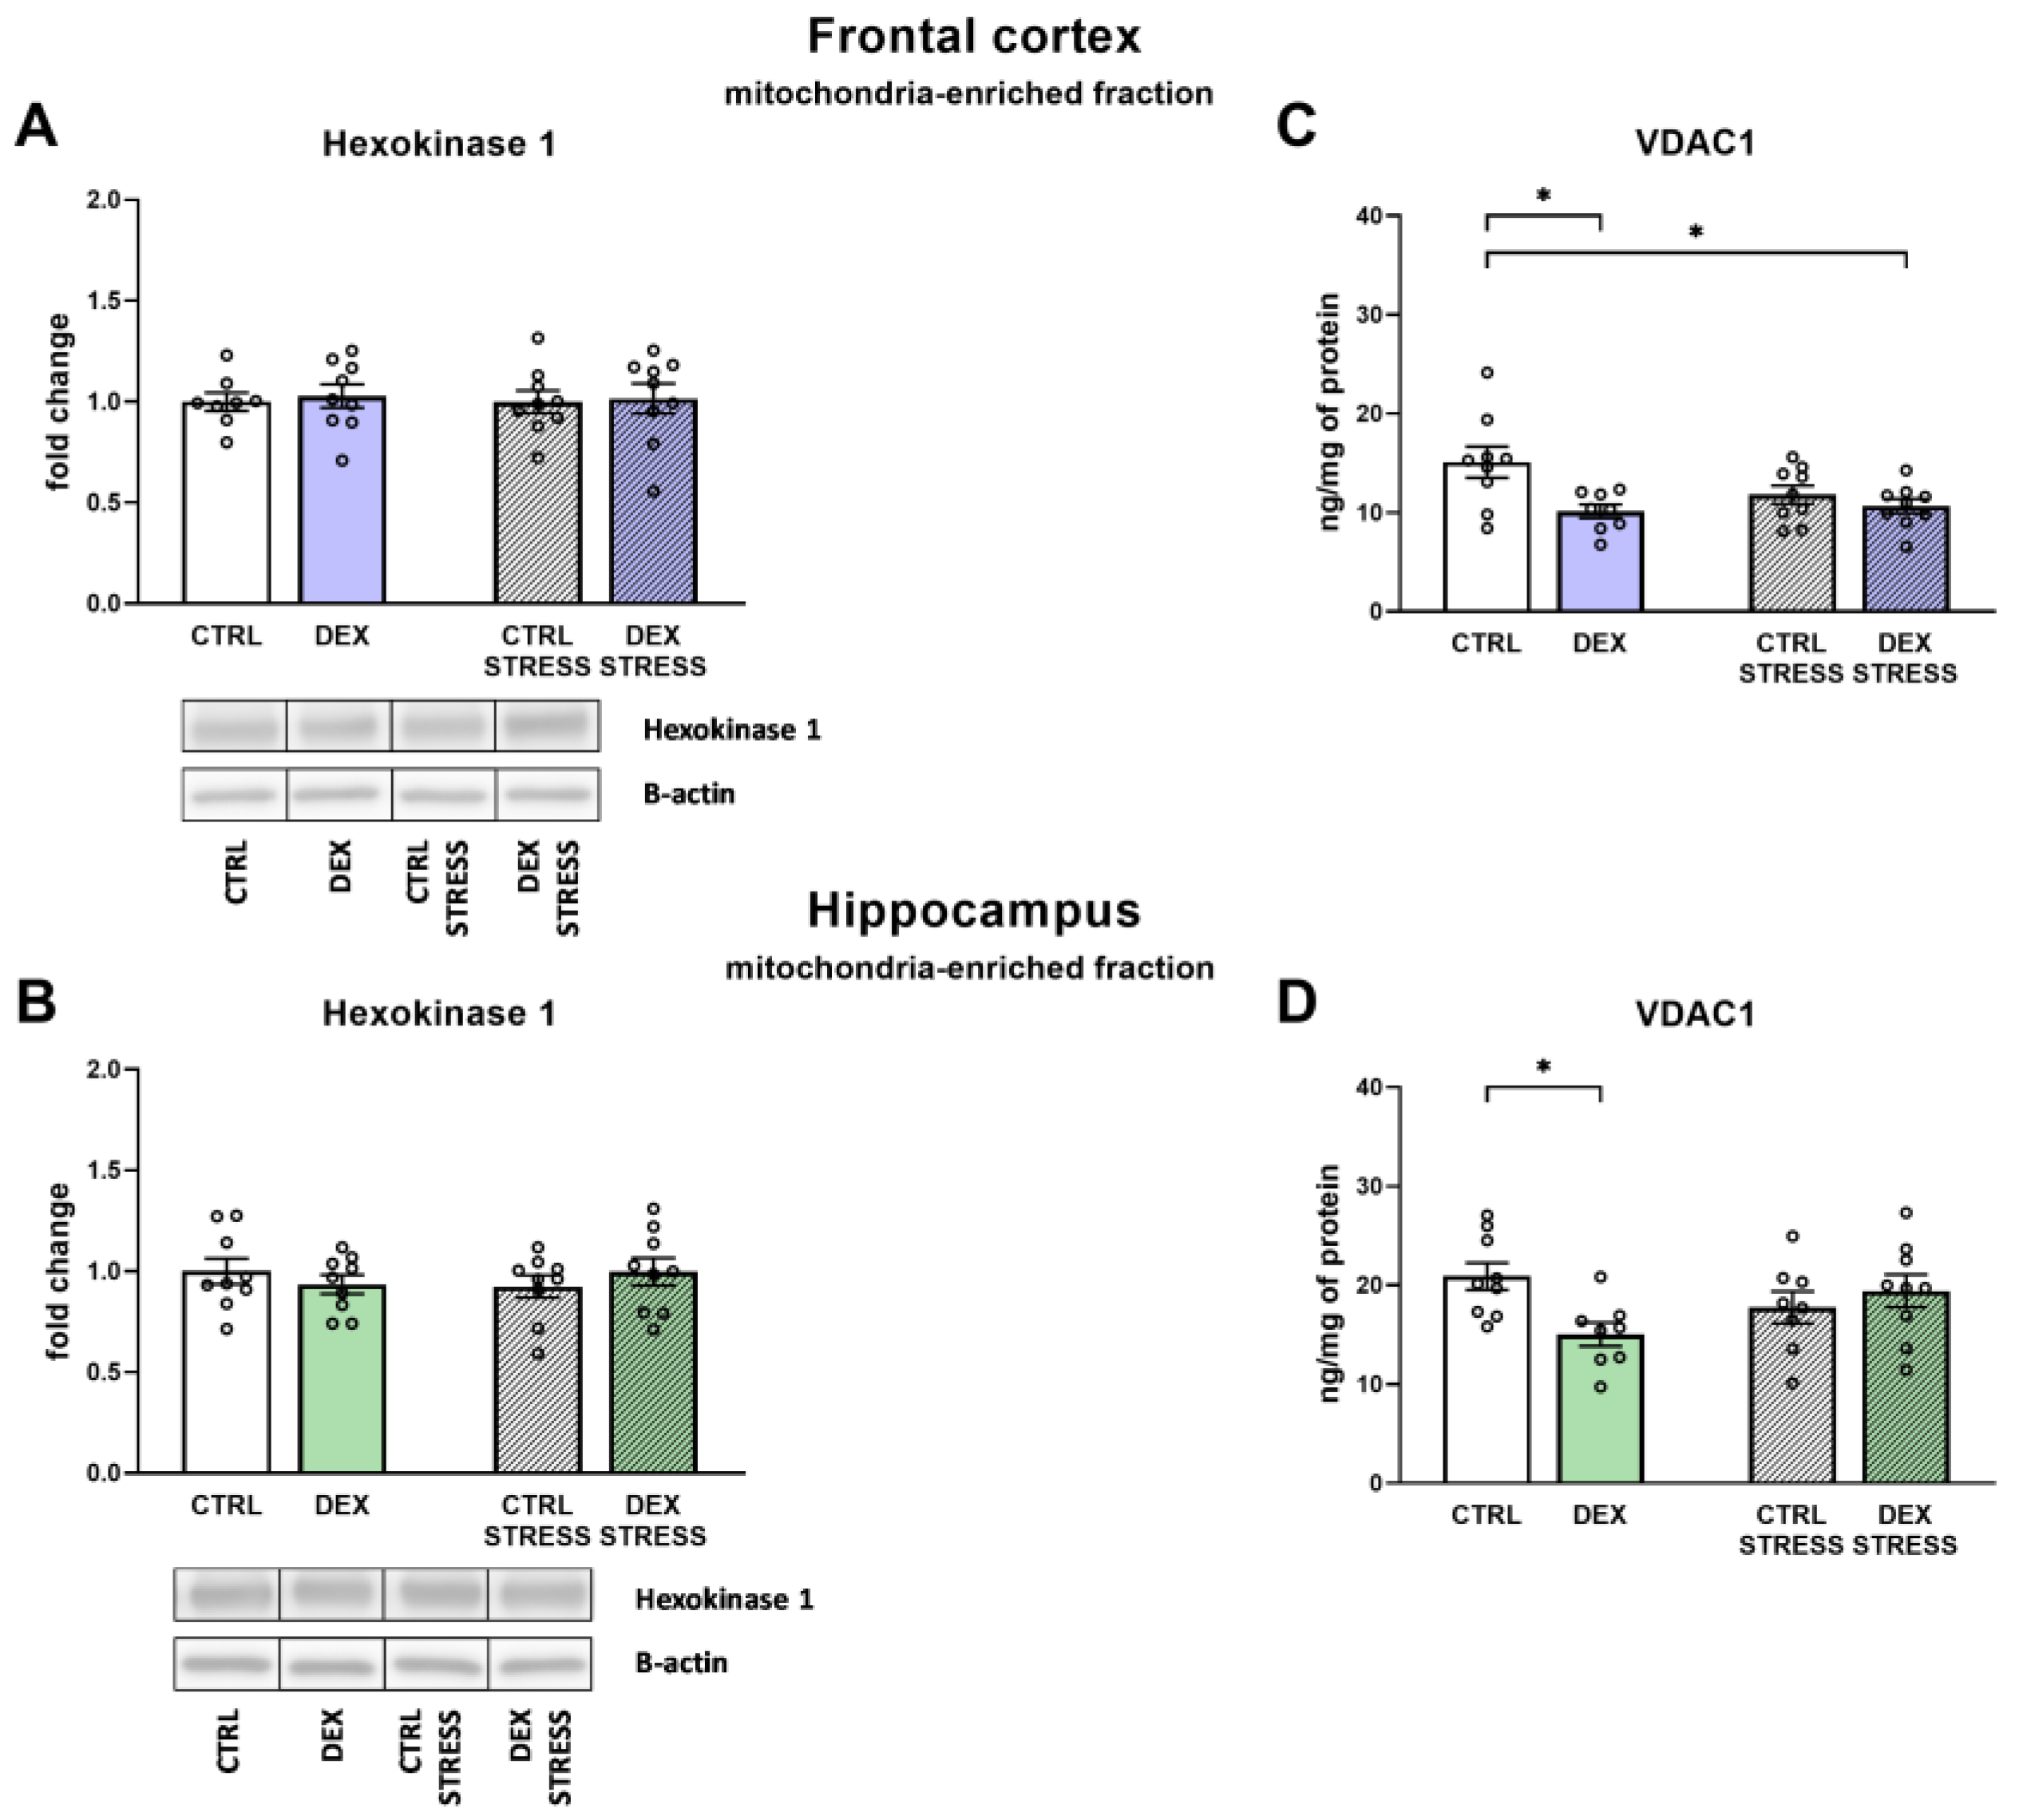
In the depression model used, we demonstrated the presence of metabolic changes in the brain, which were stronger in the frontal cortex than in the hippocampus and indicated a reduction in the oxidative phosphorylation process. Clear shifts in the intensity of individual metabolic processes occur in the frontal cortex, where observed changes indicate a reduction in the phosphorylation process and probably the Krebs cycle with the simultaneous accumulation of glycolysis products. The reduction in the oxidative phosphorylation process in the frontal cortex of animals receiving DEX in the prenatal period was shown by both the reduction in the level of mitochondrial complexes II, IV, and V and the reduction in mitochondrial respiratory function determined by measuring the rate of oxygen consumption via the respirometry method. A decrease in the level of pyruvate dehydrogenase with a simultaneous increase in the level of pyruvate in the mitochondria-enriched fraction of the frontal cortex indicates that the Krebs cycle is also weakened. This enzyme is responsible for the conversion of pyruvate into acetyl-CoA, which can be included in the Krebs cycle. Since a decrease in the expression of this enzyme was observed without changes in its activity, it suggests a weakening of the connection between glycolysis and the Krebs cycle. As no changes in the expression of key glycolysis enzymes were observed, it appears that the increased levels of pyruvate in the mitochondria-enriched fraction and cytosolic fractions and lactate in the cytosolic fraction are due to a reduction in PDH expression and not an increase in glycolysis. Importantly, the observed changes lead to a reduction in the level of ATP and thus the energy needed for the proper function of nerve cells. In previously studied models of depression based on prenatal stress [
23,
24] or in Wistar–Kyoto rats [
25,
26], we also observed metabolic changes in brain structures, but they did not lead to a reduction in ATP levels. Thus, compared to these models, the prenatal DEX depressive model used in the present study results in more pronounced metabolic changes in the frontal cortex, which consequently reduces ATP production. Moreover, in previous models, metabolic changes occurred not under baseline conditions but mainly after the use of additional unfavorable factors applied in adult life. In the case of prenatal administration of DEX, the changes described above in the frontal cortex were already present in the basal condition, while subjecting animals to stress in adulthood mainly increased the levels of pyruvate kinase and phosphofructokinase, which points to an intensification of the glycolysis process.
In contrast to the frontal cortex, in the hippocampus, no changes in the examined metabolic markers, mitochondrial respiratory function, or ATP level in animals prenatally exposed to DEX were observed. When animals receiving prenatal DEX were subjected to acute stress, there was a significant reduction in pyruvate dehydrogenase activity in the hippocampus, which may suggest a weakening of the Krebs cycle due to reduced acetyl-CoA supply. Acute stress also influenced the levels of key glycolysis enzymes (decreased level of phosphofructokinase and increased hexokinase). Thus, in the present model of depression in the frontal cortex, metabolic processes were reduced, and stress in adulthood only slightly modified these changes, while in the case of the hippocampus, prenatal exposure to DEX did not cause long-term metabolic changes but made this structure more sensitive to future adverse action.
Since the main change in the frontal cortex in the depression model used was a reduction in the oxidative phosphorylation process with a simultaneous increase in the level of glycolysis end products, we tried to determine the probable mechanism of these changes in further studies. One of the possible causes of disturbances in brain energy metabolism is the detachment of mitochondrial hexokinase from the outer mitochondrial membrane, which affects the activity of this enzyme and couples cytosolic glycolysis with mitochondrial oxidative phosphorylation [
27]. The level of HK in the mitochondria-enriched fraction did not change, but the expression of isoform 1 of the VDAC1, which binds HK to the mitochondrial membrane, was significantly reduced in both examined brain structures. Thus, lowering VDAC1 levels may be one of the causes of DEX-induced metabolic disturbances in the brain, including disrupting the coordination between glycolysis and oxidative phosphorylation. Moreover, proper binding of HK to the mitochondrial membrane, by reducing the production of mitochondrial reactive oxygen species, prevents oxidative damage and the induction of the mitochondrial apoptosis pathway [
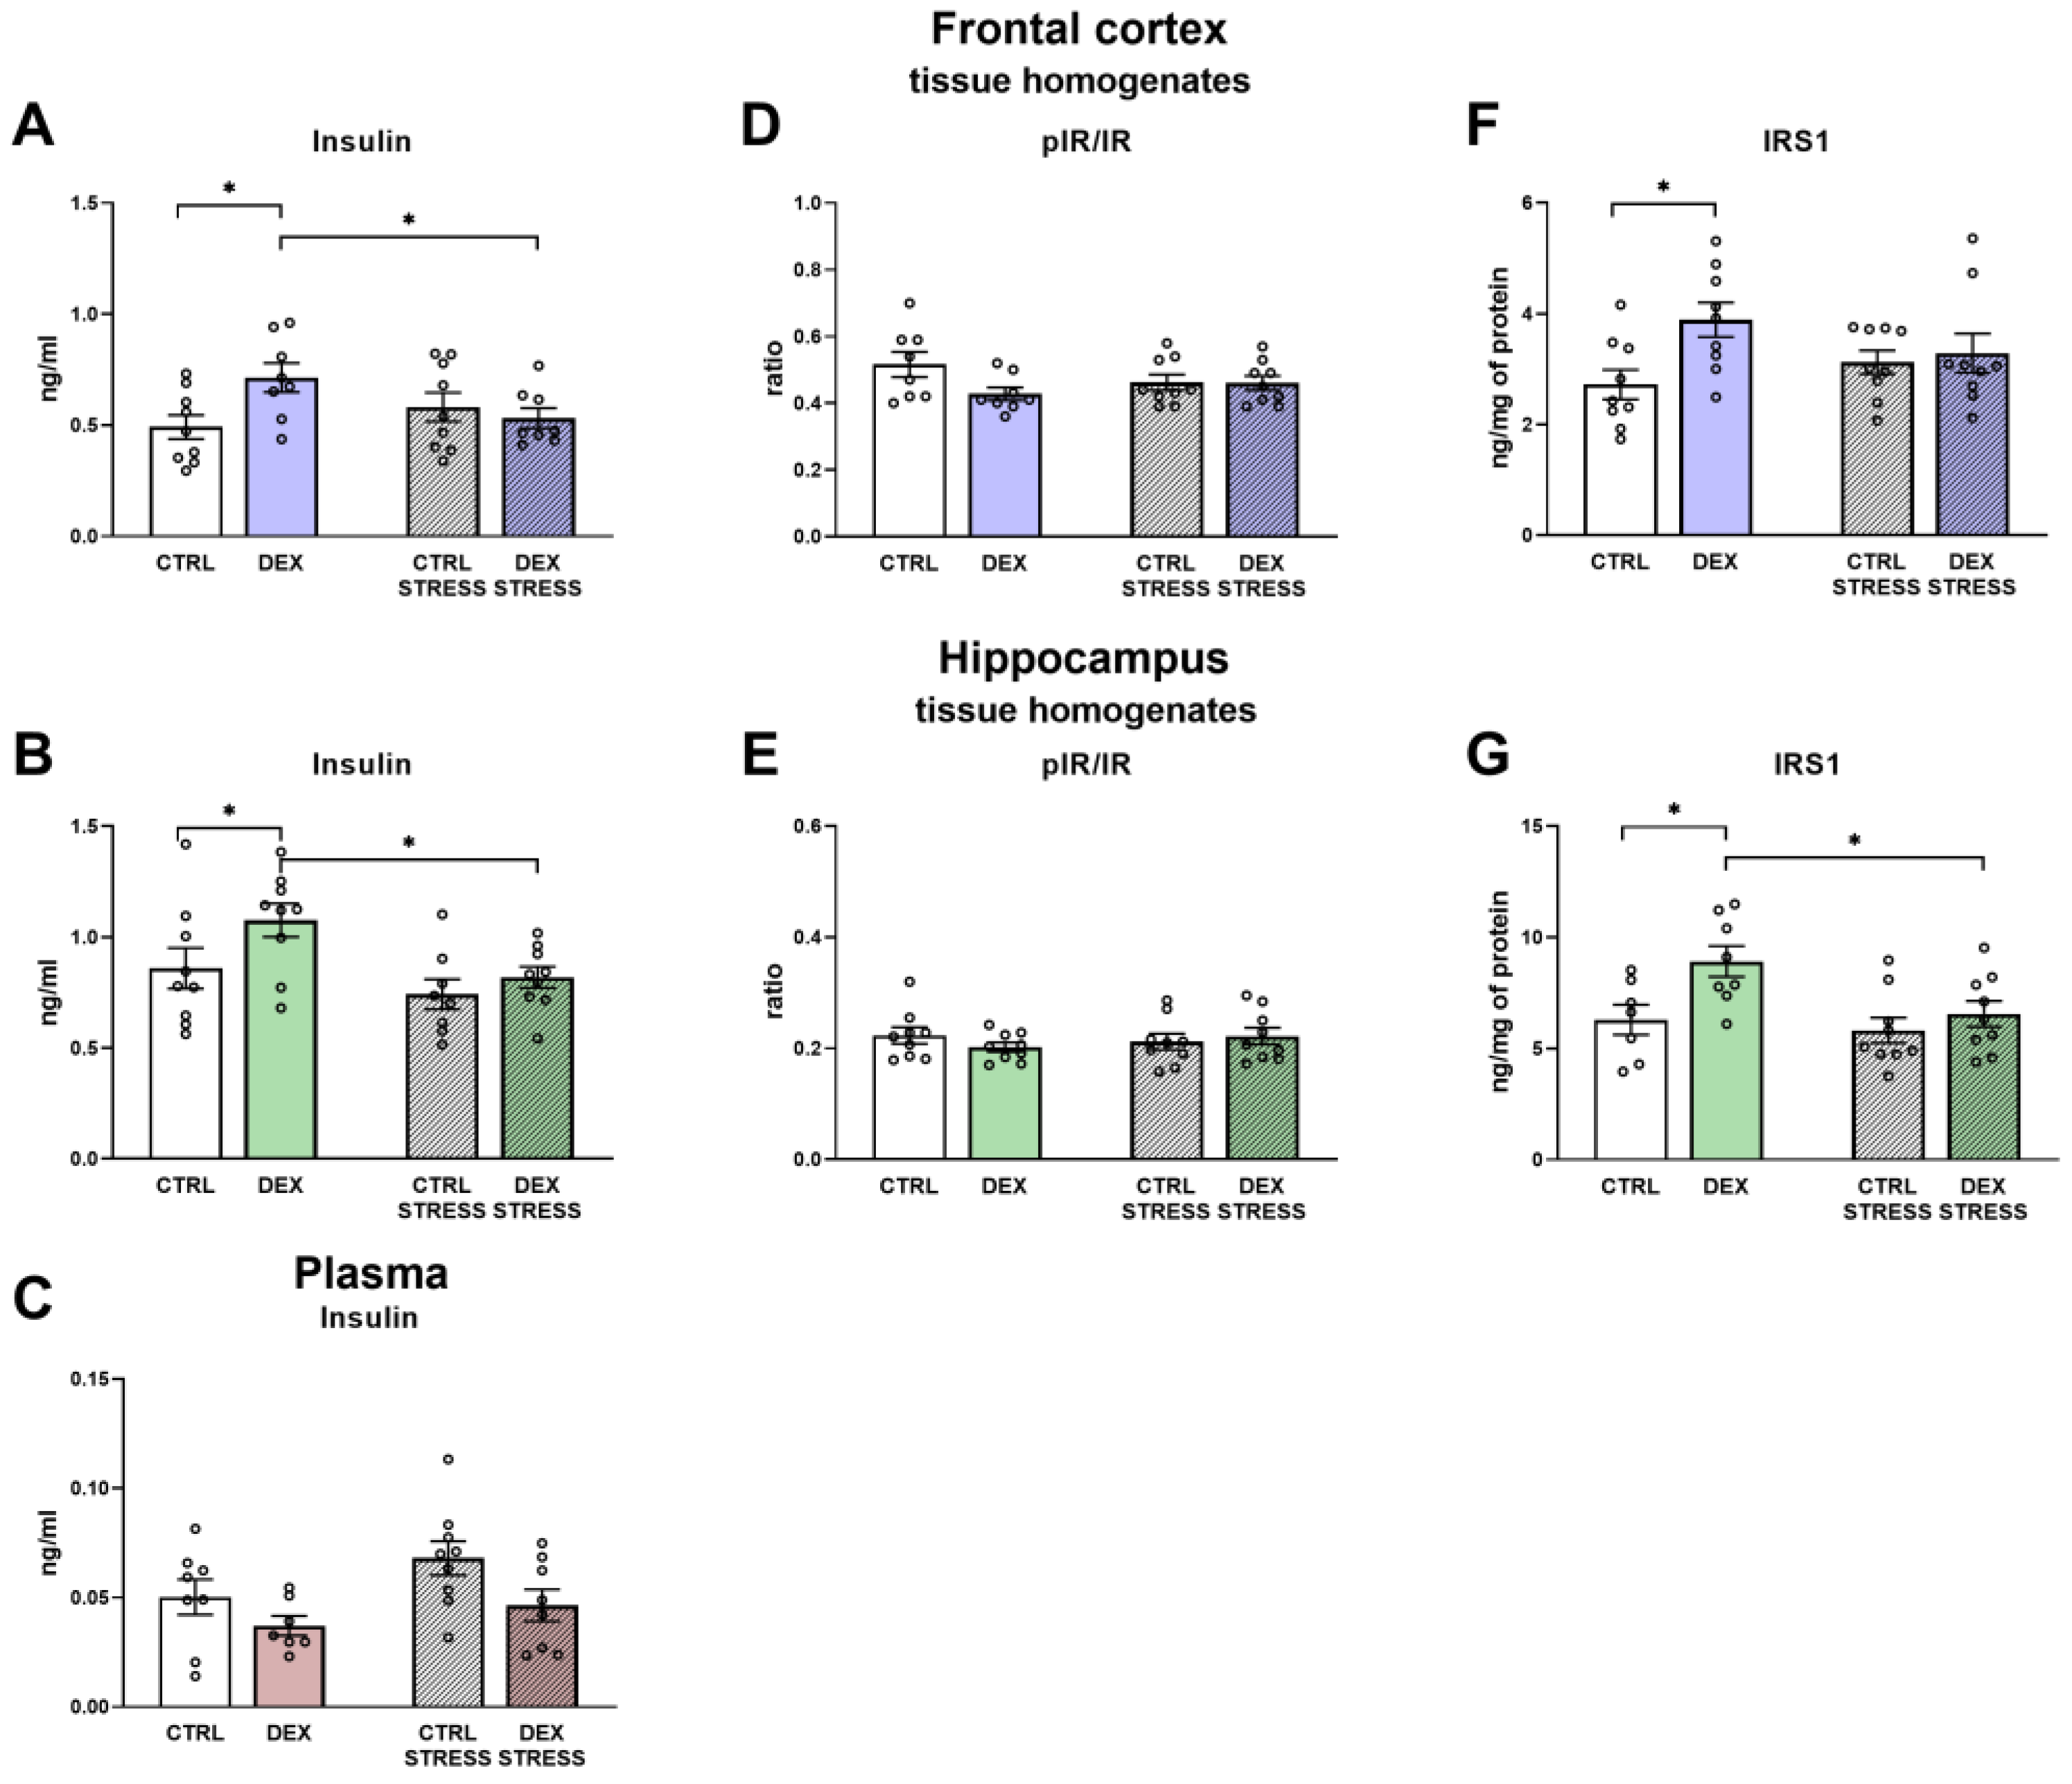
28]. In turn, the connection of HK with the mitochondrial membrane is enhanced by the phosphatidyl inositol 3-kinase (PI3-K)-Akt signaling pathway, and this survival signal is potentiated by insulin. In fact, it has been shown that the decrease in the insulin receptor in the brain, as seen in schizophrenia, leads to HK mitochondrial detachment [
29]. In the present study, we did not observe a decrease in phosphorylated, active insulin receptor levels, but in animals prenatally exposed to DEX, some changes indicative of insulin brain resistance, such as increased insulin levels in the frontal cortex and hippocampus, but not in plasma, and an increase in insulin receptor substrates 1 (IRS1) in the frontal cortex and the hippocampus were present. IRS1 plays a significant role in the induction of signal transduction pathways in insulin action; thus, it is possible that its increased level may also be accompanied by excessive phosphorylation of serine at position 307, which, as a result, may induce insulin resistance and evoke metabolic and synaptic plasticity disturbances [
30]. However, we have not assayed the levels of various phosphorylated forms of IRS1, and in addition, there was no reduction in Akt and
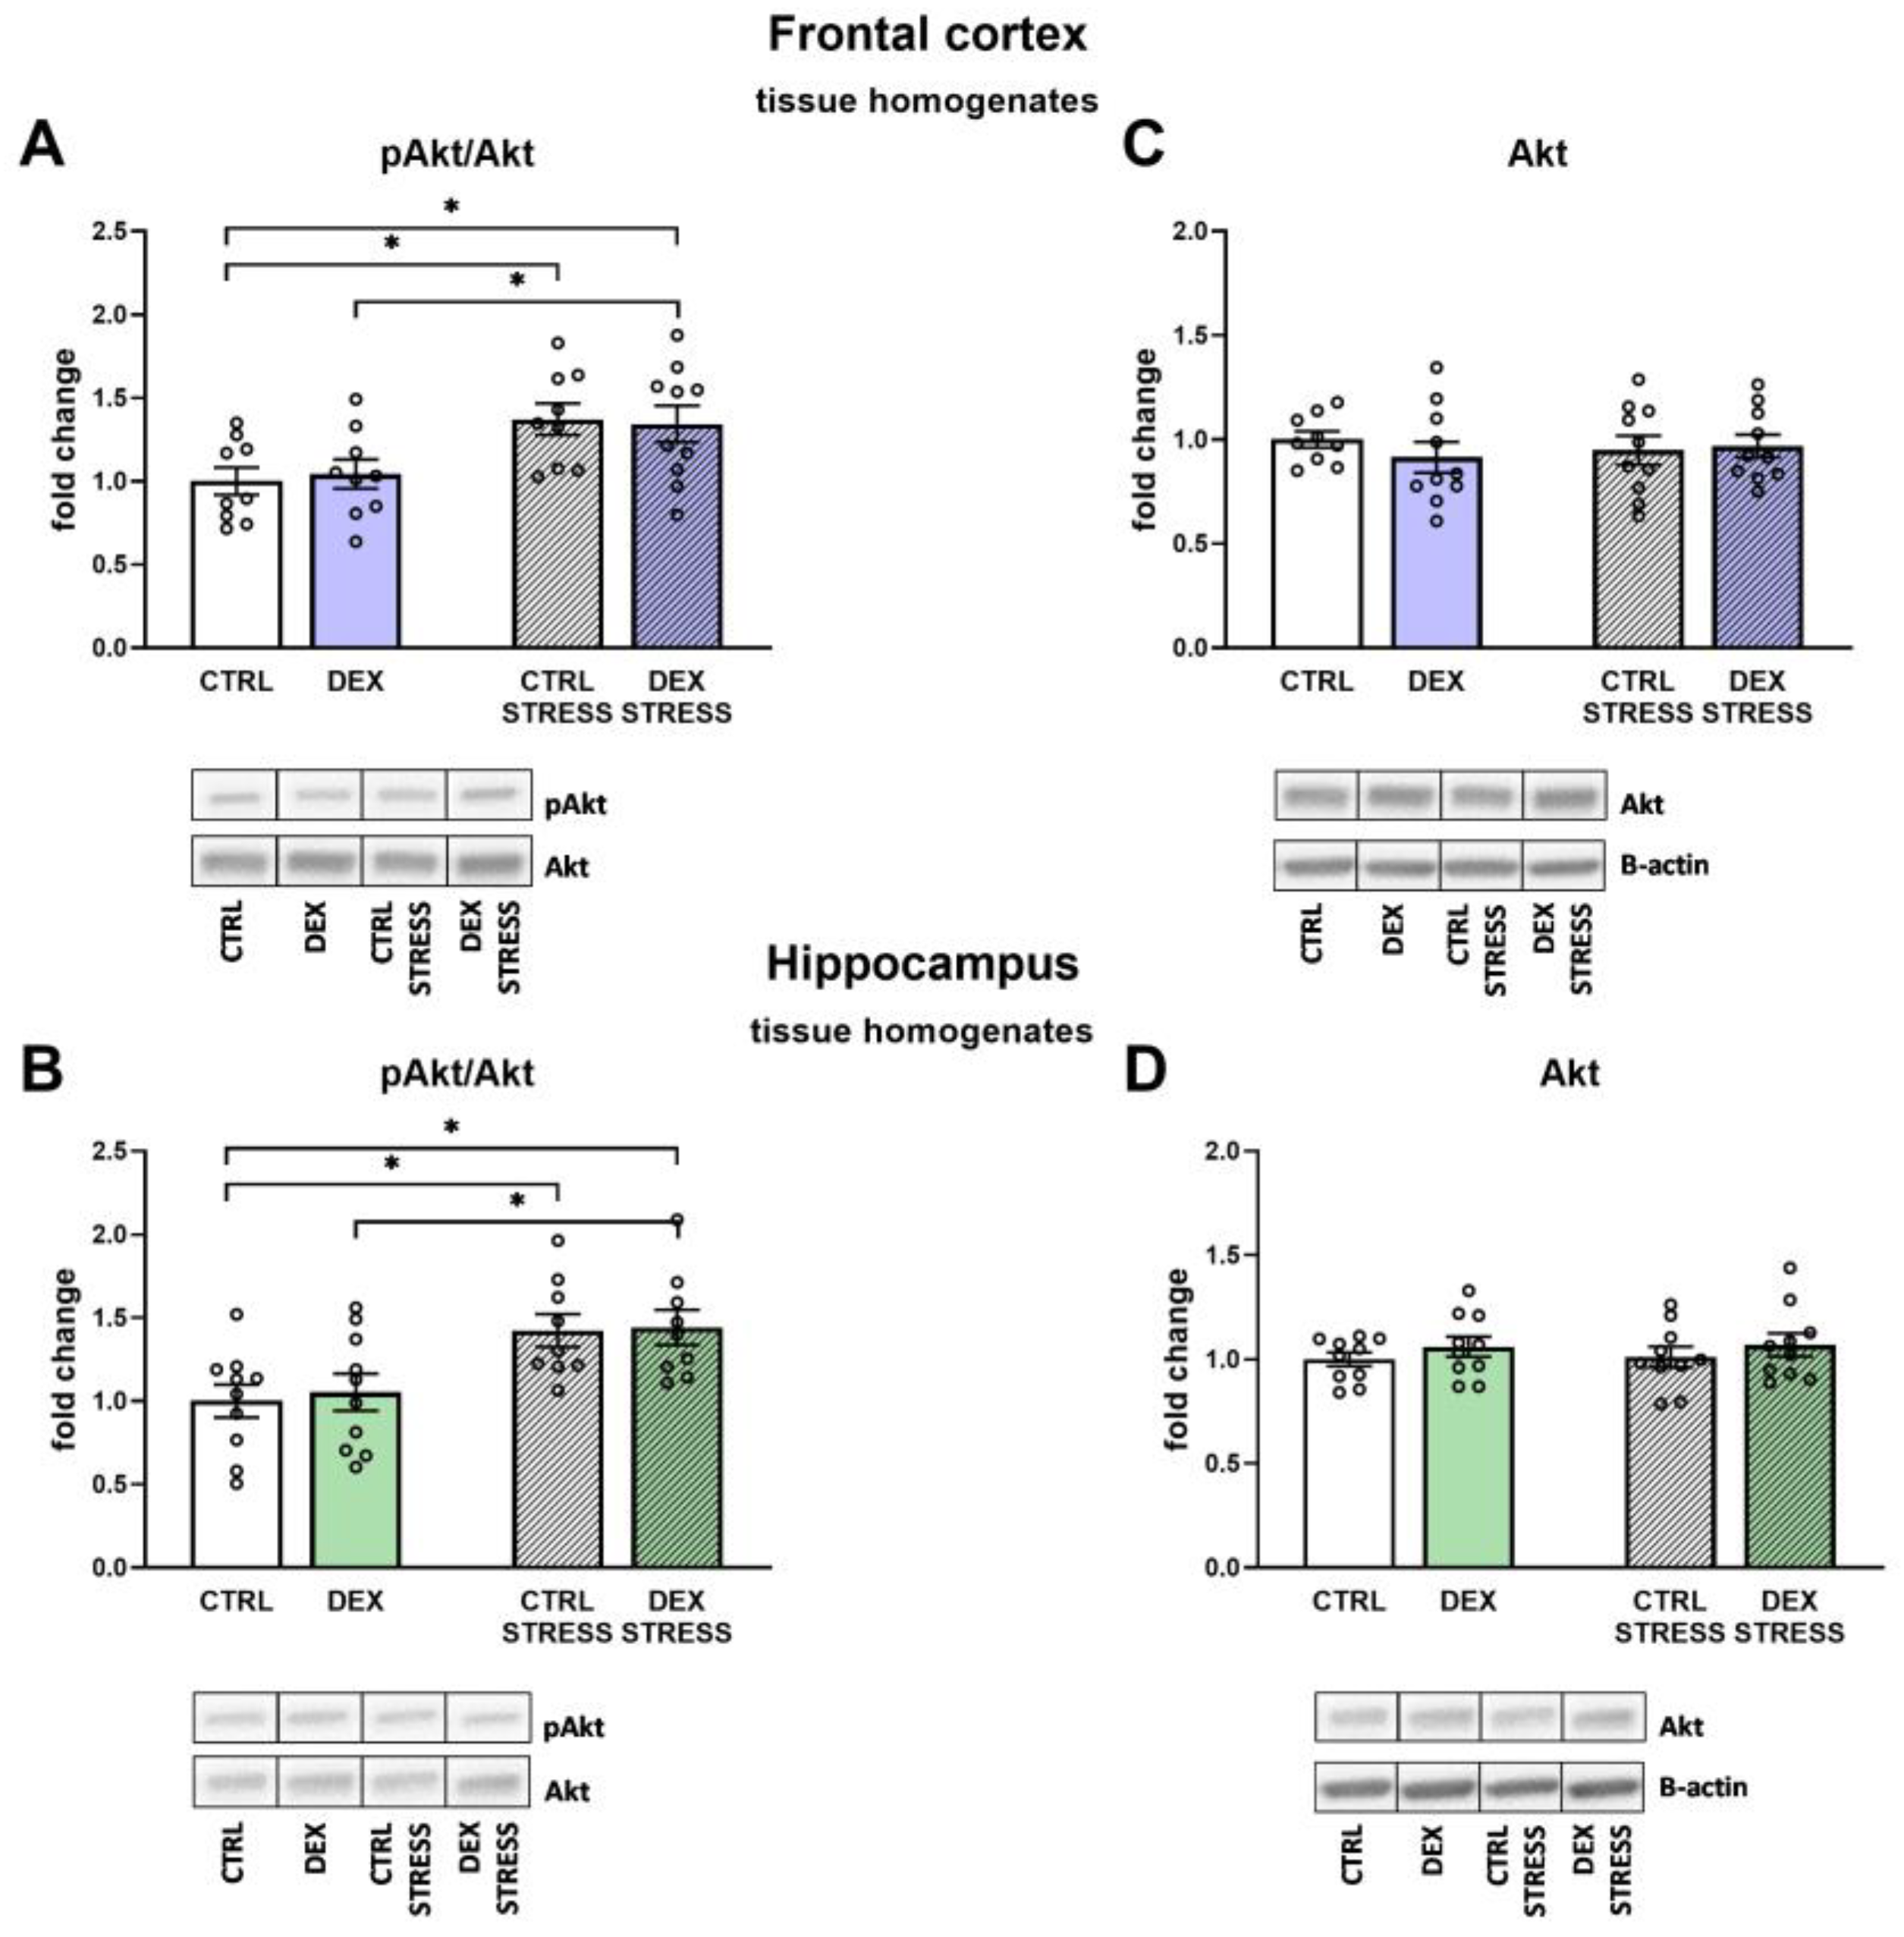
p-Akt levels, which did not confirm the development of insulin resistance in the examined brain structures in animals prenatally exposed to DEX.
The decrease in the oxidative phosphorylation process, shown mainly in the frontal cortex, may result not only from changes in the expression/activity of enzymes involved in this process but also from changes in the dynamics of mitochondria. Mitochondria are very dynamic organelles that, according to the energy demand of the cell, are subject to the process of fusion and fission, and these processes are regulated by a number of mitochondrial proteins [
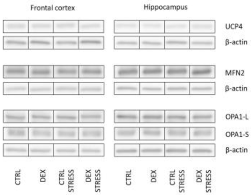
31,
32]. The lack of change in the levels of the key fusion proteins mitofusin 2 and optic atrophy 1 (OPA1) in both examined brain structures excludes the participation of this process in decreasing oxidative phosphorylation. Since OPA-1 can be converted from the long form (OPA1-L) to the short form (OPA1-S) and some data indicate that only the long isoform promotes mitochondrial fusion, while the short form enhances fission [
33], we also assessed the ratio of these two forms. The reduction in the OPA1-L to OPA1-S ratio in animals in the DEX/stress group suggested that DEX may sensitize the frontal cortex to stress-induced mitochondrial disturbances.
The present results also indicate that the decrease in ATP levels observed in the frontal cortex is not due to uncoupling of oxidative phosphorylation from ATP synthesis. This is demonstrated by the lack of an increase in the level of the major of uncoupling proteins occurring in the brain, that is, UCP2 and UCP4, as well as the lack of intensification of the oxygen consumption rate in the leak state in respirometric examination, that is, under conditions of inactive ATP synthesis in which oxygen flux is maintained mainly to compensate for the proton leak. In contrast, a reduction in the level of UCP2 in the frontal cortex of animals prenatally exposed to DEX, both without and after exposure to acute stress in adulthood, suggests that DEX may reduce proton leakage through the mitochondrial membrane.
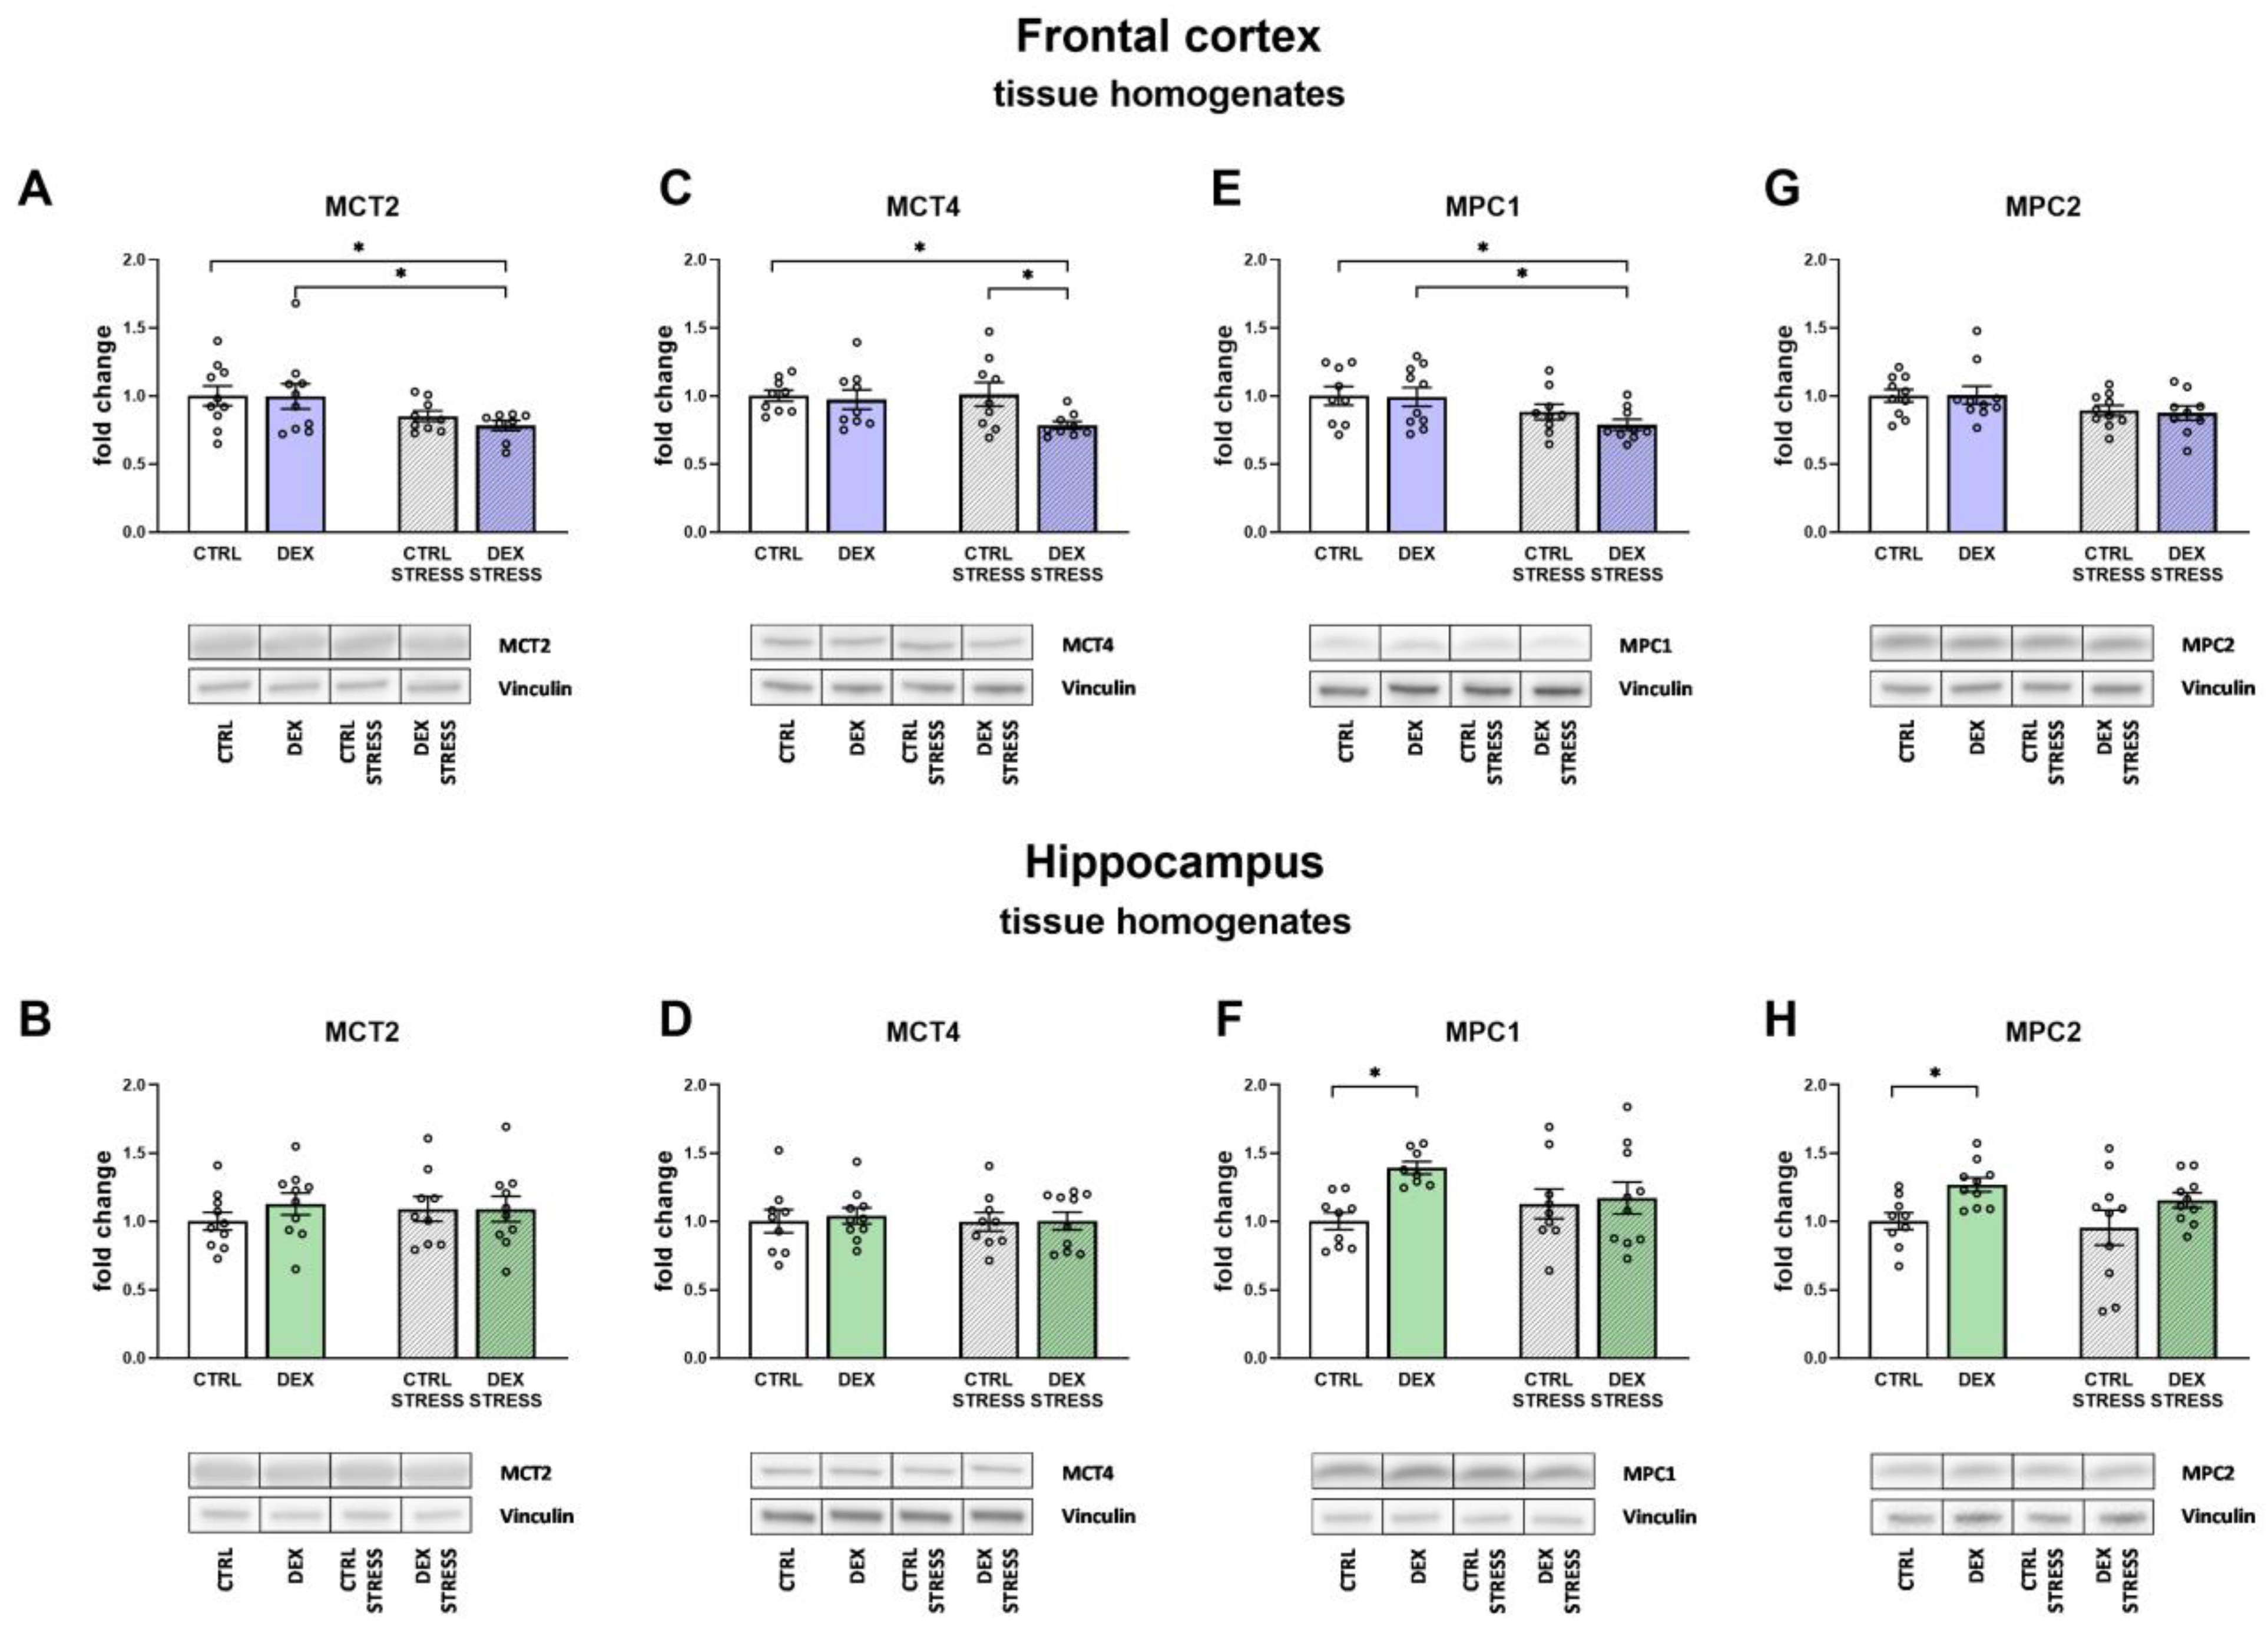
The results obtained from the present study indicate that a reduction in oxidative phosphorylation and, as a result, ATP synthesis may result from the reduced transport of lactate from astrocytes to neurons and pyruvate transport into the mitochondria. The transport of lactate to neurons, cells that need a large amount of energy to maintain proper function, is an important mechanism. Most lactate is produced in the process of glycolysis in astrocytes and is delivered to neurons (lactate shuttling), where after conversion to pyruvate, it feeds the process of oxidative phosphorylation [
34]. Monocarboxylate transporters play an important role in the lactate shuttling process, and current data show that MCT4 is responsible for the outflow of lactate from astrocytes, while MCT2 is associated with the influx of lactate to neurons [
35,
36]. In animals prenatally exposed to DEX, we observed a stress-induced reduction in the levels of both of these transporters, e.g., MCT2 and MCT4. The fact that, in animals exposed to DEX, stress reduced both lactate transport to neurons and pyruvate transport to the mitochondria (MPC1) only in the frontal cortex, and not in the hippocampus, suggests that this may be a significant cause of the reduction of oxidative phosphorylation and ATP synthesis in this structure. It should be noted, however, that the reduction of these transporters occurred in animals exposed to DEX, but only after being stressed in adulthood, while the reduction in ATP levels was observed under basic conditions in DEX-treated rats.
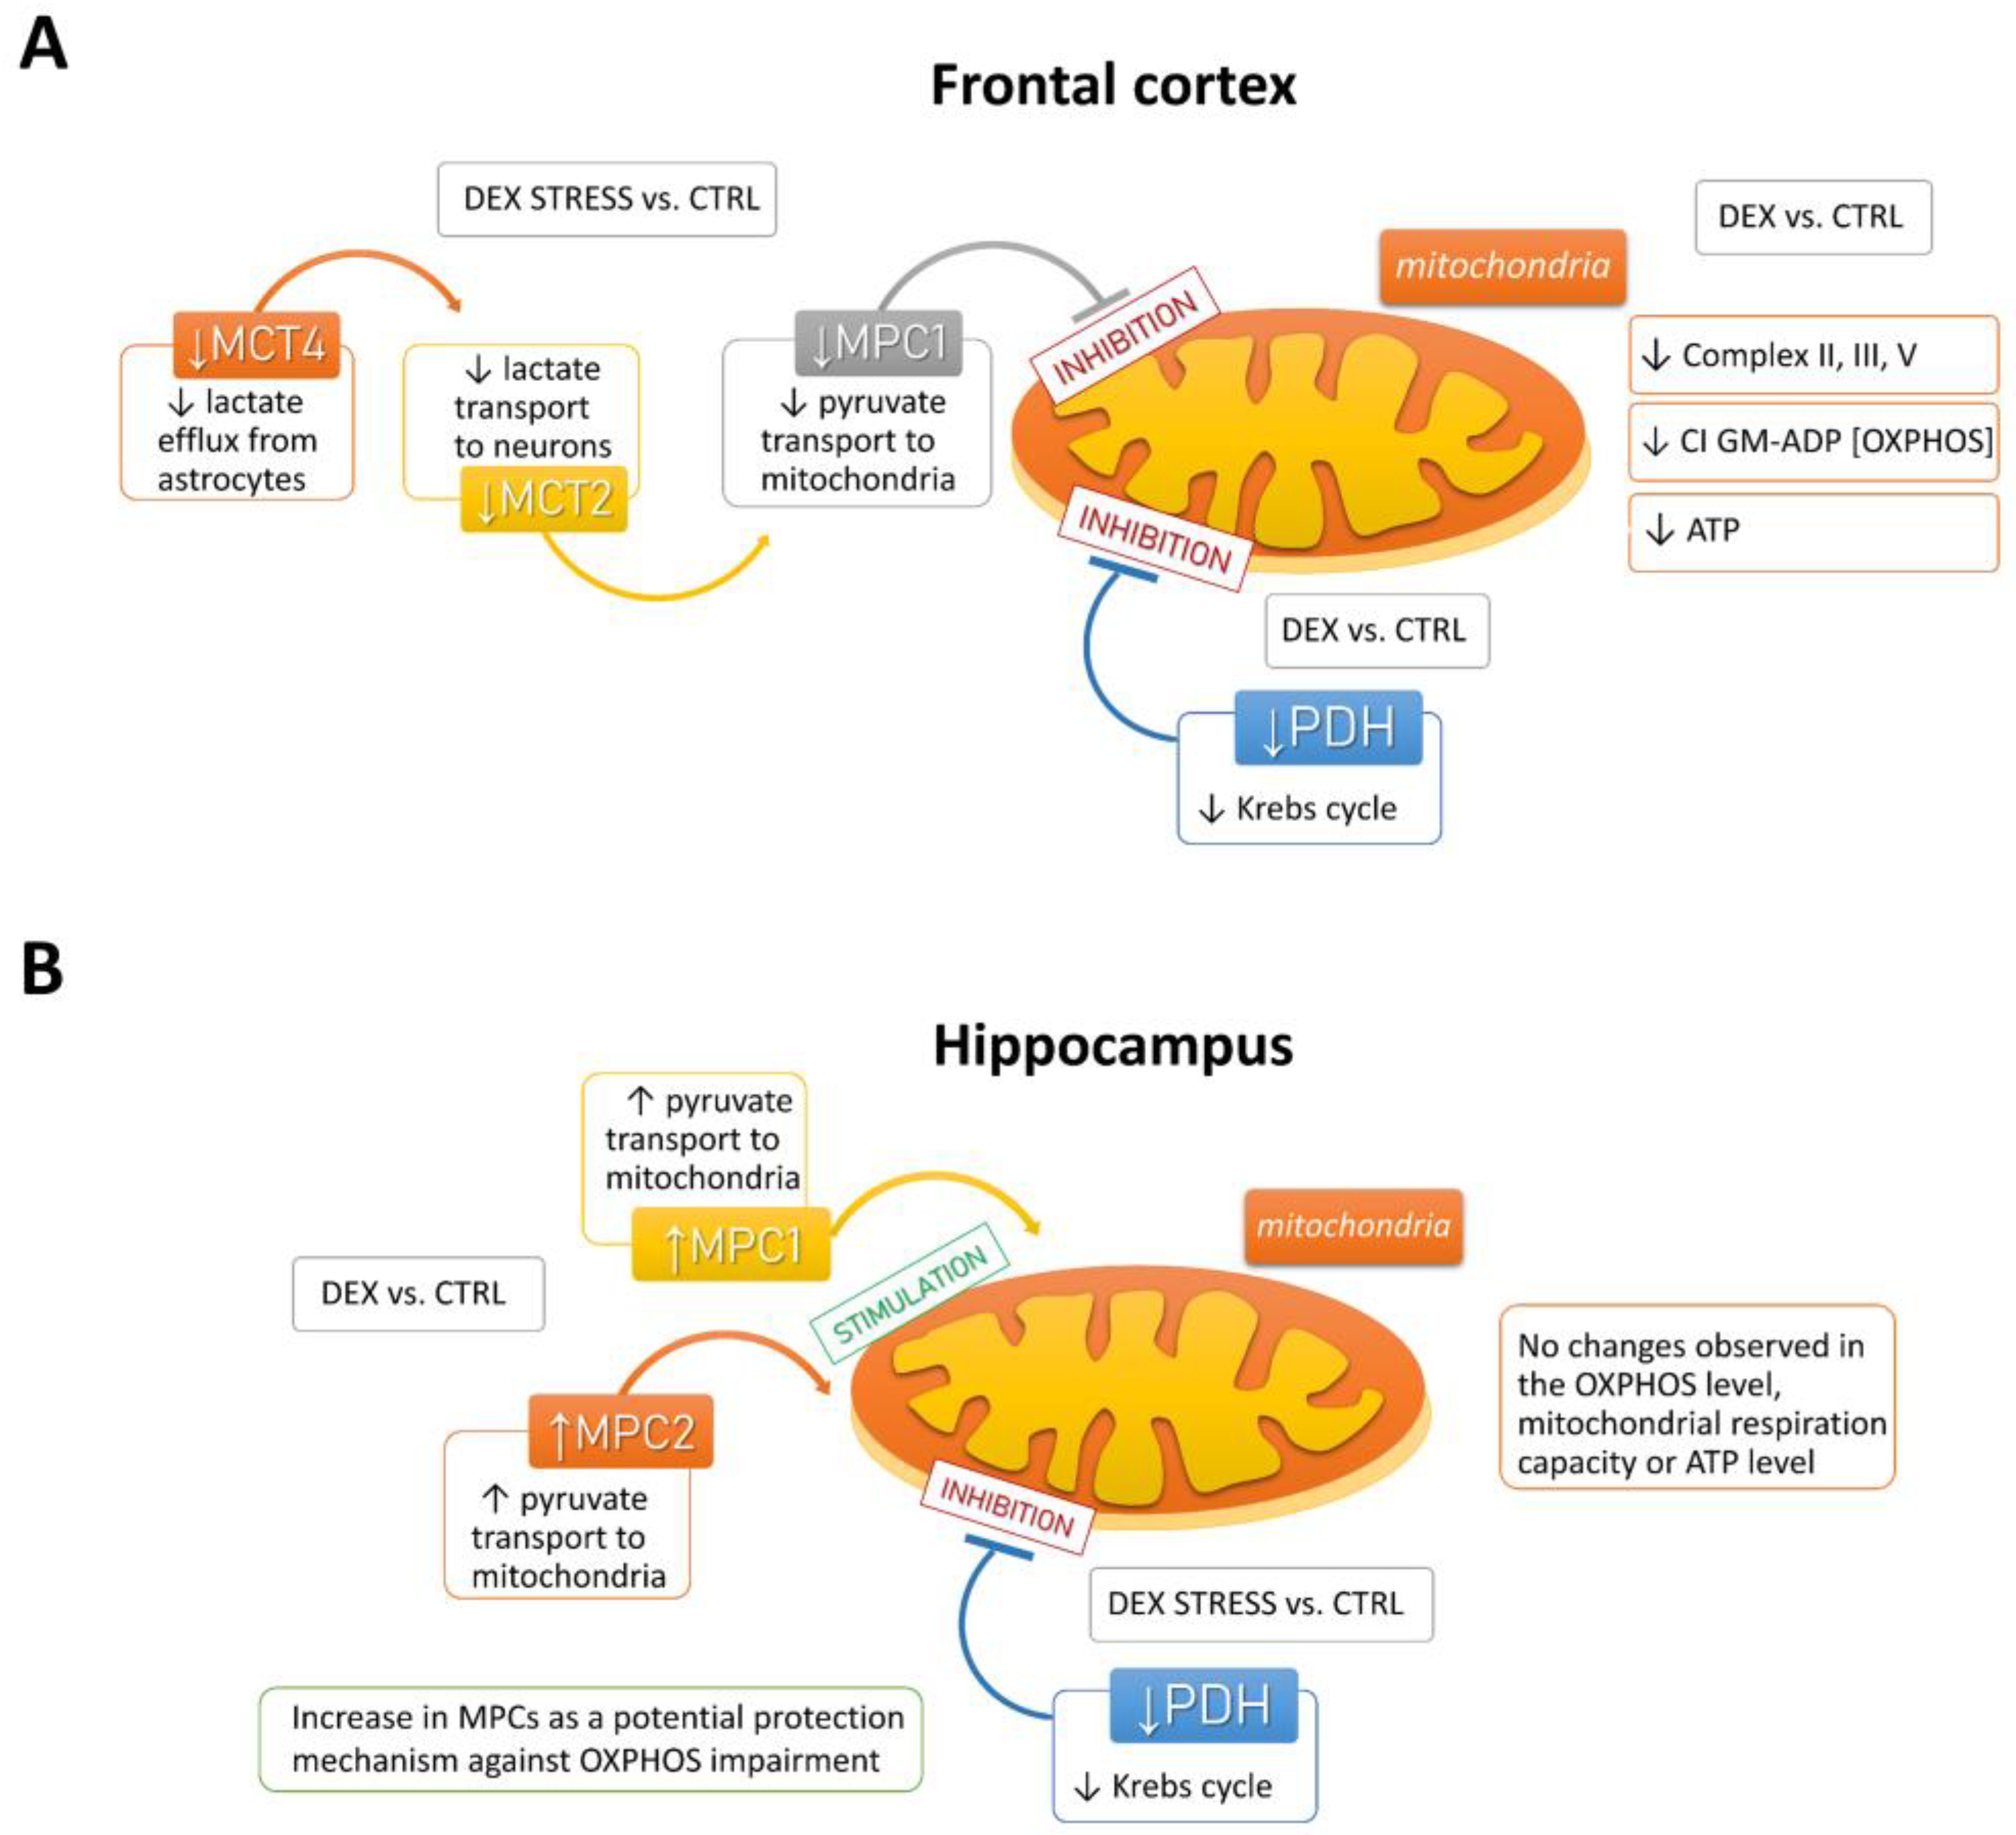
In contrast to the frontal cortex, MPC1 and MPC2 levels increased in the hippocampus in animals exposed to DEX, suggesting that this may be a mechanism that protects this structure from DEX-induced reduction in ATP synthesis (summary scheme of described dependencies is shown in
Figure 12). Moreover, in the hippocampus of animals prenatally exposed to DEX, an increase in lactate G-protein-coupled hydroxycarboxylic acid receptor 1 (HCAR1; GPR81) levels was also observed. It is now known that lactate acts in the brain not only as a metabolic substrate but also as a signaling molecule by activating the GPR81 receptor and most likely also through the yet unidentified GPCR coupled to the Gs receptor [
37,
38]. Since L-lactate has been shown to enhance cognitive function (learning and long-term memory) and exert neuroprotective effects in models of ischemia and exitotoxicity [
39,
40,
41]), the intensification of GPR81 levels in the hippocampus seems to be, as in the case of MPC1 and MPC2 transporters, a favorable change.
In conclusion, in a model of depression based on prenatal exposure of animals to DEX, pronounced metabolic disturbances in the brain of adult animals occurred in the frontal cortex but not in the hippocampus. The changes demonstrated in the frontal cortex indicate a reduction in the oxidative phosphorylation process, resulting in reduced ATP synthesis and possibly a weakening of the Krebs cycle with the simultaneous accumulation of glycolysis products. It seems that these changes result mainly from a decrease in PDH expression, the impairment of lactate transport to neurons and pyruvate to the mitochondria-enriched fraction, and the development of insulin resistance cannot be ruled out. Contrary to the frontal cortex, there was no decrease in ATP synthesis in the hippocampus, which may be due to the intensification of compensatory and protective mechanisms in this structure, such as an increase in the level of mitochondrial pyruvate transporters or lactate GPR81 receptors. However, these protective changes were no longer present in adult stressed animals.
Future Research
In future studies, the metabolic nature of depression induced by prenatal stress factors needs to be further investigated. We look forward to broadening the knowledge of the mechanisms causing bioenergetic changes in studying the neuropeptides with a multidirectional activity spectrum, namely, the orexin/hypocretin system. The expression of orexins is strongly regulated by glucocorticoids and the activity of orexin neurons rapidly changes in response to stress. Studying the role of orexin signaling in stress reactivity, as well as describing how dysregulation of this system can result in depressive phenotype will expand current research. Nowadays, due to the great interest in the therapeutic potential of pharmacological compounds that target orexin pathways for the treatment of psychiatric disorders such knowledge will be especially valuable.
4. Materials and Methods
4.1. Animals and Treatment
All experiments were conducted to minimize animal suffering and to reduce the number of animals used (3R policy).
Sprague-Dawley rats were purchased from Charles River Laboratories (Sulzfeld, Germany) and kept under standard conditions: room temperature of 22 ± 2 °C on a 12 h light/dark cycle, with food and water available ad libitum.
After quarantine, vaginal smears were collected from each female on consecutive days to provide information on the phase of the estrus cycle. When the proestrus phase was recognized based on the smear examination, dams were put in cages with breeding males overnight, and the next morning tested for the presence of sperm. Females with sperm cells detected were randomly assigned to the test and control groups and relocated to separate cages. The experimental group (n = 6) received the synthetic glucocorticoid, dexamethasone 21-phosphate disodium salt (DEX, Sigma-Aldrich, Saint Louis, MO, United States, Cat# D1159) treatment, which was administered subcutaneously to pregnant females at a concentration of 0.13 mg/kg/mL (equal to 0.1 mg/kg dexamethasone) dissolved in 0.9% saline starting from the 14th day of pregnancy until delivery. Accordingly, saline (0.9%) was administered to the control group’s females (n = 6). Male offspring were kept with mothers until weaning (3 weeks). After that time, they were mixed within the specific groups (DEX, n = 30 or Control n = 30) and housed in groups of three to five animals per cage until 10 weeks of age.
Then, behavioral tests, including FST and the EPM test, were conducted.
Two hours before being sacrificed, subgroups of the DEX-treated (
n = 10) and Control animals (
n = 10) were additionally subjected to a single session of acute immobilization stress. For one hour, animals were immobilized in tight cages and then returned to their home cages. One hour later, they were decapitated. A schematic diagram of the experiment is presented in
Figure 1.
4.2. Behavioral Tests
4.2.1. Elevated Plus Maze Test (EPM)
The anxiety-like behavior in the Sprague-Dawley rats involved in this study was assessed using an EPM made of wood consisting of two open arms elevated 50 cm above the floor. The apparatus was illuminated from beneath with only dim light (15 W). Rats were allowed to adapt to the experimental room for 1 h before the experiments. At the beginning of the experiment, each rat was placed in the center of the maze facing an open arm [
42]. The percent of time spent in the open arm ([time spent in the open entries]/[time spent in both arms] × 100) and the percent of the open arm entries ([open entries]/[total entries] × 100) were estimated during the 5 min experiment.
4.2.2. Forced Swim Test (FST)
The FST, developed by Porsolt et al. [
43,
44], is the most widely used tool for evaluating depression-like states in rodents and assessing antidepressant drug efficiency [
45]. The FST is based on the observation that rodents, following initial escape-oriented swimming, develop an immobile posture when placed in an inescapable cylinder of water. The test was conducted for 2 constitutive days. On the first day (pretest), each animal was placed in a water-filled cylinder with 35 cm water at 23–25 °C for 15 min. On the second day, the test was performed under the same conditions, and the immobility time was measured for 5 min.
4.3. Tissue Preparation
The rats were sacrificed under nonstressed conditions by rapid decapitation (between 9 a.m. and 12 p.m.). After that, trunk blood samples were collected into Falcon tubes containing EDTA and centrifuged (3000 rpm, 20 min, 4 °C). The separated plasma was transferred into new tubes and frozen at −20 °C. The rat brains were removed, and the frontal cortices and hippocampi were immediately dissected on ice-cold glass plates and further processed depending on their intended purpose. Samples collected for mitochondrial respiratory experiments (Oxygraph-2K study) required freshly isolated brain tissues (details of sample preparation in
Section 4.7). Samples for luminescent assessment of ATP content were homogenized immediately after tissue dissection and then frozen and stored at −80 °C until use (details of sample preparation in
Section 4.8). For the remaining biochemical analyses, tissue samples were frozen and stored at −80 °C until use.
4.4. Sample Preparation
4.4.1. Isolation of the Mitochondria-Enriched and Cytosolic Fractions
To assess the amount and activity of some mitochondrial enzymes, the mitochondria-enriched membrane fraction was isolated from the frontal cortices and hippocampi according to Wernicke et al. [
46]. Briefly, brain tissues were homogenized in ice-cold homogenization buffer (5 mol/L HEPES/NaOH, pH 7.4, 320 mmol/L sucrose, and 1 mmol/L Na
+/EDTA) with the addition of 0.5% protease inhibitor cocktail (Protein Inhibitor Cocktail, Sigma-Aldrich, Saint Louis, MO, United States, Cat# P8340) using a Teflon-glass homogenizer. Then, the samples were centrifuged (1300×
g, 4 min, 4 °C), and the supernatant was collected. The residual pellet was rinsed with homogenization buffer and centrifuged again (1500×
g, 4 min, 4 °C) to enhance mitochondrial yield. Finally, the combined supernatants were centrifuged (17,000×
g, 12 min, 4 °C). The mitochondria-containing pellets and supernatant (cytosolic fraction) were frozen and stored at −80 °C until use.
4.4.2. Tissue Homogenate Preparation
Tissue samples were homogenized in 2 mL tubes filled with a buffer appropriate for the specific method to be used using Tissue Lyser II (Qiagen Inc., Valencia, CA, USA) for 5 min at 30 Hz. Then, the samples were shaken for 20 min and finally centrifuged for 20 min at 14,000 rpm. Supernatants were collected, frozen, and stored at −80 °C until use.
4.5. Protein Concentration Assessment
The protein level in the tissue homogenates as well as in mitochondria-enriched and cytosolic fractions was determined with the BCA method [
47] using the PierceTM BCA Protein Assay Kit (Thermo Fisher Scientific, Waltham, MA, USA).
4.6. Western Blotting Assay
The frontal cortex and hippocampus samples were subjected to Western blotting analysis and homogenized in 2% SDS, while the samples of the isolated mitochondria-enriched membrane fraction were lysed in PBS containing 1% Triton X-100 and 0.1% SDS, enriched with phosphate and protease inhibitors (Thermo Fisher Scientific, Waltham, MA, USA, Cat# 78440). The total protein concentration was normalized to 3 μg/µL. Twenty micrograms of total protein mixed with loading buffer (Bio-Rad, CA, Hercules, CA, USA, Cat# 1610747) was boiled at 95 °C for 5 min (homogenate samples) or incubated at 37 °C for 5 min (mitochondria-enriched fraction samples) and proceeded according to a standard Western blotting protocol. The separation of proteins was carried out using Criterion™ TGX™ Precast Midi Protein Gels (Bio-Rad, Hercules, CA, USA) for 1 h under a constant voltage of 150 V, followed by semidry transfer to PVDF membranes (Sigma-Aldrich, Saint Louis, MO, USA). The membranes were then cut to allow simultaneous incubation with various antibodies and blocked with 5% skim milk in Tris-buffered saline (TBS) with 0.05% Tween 20 (Sigma-Aldrich, Saint Louis, MO, USA) for 1 h at room temperature. Primary antibodies against the following proteins were then added and incubated with the membranes at 4 °C overnight: OXPHOS–Total OXPHOS Rodent WB Antibody Cocktail (Abcam, Cambridge, UK, Cat# MS 604-300); Hexokinase-1 (HK1, Proteintech, Wuhan, Hubei, China, Cat# 19662-1-AP); Monocarboxylate Transporter 2 (MCT2, Bioassay Technology Laboratory, Jiaxing, Zhejiang, China, Cat# BT-1P05521); Monocarboxylate Transporter 4 (MCT4, Gene Tex, Alton Pkwy Irvine, CA, USA, Cat# GTX87926); Mitochondrial Pyruvate Carrier 1 (MPC1, Cell Signaling Technology, Danvers, MA, USA, Cat# 14462); Mitochondrial Pyruvate Carrier 2 (MPC2, Cell Signaling Technology, Danvers, MA, USA, Cat# 46141); Hydroxycarboxylic acid receptor 1 (HCAR1, GPR81, Sigma-Aldrich, Saint Louis, MO, USA, Cat# SAB-1300790); Protein Kinase B (Akt, Cell Signaling Technology, Danvers, MA, USA, Cat# 9272); Phosphorylated Protein Kinase B (pAkt, Cell Signaling Technology, Danvers, MA, USA, Cat# 4060); Mitofusin-2 (MFN2, Abcam, Cambridge, UK, Cat# ab56889); Uncoupling protein-4 (UCP4, Thermo Fisher Scientific, Waltham, MA, USA, Cat# PA5-69265); Dynamin-like 120 kDa protein (OPA1, Abcam, Cambridge, UK, Cat# ab42364). The next day, the membranes were washed four times with TBS with 0.1% Tween 20 (TBS-T) for 10 min and incubated with HRP peroxidase-conjugated appropriate secondary antibody: horse anti-mouse or goat anti-rabbit IgG HRP peroxidase-conjugated secondary antibody (both Vector Laboratories, Peterborough, UK, Cat# PI-2000-1 and Cat# PI-1000, respectively) for 1 h at room temperature. After an additional four washes in TBS-T for 10 min, targeted protein bands were detected using BM Chemiluminescence Western Blotting Substrate (POD) (Roche, Mannheim, Germany, Cat# 11500708001) and visualized using a luminescent image analyzer with a Fujifilm LAS-1000 System (Fujifilm, Tokyo, Japan). Relative levels of protein concentration were assessed via densitometry measurements conducted using Fujifilm Multi Gauge software (Fujifilm, Tokyo, Japan). In some cases, the membranes were stripped using stripping buffer containing 100 mL of Tris-HCl (pH = 6.7), 2% SDS, and 700 µL of 2-mercaptoethanol (all from Sigma-Aldrich, Saint Louis, MO, USA) for 0.5 h at 50 °C, washed 3 times for 10 min each in TBS-T, blocked, and reprobed with the appropriate primary antibody. As an internal loading control, anti-β-actin (Sigma-Aldrich, Saint Louis, MO, USA, Cat# A5441) or anti-vinculin (Sigma-Aldrich, Saint Louis, MO, USA, Cat# V9264) antibodies were used. The membranes are addressed in the
Supplementary Materials.
4.7. Mitochondrial Respiratory Function
Monitoring of mitochondrial respiratory function was conducted using an Oxygraph-2k (Oroboros Instruments, Innsbruck, Austria). For this purpose, frontal cortices and hippocampi were dissected from rats and placed in tubes containing ice-cold homogenization buffer (0.25 M sucrose, 50 mM KCl, 5 mM EDTA, 1 mM sodium pyrophosphate, 5 mM MgCl2 (pH 7.4); Sigma-Aldrich, Saint Louis, MO, USA) with freshly added protease inhibitor cocktail (Sigma-Aldrich, Saint Louis, MO, USA, Cat# P8340). To preserve the functionality of mitochondria, brain structures were homogenized ten times using a Teflon-glass homogenizer on ice. Then, they were centrifuged (1300 rpm, 10 min, 4 °C), and the supernatants were collected (SN1). The residual pellets were gently resuspended in four volumes of homogenization buffer and subjected to a second round of centrifugation under the same conditions. After that, the supernatant (SN2) was collected and combined with SN1. The mixture of supernatants was centrifuged again (9000× g, 15 min, 4 °C), and the resultant pellets were resuspended in five volumes of homogenization buffer. The protein concentration was measured with the BCA method, and 300 μg (amount determined based on preliminary experiments) of isolated mitochondria was suspended in MiR05 respiration buffer (EGTA 0.5 mmol/L, MgCl2·6H2O 3 mmol/L, K-lactobionate 60 mmol/L, taurine 20 mmol/L, KH2PO4 10 mmol/L, HEPES 20 mmol/L, sucrose 110 mmol/L, fatty acid-free BSA 1 g/L, pH 7.0 with KOH; Sigma-Aldrich, Saint Louis, MO, USA). A total volume of 2 mL of suspension was used per Oxygraph-2k chamber for each experiment.
The measurements were conducted as previously described [
25]. Briefly, mitochondrial respiratory function was assessed in the presence of the substrates glutamate and malate. The protocol included measurements as follows: (1) glutamate (10 mM) and malate (2 mM) without ADP (leak state); (2) respiration in the presence of ADP (2.5 mM; ADP-stimulated state, control of coupled respiration by complex I); (3) addition of succinate (10 mM, CI + CII OXPHOS state); (4) titration of the protonophore carbonylcyanide-4-(trifluoromethoxy)-phenylhydrazone (FCCP)-uncoupled state, optimal for 0.25 μM, which is the noncoupled state at the optimum uncoupler concentration for maximum oxygen flux; (5) addition of rotenone (1 μM) (CII-linked ETS capacity); and (6) antimycin A (2.5 μM; inhibition of complexes I and II, respectively). Inhibition of respiration of uncoupled mitochondria leads to the evaluation of oxygen flux due to oxidative side reactions (residual oxygen consumption, ROX). Data from high-resolution respirometry were analyzed using DatLab 4 software (Oroboros, Innsbruck, Austria) and given as an O2 flux per mass, ROX-corrected, and FCCP-normalized.
4.8. Luminescence Assay
The intracellular ATP content was measured in freshly homogenized brain tissue immediately after dissection. The commercially available kit ATPliteTM Luminescence Assay System (Perkin Elmer, Waltham, MA, USA, Cat# 6016943), which measures the emission of light proportional to the intracellular concentration of ATP, was used according to the manufacturer’s instructions. Samples were incubated for 10 min in the dark, and the luminescence was measured (with automatic attenuation set and integration time; Tecan Infinite 200 Pro plate reader, Mannedorf, Switzerland). The concentration of ATP was adjusted for the protein content in each sample and reported as µmol/g of protein.
4.9. Enzymatic Activity Assay
The activity of pyruvate dehydrogenase (PDH) was measured in the mitochondria-enriched fraction using a commercially available Pyruvate Dehydrogenase Activity Colorimetric Assay according to the manufacturer’s recommendations (BioVision, Milpitas, CA, USA, Cat# K679-100). The absorbance was then measured in a 96-well assay plate in a plate reader at 37 °C for 90 min, with an interval time of 10 min, λ = 450 nm (Tecan Infinite 200 Pro plate reader, Mannedorf, Switzerland). The activity of PDH was then calculated and displayed as nmol NADH/min/mg of protein.
4.10. Colorimetric/Fluorometric Assays
In the cytosolic- and mitochondria-enriched fractions, and lactate and pyruvate levels were assessed using a Lactate Colorimetric/Fluorometric Assay Kit (BioVision, Milpitas, CA, USA, Cat# K607-100) and the Pyruvate Activity Colorimetric/Fluorometric Assay Kit (BioVision, Milpitas, CA, USA, Cat# K609-100), respectively. Fractions were deproteinized with the use of a Deproteinizing Sample Preparation Kit according to the manufacturer’s recommendations (BioVision, Milpitas, CA, USA, Cat# 808-200). Samples were transferred into a 96-well plate and mixed with Reaction Mix. After 30 min of incubation, the level of lactate was determined by colorimetric measurements at λ = 570 nm, while pyruvate was determined via fluorometric measurements (excitation wavelength λ = 535 nm, emission wavelength λ = 590 nm; Tecan Infinite 200 Pro plate reader, Mannedorf, Switzerland). The concentrations of the enzymes were calculated based on the standard curve and presented as ng/mg of protein. Protein level was measured before deproteinization.
4.11. Enzyme-Linked Immunosorbent Assay (ELISA)
The levels of phosphofructokinase type L (PFKL), pyruvate kinase (PK) and hexokinase (HK), as well as insulin (INS), insulin receptor (IR), phospho-insulin receptor (pIR), and insulin receptor substrate 1 (IRS1), were measured in cortical and hippocampal homogenates prepared in PBS with protease and phosphatase inhibitors using commercially available ELISA kits according to the instructions provided by the manufacturers (Cat# E2541Ra (PFKL), Cat# E1251Ra (PK) and Cat# E0330Ra (HK) from Bioassay Technology Laboratory (Jiaxing, Zhejiang, China); Cat# EZRMI-13K (INS) from Merck Millipore (Darmstadt, Germany); Cat# ELK2640 (IR) and Cat# ELK8434 (IRS-1) from ELK Biotechnology (Wuhan, Hubei, China); Cat# EIA09498r (pIR) from Wuhan Xinqidi Biological Technology (Wuhan, Hubei, China)). Samples of isolated mitochondria-enriched fractions required additional preparation steps. Briefly, the samples were mixed with PBS buffer enriched in protease inhibitors (Protein Inhibitor Cocktail, Sigma-Aldrich, Saint Louis, MO, USA, Cat# P8340), sonicated with an ultrasonic cell disrupter until the solution turned clear, and centrifuged (5000× g, 5 min, 4 °C). The supernatants were used to assess the levels of pyruvate dehydrogenase alpha (PDHα), voltage-dependent anion channel 1 (VDAC1), and uncoupling protein 2 (UCP2) with commercially available kits (ELK Biotechnology, Wuhan, Hubei, China, Cat# ELK2703, Cat# ELK7787, and Cat# ELK6519, respectively).
Moreover, in the plasma samples, ELISA was used for insulin (INS) level measurements (ELK Biotechnology, Wuhan, Hubei, China, Cat# ELK2370).
In each case, all samples along with standards and blanks were transferred to 96-well precoated plates. The concentrations of the analyzed markers were calculated based on the standard curves and subsequently divided by the protein content in a given sample, when appropriate. The final concentration was presented as ng/mg of protein.
4.12. Statistical Analysis and Data Visualization
Statistical evaluation was conducted using Statistica 13.3 software (StatSoft, Palo Alto, CA, USA) and one- or two-way analysis of variance (ANOVA) followed by the Duncan post hoc test, when appropriate. Differences were considered significant at p < 0.05. The ANOVA results are reported as an F-statistic and its associated degrees of freedom. All graphs were prepared using GraphPad Prism 8 (San Diego, CA, USA).
