Communication

Functional Insight into and Refinement of the Genomic Boundaries of the JARID2-Neurodevelopmental Disorder Episignature

by
Liselot van der Laan
1,
Kathleen Rooney
2,3,
Sadegheh Haghshenas
2,
Ananília Silva
3,
Haley McConkey
2,3,
Raissa Relator
2,
Michael A. Levy
2,
Irene Valenzuela
4,5,
Laura Trujillano
4,5,
Amaia Lasa-Aranzasti
4,5,
Berta Campos
4,5,
Neus Castells
4,5,
Eline A. Verberne
1,
Saskia Maas
1,
Mariëlle Alders
1,
Marcel M. A. M. Mannens
1,
Mieke M. van Haelst
1,†,
Bekim Sadikovic
1,2,3,*,† and
Peter Henneman
1,*,†
1
Department of Human Genetics, Amsterdam Reproduction and Development Research Institute, Amsterdam University Medical Center, University of Amsterdam, Meibergdreef 9, 1105 AZ Amsterdam, The Netherlands
2
Verspeeten Clinical Genome Centre, London Health Sciences Centre, London, ON N6A 5W9, Canada
3
Department of Pathology and Laboratory Medicine, Western University, London, ON N6A 3K7, Canada
4
Medicine Genetics Group, Vall d’Hebron Institut de Recerca (VHIR), Vall d’Hebron Barcelona Hospital Campus, Vall d’Hebron Hospital Universitari, 129, 08035 Barcelona, Spain
5
Department of Clinical and Molecular Genetics, Vall d’Hebron Barcelona Hospital Campus, Vall d’Hebron Hospital Universitari, 129, 08035 Barcelona, Spain
*
Authors to whom correspondence should be addressed.
These authors contributed to this work equally.
Int. J. Mol. Sci. 2023, 24(18), 14240; https://doi.org/10.3390/ijms241814240
Submission received: 17 August 2023 / Revised: 15 September 2023 / Accepted: 16 September 2023 / Published: 18 September 2023
(This article belongs to the Special Issue Epigenetic Regulation in Human Disease)

Abstract

:
JARID2 (Jumonji, AT-rich interactive domain 2) haploinsufficiency is associated with a clinically distinct neurodevelopmental syndrome. It is characterized by intellectual disability, developmental delay, autistic features, behavior abnormalities, cognitive impairment, hypotonia, and dysmorphic features. JARID2 acts as a transcriptional repressor protein that is involved in the regulation of histone methyltransferase complexes. JARID2 plays a role in the epigenetic machinery, and the associated syndrome has an identified DNA methylation episignature derived from sequence variants and intragenic deletions involving JARID2. For this study, our aim was to determine whether patients with larger deletions spanning beyond JARID2 present a similar DNA methylation episignature and to define the critical region involved in aberrant DNA methylation in 6p22–p24 microdeletions. We examined the DNA methylation profiles of peripheral blood from 56 control subjects, 13 patients with (likely) pathogenic JARID2 variants or patients carrying copy number variants, and three patients with JARID2 VUS variants. The analysis showed a distinct and strong differentiation between patients with (likely) pathogenic variants, both sequence and copy number, and controls. Using the identified episignature, we developed a binary model to classify patients with the JARID2-neurodevelopmental syndrome. DNA methylation analysis indicated that JARID2 is the driver gene for aberrant DNA methylation observed in 6p22–p24 microdeletions. In addition, we performed analysis of functional correlation of the JARID2 genome-wide methylation profile with the DNA methylation profiles of 56 additional neurodevelopmental disorders. To conclude, we refined the critical region for the presence of the JARID2 episignature in 6p22–p24 microdeletions and provide insight into the functional changes in the epigenome observed when regulation by JARID2 is lost.

1. Introduction

JARID2 (OMIM; #601594) haploinsufficiency (DIDDF, OMIM; #620098) leads to a clinically distinct neurodevelopmental syndrome characterized by intellectual disability (ID), developmental delay (DD), autistic features, behavior abnormalities, cognitive impairment, hypotonia, and dysmorphic features such as high anterior hairline, deeply set eyes, depressed nasal bridge, full lips, broad forehead, and bulbous nasal tip [1,2]. JARID2 is located at chromosome region 6p22.3. Large multi-gene deletions of chromosome region 6p22–p24 involving JARID2 have been described in individuals who present with a similar phenotype as those with JARID2 intragenic deletions and loss-of-function variants [3]. Baroy et al. assessed variable-sized deletions of this region and implicated the chromatin remodelers JARID2 and ATXN1 as likely disease-causing candidate genes [3].
JARID2 functions as a transcriptional repressor protein involved in the regulation of various histone methyltransferase complexes. The JARID2 protein also plays a crucial role in the recruitment and activation of the polycomb repressive complex 2 (PRC2). PCR2 is a complex that suppresses the expression of target genes on histone H3 lysine 27 (H3K27) methylation [4,5].
Recently, our group has reported evidence of JARID2 involvement in the epigenetic regulation of DNA methylation by demonstrating a highly sensitive and specific DNA methylation episignature in the peripheral blood of affected patients [6]. This episignature biomarker was trained using single-nucleotide variants (SNV) or intragenic deletions of JARID2 and did not include larger multi-gene copy number variants (CNVs) that are part of the overlapping 6p22–p24 microdeletion syndrome. Disruption of multiple genes in this region may impact the phenotype and result in a different episignature from that observed in individuals with variants limited to JARID2 [7]. Several episignatures have been defined for chromosomal microdeletion/duplication syndromes, where episignature profiles have been attributed to a specific gene locus [7,8]. Similarly, this approach can be applied to identify a target gene within a larger CNV responsible for DNA methylation changes, providing valuable insights into the pathophysiology of CNV disorders and identifying new candidate genes that are responsible for the phenotypic features [7]. For example, our group previously demonstrated that the HNRNPU episignature included two cases with a large CNV spanning regions involving distinct genes next to HNRPNU [8]. Here, it was shown that including individuals carrying distinct regional CNVs in episignature assessment and discovery is a powerful method for identifying the causal gene within the deletion region for a given disorder.
In this study, we hypothesized that patients with 6p22–p24 microdeletion syndrome encompassing JARID2 may exhibit DNA methylation episignatures overlapping with those seen in patients with SNVs and intragenic CNVs [7]. Our study aims to refine the critical region for the JARID2 episignature, among other potential epigenetic regulatory genes within the 6p22–p24 region. Finally, we offer novel insights into the global genomic DNA methylation architecture of JARID2 and compare JARID2 to 56 other neurodevelopmental episignature disorders.

2. Results

2.1. JARID2 Molecular and Clinical Information

The molecular and clinical details of the CNV cohort are summarized in Table 1 and Figure 1. All four individuals have a large deletion that includes JARID2 and at least two additional genes. Whereas cases 1–2 and 4 fully encompass JARID2, case 3 has a large multi-gene deletion that includes only exon 1 of JARID2.
Table 1 shows the clinical details of the CNV cohort, with a summary of the cases from the discovery of the JARID2-neurodevelopmental syndrome episignature [6]. The cases with CNV deletions had ID, DD, behavioral abnormalities, and autistic features. Furthermore, neurologic examination showed that two cases presented with hypotonia, and one had MRI abnormalities overlapping with the original discovery cohort. Dysmorphic features were present in all patients, and percent overlap with the discovery cohort was indicated.

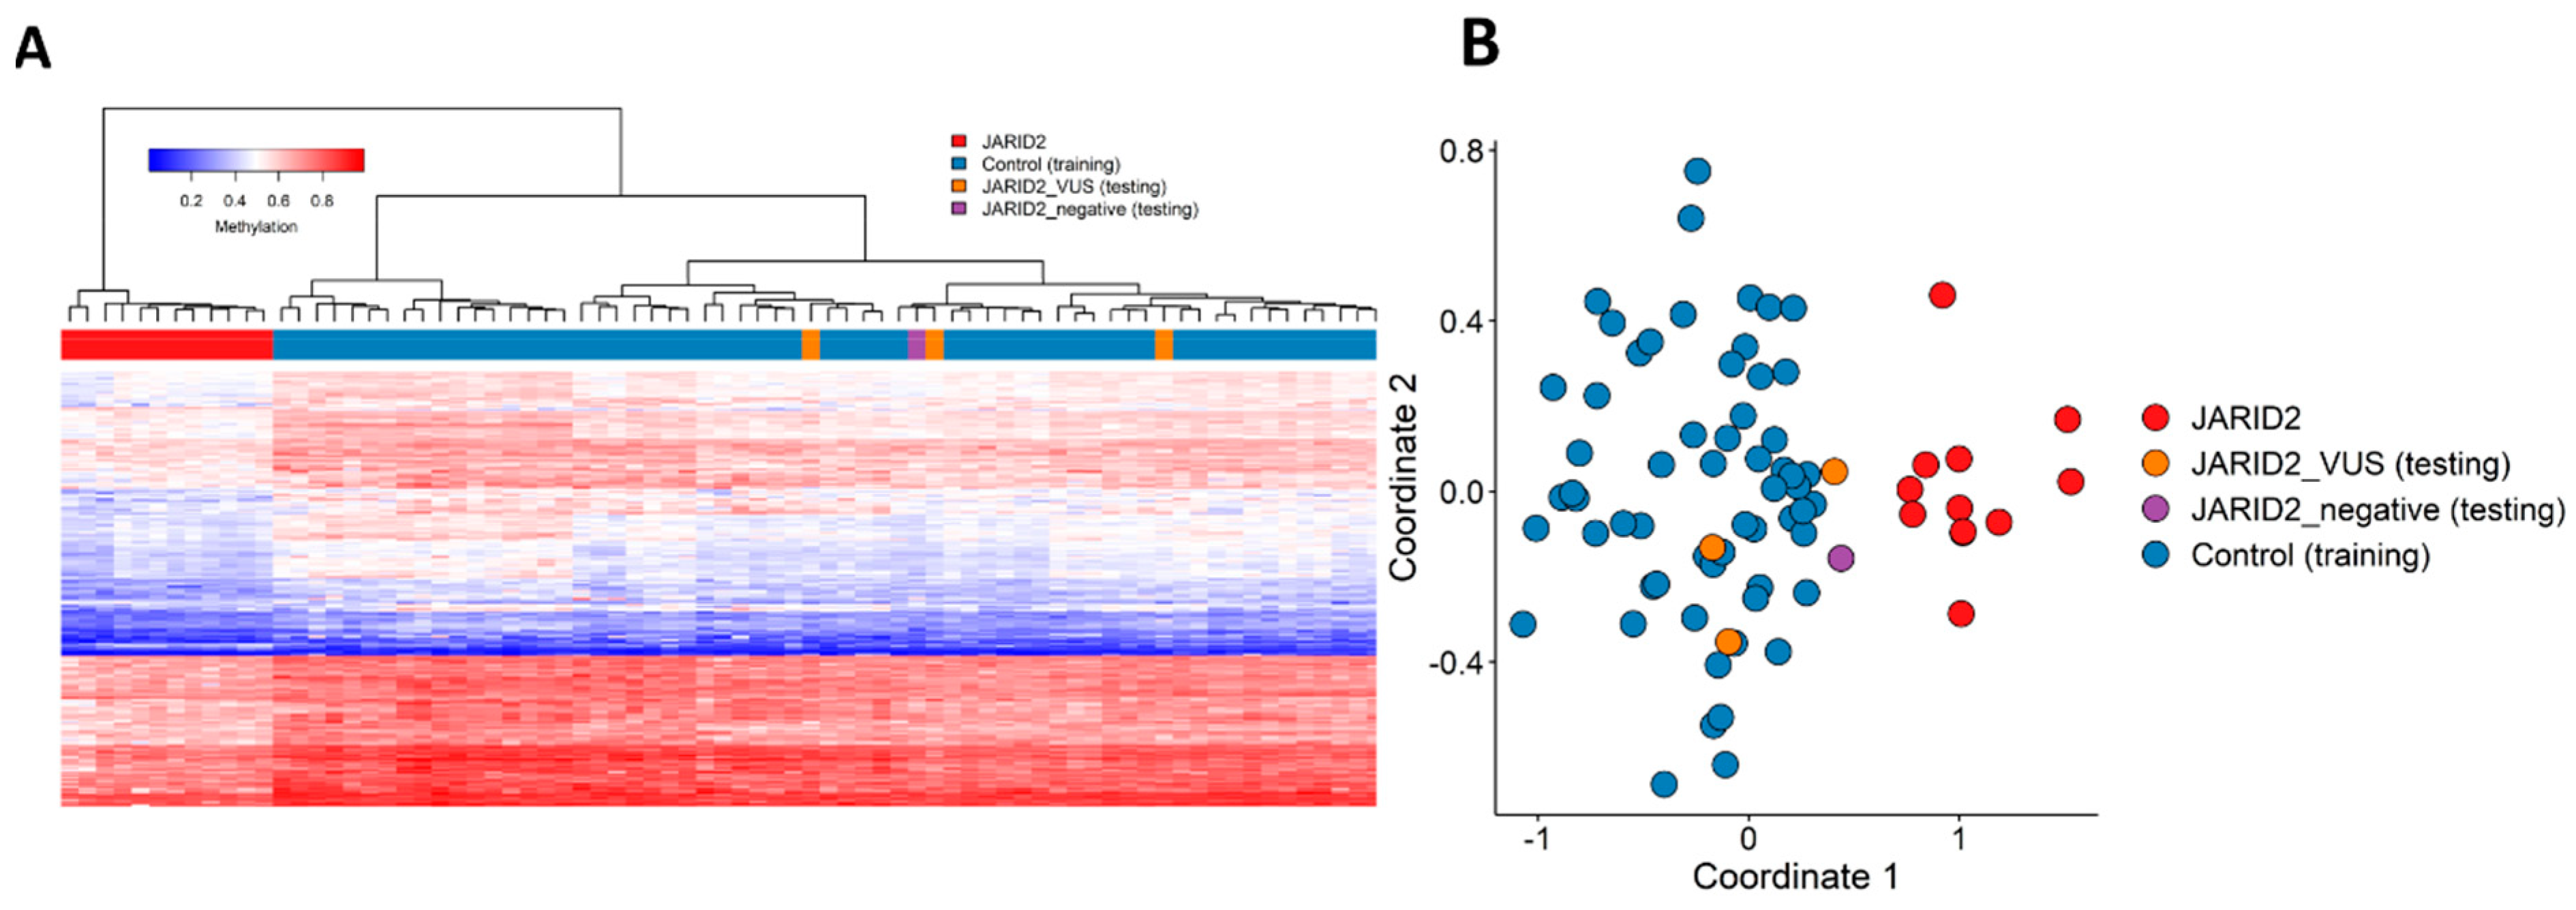
2.2. Identification and Assessment of an Episignature for JARID2

We assessed CNV cases and one additional SNV case using the previously derived JARID episignature. All cases were positive for a common JARID2 episignature through MDS and heatmap clustering (Supplementary Figure S1). Subsequently, we combined all cases and performed an extended episignature discovery analysis. Here, we included the four CNV and one new SNV case and eight previously described patients with pathogenic sequence variants within JARID2 [6]. All study samples passed quality control, and the feature selection procedure yielded 218 probes (Supplementary Table S2), which showed distinct clustering between cases and controls. Hierarchical clustering (heatmap) and MDS showed clear separation between this cohort and matched controls (Figure 2A,B). Using twelve rounds of leave-one-out cross-validation followed by unsupervised hierarchical and MDS clustering (Supplementary Figure S2), we demonstrated reproducibility for the combined JARID2 episignature. Lastly, an SVM model was constructed that showed an MVP score close to 1 for all but one case, indicating high sensitivity and specificity of the model (Figure 2C).
The one case (#8, from Verberne et al.) that did not map to the JARID2 episignature was excluded from the episignature discovery cohort (JARID2_negative) (Figure 3). The three individuals carrying a JARID2 missense variant of uncertain significance (VUS) were not included in episignature discovery and were assessed separately as testing samples by plotting them alongside the affected cases with CNVs and SNVs in JARID2 and controls, using the same selected probes. The three individuals with a VUS and the JARID2_negative were clustered with controls, indicating the absence of the JARID2 episignature (Figure 3).

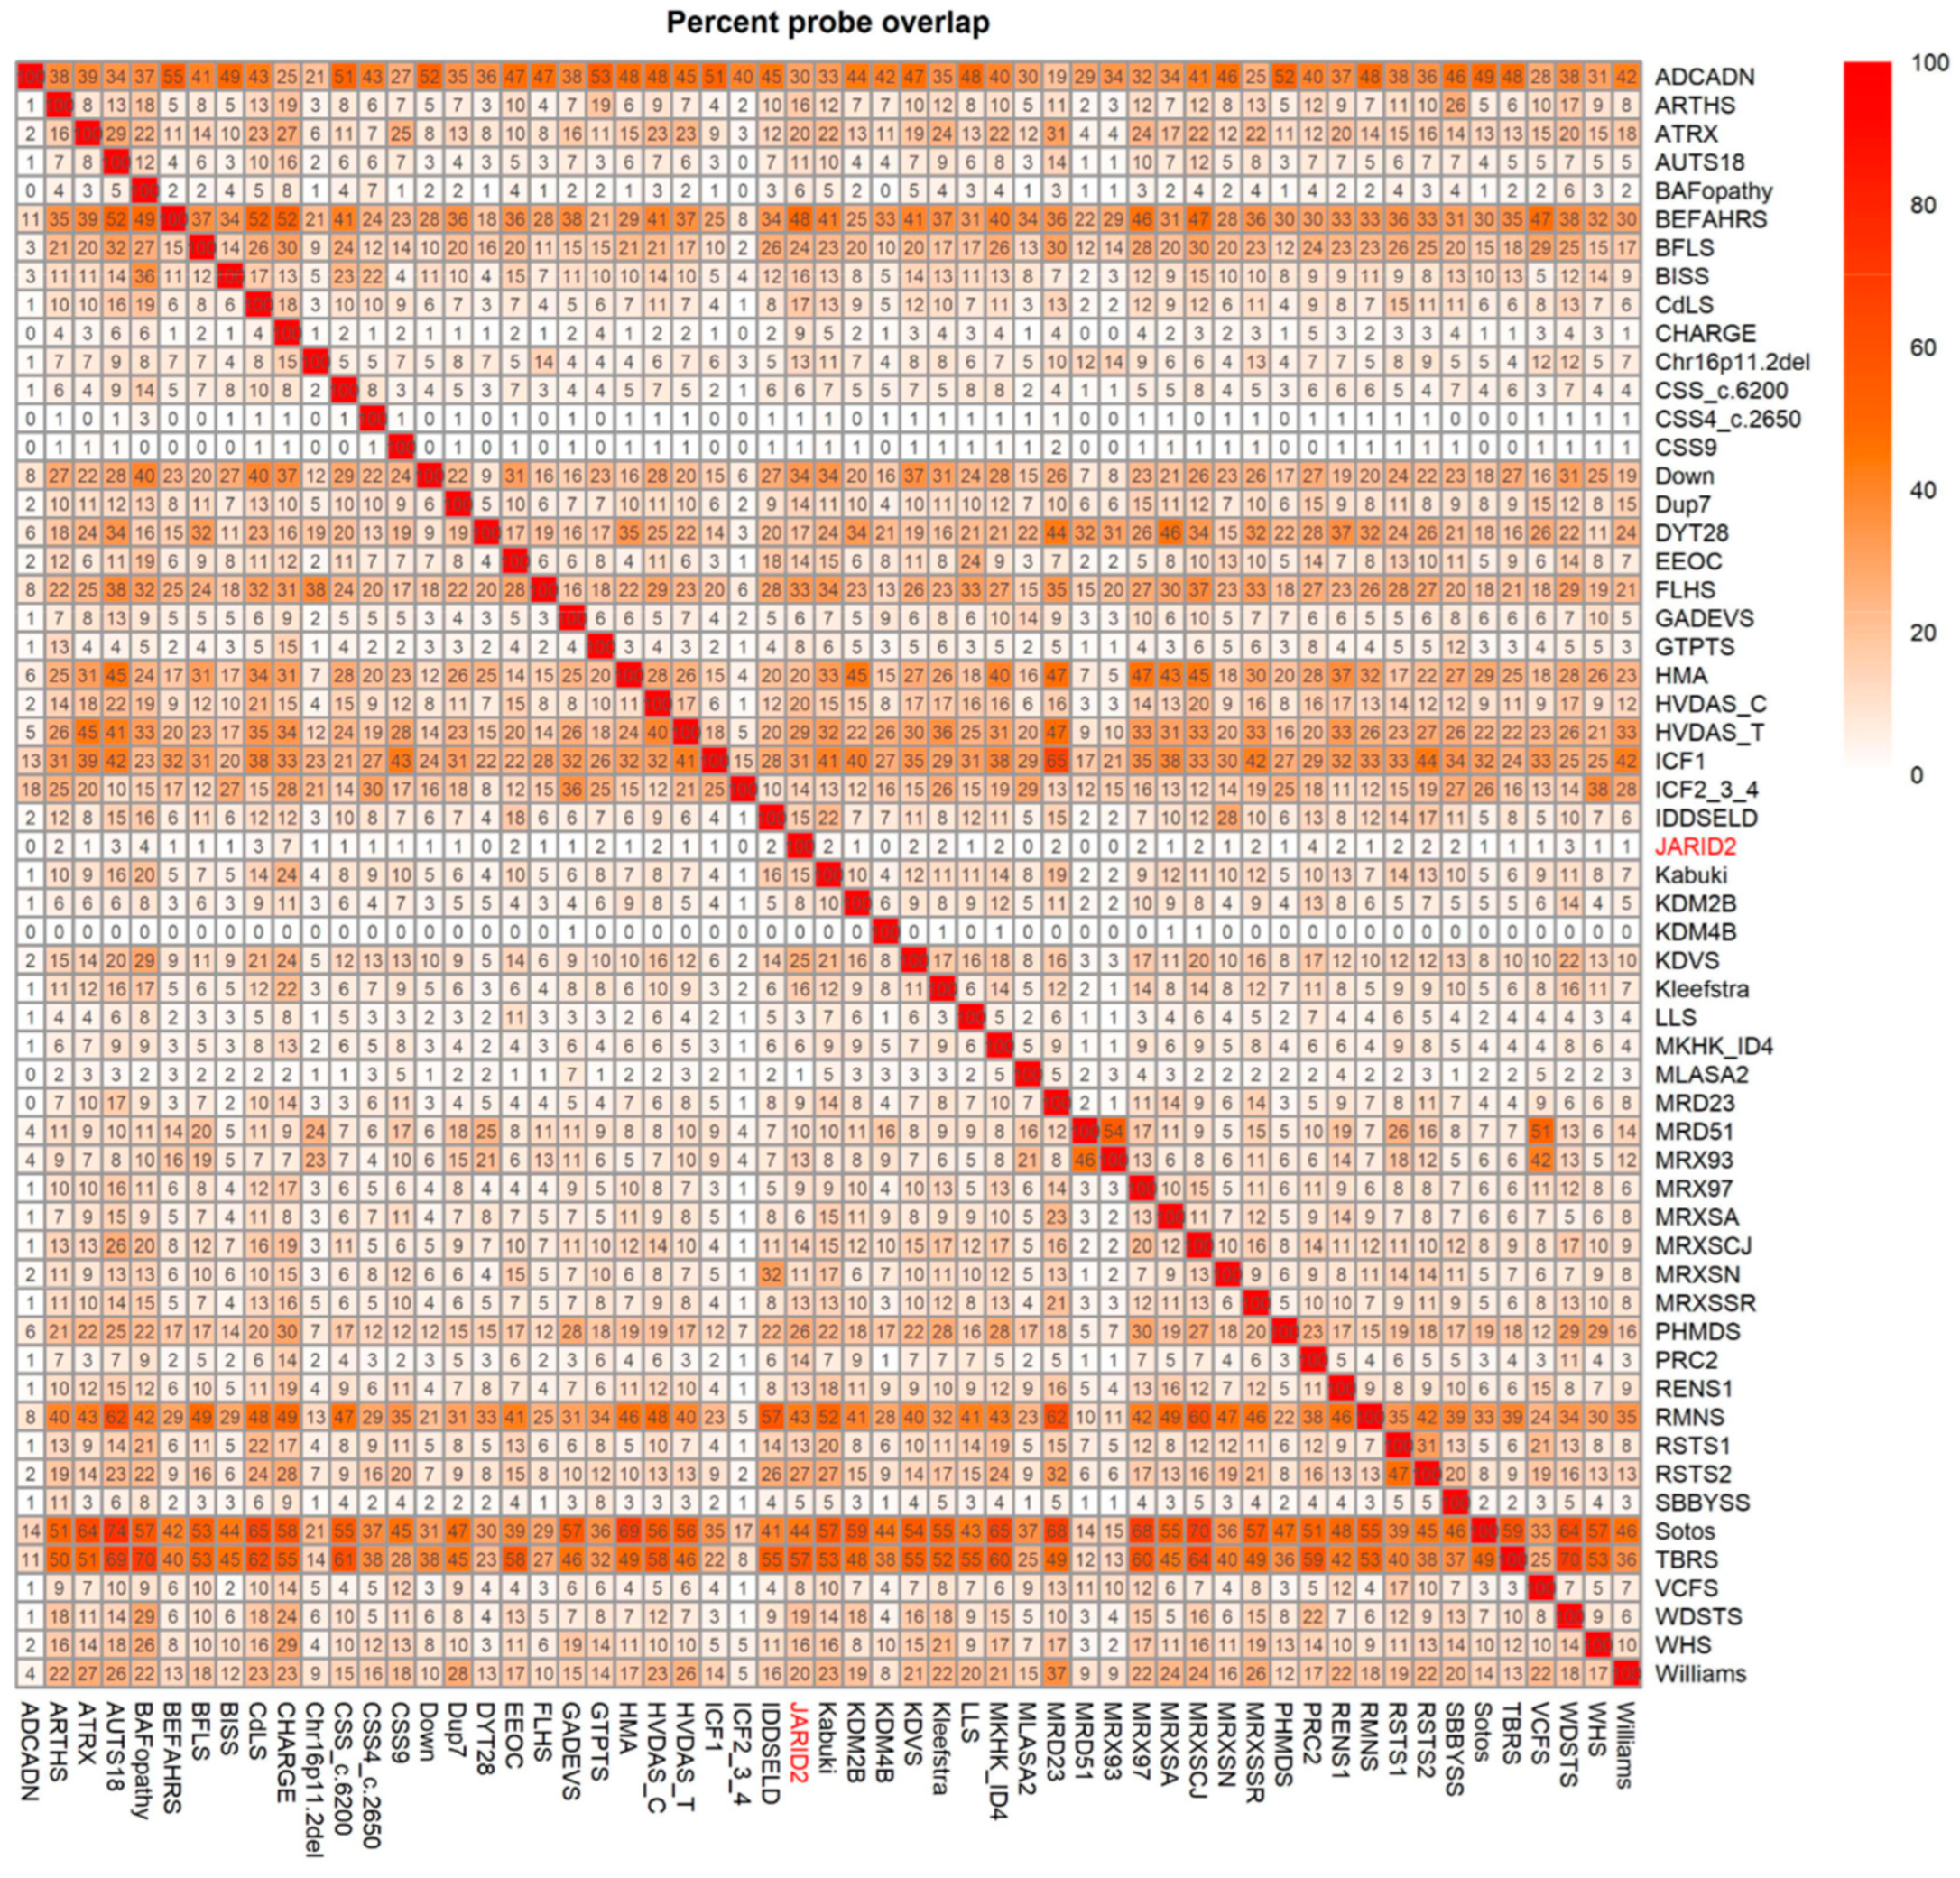
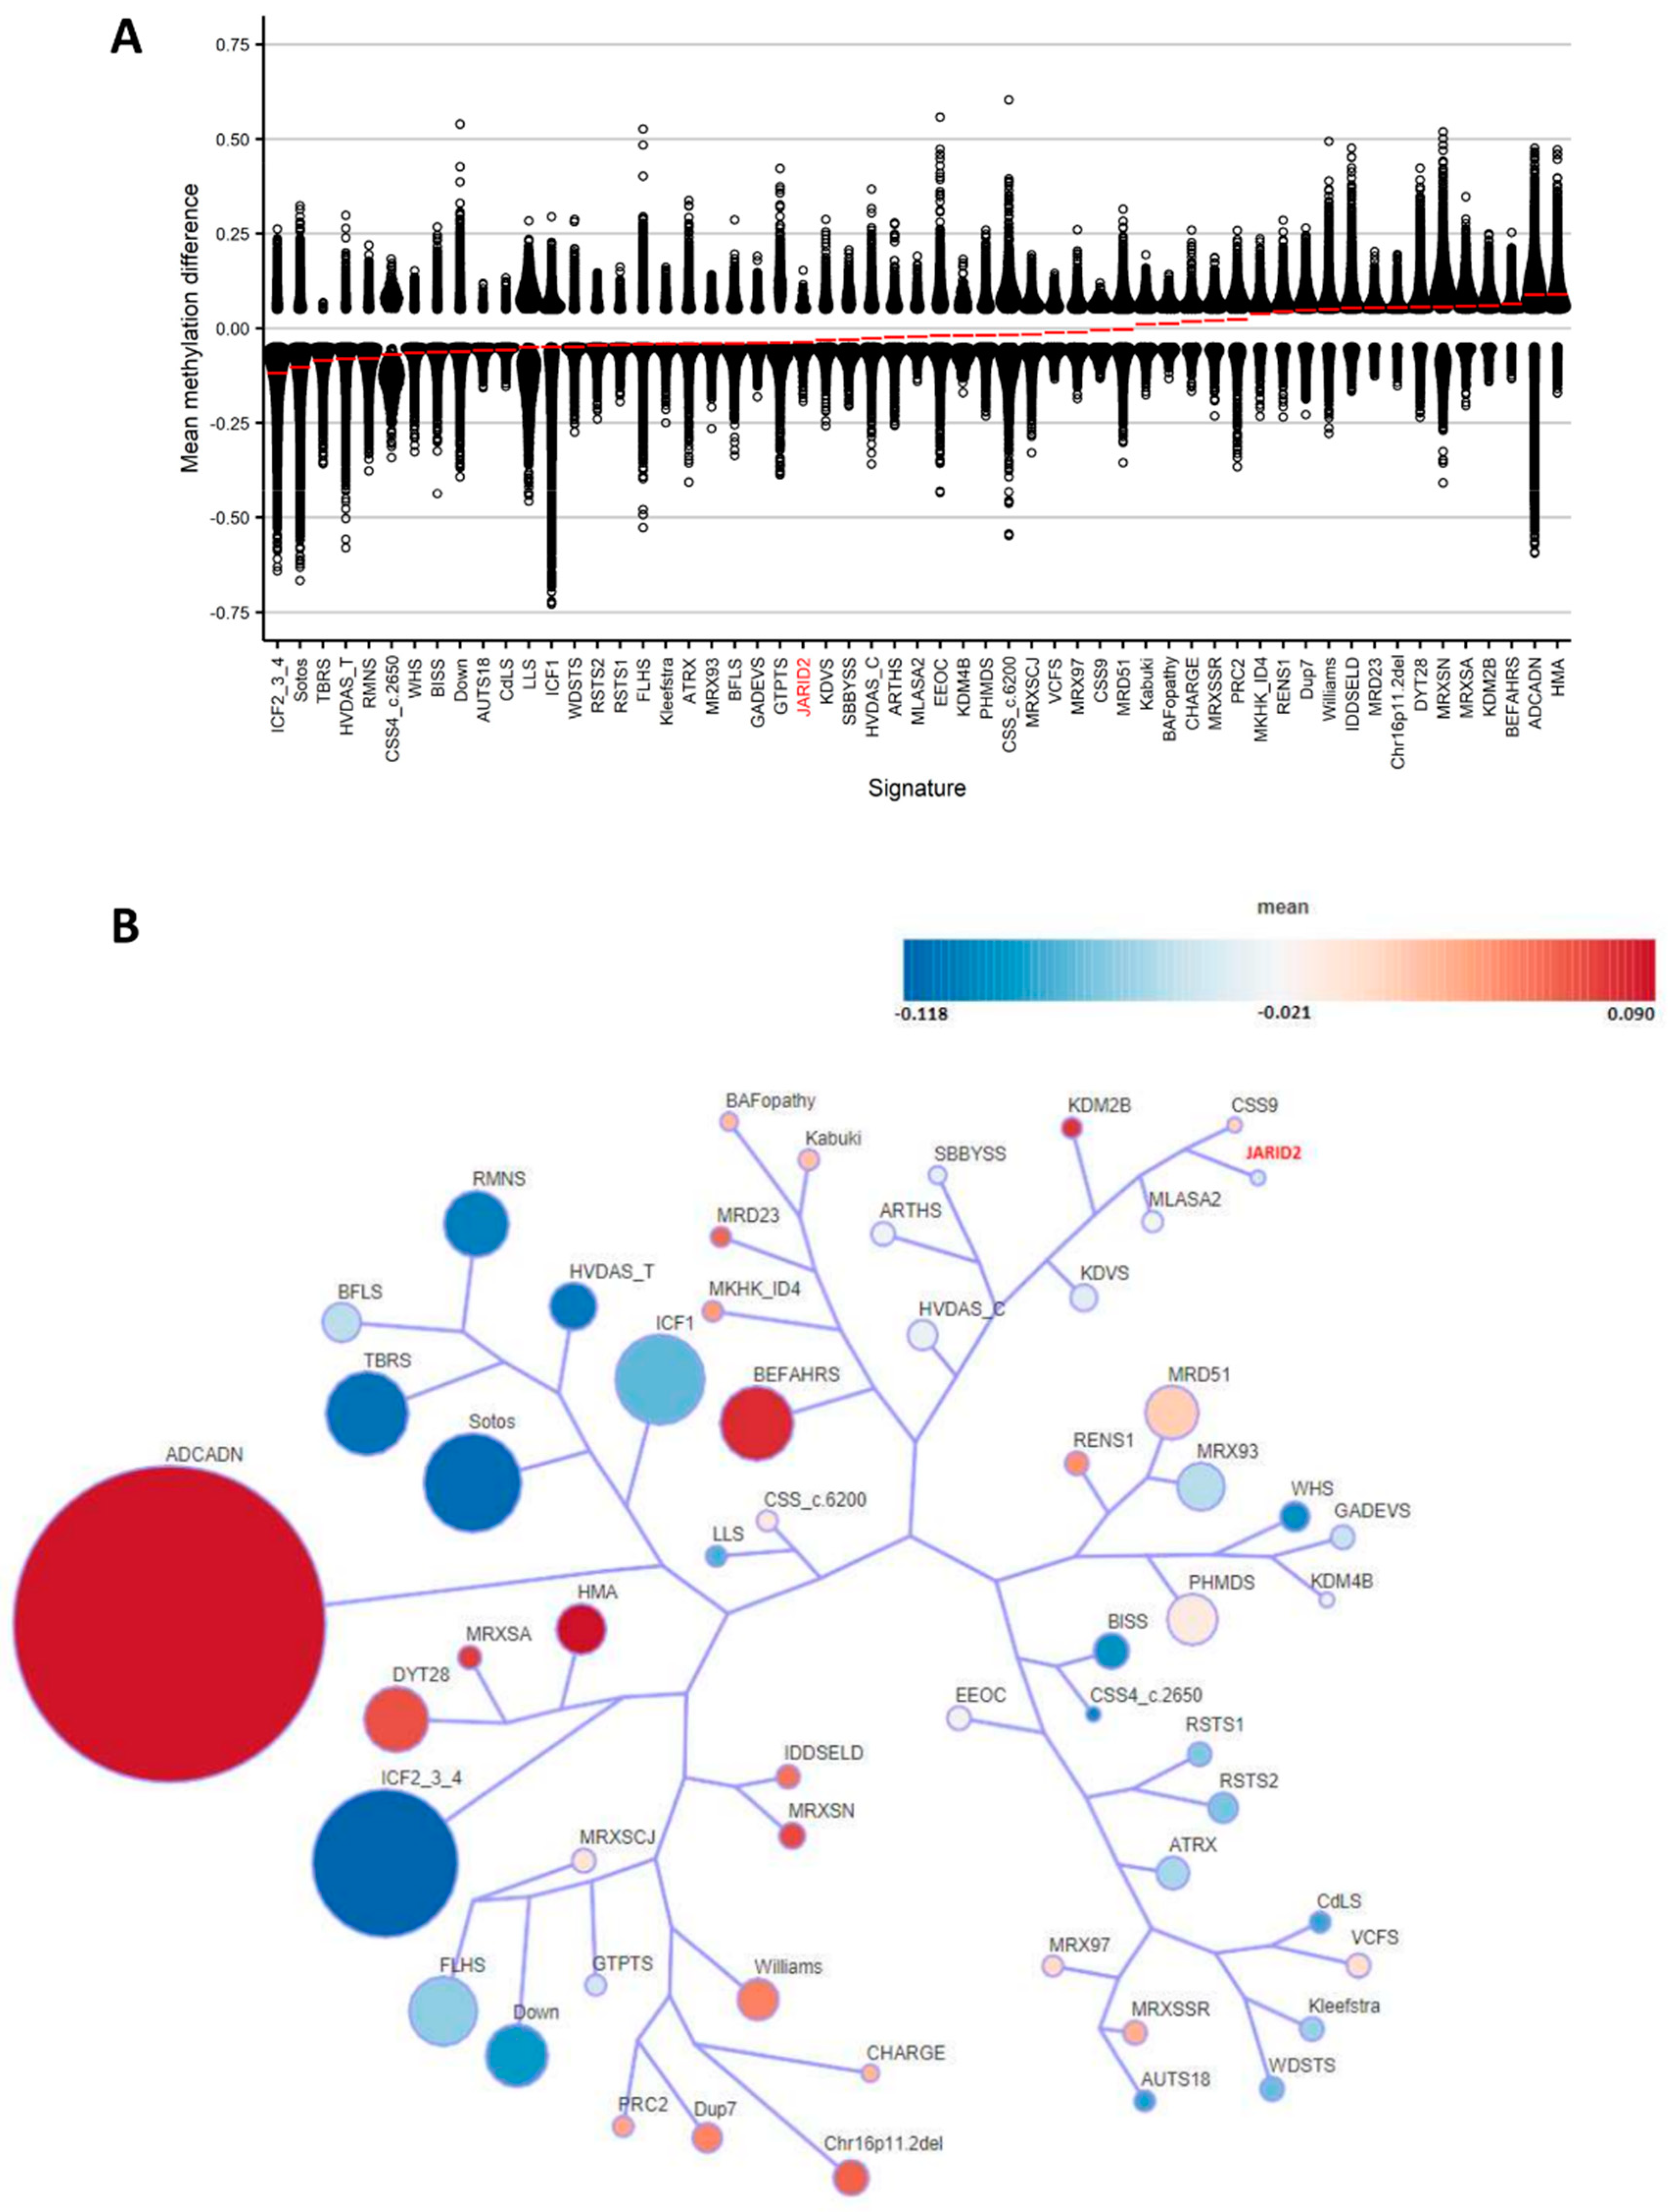
2.3. Annotation of the Global JARID2 DNA Methylation Profile and Correlation to the 56 Neurodevelopmental Disorder Episignatures on EpiSign™

We conducted a clustering analysis using the top number of differentially methylated probes (DMP) for all the cohorts described earlier by Levy et al. [10] to uncover relationships between those cohorts irrespective of the number of selected DMPs. We identified a genome-wide DMP set for JARID2 based on differential DNA methylation and p-value relative to age-, sex-, and array-matched controls from the EpiSign Knowledge Database (EKD). We then compared this list to the genome-wide DMP list of the other 56 EpiSignTM V3 classifier episignature disorders, as described before by Levy et al. [10] (Figure 4). The JARID2 probe set comprised 628 DMPs, with the DMPs range for all cohorts spanning from 279 to 151848. Notably, JARID2 exhibited the highest overlap with CHARGE (~7%, CHD7), BAFopathy (~4%, including ARID1A, ARID1B, SMARCB1, SMARCA2, SMARCA4), and the PCR2 complex, which houses Cohen–Gibson syndrome (COGIS) and Weaver syndrome (WVS) (~4%, EED, EZH2) (Figure 4). The circos plot visually represents a similar overlap represented in the heatmap, with the thickness of the lines indicating the number of DMPs shared between the two cohorts (Supplementary Figure S3).
Next, we conducted a correlation analysis between the JARID2 cohort and the 56 episignature conditions (Figure 5). We compared the mean DMP beta-values for each cohort, revealing that JARID2 exhibited relative global hypomethylation (Figure 5A). To assess the similarity in genome-wide methylation profiles, we utilized the top 500 DMPs for each cohort. When cohorts had less than 500 DMPs, all DMPs were used in the analysis. A tree-and-leaf plot showed that the JARID2 genome-wide DNA methylation change is most closely related to the DNA methylation changes of Coffin–Siris syndrome-9 (CSS9; SOX11), myopathy, lactic acidosis, and sideroblastic anemia 2 (MLASA2; YARS2) and Lysine-demethylase 2B (KDM2B) (Figure 5B).

2.4. Detection of Differentially Methylated Regions

Detection of differentially methylated regions (DMRs) was based on non-trained differentially methylated positions using DMRcate. Here, we identified two significantly hypomethylated DMRs for the JARID2 cohort (Supplementary Table S3). Both of the DMRs were located within a CpG island that covered a promotor region. The first DMR was annotated to chromosome 1 and involved HOXA-AS3, HOXA3, RP1-170O19.22, HOXA5, and HOXA6 gene clusters, and the second DMR was on chromosome 17 and overlapped with the RP11-1055B8.6, RP11-1055B8.7, and MIR4740 genes.

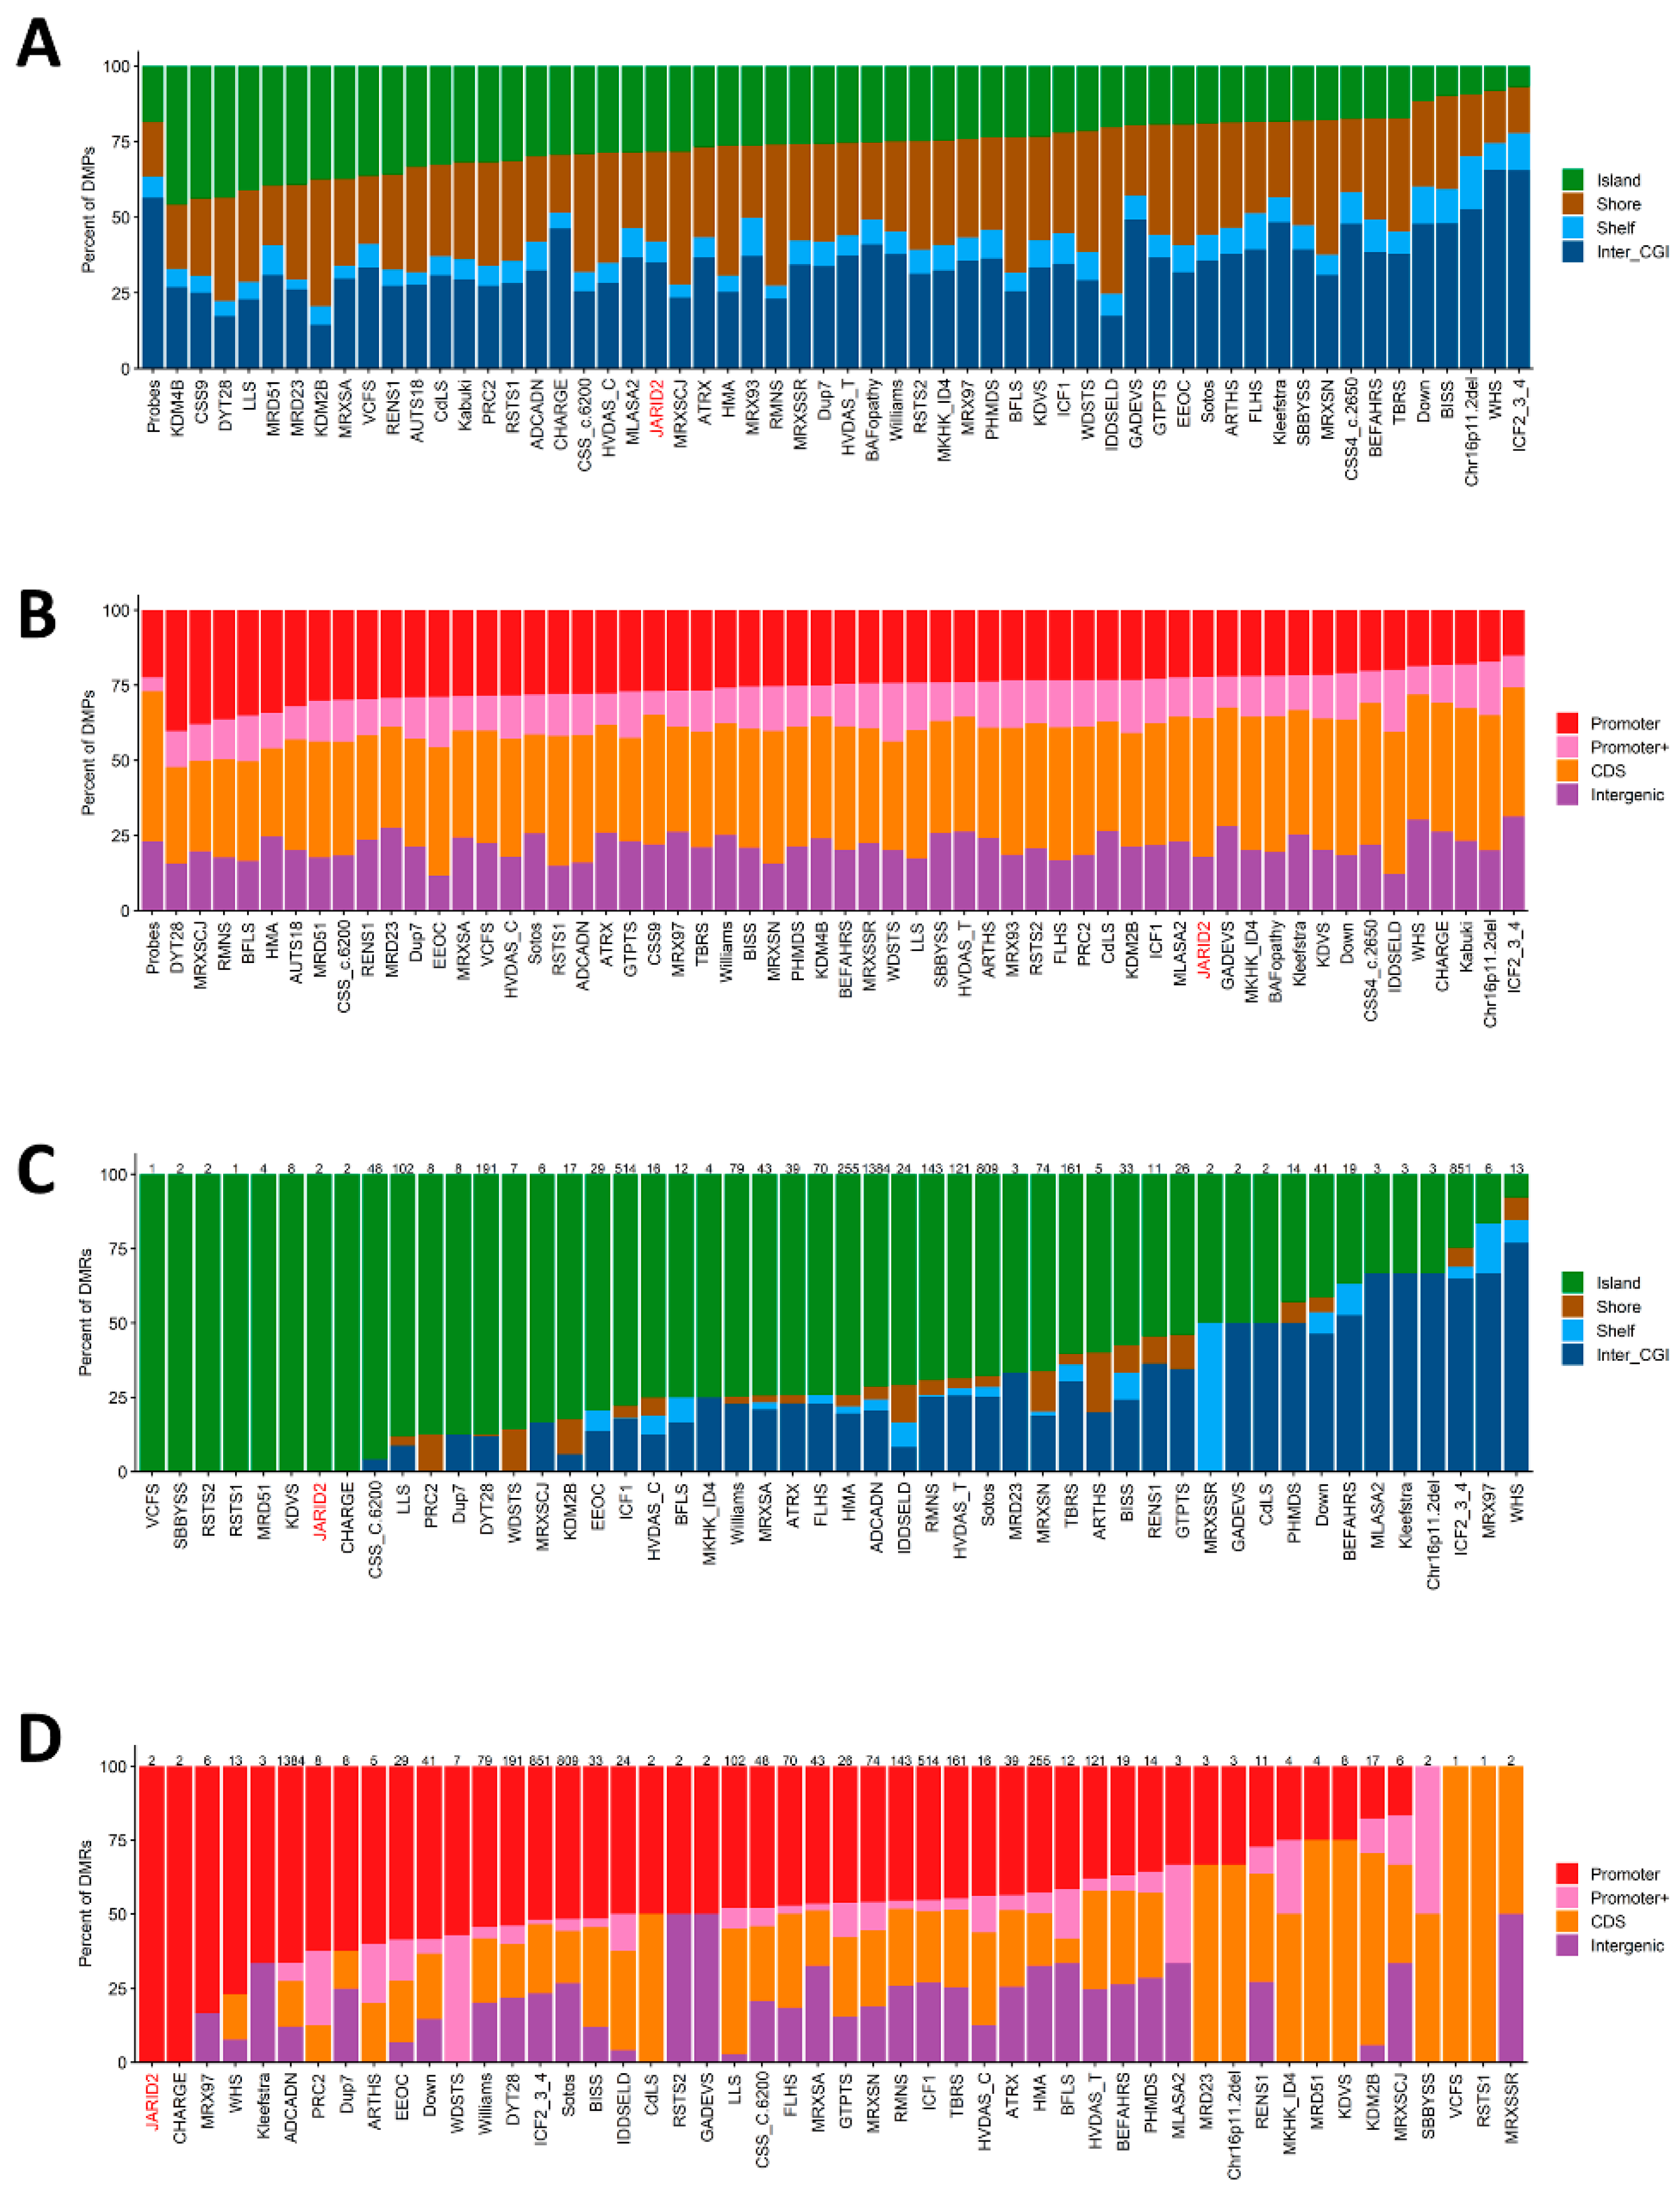
2.5. Genomic Location of Classifying DMPs and DMRs

We proceeded to investigate the genomic location of the DMPs and DMRs concerning CpG islands and genes. Figure 6A illustrates that DMPs are predominantly situated in genomic regions outside of the CpG islands and their shore/shelf regions. Similarly, concerning genes, we observed an enrichment of DMPs in coding regions and intergenic regions, with fewer occurrences in promoter regions (Figure 6B). In contrast, both DMRs were annotated to CpG islands (Figure 6C) and, in relation to genes, were located in the promotor regions of the HOXA-AS3, HOXA3, RP1-170O19.22, HOXA5, HOXA6, RP11-1055B8.6, RP11-1055B8.7, and MIR4740 genes (Figure 6D). Furthermore, we noted a significant difference in the distribution of DMPs in the JARID2 profile compared to the background probe distribution concerning genes (p-value < 7.06 × 10⁻¹¹) and CpG islands (p-value < 2.98 × 10⁻²⁸).

3. Discussion

DNA methylation episignatures can be utilized for the molecular diagnosis of individuals with Mendelian neurodevelopmental disorders and for the assessment of ambiguous genetic findings such as VUS reclassification. The list of episignature disorders is rapidly expanding, with over 70 episignatures having currently been reported [11].
The aim of this study was to investigate whether large CNVs containing JARID2 exhibit the same DNA methylation pattern as those previously described for intragenic variants and to refine the critical region for the presence of the JARID2 episignature in microdeletions involving 6p22–p24. Additionally, we aimed to further explore the overlap of the global methylation profile of affected JARID2 cases with other Mendelian disorders with known episignatures. We have demonstrated that multi-gene CNVs including JARID2 display the same DNA methylation episignature as intragenic variants in JARID2. Moreover, we have established the genomic 6p22–p24 deletion boundaries for an episignature that encompasses both sequence and copy number variants. Case 4 possesses the largest deletion and includes four other genes related to epigenetic regulation: TFAP2A, SIRT5, ATXN1, and KDM1B. The deletion of case 3 also includes SIRT5, another epigenetic regulation gene, and case 2 and 1 also include ATXN1. The impact of these genes on the JARID2 DNA methylation episignature was previously unknown. However, our results demonstrate that all four cases clustered with the already established JARID2-neurovelopmental disorder episignature.
However, one individual with a deletion spanning exon 6–18 (case 8 from Verberne et al.), initially suspected to have a pathogenic variant, did not exhibit the methylation episignature. The reason for this discrepancy remains unclear. One possible explanation is that this particular deletion has a distinct effect on DNA methylation across the genome, causing it not to align with cases that have more similar functional consequences. A less likely case is that it could also suggest that the JARID2 episignature lacks complete penetrance in all cases [1]. Further research is necessary to shed light on this unexpected finding. Additionally, we confirmed the same negative results for three previously assessed VUS cases, using the expanded episignature [6].
The CNV cohort consisted of four cases with large CNVs involving multiple genes in addition to JARID2. All four participants were diagnosed with JARID2-neurodevelopmental syndrome based on their phenotype and the presence of deletion of JARID2. Case 3 carried a deletion of only exon 1 of JARID2. However, there are multiple transcripts of JARID2 known that include alternative transcriptional start sites (Supplemental Figure S4). Although the largest alternative transcript is not covered by the deleted region detected in case 3, it is possible that the deletion disrupts the gene promoter and impacts JARID2 transcription in cis. An alternative explanation is that exon 1 of JARID2 is functionally essential, and therefore the primary cause of the associated episignature and the phenotype, which warrants further investigation. Earlier research showed that deletions of the start site and first exons of haploinsufficient genes are known to be pathogenic in many instances if there are no alternative start sites. The so-called start-loss variants can directly affect the start codon, and their effect on the final protein structure has an influence on the phenotype of patients [12]. This effect is assumed to be similar to patients that have whole-gene deletions of JARID2 [6]. Taken together, with the similarity in phenotype of case 3 in comparison with the others and the positive signature, this may indicate that JARID2 is a critical gene within the 6p22–p24 microdeletion region, and that the aberrant methylation is driven by genetic variations involving JARID2 [1,2,4,5,13].
During this analysis, we defined a larger subset of DMPs (n = 628) as representing the global DNA methylation changes in affected JARID2 cases. Within this subset, we identified two hypomethylated regions, both of which were located in promotor regions and CpG islands. Notably, one of the DMRs overlapped a region containing HOX genes (HOXA-AS3, HOXA3, HOXA5, HOXA6). HOX genes are recognized for their significance in embryonic bone, tissue, and organs, and they have been implicated in seizure syndromes [14], mirroring the involvement of HOX genes in JARID2 syndrome. In order to evaluate any effect of the detected DMRs on gene expression, we queried the iMETHYL webtool (http://imethyl.iwate-megabank.org) (accessed on 14 September 2023). Here, we concluded that the DMR annotated to chr7 may be negatively associated with expression of the HOXA5 gene, and that the DMR annotated to chr17 indicated only a very low negative association with MIR4740 gene expression. Furthermore, JARID2 DMPs also exhibited overlap with the PCR2 complex episignature that encompasses Cohen–Gibson syndrome (COGIS) and Weaver syndrome (WVS) DMPs. Both COGIS and WVS result from pathogenic variants in the EED and EZH2 genes and are also known to be associated with seizures [15,16].
JARID2 patients demonstrated the highest overlap in DMPs with three cohorts: (1) CHARGE, (2) BAFopathy, and (3) COGIS and WVS. CHARGE syndrome exhibited a ~7% overlap with the JARID2 cohort, and it is caused by variants in CHD7, characterized by multiple congenital anomalies [17]. Notably, the HOXA5 DMR found in the JARID2-neurodevelopmental disorder is also hypomethylated in CHARGE syndrome, which may explain some of the clinical overlap observed between JARID2-neurodevleopmental disorder and CHARGE [14]. BAFopathy presented with a ~4% overlap, including ARID1A, ARID1B, SMARCB1, SMARCA2, and SMARCA4, and includes several neurodevelopmental disorders caused by variants in genes within the BRG1/BRM-associated factor (BAF) complex [18]. The PCR2 complex episignature, which includes Cohen–Gibson syndrome (EED) and Weaver syndrome (EZH2), presented with a ~4% overlap in DMPs. JARID2 plays a crucial role during the recruitment and activation of the PRC2 [4,5,11]. The phenotypes of PRC2 and JARID2-neurodevelopmental disorders partially overlap; for example, both syndromes may involve ID, seizures, and developmental delay including speech delay [15]. When comparing only the top 500 DMPs detected in the JARID2 episignature with the previously mapped EpiSignTM disorders, the JARID2 DNA methylation episignature showed the highest similarity with the CSS9 (SOX11) episignature. Proteins encoded by SOX11 and JARID2 play crucial roles in multiple developmental processes and belong to the same family of transcription factors, leading to changes in gene expression. Variants in SOX11 can cause ID, microcephaly, ocular malformation, hypogonadotropic hypogonadism, and dysmorphic features [19,20]. However, it is important to note that in this study, we have not presented supporting evidence of direct regulation by JARID2 of each of the classifier DMPs, associated DMRs, or their annotated genes.

4. Materials and Methods

4.1. Subjects and Study Cohort

In addition to the cohort described previously by Verberne et al. [6] (Supplementary Table S1), this study includes four cases with multi-gene CNVs including JARID2 and one individual with an SNV variant (NM_004973.4: c.1400_1425del, p. (Ala467Glyfs*48)). All cases were identified in a clinical diagnostic setting through microarray analysis or whole-exome sequencing (WES). Variants were classified as pathogenic following the guidelines of the American College of Medical Genetics [21,22].
Episignature discovery included all cases, except for the variant of uncertain significance (VUS) that was used in later episignature validation assessments.

4.2. Sample Processing

DNA from peripheral blood was isolated according to standard techniques. DNA methylation analyses were performed with the Illumina Infinium methylation EPIC bead chip arrays (San Diego, CA, USA) according to the manufacturer’s protocol. Data analysis was performed at the Verspeeten Clinical Genome Centre at London Health Sciences Centre, Canada. Analysis and discovery of the DNA methylation episignature were based on the laboratory’s previously published protocols [10,11]. To summarize, intensity data files (idat) generated after the EPIC array containing methylated and unmethylated signal identities were imported into R (version 4.2.3) and normalized using background correction with the R package minfi (version 1.44.0) [23]. Prior to analyses, the following probes were removed from the dataset: probes with detection p value > 0.1, probes located on chromosomes X and Y, probes with single-nucleotide polymorphisms (SNPs) at or near the CpG interrogation site, or single-nucleotide extension sites and probes known to cross react with other genomic regions. After the latter data-cleaning procedure, 772,557 probes remained for data analyses. Samples that contained more than 5% failed probes (p-value > 0.1, calculated by the minfi package) were excluded. Next, principal component analysis (PCA) was used to investigate batch structure and to detect case or control outliers. Controls were randomly selected from the EKD [24], though matched by age, sex, and array type using the Matchlt package (version 4.5.2) [25] at a ratio of 1:5. Using the limma package (version 3.54.2) [26], methylation levels for each probe (beta values) were transformed to M-values by logit transformation and linear regression applied to identify differentially methylated probes (DMPs). Finally, estimated blood cell proportions were integrated as confounding variables into the model matrix [27]. As described in the minfi package, the following blood cell types were used as covariates: CD4+, CD8+, natural killer, monocytes, granulocytes, and B-cells. p-values were moderated using the eBayes function in the limma package.

4.3. Probe Selection and Episignature Classifier Construction

The probe selection and episignature classifier construction method is described previously by Levy et al. [11]. To summarize, probe selection parameters were optimized on the cohort size and signal differences to improve the separation between controls and cases using hierarchical clustering and multidimensional scaling (MDS) plots. Parameters used were: a probe score, the area under the receiver’s operating curve (AUC), and a probe-to-probe methylation correlation. First, a probe score was created with the help of multiplying the absolute value of the mean methylation difference by the negative value of the log-transformed Benjamini–Hochberg-adjusted p value. The probes that received the highest scores were selected, and receiver-operating characteristic (ROC) curve analysis was implemented. Next, the Pearson’s correlation coefficients for the selected probes were calculated, and we removed highly correlated probes. Then, we used the final set of selected probes to perform hierarchical clustering with the R package ggplot2 (version 3.1.3). MDS was performed by scaling of the pairwise Euclidean distance between samples. To calculate the robustness of the episignature, we performed twelve rounds of leave-one-out cross-validation. In each round, one JARID2 sample was used for testing, and the remaining samples were used for probe selection. Finally, the R package e1071 (version 1.7-13) was used to train a support vector machine (SVM) classifier and to construct a multiclass prediction model. The SVM was trained against all control samples in the EKD. We used 75% of control samples for training and the other 25% for testing, yielding a prediction score termed the methylation variant pathogenicity (MVP) score. The latter was repeated four times, and an average MVP score was obtained for each sample. This methylation variant pathogenicity (MVP) score predicts the probability that the methylation pattern of a sample matches with the given episignature. Scores closest to one indicate the highest probability.

4.4. Annotation of the Global JARID2 DNA Methylation Profile and Correlation to the 56 Neurodevelopmental Disorder Episignatures on EpiSign™

The annotation of the global JARID2 DNA methylation profile and correlation to the 56 EpiSign™ v3 classifier disorders were based on our previously published methods [10]. To summarize, we produced heatmaps and circos plots to determine the overlapping percentage of DMPs between the JARID2 episignature and the 56 other neurodevelopmental conditions on the EpiSignTM clinical classifier. All DMPs were used in calculating the overlap percentage. Heatmaps were plotted with the R package pheatmap (version 1.0.12), and circos plots with the R package circlize (version 0.4.15) [28]. To find the genomic location of the DMPs, probes were defined in relation to CpG islands (CGIs), and genes with the R package annotate (version 1.76.0) [29], AnnotationHub (version 3.6.0), and hg19_genes_intronexonboundaries. CGI annotations covered CGI shores from 0–2 kb on both side of CGIs, CGI shelves from 2–4 kb on both side of CGIs, and inter-CGI regions encompassing all remaining regions. For gene annotations, promoters included the region up to 1 kb upstream of the transcription start site (TSS), and promoter+ included the region 1–5 kb upstream of the TSS. Annotations to untranslated regions (5′-UTR and 3′-UTR), exons, introns, and exon/intron boundaries were merged into the “gene body” category. P-values were obtained for both annotation categories, genes and CpG islands. We performed clustering analysis on the combined top N DMPs for all the cohorts described earlier by Levy et al. [10] to find relationships between all the cohorts without prejudice due the number of selected DMPs. This rated the top 500 DMPs for each cohort, ranked by p-value. When cohorts had less than 500 DMPs, all the DMPs were used. Finally, the similarities and distance between the cohorts were visualized on a tree-and-leaf plot, which was generated with the R package TreeAndLeaf (version 1.10.0). This plot showed additional information that includes the global mean methylation difference and the total number of DMPs identified in each cohort.

4.5. Differentially Methylated Regions

To find DMRs, we used the R package DMRcate (version 2.12.0) [30]. We only considered regions that contained at least five adjacent significantly different CpGs within 1 kb, with a minimum mean methylation difference of 5% and a Fisher’s multiple comparison p-value < 0.01.

5. Conclusions

In this study, we demonstrated that large multi-gene CNVs including JARID2 exhibit the same DNA methylation episignature as intragenic variants of JARID2. This provides evidence supporting JARID2 as the primary gene responsible for the aberrant DNA pattern in microdeletions of the 6p22–p24 region. We also refined the genomic coordinates for the JARID2 episignature in 6p22–p24 deletions. Furthermore, we conducted comparative functional analyses with 56 other neurodevelopmental conditions, indicating potential interconnections with JARID2. Importantly, the JARID2 episignature can be employed not only for the diagnosis and reclassification of VUS in intragenic JARID2 variants but also for microdeletions involving JARID2 in the 6p22–p24 region.

Supplementary Materials

The following supporting information can be downloaded at: https://www.mdpi.com/article/10.3390/ijms241814240/s1.

Author Contributions

L.v.d.L., K.R., M.M.A.M.M., B.S., M.M.v.H. and P.H. designed the project. L.v.d.L., I.V. and M.A. contributed to the sample collection. L.v.d.L., I.V., L.T., A.L.-A., B.C., N.C., E.A.V., S.M., M.A. and M.M.v.H. contributed to the clinical assessment of participants and laboratory investigations. B.S. oversaw the analytical and bioinformatic aspects of this study. L.v.d.L., K.R., S.H., A.S., R.R. and M.A.L. performed the bioinformatic analysis. L.v.d.L. and K.R. wrote the manuscript. H.M., M.M.A.M.M., M.M.v.H., B.S. and P.H. supervised the project. All authors have read and agreed to the published version of the manuscript.

Funding

Funding for this study is provided in part by the Government of Canada through Genome Canada and the Ontario Genomics Institute (OGI-188).

Institutional Review Board Statement

This study was approved by the Western University Research Ethics Board (REB 106302, 10 August 2020) and the Medical Ethical Committee (METC) of the Amsterdam UMC, location AMC.

Informed Consent Statement

Written informed consent was obtained from all individuals or family members prior to inclusion in this study, including for the use of DNA and clinical information.

Data Availability Statement

The raw DNA methylation data are available on reasonable request.

Acknowledgments

We would like to thank the participants described in this study.

Conflicts of Interest

The authors declare no conflict of interest.

References

  1. Cadieux-Dion, M.; Farrow, E.; Thiffault, I.; Cohen, A.S.A.; Welsh, H.; Bartik, L.; Schwager, C.; Engleman, K.; Zhou, D.; Zhang, L.; et al. Phenotypic expansion and variable expressivity in individuals with JARID2-related intellectual disability: A case series. Clin. Genet. 2022, 102, 136–141. [Google Scholar] [CrossRef]
  2. Verberne, E.A.; Goh, S.; England, J.; van Ginkel, M.; Rafael-Croes, L.; Maas, S.; Polstra, A.; Zarate, Y.A.; Bosanko, K.A.; Pechter, K.B.; et al. JARID2 haploinsufficiency is associated with a clinically distinct neurodevelopmental syndrome. Genet. Med. 2021, 23, 374–383. [Google Scholar] [CrossRef]
  3. Barøy, T.; Misceo, D.; Strømme, P.; Stray-Pedersen, A.; Holmgren, A.; Rødningen, O.K.; Blomhoff, A.; Helle, J.R.; Stormyr, A.; Tvedt, B.; et al. Haploinsufficiency of two histone modifier genes on 6p22.3, ATXN1 and JARID2, is associated with intellectual disability. Orphanet J. Rare Dis. 2013, 8, 3. [Google Scholar] [CrossRef] [PubMed]
  4. Kasinath, V.; Beck, C.; Sauer, P.; Poepsel, S.; Kosmatka, J.; Faini, M.; Toso, D.; Aebersold, R.; Nogales, E. JARID2 and AEBP2 regulate PRC2 in the presence of H2AK119ub1 and other histone modifications. Science 2021, 371, eabc3393. [Google Scholar] [CrossRef] [PubMed]
  5. Pasini, D.; Cloos, P.A.; Walfridsson, J.; Olsson, L.; Bukowski, J.P.; Johansen, J.V.; Bak, M.; Tommerup, N.; Rappsilber, J.; Helin, K. JARID2 regulates binding of the Polycomb repressive complex 2 to target genes in ES cells. Nature 2010, 464, 306–310. [Google Scholar] [CrossRef]
  6. Verberne, E.A.; van der Laan, L.; Haghshenas, S.; Rooney, K.; Levy, M.A.; Alders, M.; Maas, S.M.; Jansen, S.; Lieden, A.; Anderlid, B.-M.; et al. DNA Methylation Signature for JARID2-Neurodevelopmental Syndrome. Int. J. Mol. Sci. 2022, 23, 8001. [Google Scholar] [CrossRef] [PubMed]
  7. van der Laan, L.; Rooney, K.; Trooster, T.M.; Mannens, M.M.; Sadikovic, B.; Henneman, P. DNA methylation episignatures: Insight into copy number variation. Epigenomics 2022, 14, 1373–1388. [Google Scholar] [CrossRef]
  8. Rooney, K.; van der Laan, L.; Trajkova, S.; Haghshenas, S.; Relator, R.; Lauffer, P.; Vos, N.; Levy, M.A.; Brunetti-Pierri, N.; Terrone, G.; et al. DNA methylation episignature and comparative epigenomic profiling of HNRNPU-related neurodevelopmental disorder. Genet. Med. 2023, 25, 100871. [Google Scholar] [CrossRef]
  9. Kent, W.J.; Sugnet, C.W.; Furey, T.S.; Roskin, K.M.; Pringle, T.H.; Zahler, A.M.; Haussler, D. The human genome browser at UCSC. Genome Res. 2002, 12, 996–1006. [Google Scholar] [CrossRef]
  10. Levy, M.A.; Relator, R.; McConkey, H.; Pranckeviciene, E.; Kerkhof, J.; Barat-Houari, M.; Bargiacchi, S.; Biamino, E.; Bralo, M.P.; Cappuccio, G.; et al. Functional correlation of genome-wide DNA methylation profiles in genetic neurodevelopmental disorders. Hum. Mutat. 2022, 43, 1609–1628. [Google Scholar] [CrossRef]
  11. Levy, M.A.; McConkey, H.; Kerkhof, J.; Barat-Houari, M.; Bargiacchi, S.; Biamino, E.; Bralo, M.P.; Cappuccio, G.; Ciolfi, A.; Clarke, A.; et al. Novel diagnostic DNA methylation episignatures expand and refine the epigenetic landscapes of Mendelian disorders. HGG Adv. 2022, 3, 100075. [Google Scholar] [CrossRef]
  12. Austenaa, L.M.I.; Piccolo, V.; Russo, M.; Prosperini, E.; Polletti, S.; Polizzese, D.; Ghisletti, S.; Barozzi, I.; Diaferia, G.R.; Natoli, G. A first exon termination checkpoint preferentially suppresses extragenic transcription. Nat. Struct. Mol. Biol. 2021, 28, 337–346. [Google Scholar] [CrossRef] [PubMed]
  13. Zahir, F.R.; Tucker, T.; Mayo, S.; Brown, C.J.; Lim, E.L.; Taylor, J.; Marra, M.A.; Hamdan, F.F.; Michaud, J.L.; Friedman, J.M. Intragenic CNVs for epigenetic regulatory genes in intellectual disability: Survey identifies pathogenic and benign single exon changes. Am. J. Med. Genet. A 2016, 170, 2916–2926. [Google Scholar] [CrossRef]
  14. Butcher, D.T.; Cytrynbaum, C.; Turinsky, A.L.; Siu, M.T.; Inbar-Feigenberg, M.; Mendoza-Londono, R.; Chitayat, D.; Walker, S.; Machado, J.; Caluseriu, O.; et al. CHARGE and Kabuki Syndromes: Gene-Specific DNA Methylation Signatures Identify Epigenetic Mechanisms Linking These Clinically Overlapping Conditions. Am. J. Hum. Genet. 2017, 100, 773–788. [Google Scholar] [CrossRef] [PubMed]
  15. Cohen, A.S.; Tuysuz, B.; Shen, Y.; Bhalla, S.K.; Jones, S.J.; Gibson, W.T. A novel mutation in EED associated with overgrowth. J. Hum. Genet. 2015, 60, 339–342. [Google Scholar] [CrossRef]
  16. Crawford, M.W.; Rohan, D. The upper airway in Weaver syndrome. Paediatr. Anaesth. 2005, 15, 893–896. [Google Scholar] [CrossRef] [PubMed]
  17. Granadillo, J.L.; Wegner, D.J.; Paul, A.J.; Willing, M.; Sisco, K.; Tedder, M.L.; Sadikovic, B.; Wambach, J.A.; Baldridge, D.; Cole, F.S. Discovery of a novel CHD7 CHARGE syndrome variant by integrated omics analyses. Am. J. Med. Genet. A 2021, 185, 544–548. [Google Scholar] [CrossRef] [PubMed]
  18. Machol, K.; Rousseau, J.; Ehresmann, S.; Garcia, T.; Nguyen, T.T.M.; Spillmann, R.C.; Sullivan, J.A.; Shashi, V.; Jiang, Y.H.; Stong, N.; et al. Expanding the Spectrum of BAF-Related Disorders: De Novo Variants in SMARCC2 Cause a Syndrome with Intellectual Disability and Developmental Delay. Am. J. Hum. Genet. 2019, 104, 164–178. [Google Scholar] [CrossRef] [PubMed]
  19. Hempel, A.; Pagnamenta, A.T.; Blyth, M.; Mansour, S.; McConnell, V.; Kou, I.; Ikegawa, S.; Tsurusaki, Y.; Matsumoto, N.; Lo-Castro, A.; et al. Deletions and de novo mutations of SOX11 are associated with a neurodevelopmental disorder with features of Coffin-Siris syndrome. J. Med. Genet. 2016, 53, 152–162. [Google Scholar] [CrossRef]
  20. Tsang, S.M.; Oliemuller, E.; Howard, B.A. Regulatory roles for SOX11 in development, stem cells and cancer. Semin. Cancer Biol. 2020, 67, 3–11. [Google Scholar] [CrossRef]
  21. Richards, S.; Aziz, N.; Bale, S.; Bick, D.; Das, S.; Gastier-Foster, J.; Grody, W.W.; Hegde, M.; Lyon, E.; Spector, E.; et al. Standards and guidelines for the interpretation of sequence variants: A joint consensus recommendation of the American College of Medical Genetics and Genomics and the Association for Molecular Pathology. Genet. Med. 2015, 17, 405–424. [Google Scholar] [CrossRef] [PubMed]
  22. Riggs, E.R.; Andersen, E.F.; Cherry, A.M.; Kantarci, S.; Kearney, H.; Patel, A.; Raca, G.; Ritter, D.I.; South, S.T.; Thorland, E.C.; et al. Technical standards for the interpretation and reporting of constitutional copy-number variants: A joint consensus recommendation of the American College of Medical Genetics and Genomics (ACMG) and the Clinical Genome Resource (ClinGen). Genet. Med. 2020, 22, 245–257. [Google Scholar] [CrossRef]
  23. Aryee, M.J.; Jaffe, A.E.; Corrada-Bravo, H.; Ladd-Acosta, C.; Feinberg, A.P.; Hansen, K.D.; Irizarry, R.A. Minfi: A flexible and comprehensive Bioconductor package for the analysis of Infinium DNA methylation microarrays. Bioinformatics 2014, 30, 1363–1369. [Google Scholar] [CrossRef] [PubMed]
  24. Aref-Eshghi, E.; Rodenhiser, D.I.; Schenkel, L.C.; Lin, H.; Skinner, C.; Ainsworth, P.; Paré, G.; Hood, R.L.; Bulman, D.E.; Kernohan, K.D.; et al. Genomic DNA Methylation Signatures Enable Concurrent Diagnosis and Clinical Genetic Variant Classification in Neurodevelopmental Syndromes. Am. J. Hum. Genet. 2018, 102, 156–174. [Google Scholar] [CrossRef] [PubMed]
  25. Ho, D.; Imai, K.; King, G.; Stuart, E.A. MatchIt: Nonparametric Preprocessing for Parametric Causal Inference. J. Stat. Softw. 2011, 42, 1–28. [Google Scholar] [CrossRef]
  26. Ritchie, M.E.; Phipson, B.; Wu, D.; Hu, Y.; Law, C.W.; Shi, W.; Smyth, G.K. limma powers differential expression analyses for RNA-sequencing and microarray studies. Nucleic Acids Res. 2015, 43, e47. [Google Scholar] [CrossRef]
  27. Houseman, E.A.; Accomando, W.P.; Koestler, D.C.; Christensen, B.C.; Marsit, C.J.; Nelson, H.H.; Wiencke, J.K.; Kelsey, K.T. DNA methylation arrays as surrogate measures of cell mixture distribution. BMC Bioinform. 2012, 13, 86. [Google Scholar] [CrossRef]
  28. Gu, Z.; Gu, L.; Eils, R.; Schlesner, M.; Brors, B. circlize Implements and enhances circular visualization in R. Bioinformatics 2014, 30, 2811–2812. [Google Scholar] [CrossRef]
  29. Cavalcante, R.G.; Sartor, M.A. annotatr: Genomic regions in context. Bioinformatics 2017, 33, 2381–2383. [Google Scholar] [CrossRef]
  30. Peters, T.J.; Buckley, M.J.; Statham, A.L.; Pidsley, R.; Samaras, K.; Reginald, V.L.; Clark, S.J.; Molloy, P.L. De novo identification of differentially methylated regions in the human genome. Epigenetics Chromatin 2015, 8, 6. [Google Scholar] [CrossRef]
Figure 1. Genomic region of the large multi-gene deletions involving JARID2 in this cohort. Patient 3 had a large deletion including multiple genes, however, including exon 1 of JARID2. Deletions in other cases encompass the entire JARID2 coding sequence. Cytogenetic bands and known genes are presented in this figure using the UCSC genome browser 2009 (GRCH37/hg19) genome build [9].
Ijms 24 14240 g001
Figure 2. Hypomethylated episignature for JARID2-neurodevelopmental syndrome. Including five new and seven previously described cases. (A) Euclidean clustering heatmap of the cases in red and the controls in blue. Rows of the heatmap correspond to the selected probes for the identification of the episignature, and the columns represent the cases and controls. The methylation levels are colored to show the intensity values, with 0 as blue and 1 as red. (B) Two-dimensional multidimensional scaling plot of the patients in red and the controls in blue. The x- and y-axis represent the first and second dimension of the output (Coordinate 1 and 2, respectively). (C) The support vector machine classifier was trained using the discovered signature probes as features to predict class probability of the training cases. We trained the model using the initial training cohort and their controls. Seventy-five percent of the renaming EKD samples with other known disorders and matched episignature were used, as well as unaffected controls. The remaining 25% from the EKD were used as test samples. We performed these four times, so every sample was tested once, and we used the average MVP scores for each test (gray) and training (blue).
Ijms 24 14240 g002
Figure 3. Assessment of the VUSs and the JARID2_negative cases relative to twelve episignature positive cases. (A) We created a Euclidean clustering heatmap of the cases in red, 3 VUS patients in orange, and the controls in blue. Rows of the heatmap correspond to the selected probes for the identification of the episignature, and the columns represent the cases and controls. The methylation levels are colored to show the intensity values, with 0 as blue and 1 as red. (B) Two-dimensional multidimensional scaling plot of the patients in red, 3 VUS patients in orange, JARID_negative cases in purple, and the controls in blue. The x- and y-axis represent the first and second dimension of the output (Coordinate 1 and 2, respectively). The 3 VUS patients in orange and the JARID2_negative case in purple were all clustered with the controls.
Ijms 24 14240 g003
Figure 4. The DMPs shared between the JARID2 (highlighted in red) cohort and the other 56 EpiSignTM disorders with known episignatures. All DMPs were used in calculating the overlap percentage. Heatmap showing the percentage of overlap between probes for each cohort. Colors indicate the percentage of the y-axis cohort’s probes that are also found in the x-axis cohort’s probes.
Ijms 24 14240 g004
Figure 5. Relationship between the JARID2 (highlighted in red) cohort and the 56 other neurodevelopmental conditions on the EpiSignTM clinical classifier. Five hundred most significant DMPs for each signature. (A) Relative mean methylation differences of all DMPs for each cohort sorted by mean methylation. Circles represent unique probes. Red lines indicate mean methylation. (B) Tree-and-leaf visualization of Euclidean clustering of 56 cohorts using the top DMPs for each group. Cohort samples were aggregated using the median value of each probe within a group. A leaf node represents a cohort, with node sizes illustrating relative scales of the number of selected DMPs for the corresponding cohort, and node colors are indicative of the global mean methylation difference.
Ijms 24 14240 g005
Figure 6. The annotated DMPs and DMRs in the context of CpG islands and genes. (A) DMPs annotated in the context of CpG islands and (B) DMPs annotated in the context of genes. (C) DMRs annotated in the context of CpG islands and (D) DMRs annotated in the context of genes.
Ijms 24 14240 g006
Table 1. Molecular and clinical details of our CNV cohort.
Patient #1234Summary of This ReportVerberne et al. (2022) [6] (n = 8)
Variant information
Variant typeDeletion Deletion DeletionDeletion
Variant6p22.3 (14571015_16248244)x16p22.3 (14571015_16381865)x16p22.3–24.2
(11327614_15291611)x1
6p22.3–24.2
(9796651_19501625)x1
Platform WES and confirmed by Array-CGHArray-CGHArray-CGHArray-CGH
Inheritance Not present in their siblings, parents deceaseddndndn
ClassificationLPPPP
General information
Gender M MMM
Age (years)2824710
Clinical information
Development/behavior
Intellectual disability ++++4/4 (100%)6/7 (85.5%)
Developmental delay++++4/4 (100%)8/8 (100%)
Behavior abnormalities++++4/4 (100%)3/8 (37.5%)
Autistic features++++4/4 (100%)4/8 (50%)
ASD diagnosisNo formal ASD diagnosisNo formal ASD diagnosis, autistic traitsNo formal ASD diagnosis+2/4 (50%)2/8 (25%)
Neurologic
Hypotonia++2/4 (50%)2/8 (25%)
Gait disturbance0/4 (0%)2/8 (25%)
MRI abnormalities+1/4 (25%)3/3 (100%)
Dysmorphism
Broad forehead++2/4 (50%)3/8 (37.5%)
High anterior hair line +1/4 (25%)5/8 (62.5%)
Prominent supraorbital ridges+1/4 (25%)1/8 (12.5%)
Deep set eyes+1/4 (25%)4/8 (50%)
Infraorbital dark circles++2/4 (50%)4/8 (50%)
Midface hypoplasia+-+2/4 (50%)1/8 (12.5%)
Depressed nasal bridge-+1/4 (25%)2/8 (25%)
Bulbous nasal tip+++3/4 (75%)3/8 (37.5%)
Short philtrum+1/4 (25%)3/8 (37.5%)
Full lips+++3/4 (75%)2/8 (25%)
Note: M—male, dn—de novo, ASD—autism spectrum disorder, CGH—comparative genomic hybridization.
Disclaimer/Publisher’s Note: The statements, opinions and data contained in all publications are solely those of the individual author(s) and contributor(s) and not of MDPI and/or the editor(s). MDPI and/or the editor(s) disclaim responsibility for any injury to people or property resulting from any ideas, methods, instructions or products referred to in the content.

