
The Effect of Fenugreek in Type 2 Diabetes and Prediabetes: A Systematic Review and Meta-Analysis of Randomized Controlled Trials


Abstract
1. Introduction
2. Materials and Methods
2.1. Data Sources and Searches
2.2. Study Selection
2.3. Data Extraction
2.4. Quality Assessment
2.5. Data Synthesis and Meta-Analysis
3. Results
3.1. Study Selection
3.2. Characteristics of Included Studies
3.3. Effect of Fenugreek Supplementation on Glycemic Control Parameters
3.3.1. Fasting Blood Glucose
3.3.2. 2 h Plasma Glucose during a 75 g Oral Glucose Tolerance Test
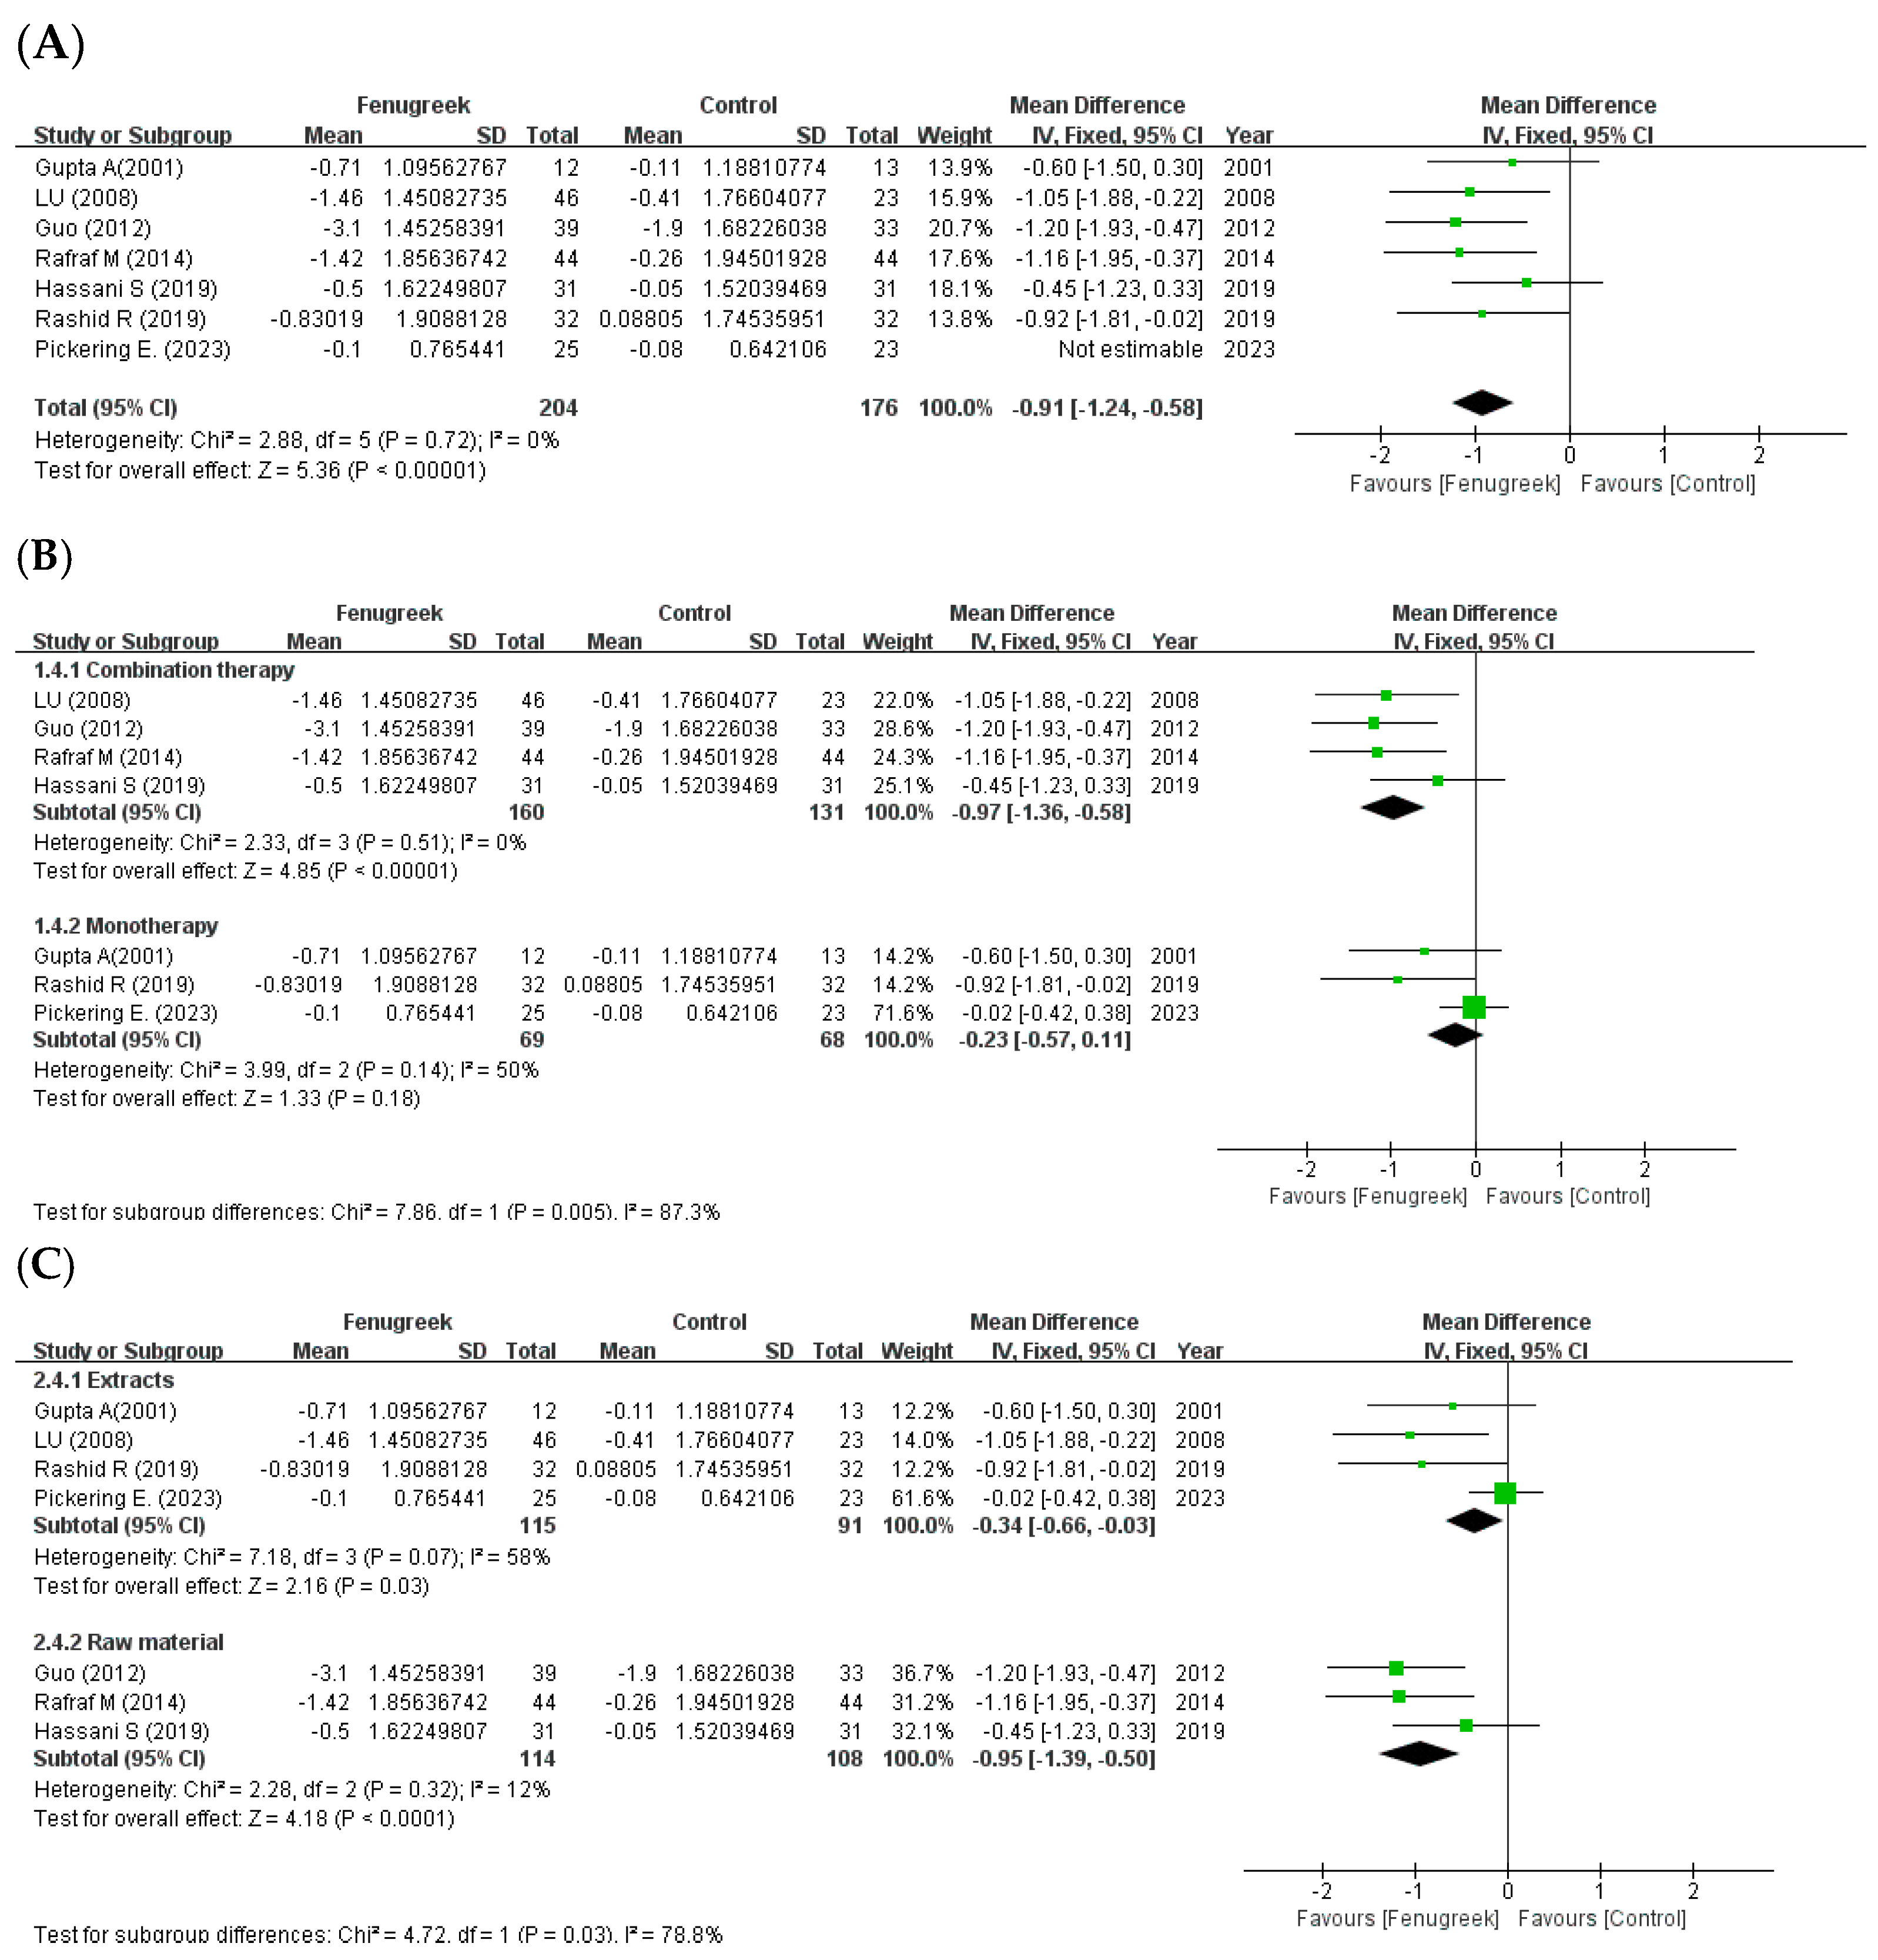
3.3.3. Homeostatic Model Assessment for Insulin Resistance
3.3.4. HbA1c
3.4. Effect of Fenugreek Supplementation on Lipid Proflie and BMI
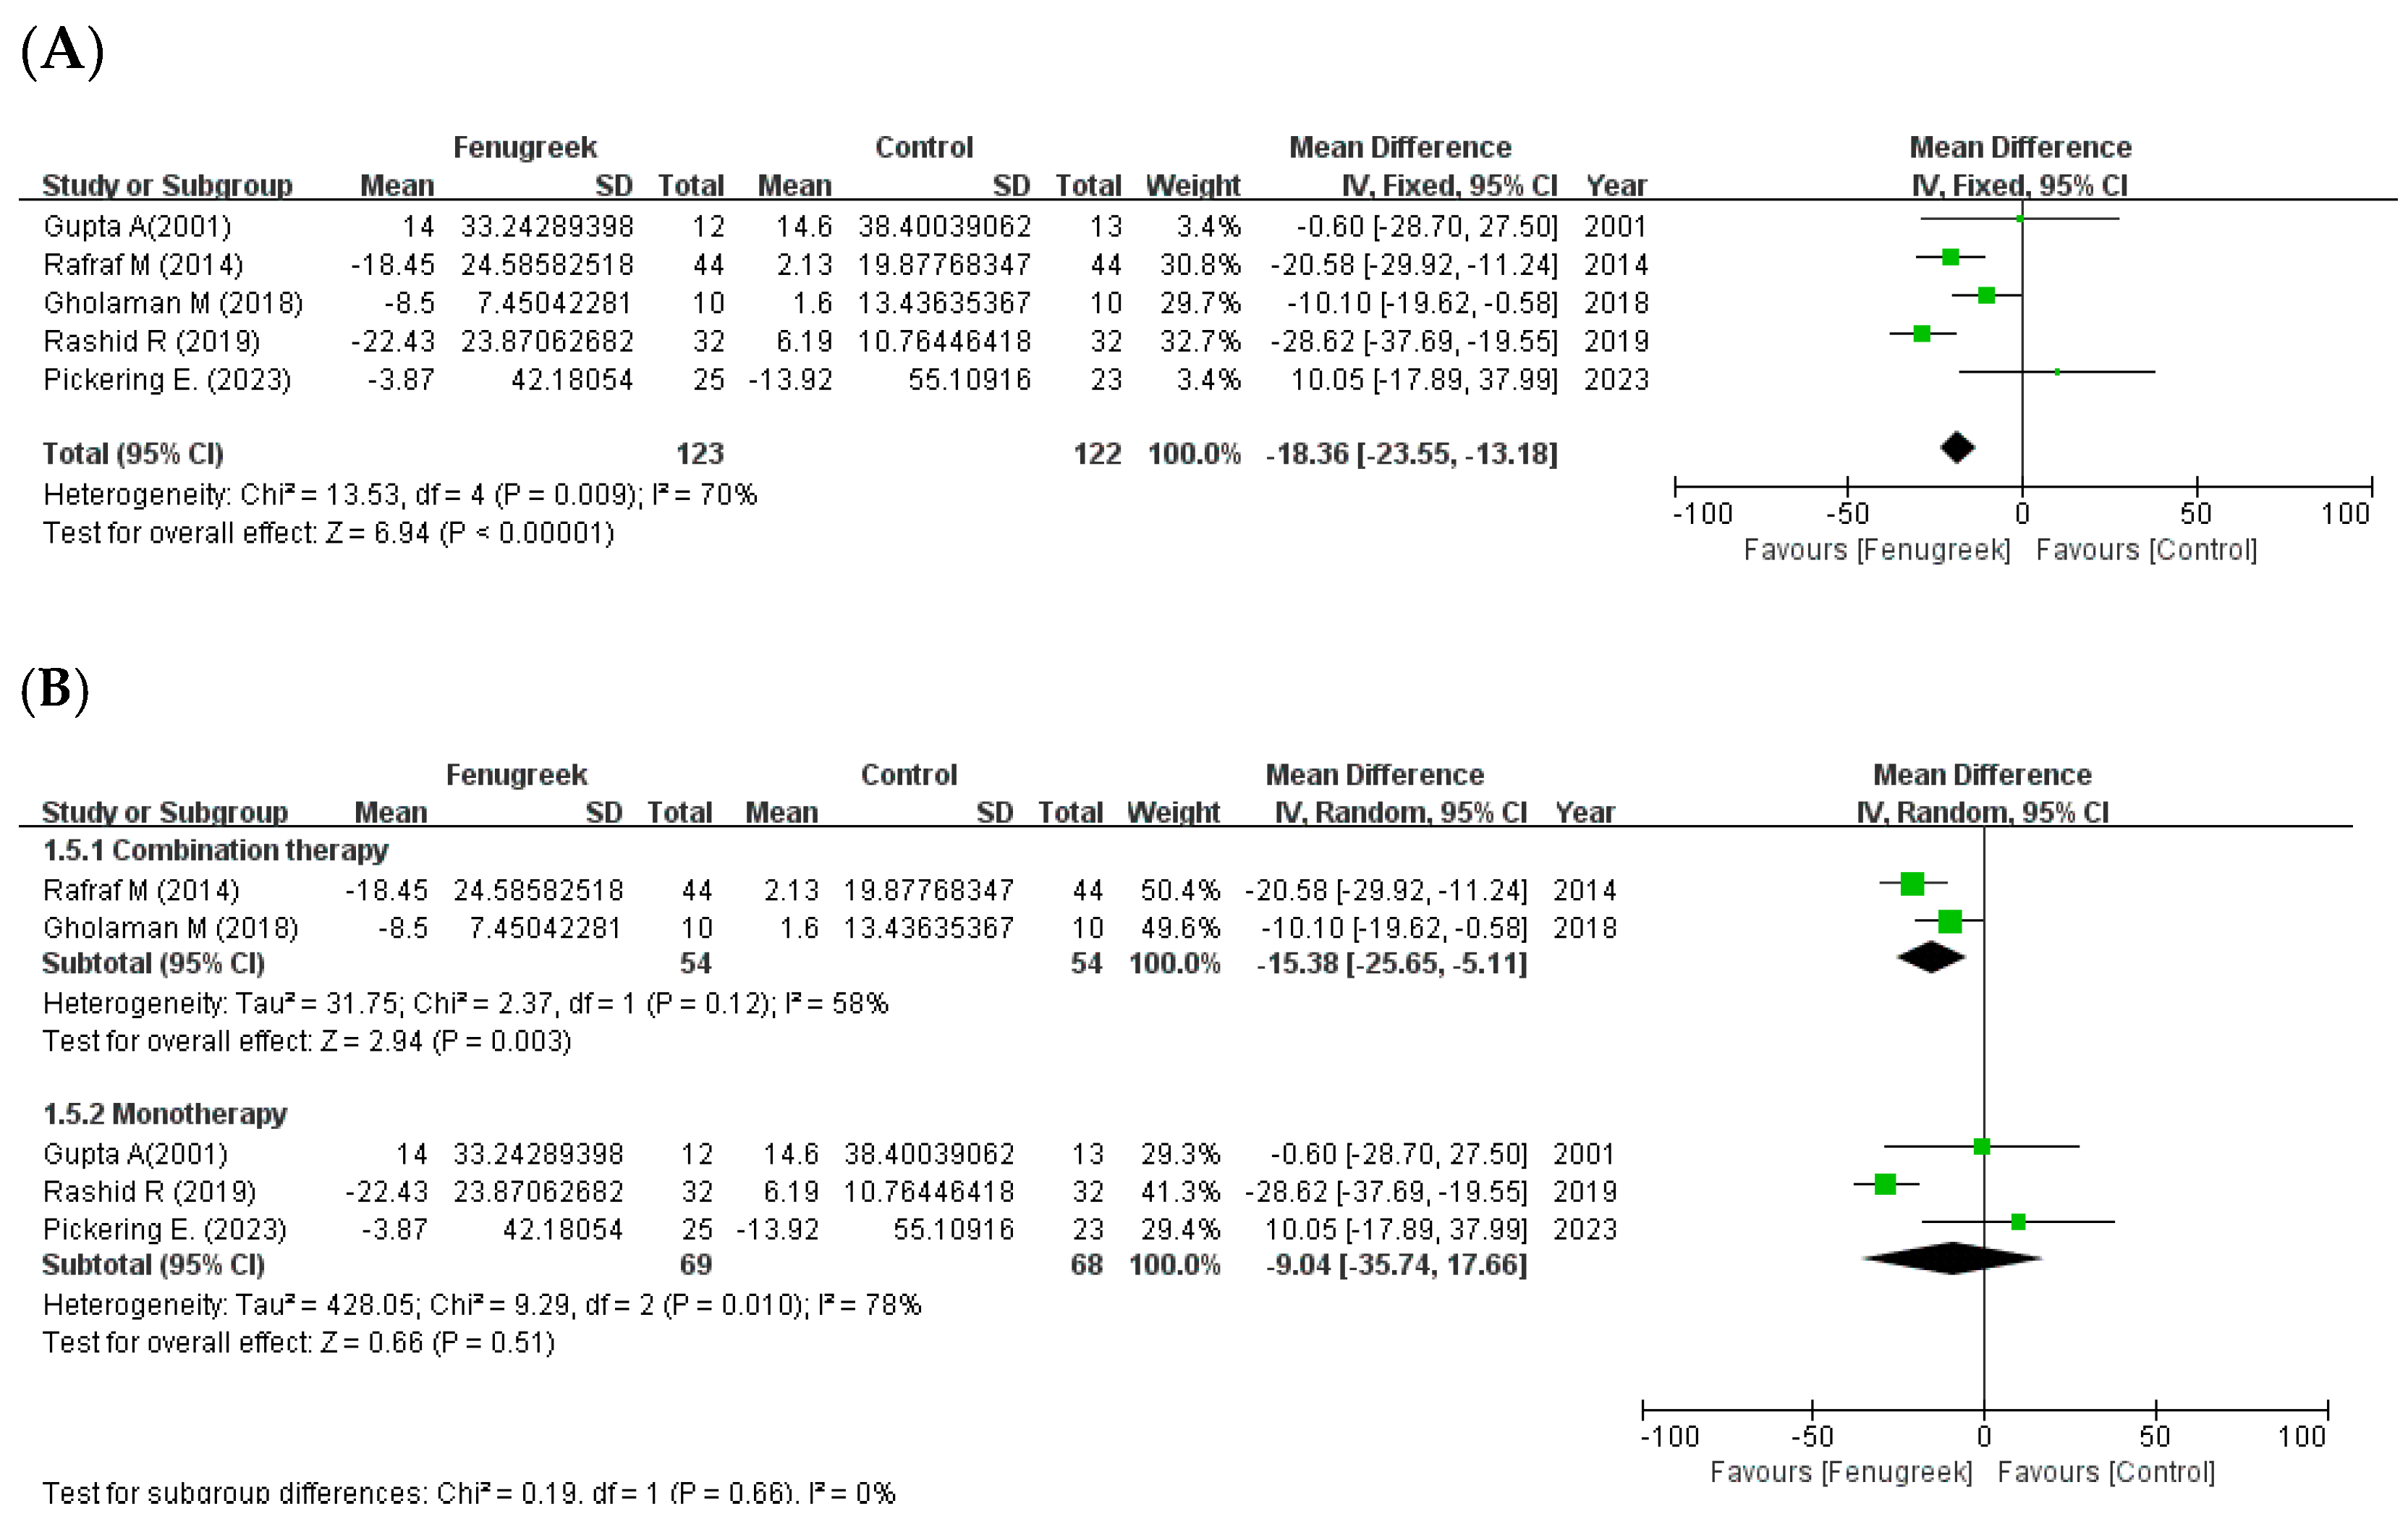
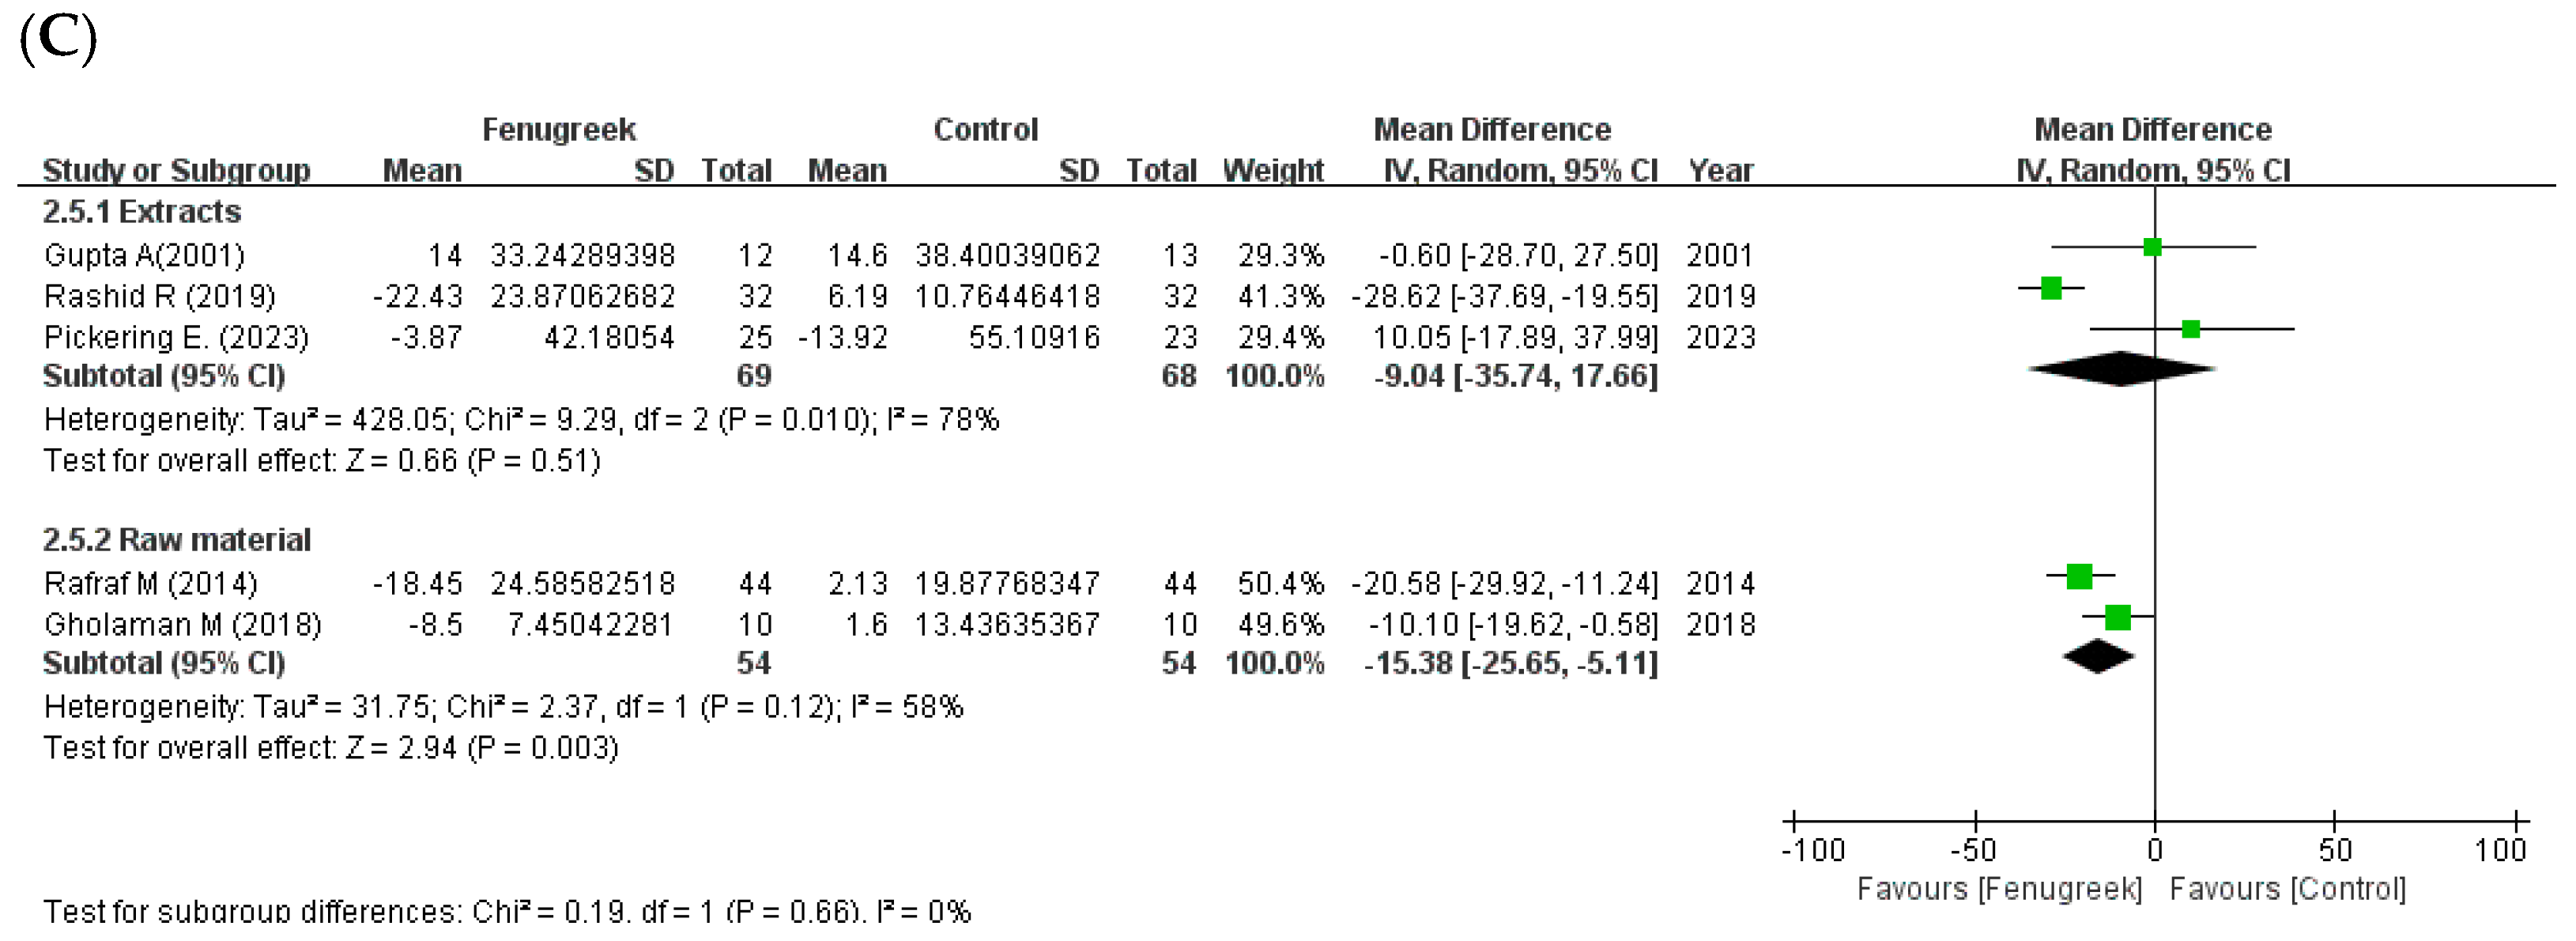
3.4.1. Lipid Profile
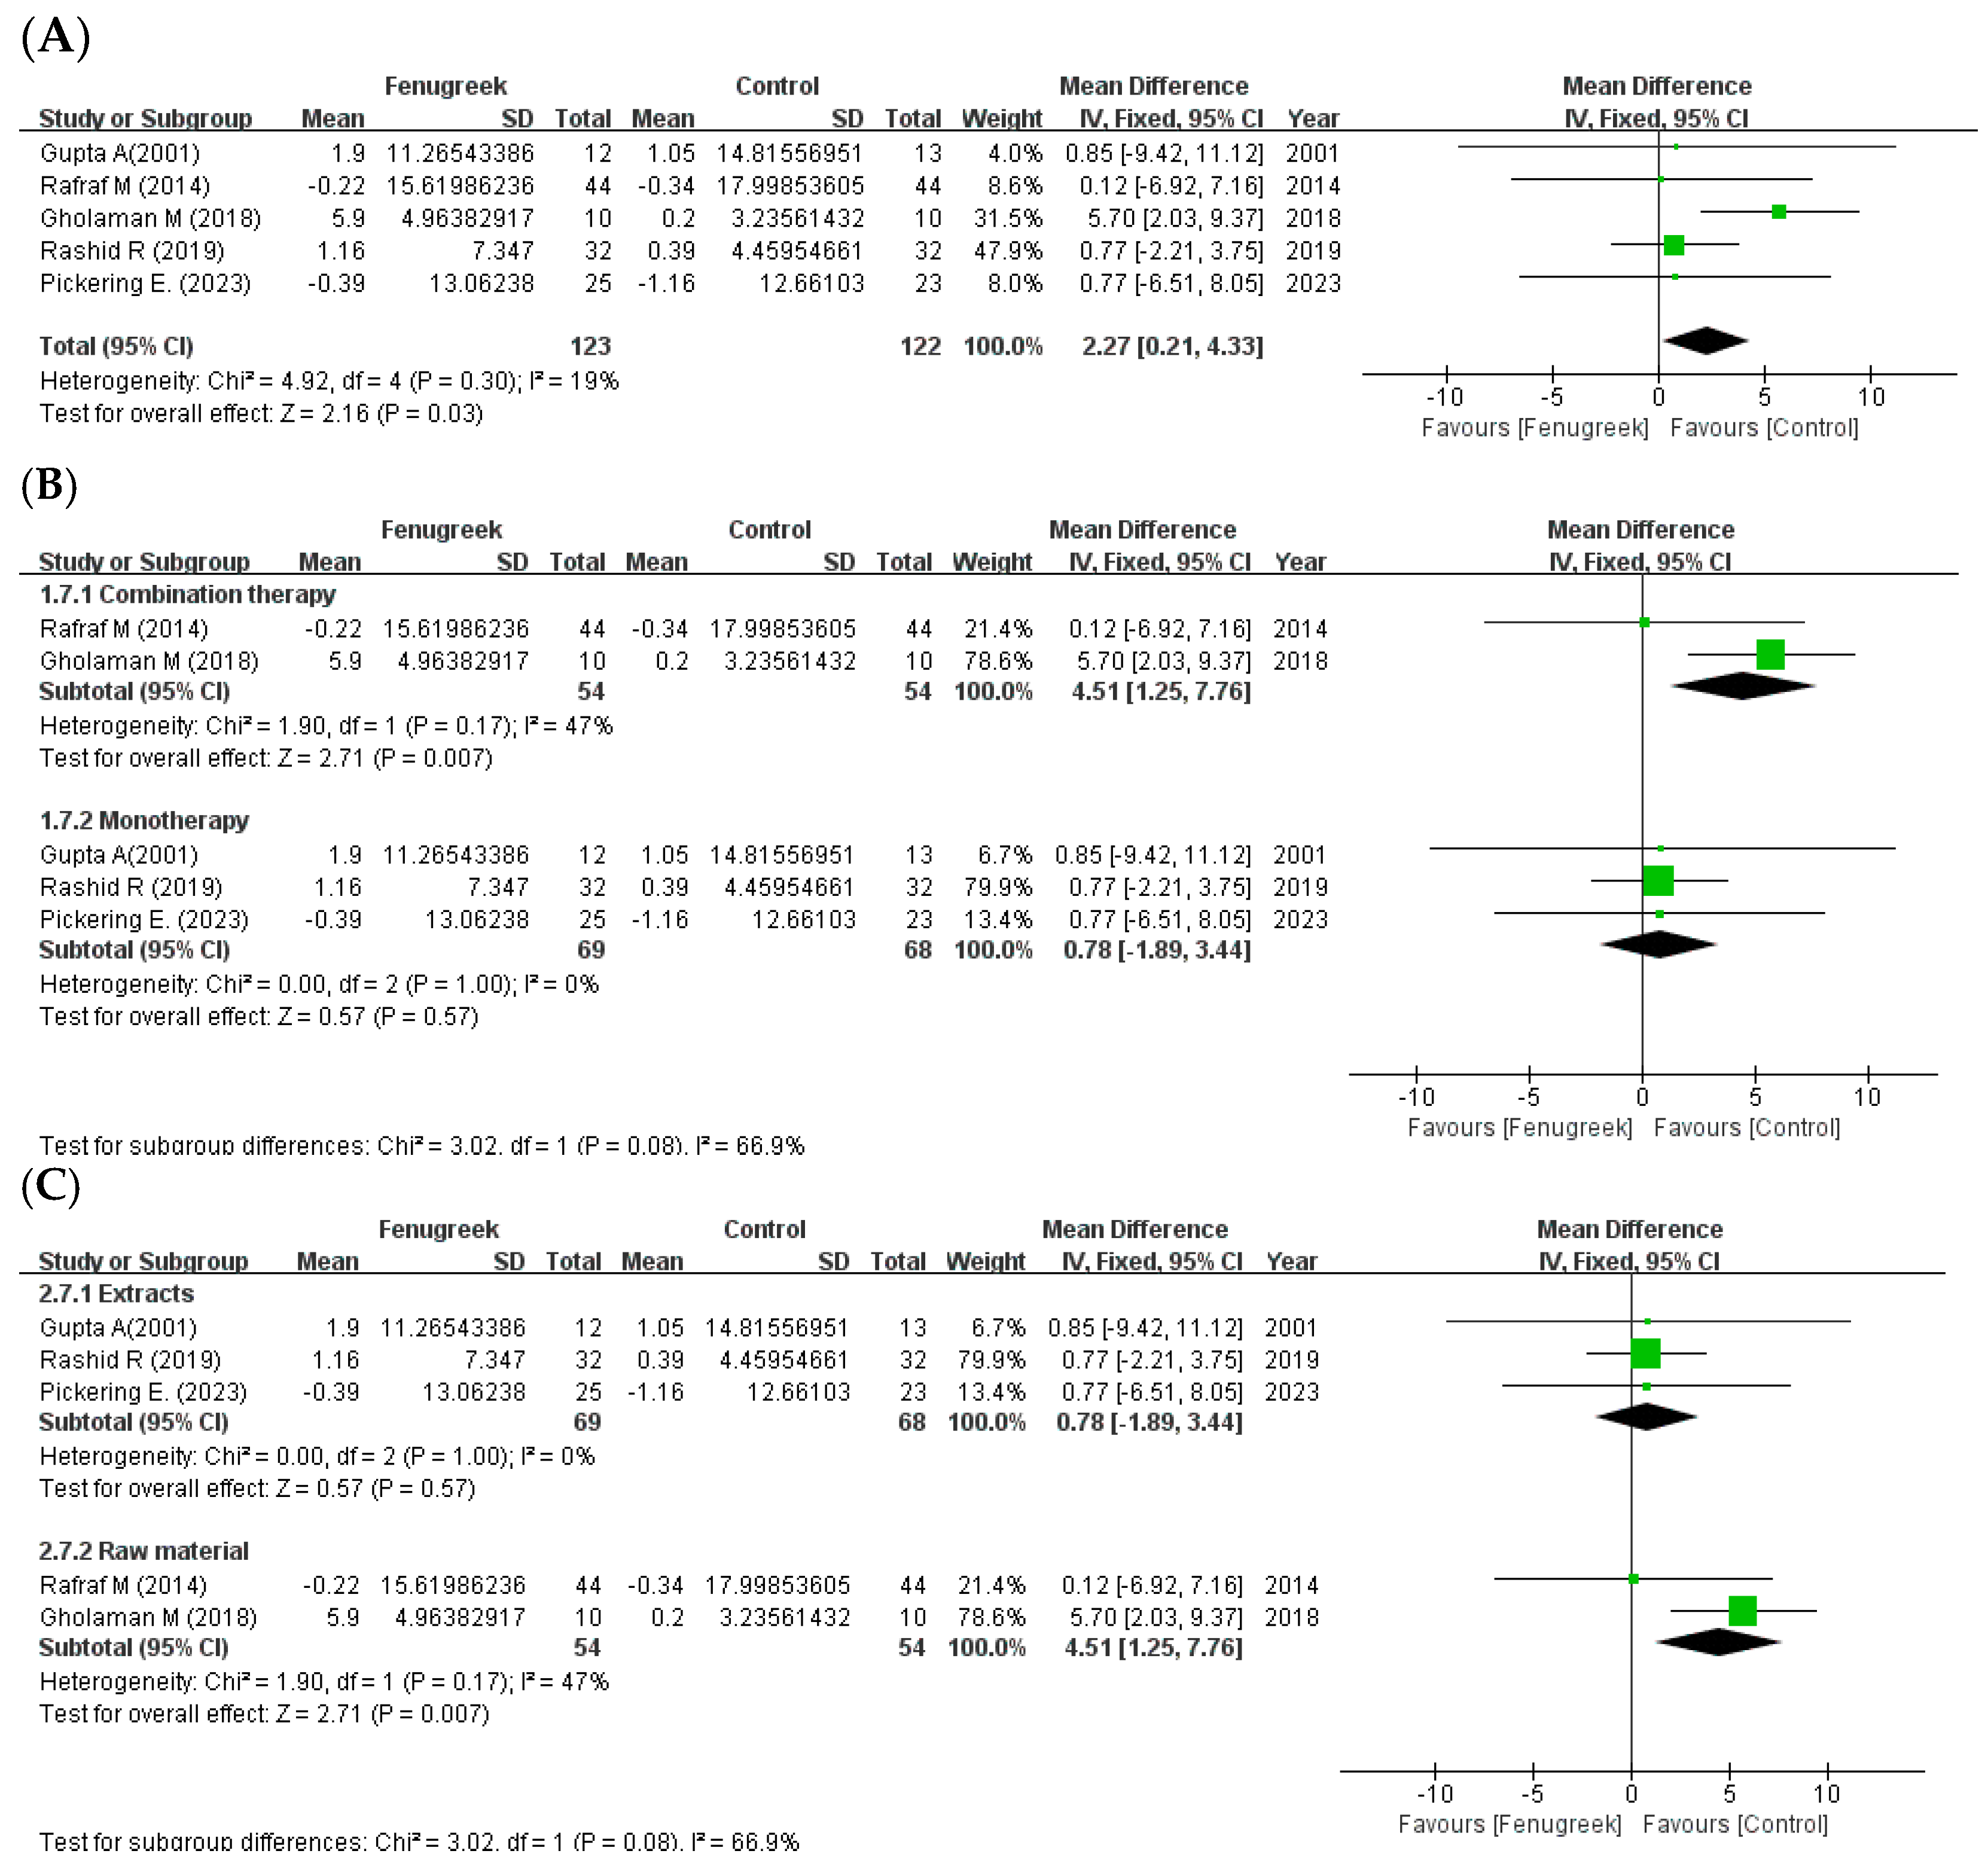
3.4.2. Body Mass Index (BMI)
3.5. Quality Assessment and Publication Bias
3.6. Sensitivity Analysis
4. Discussion
4.1. Principal Findings
4.2. Subgroup Analysis
4.3. Sensitivity Analysis
4.4. Toxicity and Adverse Effect
5. Strengths and Limitations
6. Conclusions
Supplementary Materials
Author Contributions
Funding
Institutional Review Board Statement
Informed Consent Statement
Data Availability Statement
Acknowledgments
Conflicts of Interest
References
- Diabetes Now Affects One in 10 Adults Worldwide. Available online: https://idf.org/news/diabetes-now-affects-one-in-10-adults-worldwide/ (accessed on 6 July 2023).
- AlKurd, R.; Hanash, N.; Khalid, N.; Abdelrahim, D.N.; Khan, M.A.B.; Mahrous, L.; Radwan, H.; Naja, F.; Madkour, M.; Obaideen, K.; et al. Effect of Camel Milk on Glucose Homeostasis in Patients with Diabetes: A Systematic Review and Meta-Analysis of Randomized Controlled Trials. Nutrients 2022, 14, 1245. [Google Scholar] [CrossRef]
- Yang, C.P.; Lin, C.C.; Li, C.I.; Liu, C.S.; Lin, W.Y.; Hwang, K.L.; Yang, S.Y.; Chen, H.J.; Li, T.C. Cardiovascular Risk Factors Increase the Risks of Diabetic Peripheral Neuropathy in Patients With Type 2 Diabetes Mellitus: The Taiwan Diabetes Study. Medicine 2015, 94, e1783. [Google Scholar] [CrossRef] [PubMed]
- Jaiswal, M.; Schinske, A.; Pop-Busui, R. Lipids and lipid management in diabetes. Best Pract. Res. Clin. Endocrinol. Metab. 2014, 28, 325–338. [Google Scholar] [CrossRef]
- Gray, N.; Picone, G.; Sloan, F.; Yashkin, A. Relation between BMI and diabetes mellitus and its complications among US older adults. South. Med. J. 2015, 108, 29–36. [Google Scholar] [CrossRef] [PubMed]
- Leiherer, A.; Mundlein, A.; Drexel, H. Phytochemicals and their impact on adipose tissue inflammation and diabetes. Vasc. Pharmacol. 2013, 58, 3–20. [Google Scholar] [CrossRef] [PubMed]
- Radwan, H.; Hasan, H.; Hamadeh, R.; Hashim, M.; AbdulWahid, Z.; Hassanzadeh Gerashi, M.; Al Hilali, M.; Naja, F. Complementary and alternative medicine use among patients with type 2 diabetes living in the United Arab Emirates. BMC Complement. Med. Ther. 2020, 20, 216. [Google Scholar] [CrossRef] [PubMed]
- Chang, H.-Y.; Wallis, M.; Tiralongo, E. Use of complementary and alternative medicine among people living with diabetes: Literature review. J. Adv. Nurs. 2007, 58, 307–319. [Google Scholar] [CrossRef]
- Birdee, G.S.; Yeh, G. Complementary and Alternative Medicine Therapies for Diabetes: A Clinical Review. Clin. Diabetes 2010, 28, 147–155. [Google Scholar] [CrossRef]
- Yeh, G.Y.; Eisenberg, D.M.; Kaptchuk, T.J.; Phillips, R.S. Systematic review of herbs and dietary supplements for glycemic control in diabetes. Diabetes Care 2003, 26, 1277–1294. [Google Scholar] [CrossRef]
- Rashid, R.; Ahmad, H.; Ahmed, Z.; Rashid, F.; Khalid, N. Clinical investigation to modulate the effect of fenugreek polysaccharides on type-2 diabetes. Bioact. Carbohydr. Diet. Fibre 2019, 19, 100194. [Google Scholar] [CrossRef]
- Singh, A.B.; Tamarkar, A.K.; Shweta; Narender, T.; Srivastava, A.K. Antihyperglycaemic effect of an unusual amino acid (4-hydroxyisoleucine) in C57BL/KsJ-db/db mice. Nat. Prod. Res. 2010, 24, 258–265. [Google Scholar] [CrossRef] [PubMed]
- Kumar, M.; Verma, M.K.; Ranjan, R.; Kumar, N.; Ramanarayanan, S. Bioactive effects and safety profiles of fenugreek (Trigonella foenum-graecum L.) for pharmaceutical and medicinal applications. Pharma Innov. 2021, SP-10, 912–919. [Google Scholar]
- Wang, E.; Wylie-Rosett, J. Review of selected Chinese herbal medicines in the treatment of type 2 diabetes. Diabetes Educ. 2008, 34, 645–654. [Google Scholar] [CrossRef]
- Saxena, A.; Vikram, N.K. Role of selected Indian plants in management of type 2 diabetes: A review. J. Altern. Complement. Med. 2004, 10, 369–378. [Google Scholar] [CrossRef] [PubMed]
- John, L.J.; Shantakumari, N. Herbal Medicines Use During Pregnancy: A Review from the Middle East. Oman Med. J. 2015, 30, 229–236. [Google Scholar] [CrossRef] [PubMed]
- Taylor, W.G.; Zulyniak, H.J.; Richards, K.W.; Acharya, S.N.; Bittman, S.; Elder, J.L. Variation in diosgenin levels among 10 accessions of fenugreek seeds produced in western Canada. J. Agric. Food Chem. 2002, 50, 5994–5997. [Google Scholar] [CrossRef]
- Demmers, A.; Korthout, H.; van Etten-Jamaludin, F.S.; Kortekaas, F.; Maaskant, J.M. Effects of medicinal food plants on impaired glucose tolerance: A systematic review of randomized controlled trials. Diabetes Res. Clin. Pract. 2017, 131, 91–106. [Google Scholar] [CrossRef]
- Heshmat-Ghahdarijani, K.; Mashayekhiasl, N.; Amerizadeh, A.; Teimouri Jervekani, Z.; Sadeghi, M. Effect of fenugreek consumption on serum lipid profile: A systematic review and meta-analysis. Phytother. Res. 2020, 34, 2230–2245. [Google Scholar] [CrossRef]
- Gong, J.; Fang, K.; Dong, H.; Wang, D.; Hu, M.; Lu, F. Effect of fenugreek on hyperglycaemia and hyperlipidemia in diabetes and prediabetes: A meta-analysis. J. Ethnopharmacol. 2016, 194, 260–268. [Google Scholar] [CrossRef]
- Page, M.J.; McKenzie, J.E.; Bossuyt, P.M.; Boutron, I.; Hoffmann, T.C.; Mulrow, C.D.; Shamseer, L.; Tetzlaff, J.M.; Akl, E.A.; Brennan, S.E.; et al. The PRISMA 2020 statement: An updated guideline for reporting systematic reviews. BMJ 2021, 372, n71. [Google Scholar] [CrossRef]
- KFDA Notification No. 2020-73; The Korean Herbal. Pharmacopoeia; Ministry of Korean Food and Drug Safety: Cheongju-si, Republic of Korea, 2020.
- Commission of Chinese Pharmacopoeia. Pharmacopoeia of the People's Republic of China; China Medical Science Press: Beijing, China, 2015. [Google Scholar]
- Understanding A1C. Available online: https://diabetes.org/diabetes/a1c/diagnosis (accessed on 3 September 2023).
- Follmann, D.; Elliott, P.; Suh, I.; Cutler, J. Variance imputation for overviews of clinical trials with continuous response. J. Clin. Epidemiol. 1992, 45, 769–773. [Google Scholar] [CrossRef] [PubMed]
- Higgins, J.P.T.; Thomas, J.; Chandler, J.; Cumpston, M.; Li, T.; Page, M.J.; Welch, V.A. Cochrane Handbook for Systematic Reviews of Interventions Version 6.3. Available online: www.training.cochrane.org/handbook (accessed on 9 September 2022).
- Bowden, J.; Tierney, J.F.; Copas, A.J.; Burdett, S. Quantifying, displaying and accounting for heterogeneity in the meta-analysis of RCTs using standard and generalised Qstatistics. BMC Med. Res. Methodol. 2011, 11, 41. [Google Scholar] [CrossRef] [PubMed]
- Pickering, E.; Steels, E.; Rao, A.; Steadman, K.J. An Exploratory Study of the Safety and Efficacy of a Trigonella foenum-graecum Seed Extract in Early Glucose Dysregulation: A Double-Blind Randomized Placebo-Controlled Trial. Pharmaceutics 2022, 14, 2453. [Google Scholar] [CrossRef] [PubMed]
- Gholaman, M.; Gholami, M. Effect of Eight Weeks’ Endurance Training along with Fenugreek Ingestion on Lipid Profile, Body Composition, Insulin Resistance and VO2max in Obese Women’s with Type2 Diabetes. J. Med. Plants 2018, 17, 83–92. [Google Scholar]
- Hassani, S.S.; Fallahi, A.; Esmaeili, S.S.; Gholami Fesharaki, M. The Effect of Combined Therapy with Fenugreek and Nutrition Training Based on Iranian Traditional Medicine on FBS, HgA1c, BMI, and Waist Circumference in Type 2 Diabetic Patients: A Randomized Double Blinded Clinical Trial. J. Adv. Med. Biomed. Res. 2019, 27, 37–42. [Google Scholar] [CrossRef]
- Gupta, A.; Gupta, R.; Lal, B. Effect of Trigonella foenum-graecum (Fenugreek) Seeds on Glycaemic Control and Insulin Resistance in Type 2 Diabetes Mellitus: A Double Blind Placebo Controlled Study. J. Assoc. Physicians India 2001, 49, 1057–1061. [Google Scholar]
- Lu, F.R.; Shen, L.; Qin, Y.; Gao, L.; Li, H.; Dai, Y. Clinical observation on Trigonella foenum-graecum L. total saponins in combination with sulfonylureas in the treatment of type 2 diabetes mellitus. Chin. J. Integr. Med. 2008, 14, 56–60. [Google Scholar] [CrossRef]
- Verma, N.; Usman, K.; Patel, N.; Jain, A.; Dhakre, S.; Swaroop, A.; Bagchi, M.; Kumar, P.; Preuss, H.G.; Bagchi, D. A multicenter clinical study to determine the efficacy of a novel fenugreek seed (Trigonella foenum-graecum) extract (Fenfuro) in patients with type 2 diabetes. Food Nutr. Res. 2016, 60, 32382. [Google Scholar] [CrossRef]
- Guo Cheng-kun, Z.Q. Trigonella foenum graecum combined with valsartan in treatment of diabetic nephropathy. Chin. J. Difficult Complicat. Cases 2012, 11, 191–193. [Google Scholar]
- Rafraf, M.; Malekiyan, M.; Asghari-Jafarabadi, M.; Aliasgarzadeh, A. Effect of Fenugreek Seeds on Serum Metabolic Factors and Adiponectin Levels in Type 2 Diabetic Patients. Int. J. Vitam. Nutr. Res. 2014, 84, 196–205. [Google Scholar] [CrossRef]
- Hadi, A.; Arab, A.; Hajianfar, H.; Talaei, B.; Miraghajani, M.; Babajafari, S.; Marx, W.; Tavakoly, R. The effect of fenugreek seed supplementation on serum irisin levels, blood pressure, and liver and kidney function in patients with type 2 diabetes mellitus: A parallel randomized clinical trial. Complement. Ther. Med. 2020, 49, 102315. [Google Scholar] [CrossRef] [PubMed]
- Khalili, D.; Khayamzadeh, M.; Kohansal, K.; Ahanchi, N.S.; Hasheminia, M.; Hadaegh, F.; Tohidi, M.; Azizi, F.; Habibi-Moeini, A.S. Are HOMA-IR and HOMA-B good predictors for diabetes and pre-diabetes subtypes? BMC Endocr. Disord. 2023, 23, 39. [Google Scholar] [CrossRef] [PubMed]
- Fuller, S.; Stephens, J.M. Diosgenin, 4-hydroxyisoleucine, and fiber from fenugreek: Mechanisms of actions and potential effects on metabolic syndrome. Adv. Nutr. 2015, 6, 189–197. [Google Scholar] [CrossRef] [PubMed]
- Wilcox, G. Insulin and Insulin Resistance. Clin. Biochem. Rev. 2005, 26, 19–39. [Google Scholar] [PubMed]
- Gayoso-Diz, P.; Otero-Gonzalex, A.; Rodriguez-Alvarez, M.X.; Gude, F.; Cadarso-Suarez, C.; García, F.; De Francisco, A. Insulin resistance index (HOMA-IR) levels in a general adult population: Curves percentile by gender and age. The EPIRCE study. Diabetes Res. Clin. Pract. 2011, 94, 146–155. [Google Scholar] [CrossRef]
- Horakova, D.; Stepanek, L.; Janout, V.; Janoutova, J.; Pastucha, D.; Kollarova, H.; Petrakova, A.; Stepanek, L.; Husar, R.; Martinik, K. Optimal Homeostasis Model Assessment of Insulin Resistance (HOMA-IR) Cut-Offs: A Cross-Sectional Study in the Czech Population. Medicina 2019, 55, 158. [Google Scholar] [CrossRef]
- Yokoyama, H.; Emoto, M.; Fujiwara, S.; Motoyama, K.; Morioka, T.; Komatsu, M.; Tahara, H.; Koyama, H.; Shoji, T.; Inaba, M.; et al. Quantitative insulin sensitivity check index and the reciprocal index of homeostasis model assessment are useful indexes of insulin resistance in type 2 diabetic patients with wide range of fasting plasma glucose. J. Clin. Endocrinol. Metab. 2004, 89, 1481–1484. [Google Scholar] [CrossRef]
- Vladu, I.M.; Fortofoiu, M.; Clenciu, D.; Fortofoiu, M.C.; Padureanu, R.; Radu, L.; Cojan, S.T.T.; Radulescu, P.M.; Padureanu, V. Insulin resistance quantified by the value of HOMA-IR and cardiovascular risk in patients with type 2 diabetes. Exp. Ther. Med. 2022, 23, 73. [Google Scholar] [CrossRef]
- Diniz, M.D.F.H.S.; Beleigoli, A.M.R.; Schmidt, M.I.; Duncan, B.B.; Ribeiro, A.L.P.; Vidigal, P.G.; Benseñor, I.M.; Lotufo, P.A.; Santos, I.S.; Griep, R.H.; et al. Homeostasis model assessment of insulin resistance (HOMA-IR) and metabolic syndrome at baseline of a multicentric Brazilian cohort: ELSA-Brasil study. Cad. Saúde Pública 2020, 36, e00072120. [Google Scholar] [CrossRef]
- Tahapary, D.L.; Pratisthita, L.B.; Fitri, N.A.; Marcella, C.; Wafa, S.; Kurniawan, F.; Rizka, A.; Tarigan, T.J.E.; Harbuwono, D.S.; Purnamasari, D.; et al. Challenges in the diagnosis of insulin resistance: Focusing on the role of HOMA-IR and Tryglyceride/glucose index. Diabetes Metab. Syndr. 2022, 16, 102581. [Google Scholar] [CrossRef]
- Mohammadi, A.; Gholamhosseinian, A.; Fallah, H. Trigonella foenum-graecum water extract improves insulin sensitivity and stimulates PPAR and gamma gene expression in high fructose-fed insulin-resistant rats. Adv. Biomed. Res. 2016, 5, 54. [Google Scholar] [CrossRef]
- Gaddam, A.; Galla, C.; Thummisetti, S.; Marikanty, R.K.; Palanisamy, U.D.; Rao, P.V. Role of Fenugreek in the prevention of type 2 diabetes mellitus in prediabetes. J. Diabetes Metab. Disord. 2015, 14, 74. [Google Scholar] [CrossRef] [PubMed]
- Geberemeskel, G.A.; Debebe, Y.G.; Nguse, N.A. Antidiabetic Effect of Fenugreek Seed Powder Solution (Trigonella foenum-graecum L.) on Hyperlipidemia in Diabetic Patients. J. Diabetes Res. 2019, 2019, 8507453. [Google Scholar] [CrossRef] [PubMed]
- Jialal, I.; Singh, G. Management of diabetic dyslipidemia: An update. World J. Diabetes 2019, 10, 280–290. [Google Scholar] [CrossRef] [PubMed]
- Ormazabal, V.; Nair, S.; Elfeky, O.; Aguayo, C.; Salomon, C.; Zuniga, F.A. Association between insulin resistance and the development of cardiovascular disease. Cardiovasc. Diabetol. 2018, 17, 122. [Google Scholar] [CrossRef]
- Austin, M.A.; King, M.C.; Vranizan, K.M.; Krauss, R.M. Atherogenic lipoprotein phenotype. A proposed genetic marker for coronary heart disease risk. Circulation 1990, 82, 495–506. [Google Scholar] [CrossRef]
- Khera, A.V.; Cuchel, M.; de la Llera-Moya, M.; Rodrigues, A.; Burke, M.F.; Jafri, K.; French, B.C.; Phillips, J.A.; Mucksavage, M.L.; Wilensky, R.L.; et al. Cholesterol efflux capacity, high-density lipoprotein function, and atherosclerosis. N. Engl. J. Med. 2011, 364, 127–135. [Google Scholar] [CrossRef]
- Nuttall, F.Q. Body Mass Index: Obesity, BMI, and Health: A Critical Review. Nutr. Today 2015, 50, 117–128. [Google Scholar] [CrossRef]
- Roberts, K.T. The potential of fenugreek (Trigonella foenum-graecum) as a functional food and nutraceutical and its effects on glycemia and lipidemia. J. Med. Food 2011, 14, 1485–1489. [Google Scholar] [CrossRef]
- Khodamoradi, K.; Khosropanah, M.H.; Ayati, Z.; Chang, D.; Nasli-Esfahani, E.; Ayati, M.H.; Namazi, N. The Effects of Fenugreek on Cardiometabolic Risk Factors in Adults: A Systematic Review and Meta-analysis. Complement. Ther. Med. 2020, 52, 102416. [Google Scholar] [CrossRef]
- Nathan, D.M.; Turgeon, H.; Regan, S. Relationship between glycated haemoglobin levels and mean glucose levels over time. Diabetologia 2007, 50, 2239–2244. [Google Scholar] [CrossRef] [PubMed]
- Chakarova, N.; Dimova, R.; Grozeva, G.; Tankova, T. Assessment of glucose variability in subjects with prediabetes. Diabetes Res. Clin. Pract. 2019, 151, 56–64. [Google Scholar] [CrossRef] [PubMed]
- Yibirin, M.; De Oliveira, D.; Valera, R.; Plitt, A.E.; Lutgen, S. Adverse Effects Associated with Proton Pump Inhibitor Use. Cureus 2021, 13, e12759. [Google Scholar] [CrossRef] [PubMed]
- Mowla, A.; Alauddin, M.; Rahman, M.A.; Ahmed, K. Antihyperglycemic Effect of Trigonella foenum-graecum (Fenugreek) Seed Extract in Alloxan-Induced Diabetic Rats and Its Use in Diabetes Mellitus: A Brief Qualitative Phytochemical and Acute Toxicity Test on the Extract. Afr. J. Tradit. Complement. Altern. Med. 2009, 6, 255–261. [Google Scholar] [CrossRef]
- Kandhare, A.D.; Thakurdesai, P.A.; Wangikar, P.; Bodhankar, S.L. A systematic literature review of fenugreek seed toxicity by using ToxRTool: Evidence from preclinical and clinical studies. Heliyon 2019, 5, e01536. [Google Scholar] [CrossRef]
- Verges, B. Pathophysiology of diabetic dyslipidaemia: Where are we? Diabetologia 2015, 58, 886–899. [Google Scholar] [CrossRef]

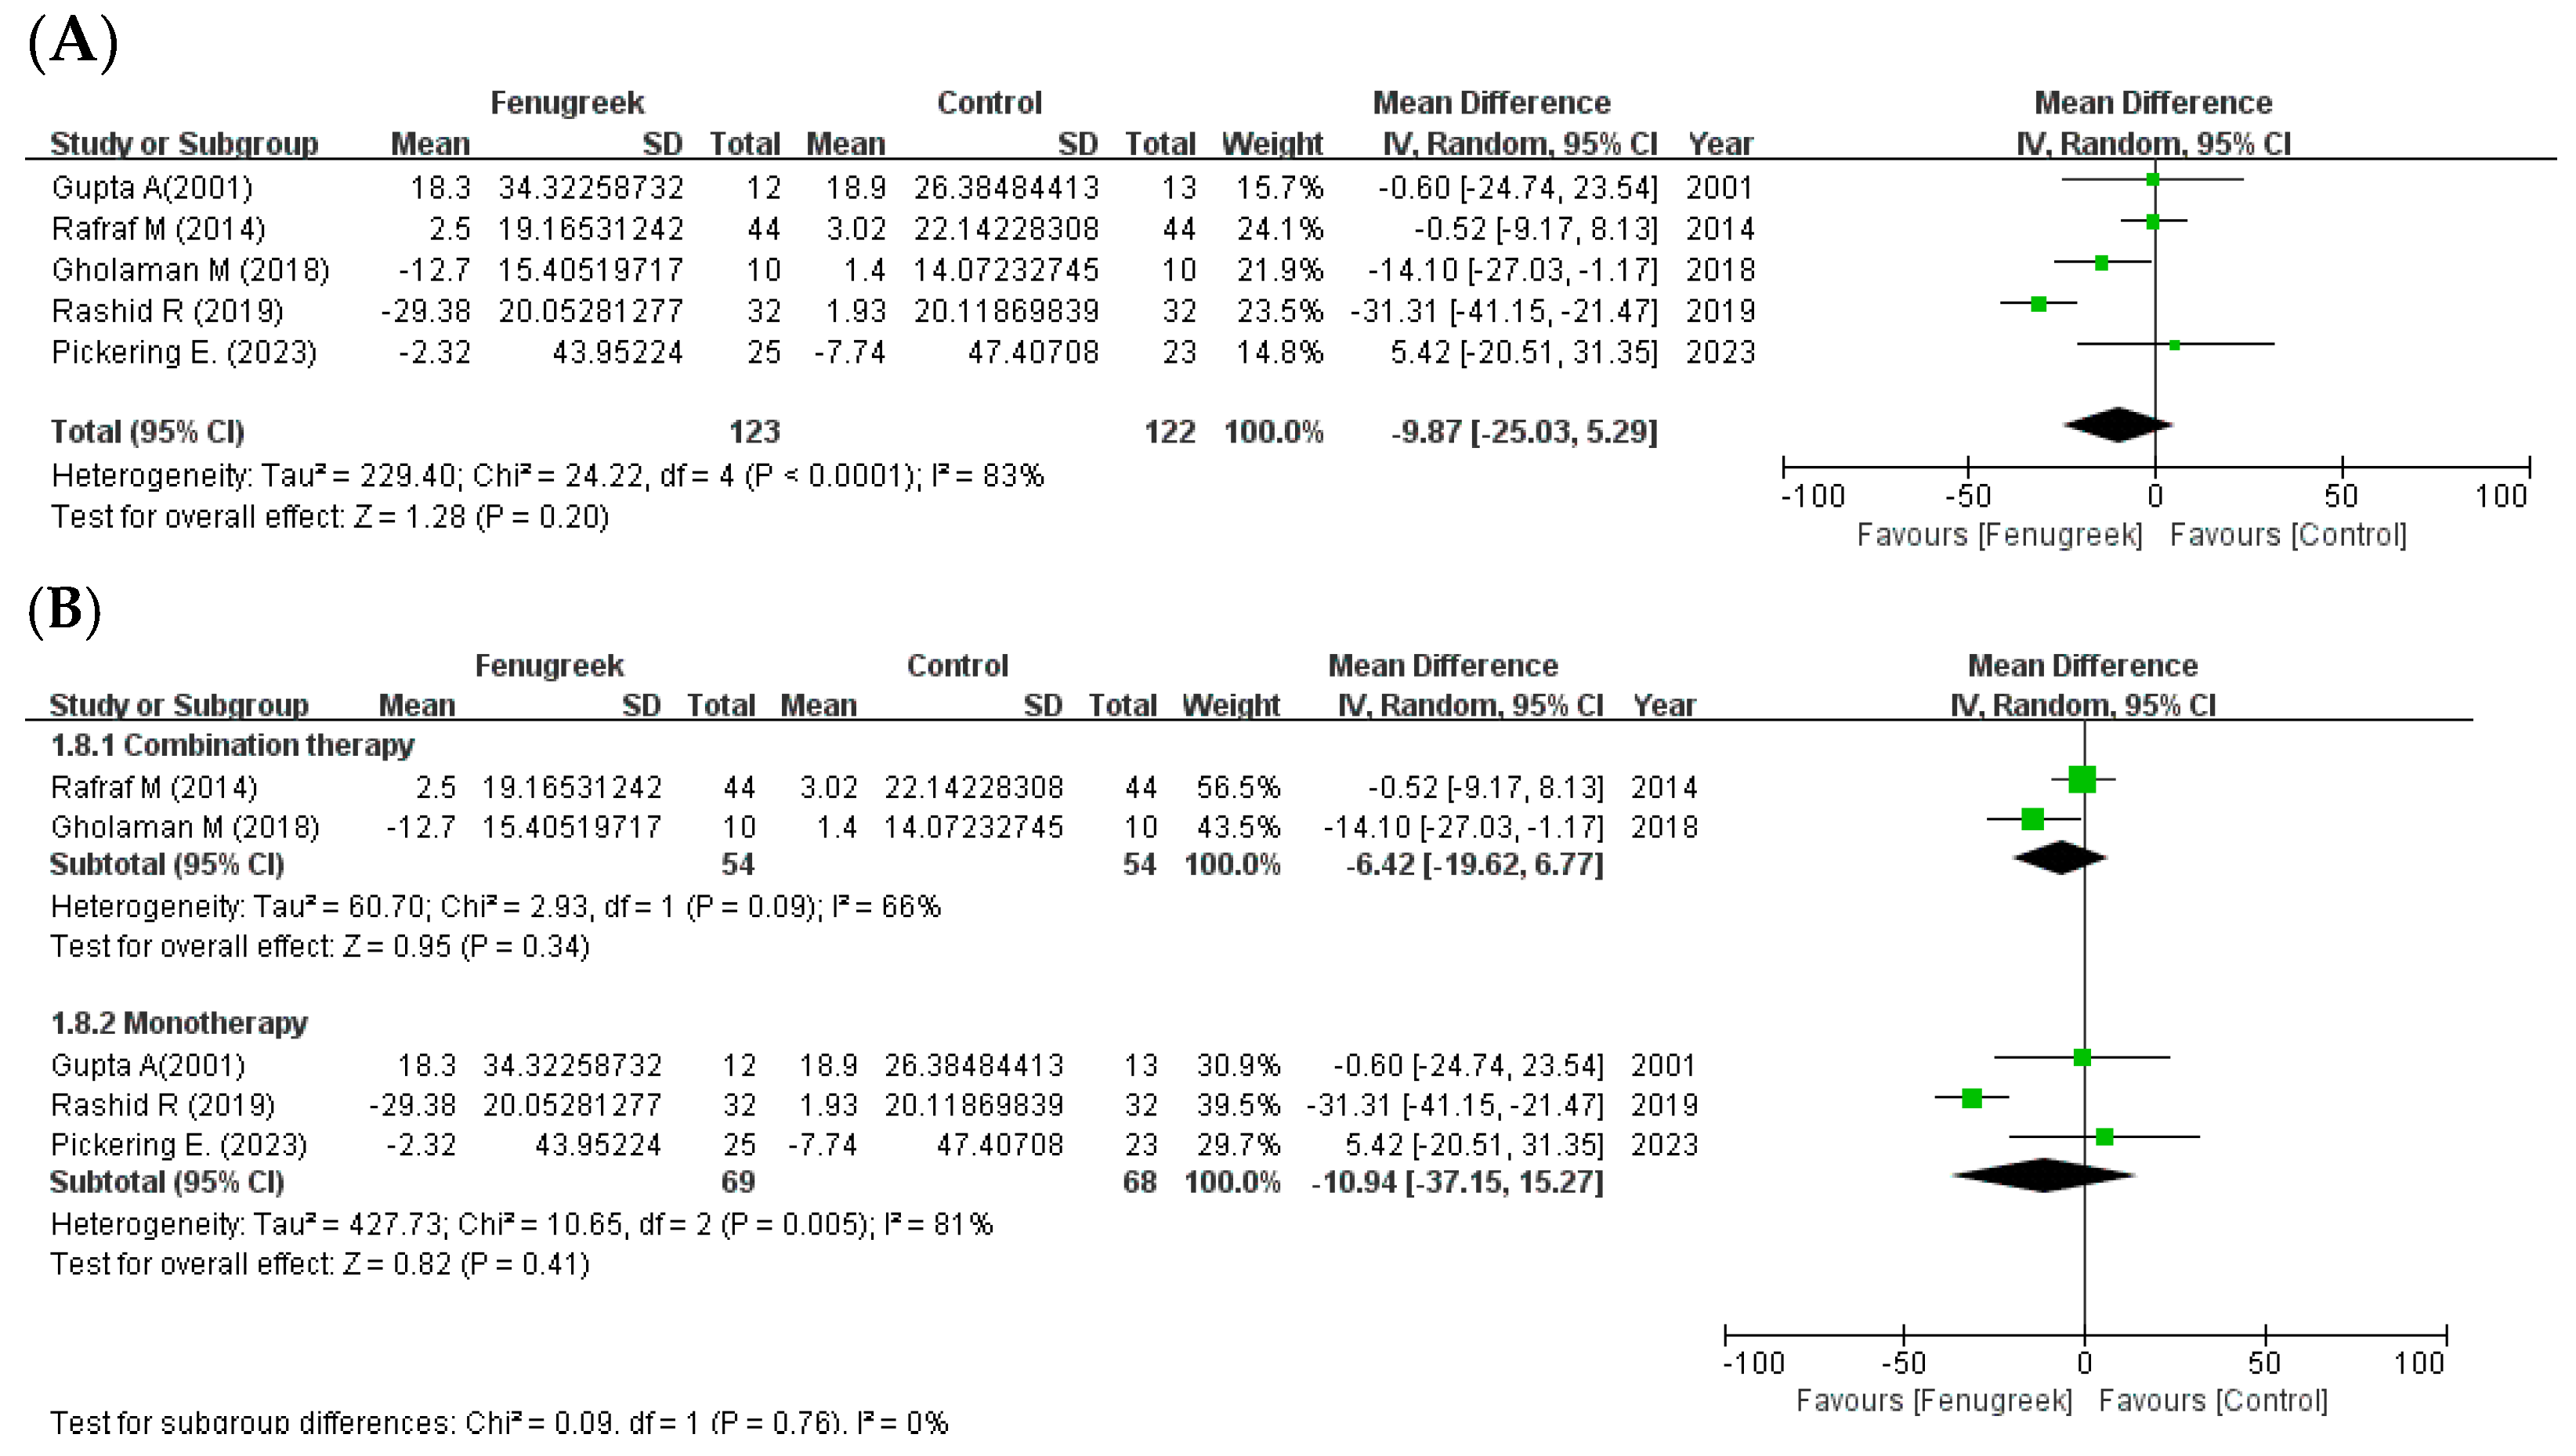
 the position of the square represents the risk ratio, while the size of the square shows the weight of the study;
  the black line indicates the 95% confidence interval of the result;
  the diamond depicts overall pooled effect from the included studies.
the position of the square represents the risk ratio, while the size of the square shows the weight of the study; the black line indicates the 95% confidence interval of the result; the diamond depicts overall pooled effect from the included studies.
the diamond depicts overall pooled effect from the included studies.
the position of the square represents the risk ratio, while the size of the square shows the weight of the study; the black line indicates the 95% confidence interval of the result; the diamond depicts overall pooled effect from the included studies. the position of the square represents the risk ratio, while the size of the square shows the weight of the study; the black line indicates the 95% confidence interval of the result; the diamond depicts overall pooled effect from the included studies.
the position of the square represents the risk ratio, while the size of the square shows the weight of the study; the black line indicates the 95% confidence interval of the result; the diamond depicts overall pooled effect from the included studies.
the position of the square represents the risk ratio, while the size of the square shows the weight of the study; the black line indicates the 95% confidence interval of the result; the diamond depicts overall pooled effect from the included studies.
 the position of the square represents the risk ratio, while the size of the square shows the weight of the study; the black line indicates the 95% confidence interval of the result; the diamond depicts overall pooled effect from the included studies.
the position of the square represents the risk ratio, while the size of the square shows the weight of the study; the black line indicates the 95% confidence interval of the result; the diamond depicts overall pooled effect from the included studies.
the position of the square represents the risk ratio, while the size of the square shows the weight of the study; the black line indicates the 95% confidence interval of the result; the diamond depicts overall pooled effect from the included studies. the position of the square represents the risk ratio, while the size of the square shows the weight of the study; the black line indicates the 95% confidence interval of the result; the diamond depicts overall pooled effect from the included studies.
the position of the square represents the risk ratio, while the size of the square shows the weight of the study; the black line indicates the 95% confidence interval of the result; the diamond depicts overall pooled effect from the included studies.
the position of the square represents the risk ratio, while the size of the square shows the weight of the study; the black line indicates the 95% confidence interval of the result; the diamond depicts overall pooled effect from the included studies.
 the position of the square represents the risk ratio, while the size of the square shows the weight of the study; the black line indicates the 95% confidence interval of the result; the diamond depicts overall pooled effect from the included studies.
the position of the square represents the risk ratio, while the size of the square shows the weight of the study; the black line indicates the 95% confidence interval of the result; the diamond depicts overall pooled effect from the included studies.
the position of the square represents the risk ratio, while the size of the square shows the weight of the study; the black line indicates the 95% confidence interval of the result; the diamond depicts overall pooled effect from the included studies.


| Databases | Search Terms | |
|---|---|---|
| PubMed | (“Trigonella” [Mesh] OR “fenugreek seed meal” [Supplementary Concept]) AND “Glucose Metabolism Disorders” [Mesh] | |
| EMBASE | (‘diabetes mellitus’/exp/mj OR ‘dysglycemia’/exp/mj OR ‘glucose intolerance’/exp/mj OR ‘hyperglycemia’/exp/mj OR ‘insulin resistance’/exp/mj OR ‘glycosuria’/exp/mj OR ‘hyperinsulinism’/exp/mj) AND (‘trigonella’/exp/mj OR ‘fenugreek’/exp/mj OR ‘fenugreek extract’/exp/mj) | |
| Cochrane | #1 | “Glucose Metabolism Disorder [MeSH]” AND “Trigonella [MeSH]” |
| #2 | (“fenugreek*” OR “fenugreek extract*” OR “fenugreek seed meal” OR “trigonella*”) AND (“hyperglycemia” OR “hyperinsulinism” OR “dysglycemia” OR “glucose intolerance” OR “diabet*” OR “insulin resistance” OR “glucose metabolism disorder*” OR “Glycosuria”) | |
| #3 | #1 OR #2 | |
| CNKI | “葫芦巴” AND (“血糖” OR “糖尿”) | |
| KISS, RISS, Science ON | “호로파” OR “胡盧巴” OR “胡蘆巴” OR “葫蘆巴” OR “葫盧巴” | |
| Parameter | Inclusion Criteria |
|---|---|
| Population | Human with high glucose level (FBG ≥ 100 mg/dL, HbA1c ≥ 5.7%) |
| Intervention | Fenugreek seed or its extracts |
| Comparisons | Placebo or no treatment |
| Outcomes | Fasting blood glucose (FBG), 2 h plasma glucose during a 75 g oral glucose tolerance test (OGTT) (2-hPG), homeostatic model assessment for insulin resistance (HOMA-IR), glycosylated hemoglobin (HbA1c)/total cholesterol (TC), triglyceride (TG), high density lipoprotein (HDL-C), low density lipoprotein (LDL-C), body mass index (BMI) |
| Study design | RCTs in parallel design |
| Parameter | Exclusion Criteria |
|---|---|
| Population | Healthy people (FBG < 100 mg/dL, HbA1c < 5.7%) |
| Intervention | Combination of fenugreek with other herbs or non-seed part of fenugreek |
| Comparisons | Comparison of the hyperglycemic drugs |
| Study design | Non-RCTs (cohort studies, RCTs in cross-over design), acute studies ≤ 10 days |
| References | Study Design | Duration | Participants Age (Mean or Range) Male: Female Medication | Intervention Group | Control Group | Additional Therapy | Primary Outcomes | Adverse Events (Group, N) | ||
|---|---|---|---|---|---|---|---|---|---|---|
| Size, N | Intervention [Type, Daily Dose] | Size, N | Control | |||||||
| Arvind Gupta et al. [31] | DB, PL | 2 mts | Mild to moderate T2DM (FBG < 200 mg/dL) I: 49.16 years/C: 52.83 yrs 19:6 NR | 12 | Fenugreek [HS, 1 gm, 2 capsule × 2] | 13 | Usual care (diet control, exercise) + placebo (2 capsules × 2) | SU (I: 3, C:1) SU + BI (I: 7, C: 9) |
| dyspepsia and mild abdominal distension (I, 5) |
| Lu Fu-rong et al. [32] | DB, PL | 12 wks | T2DM poorly controlled by SU (7 mmol/L < FBG < 13 mmol/L, ±1.5 mmol/L) 25–65 years 38:31 SU | 46 | Fenugreek extract [TFGs capsules (0.35 g/pill), 6 capsules × 3] + SU | 23 | Chinese yam placebo (0.35 g/pill, 6 capsules × 3) + SU | None |
| stomach discomforts and nausea (I.2)/diarrhea (I,1) |
| Guo et al. [34] | PL | 16 wks | T2DM (FBG ≥ 7 mmol/L, 2 hPG ≥ 11.1 mmol/L) with diabetic nephropathy I: 58 years/C:59 years 39:33 NR | 39 | Fenugreek [FS, 10 g × 3] + VAL (80 mg once a day) + diet, exercise | 33 | VAL (80 mg once a day) + diet, exercise | None |
| abdominal distension and stomach discomforts (I, 3)/abdominal distension (C, 2) |
| Maryam Rafraf et al. [35] | TB, PL | 8 wks | T2DM (diabetic history ≥ 6 months, FBG ≥ 126 mg/dL) with BMI ≤ 35 kg/m2 30–60 years 10:78 MET/GLI | 44 | Fenugreek [PS, 5 g × 2] + MET/GLI + usual diet | 44 | Placebo (wheat starch, 2.5 g × 2) + MET/GLI + usual diet | None |
| None |
| Narsingh Verma et al. [33] | DB, PL | 90 days | T2DM (diabetic history < 5 years, FBG < 180 mg/dL, HbA1c > 7.5%) 25–60 years 108:46 MET/SU | 77 | Fenfuro [500 mg capsule, 2 capsules] + MET + diet (< 2000 kcal/day, protein 18~22%, carbohydrate 52~56%, fat 22~26%) | 77 | Placebo (di calcium phosphate, 2 capsules) + MET + diet (< 2000 kcal/day, protein 18~22%, carbohydrate 52~56%, fat 22~26%) | None |
| None |
| Gholaman M et al. [29] | DB, PL | 8 wks | Obese woman T2DM with BMI > 30 kg/m2 44.2 years 0:40 Changed antidiabetic drugs | 10 | Fenugreek [FSs, 5 g + 100 g yogurt × 3] + antidiabetic drugs | 10 | Placebo (flavors) + 100 g yogurt + antidiabetic drugs | None |
| NR |
| 10 | Aerobic exercise (running and walking) + antidiabetic drugs | |||||||||
| 10 | FSs + exercise + antidiabetic drugs | |||||||||
| Raheela Rashid et al. [11] | SB, PL | 12 wks | Newly diagnosed T2DM 30–60 years 29:35 NR | 32 | Fenugreek extract [galactomannan capsule, 1 g] + modified diabetic diet and exercise (walking) | 32 | Placebo (1 g) + modified diabetic diet and exercise (walking) | None |
| None |
| Seyyedeh Seddigheh Hassani et al. [30] | DB, PL | 2 mts | T2DM(diabetic history ≥ 6 months, not insulin injection) with BMI < 35 kg/m2 35–70 years 54:71 glycemic drugs | 31 | Fenugreek [PS, 5 g×2] + classic treatments | 31 | Placebo (wheat flour, 5 g × 2) | None |
| NR |
| 31 | PS (5 g × 2) + nutrition training (2 h) | |||||||||
| 32 | Placebo (5 g × 2) + nutrition training (2 h) | |||||||||
| Amir Hadi et al. [36] | PL | 8 wks | T2DM (diabetic history < 10 years) with BMI < 35 kg/m2 30–65 years 22:26 antidiabetic drugs | 24 | Fenugreek with water [PS, 5 g × 3] + antidiabetic drug + nutritional recommendations | 24 | Nutritional recommendations | None |
| None |
| Emily Pickering et al. [28] | DB, PL | 12 wks | Prediabetes (FBG > 5.5 mmol/L, 2 hPG > 7.8 mmol/L) I: 58.2 years/C: 59.7 years 28:20 None | 25 | fenugreek [HS, 250 mg/tablet, 1 tablet × 2] | 23 | Placebo (maltodextrin, 1 tablets × 2) | None |
| Light-headed (NR) |
Disclaimer/Publisher’s Note: The statements, opinions and data contained in all publications are solely those of the individual author(s) and contributor(s) and not of MDPI and/or the editor(s). MDPI and/or the editor(s) disclaim responsibility for any injury to people or property resulting from any ideas, methods, instructions or products referred to in the content. |
© 2023 by the authors. Licensee MDPI, Basel, Switzerland. This article is an open access article distributed under the terms and conditions of the Creative Commons Attribution (CC BY) license (https://creativecommons.org/licenses/by/4.0/).
Share and Cite
Kim, J.; Noh, W.; Kim, A.; Choi, Y.; Kim, Y.-S. The Effect of Fenugreek in Type 2 Diabetes and Prediabetes: A Systematic Review and Meta-Analysis of Randomized Controlled Trials. Int. J. Mol. Sci. 2023, 24, 13999. https://doi.org/10.3390/ijms241813999
Kim J, Noh W, Kim A, Choi Y, Kim Y-S. The Effect of Fenugreek in Type 2 Diabetes and Prediabetes: A Systematic Review and Meta-Analysis of Randomized Controlled Trials. International Journal of Molecular Sciences. 2023; 24(18):13999. https://doi.org/10.3390/ijms241813999
Chicago/Turabian StyleKim, Jiwon, Woojeong Noh, Ahrim Kim, Yoomin Choi, and Young-Sik Kim. 2023. "The Effect of Fenugreek in Type 2 Diabetes and Prediabetes: A Systematic Review and Meta-Analysis of Randomized Controlled Trials" International Journal of Molecular Sciences 24, no. 18: 13999. https://doi.org/10.3390/ijms241813999
APA StyleKim, J., Noh, W., Kim, A., Choi, Y., & Kim, Y.-S. (2023). The Effect of Fenugreek in Type 2 Diabetes and Prediabetes: A Systematic Review and Meta-Analysis of Randomized Controlled Trials. International Journal of Molecular Sciences, 24(18), 13999. https://doi.org/10.3390/ijms241813999