
Synthesis and Study of Organic Nanostructures Fabricated by Inclusion of 2-Methylbenzimidazole Molecules in Nanotubes of Chrysotile Asbestos, Mesoporous Silica, and Nanopores of Borate Glasses

 , , , ,
Abstract
:1. Introduction
2. Results and Discussion
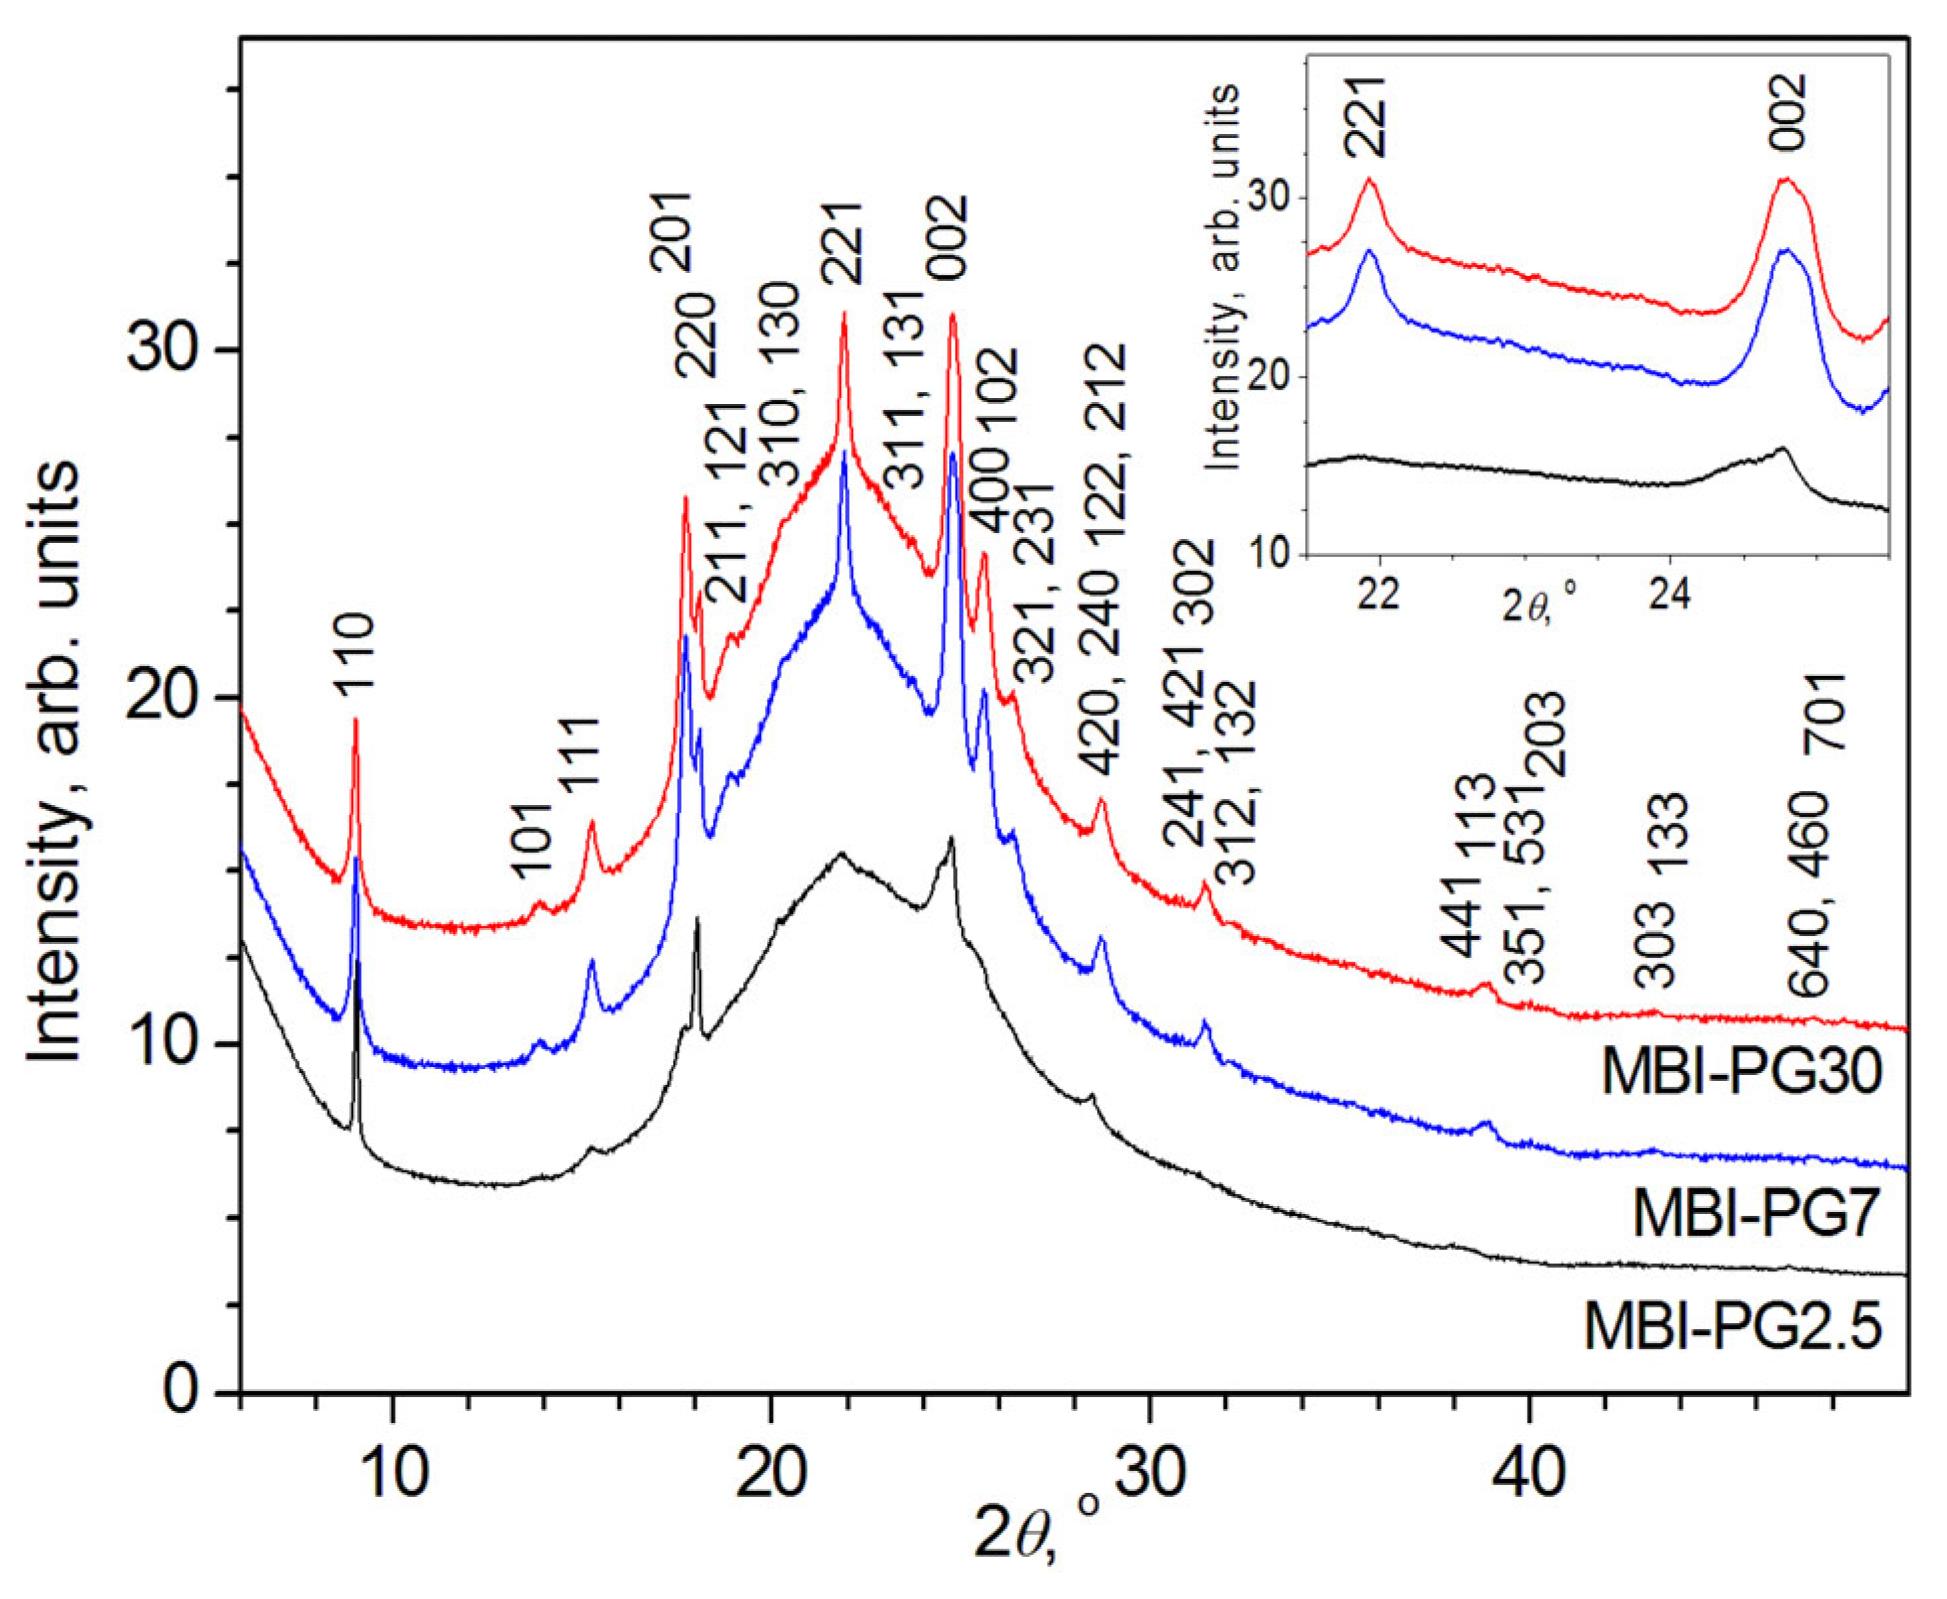
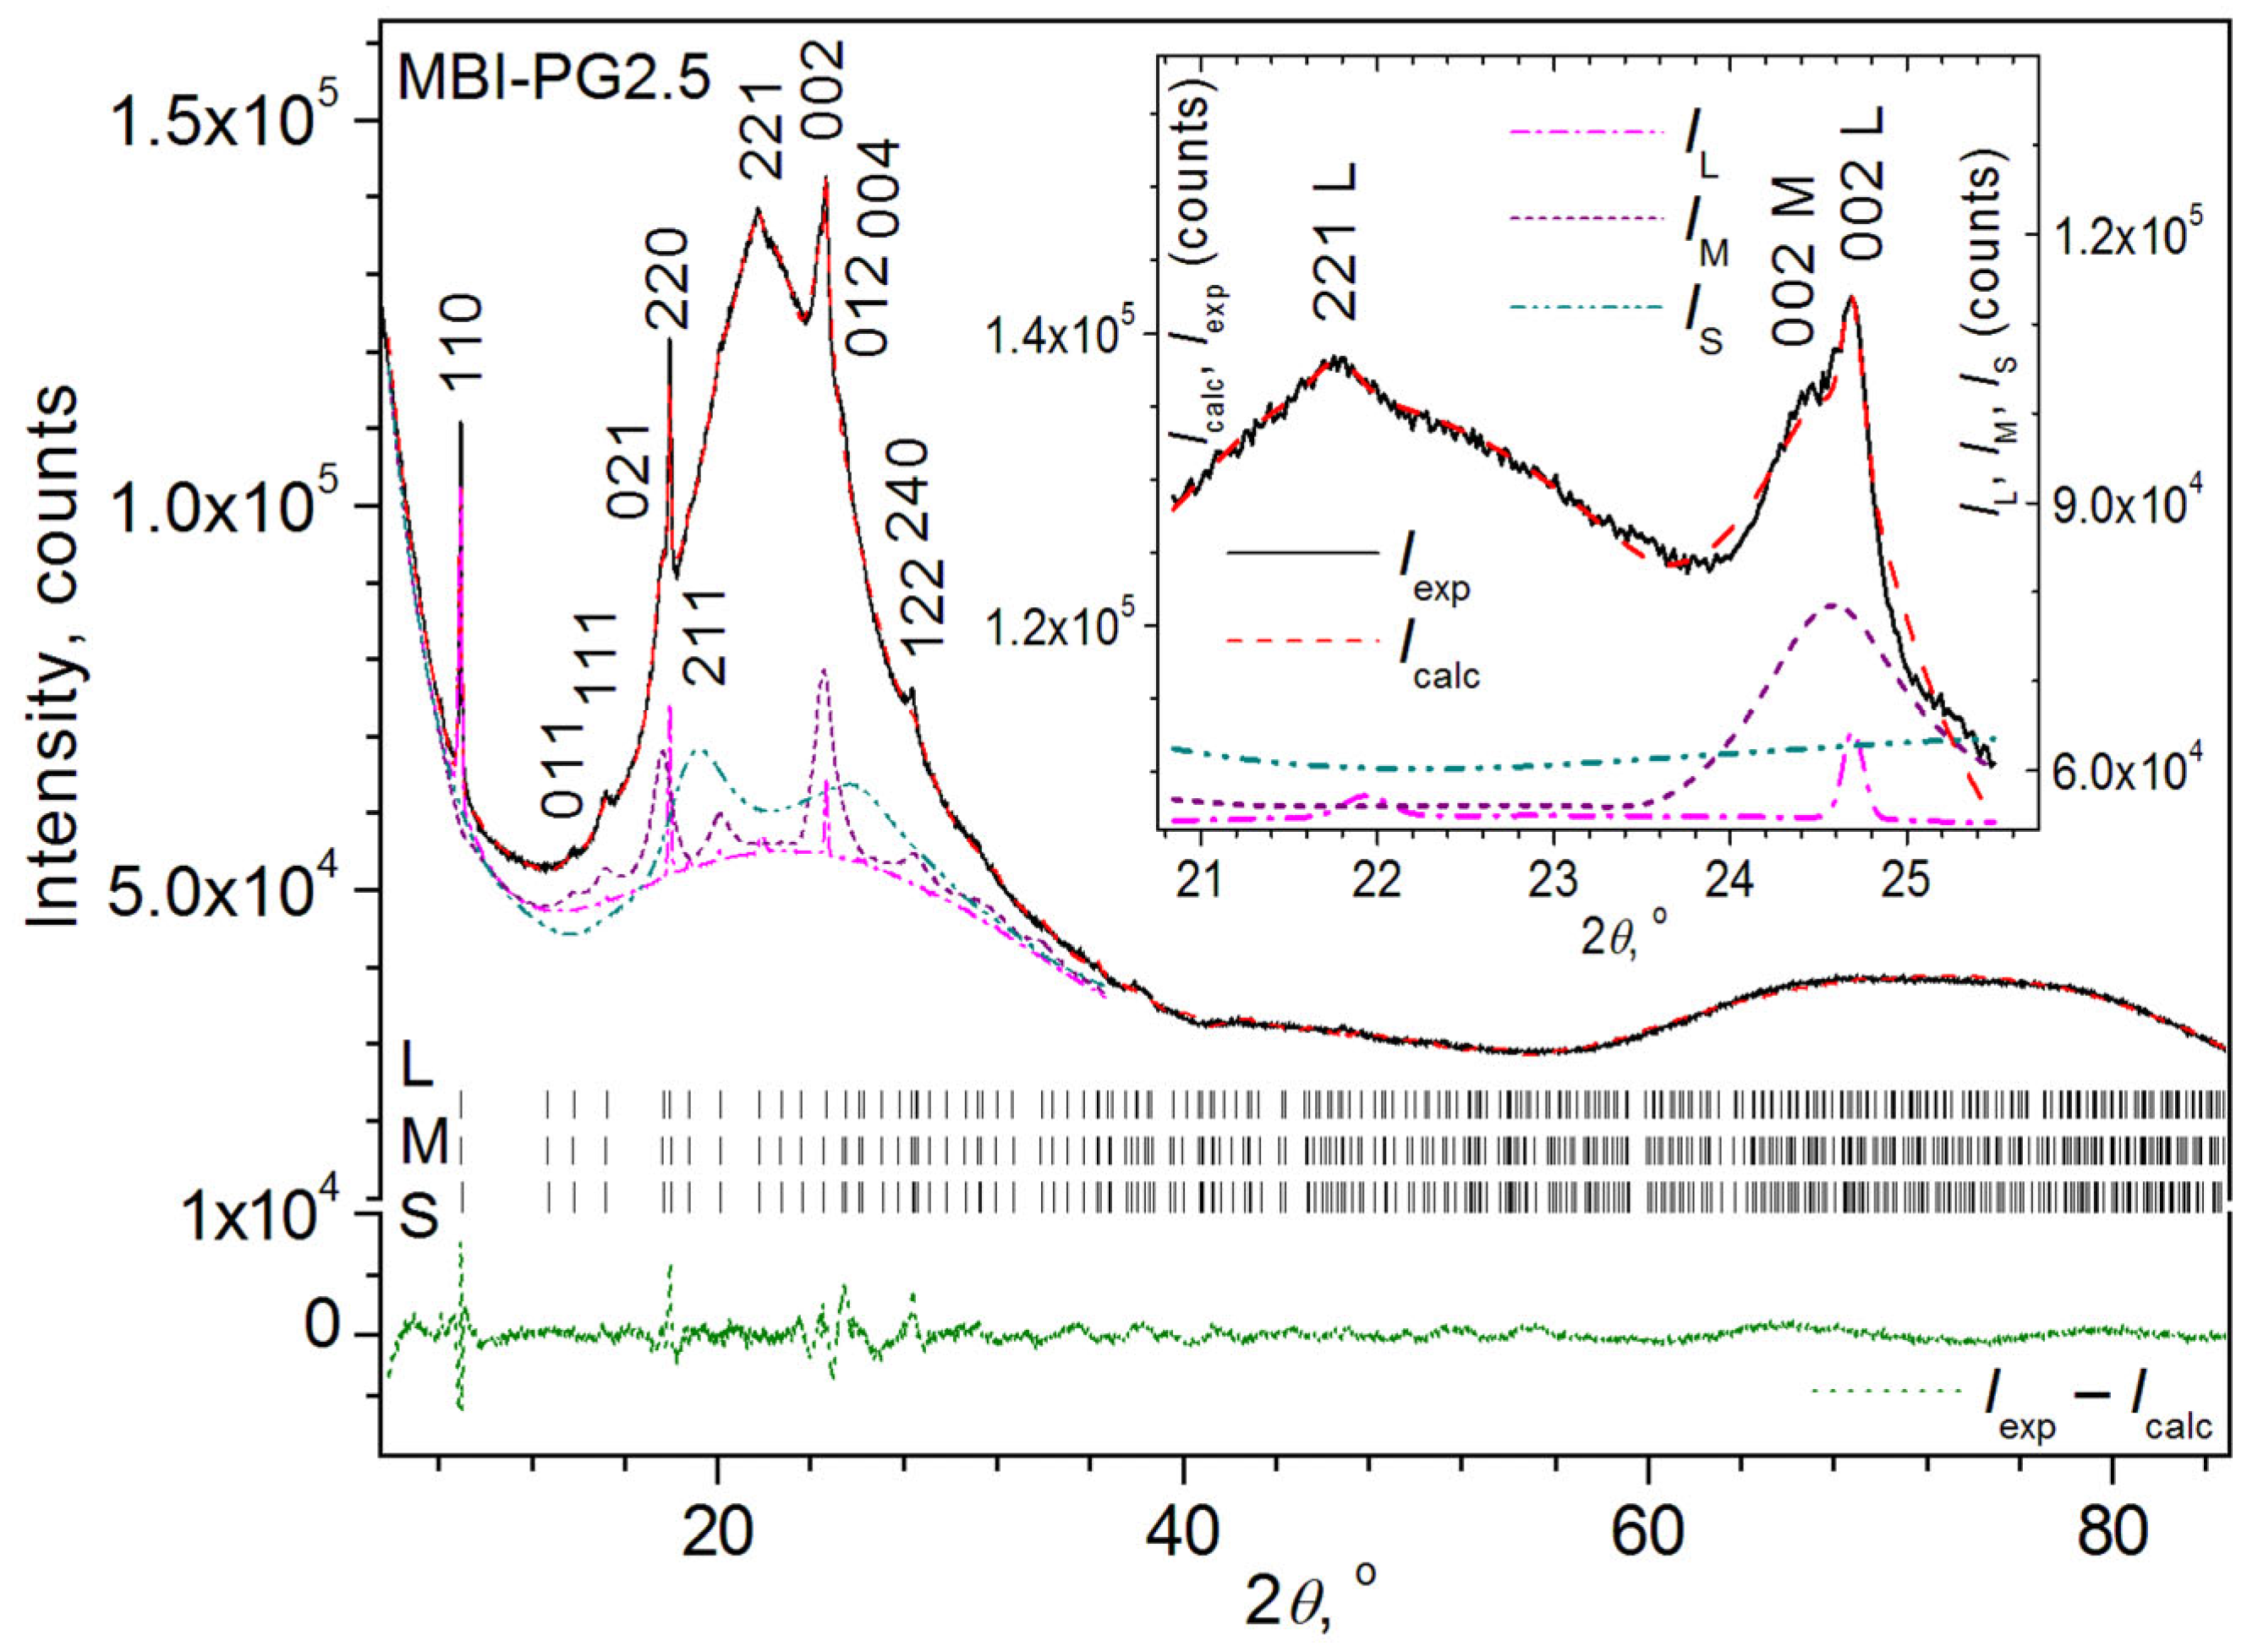
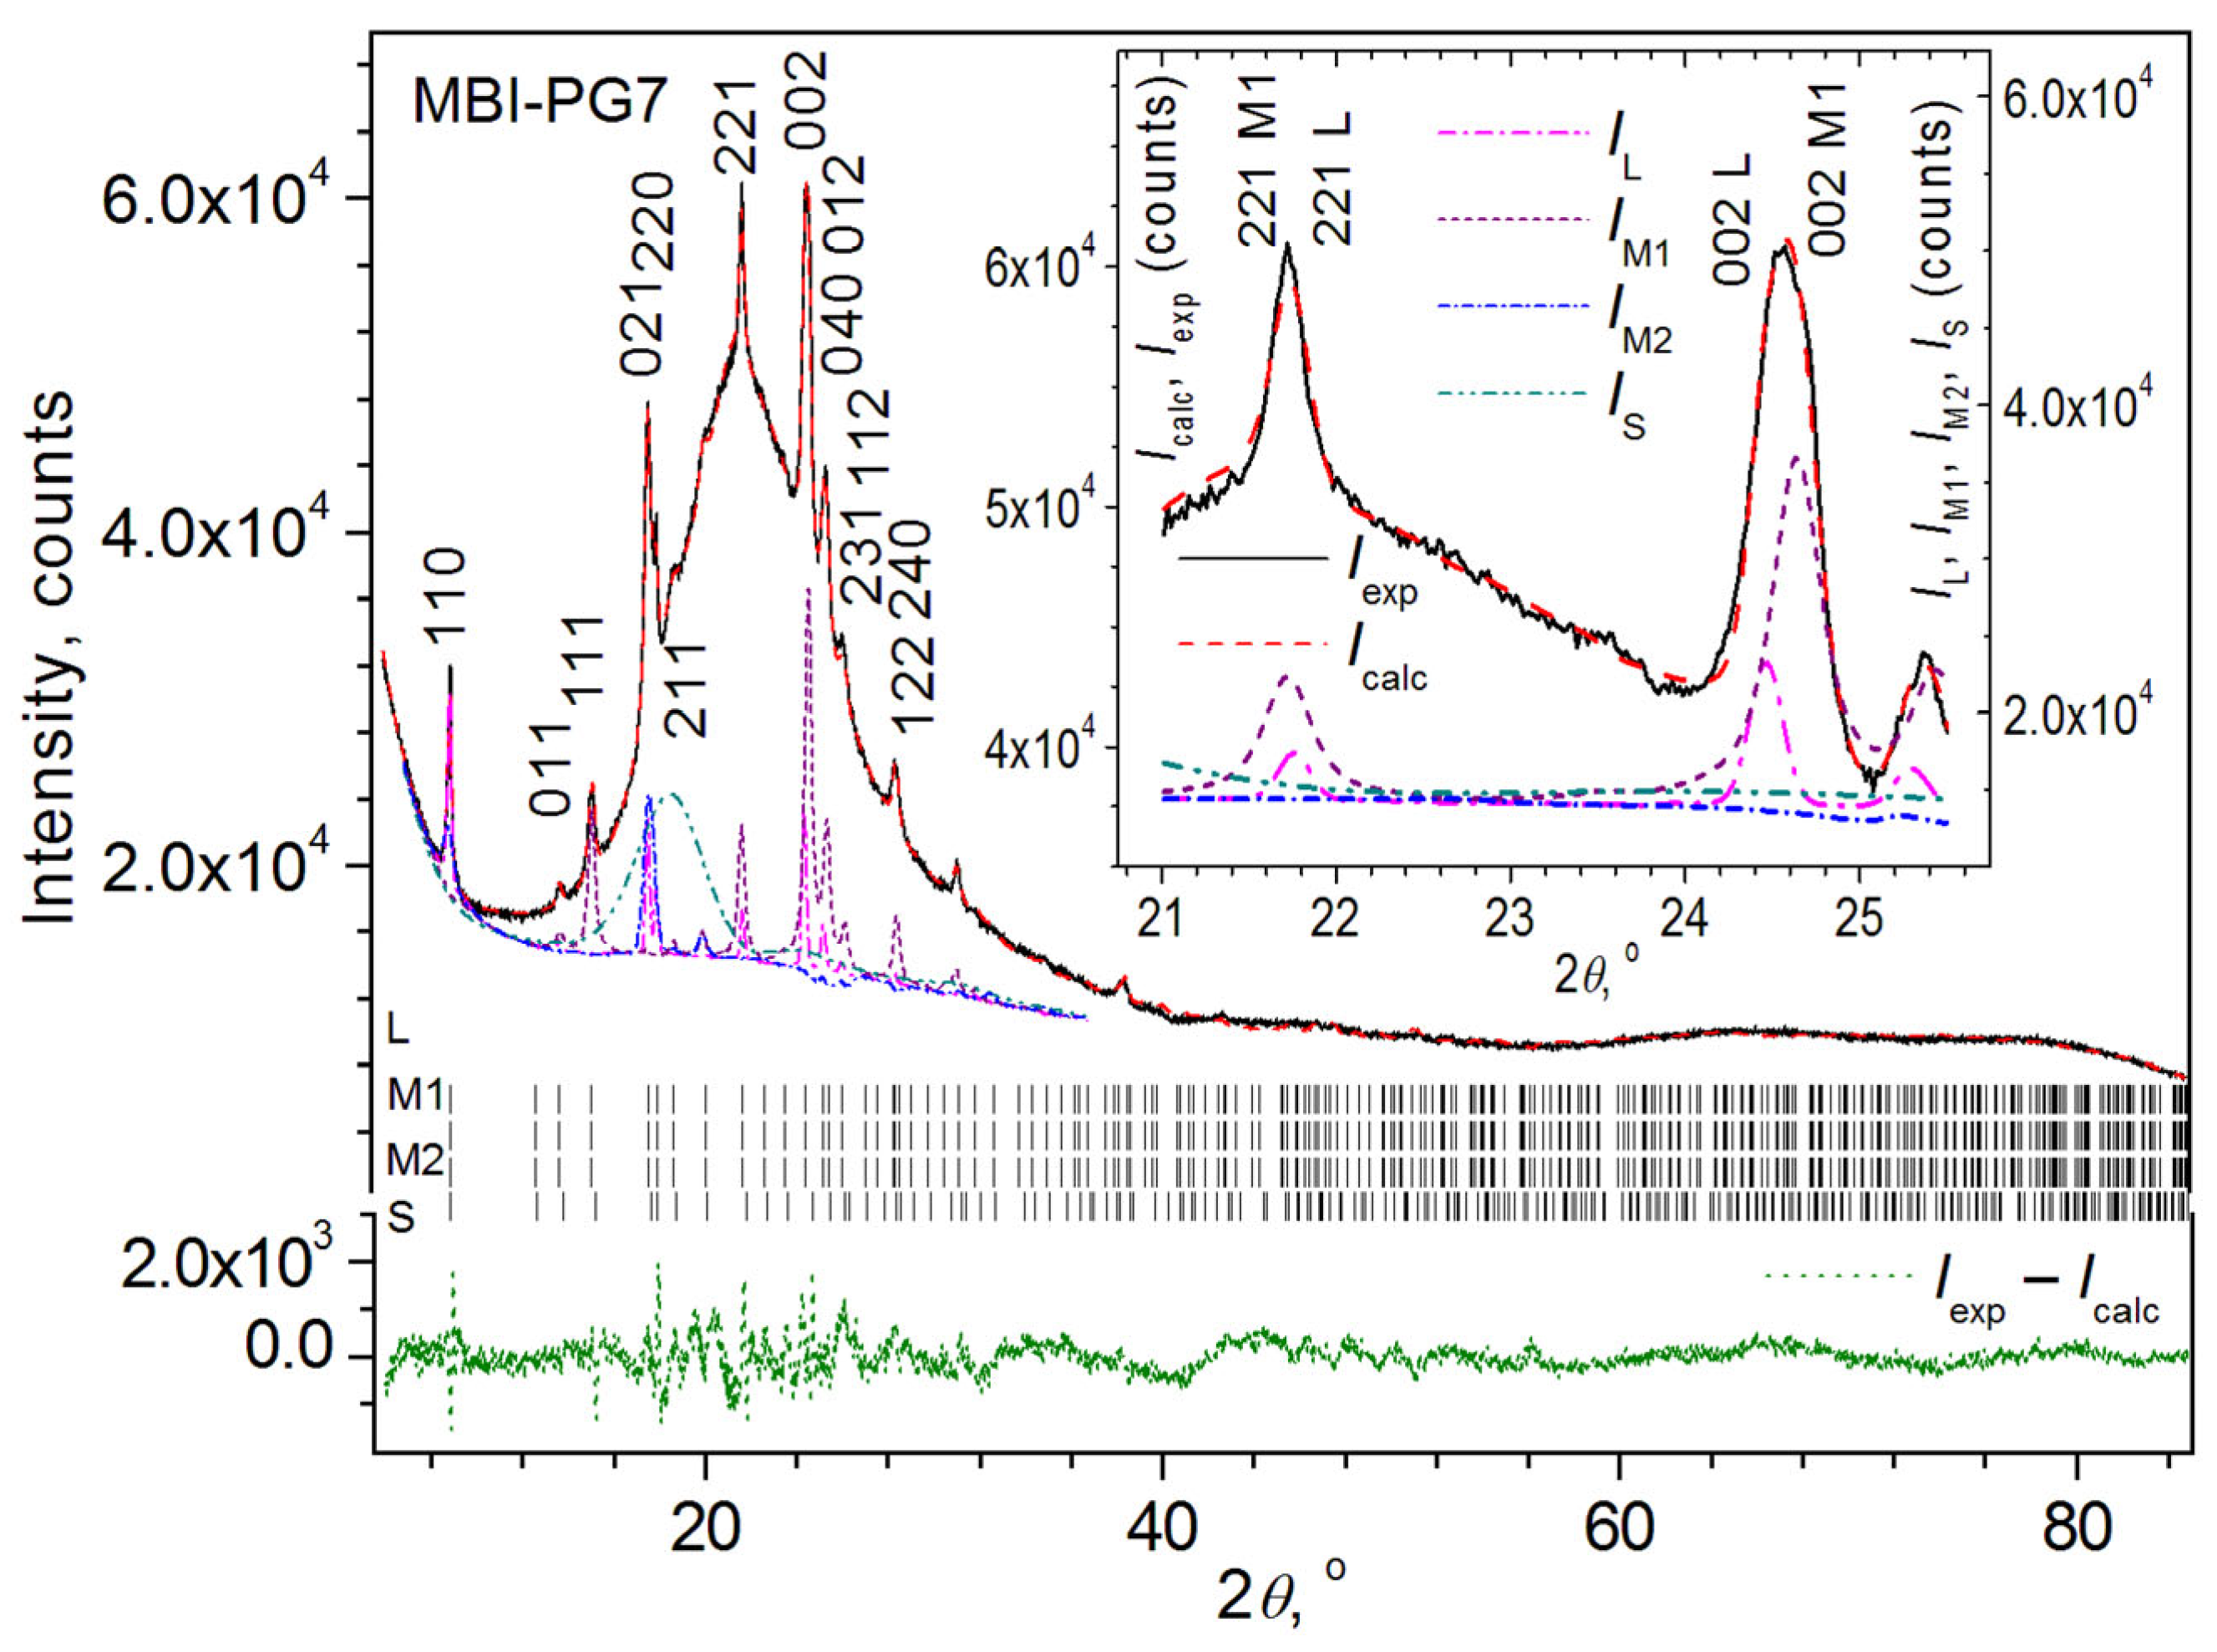
2.1. XRD Measurements
2.1.1. MBI in Porous Borate Glasses
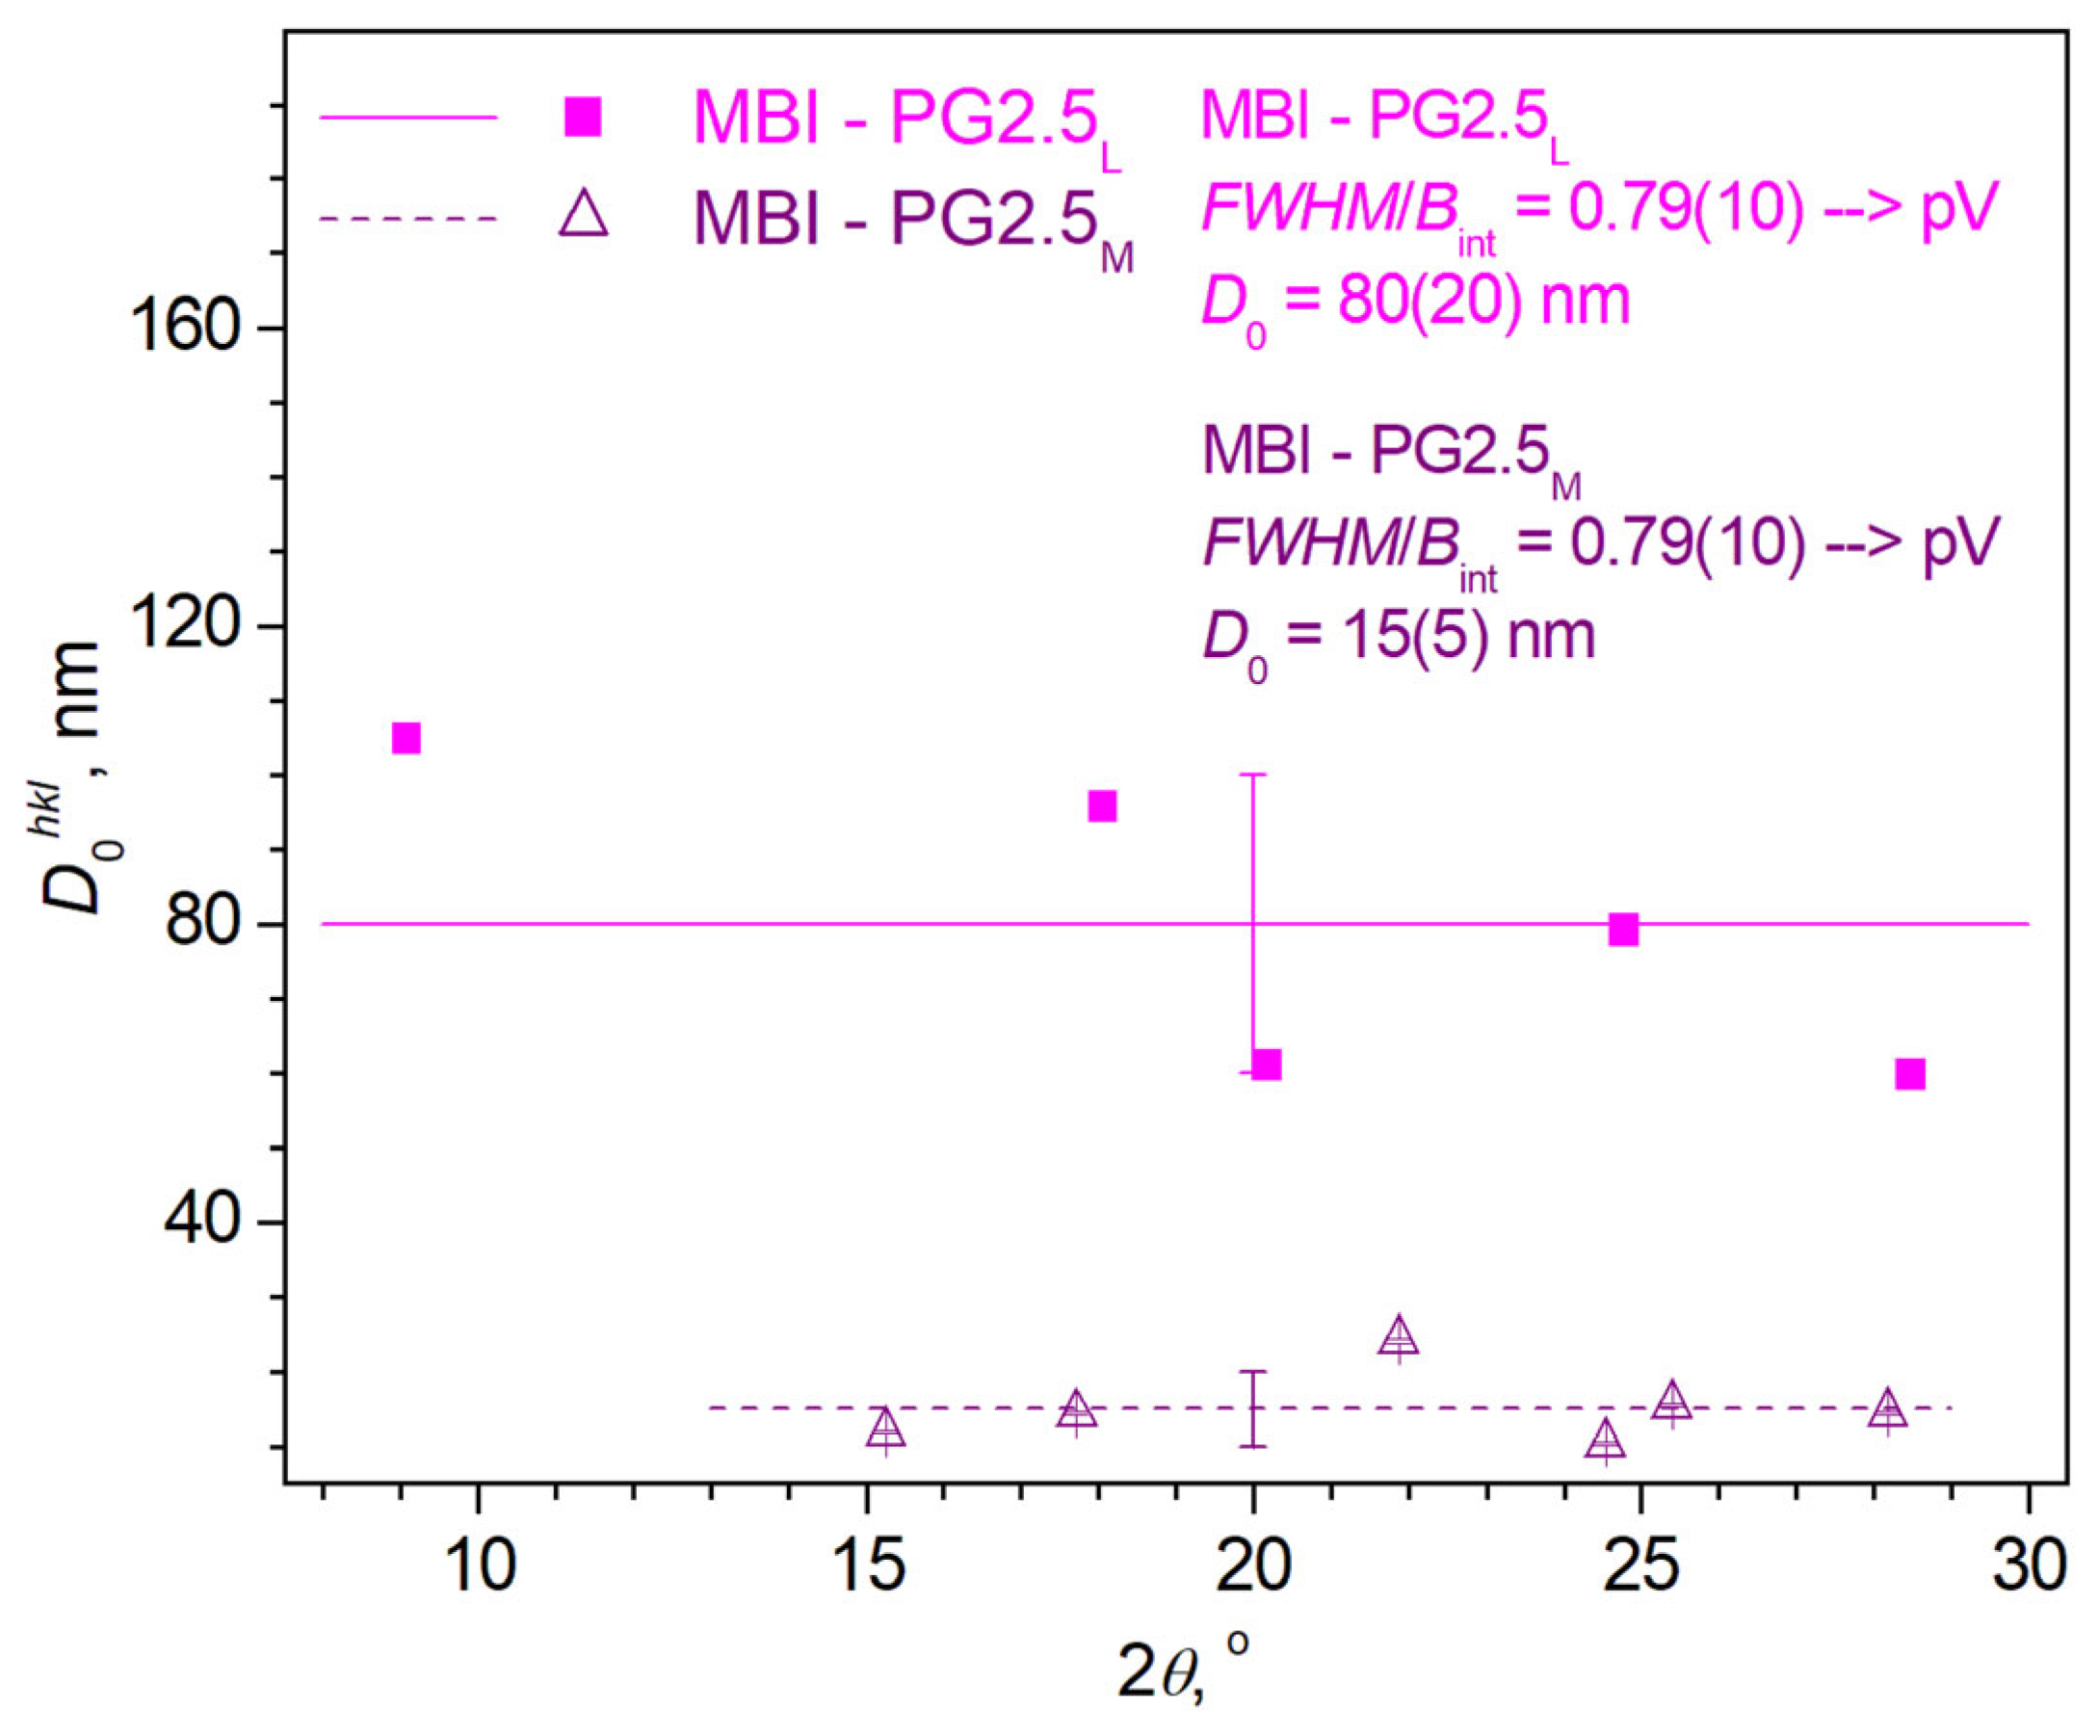
- Sample MBI-PG2.5
- Sample MBI-PG7
2.1.2. MBI in Chrysotile Asbestos
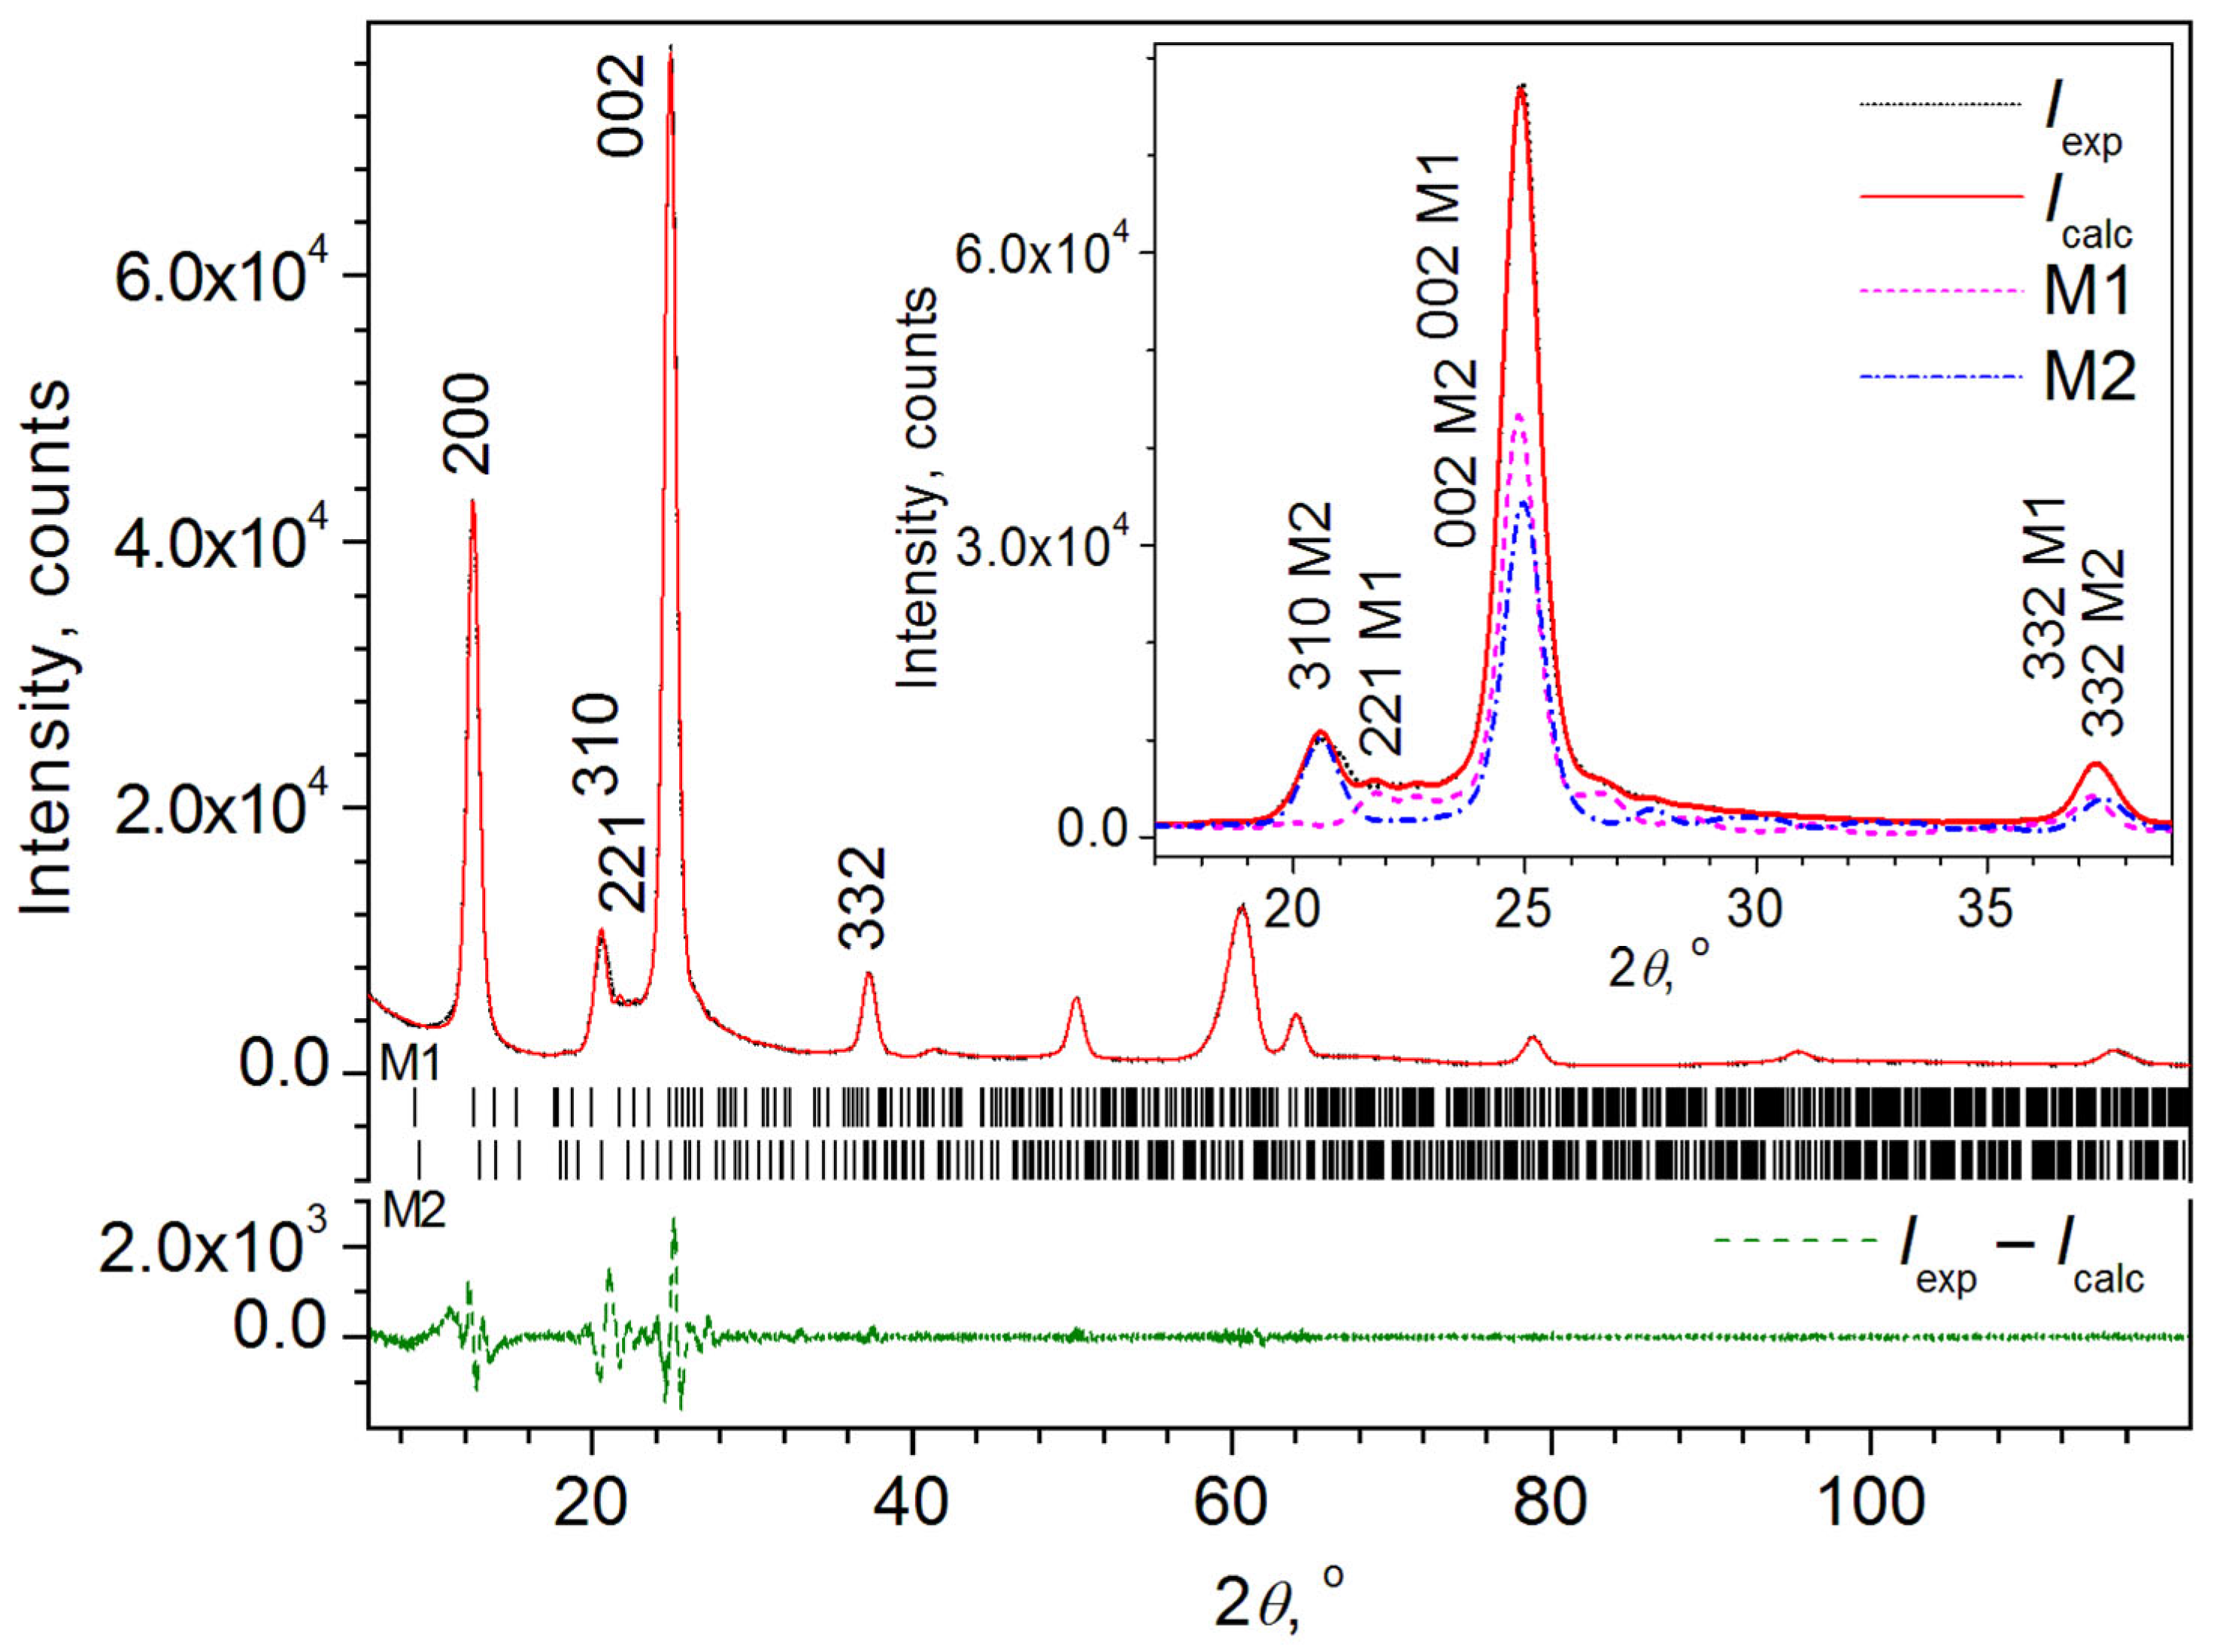
2.1.3. MBI in Mesoporous Silica (MBI-MS)
2.2. FTIR and Photoluminescence Measurements
2.2.1. IR Absorption in ChA and MBI-ChA Nanostructure
2.2.2. Photoluminescence of MBI Single Crystals
2.2.3. Photoluminescence of MBI-ChA
2.2.4. Photoluminescence in Porous Borate Glasses Filled with MBI
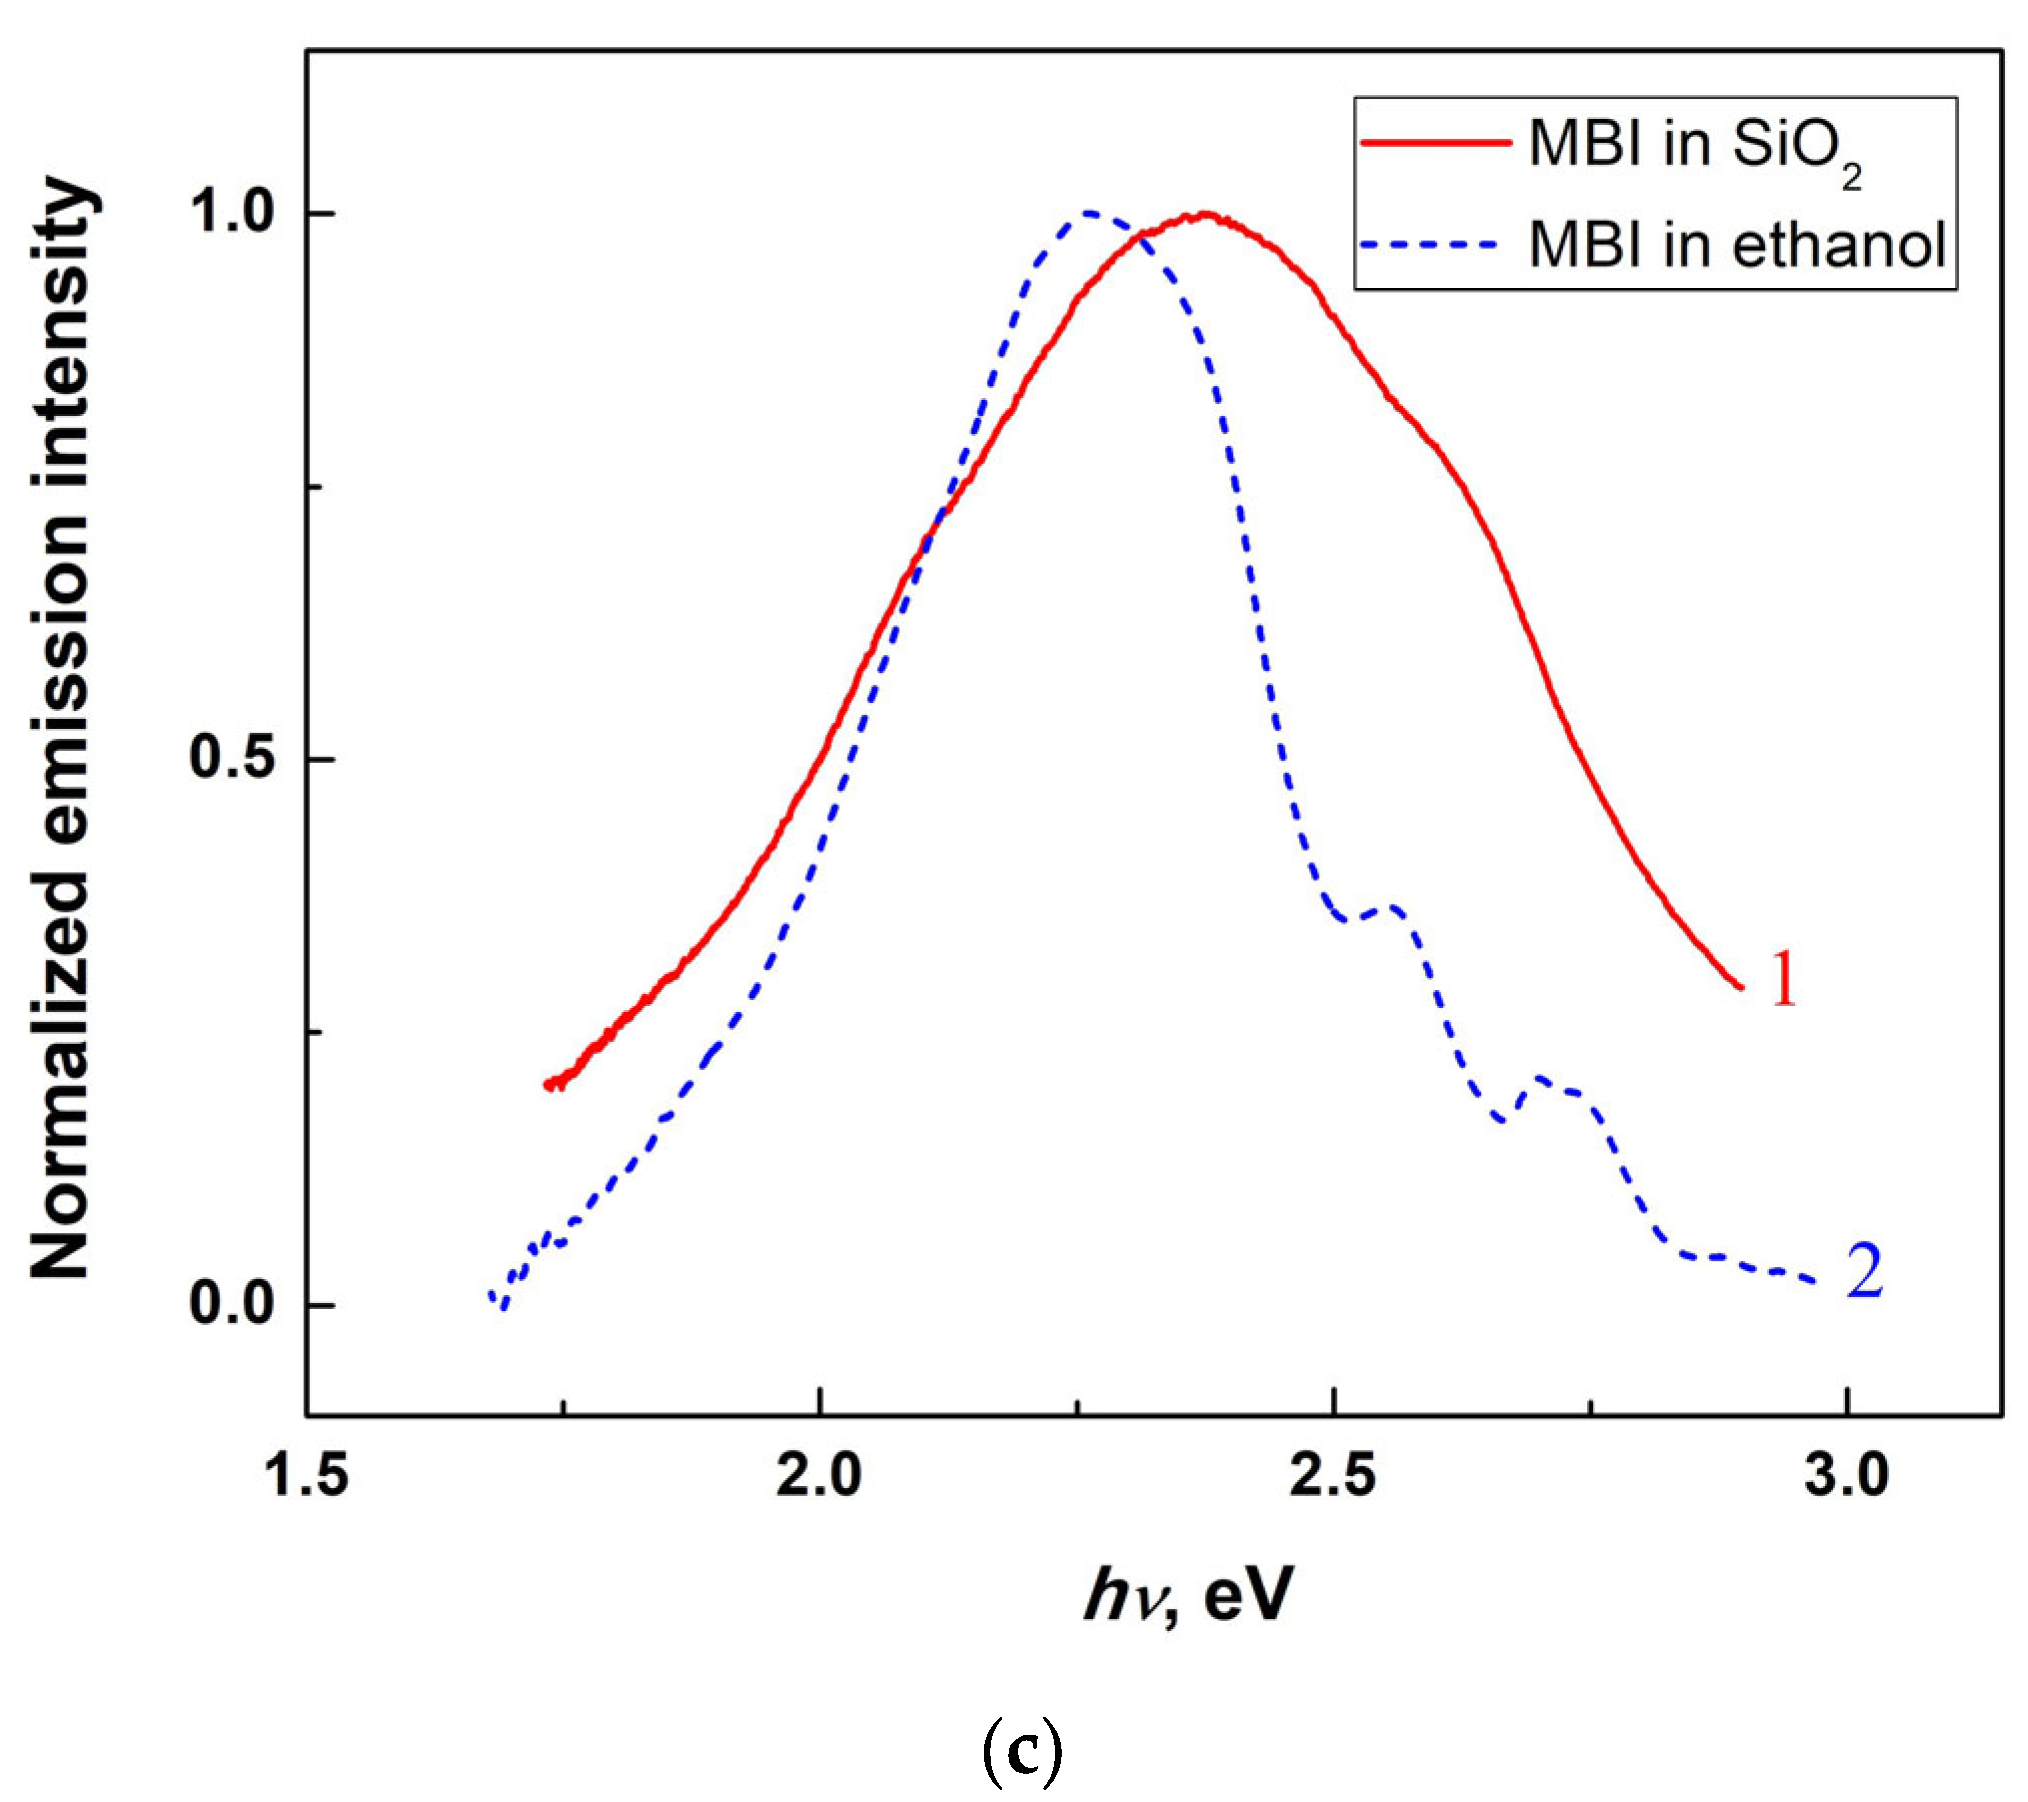
2.2.5. Photoluminescence of Mesoporous Silica Filled with MBI
2.3. Dielectric Properties
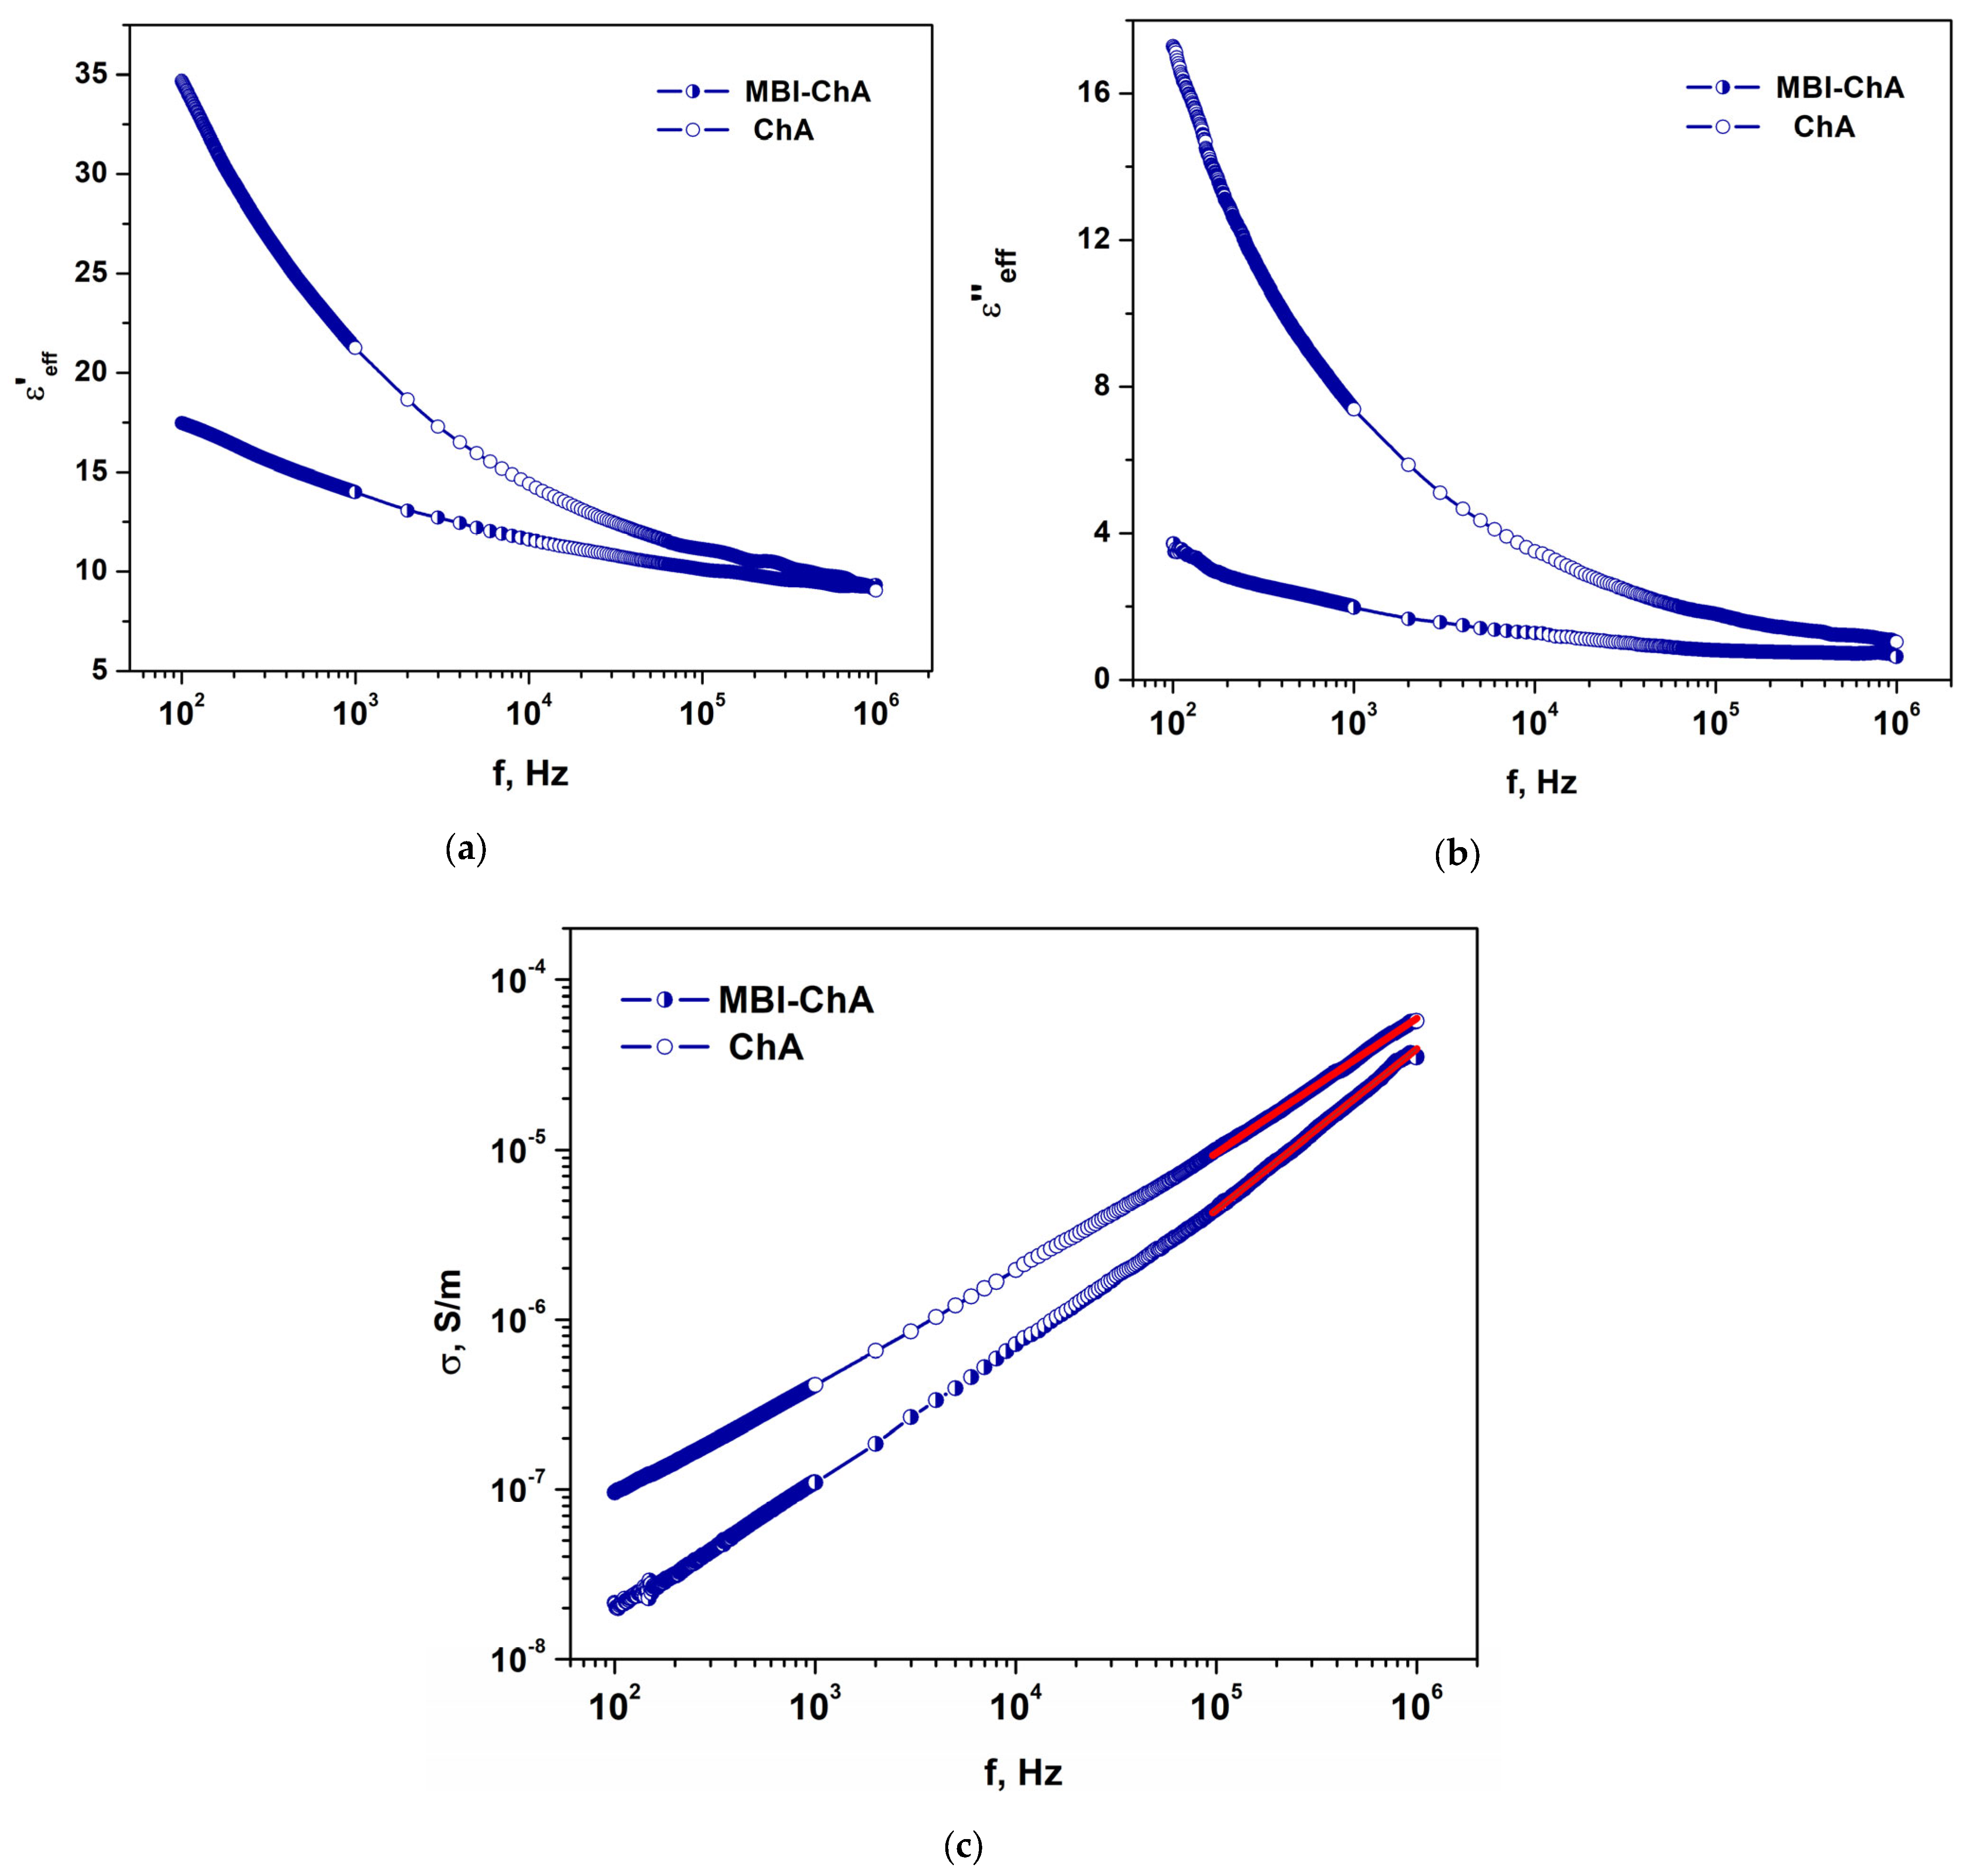
2.3.1. MBI-ChA
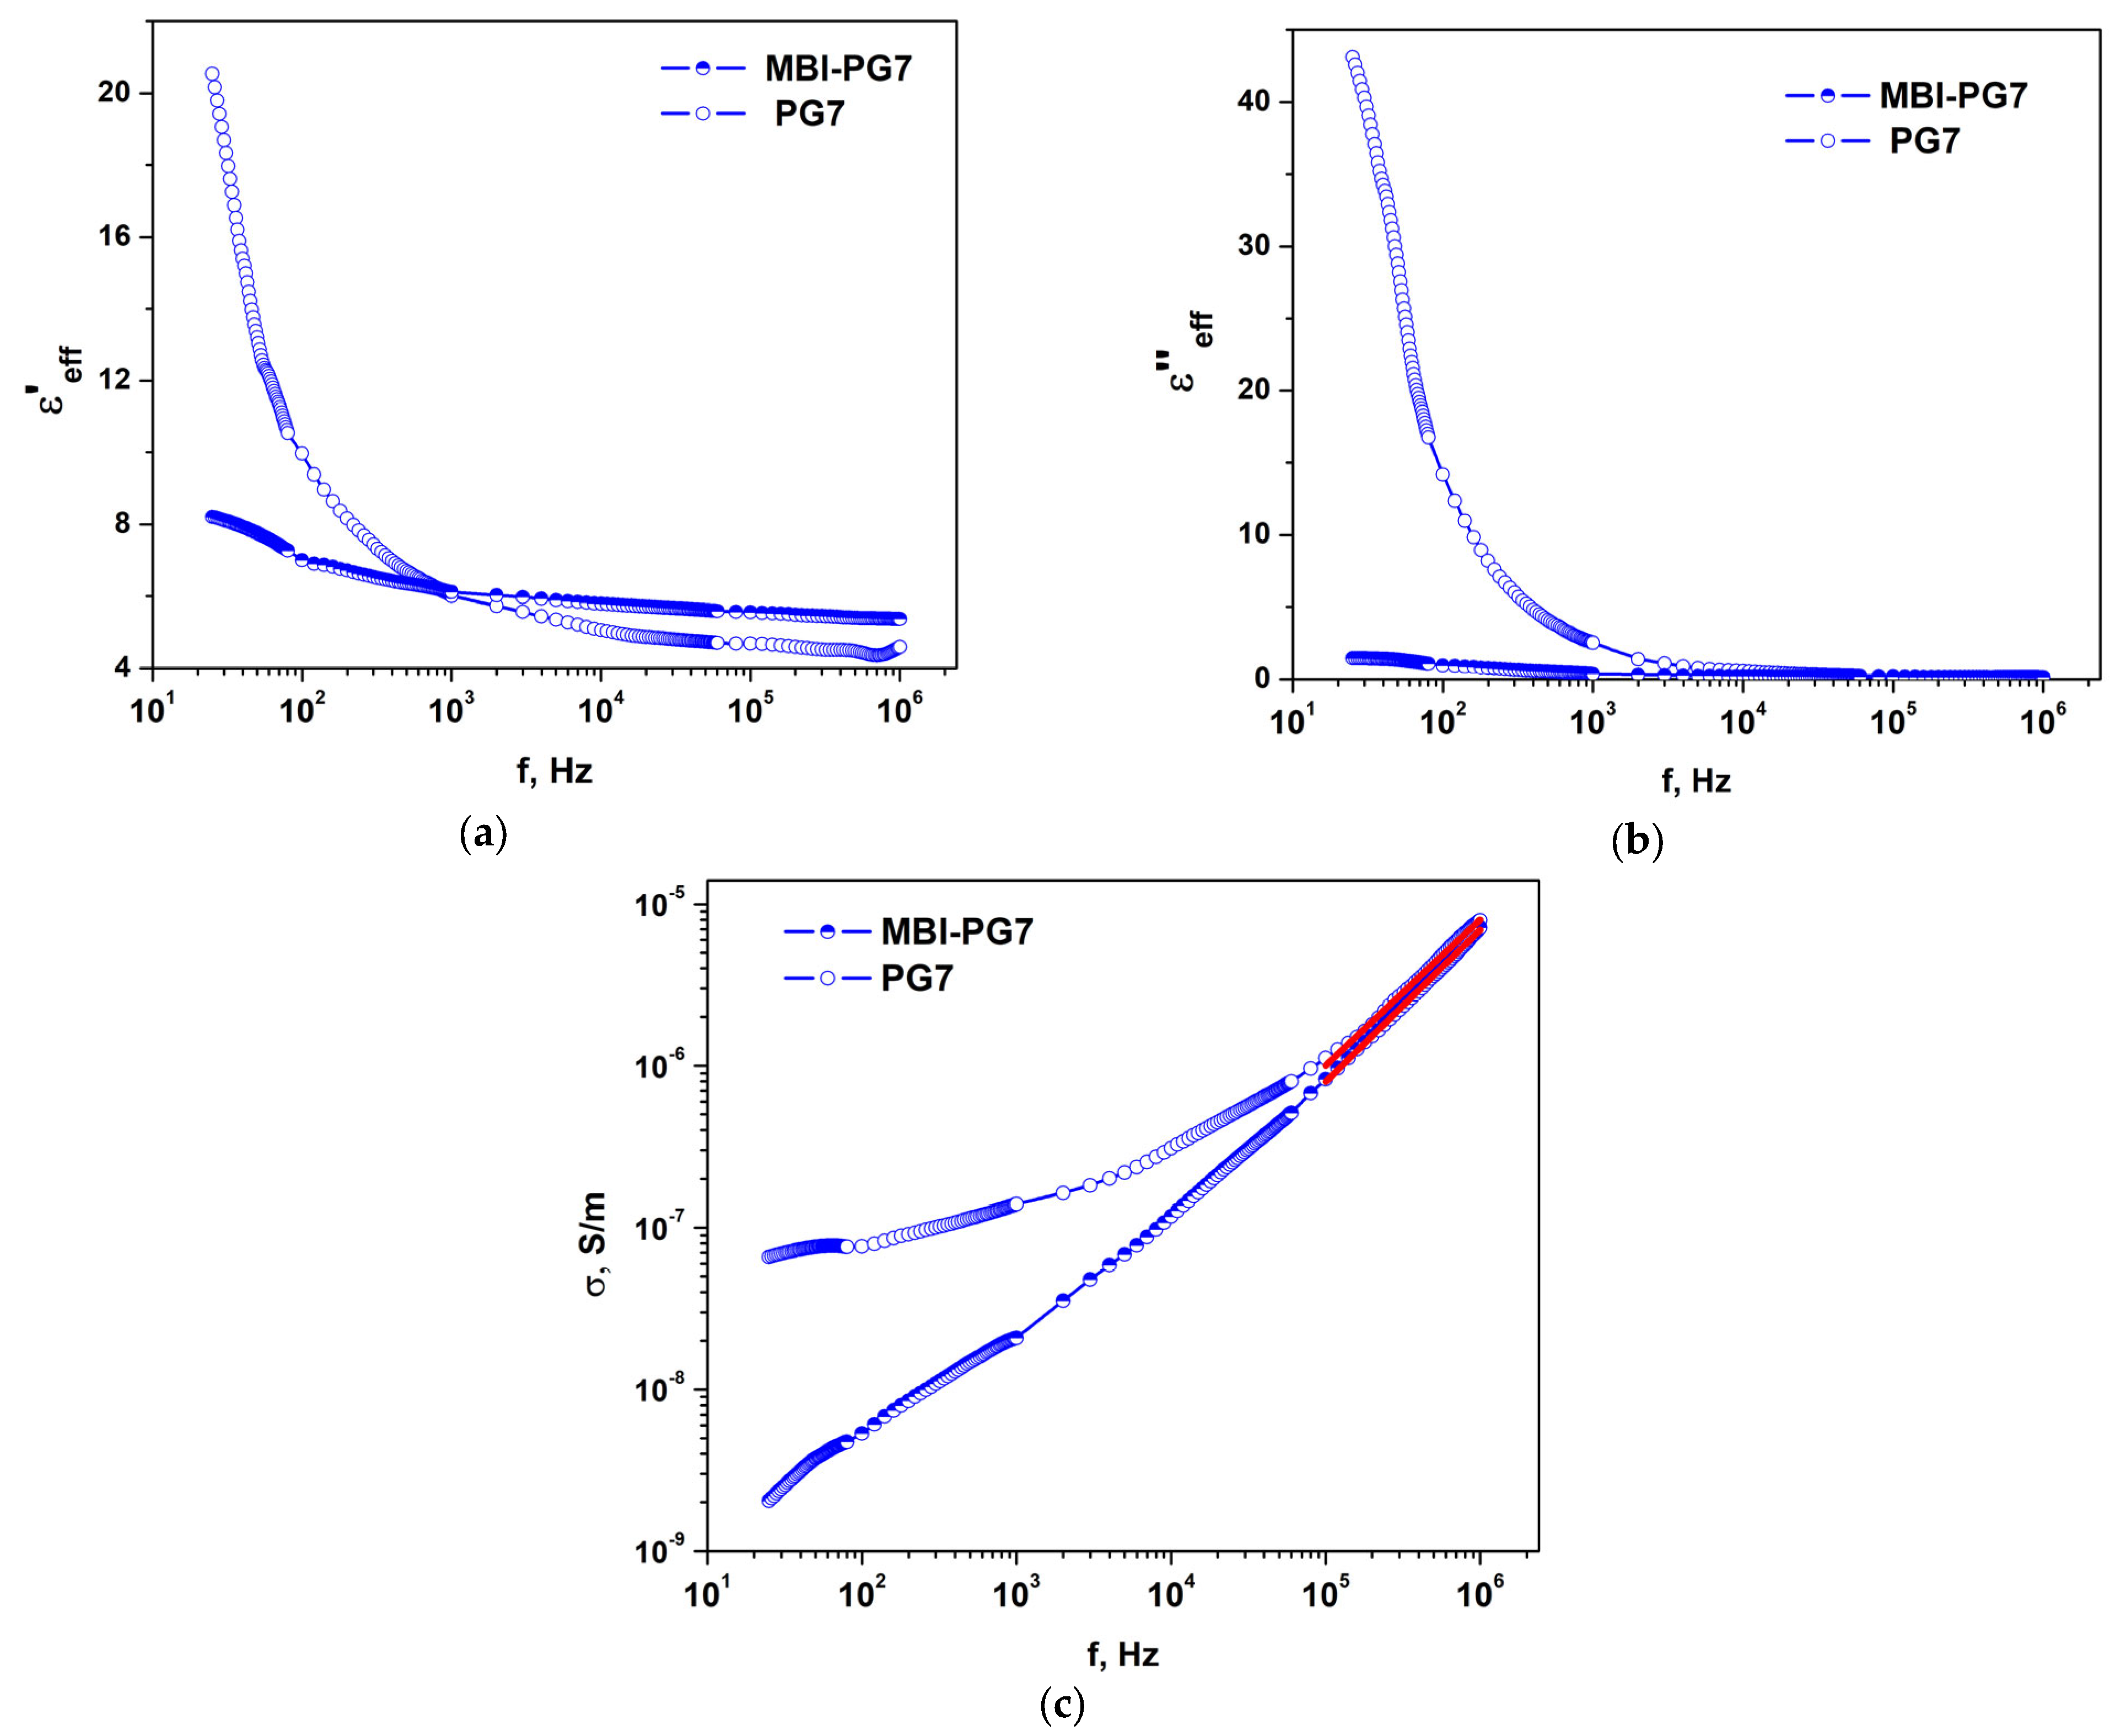
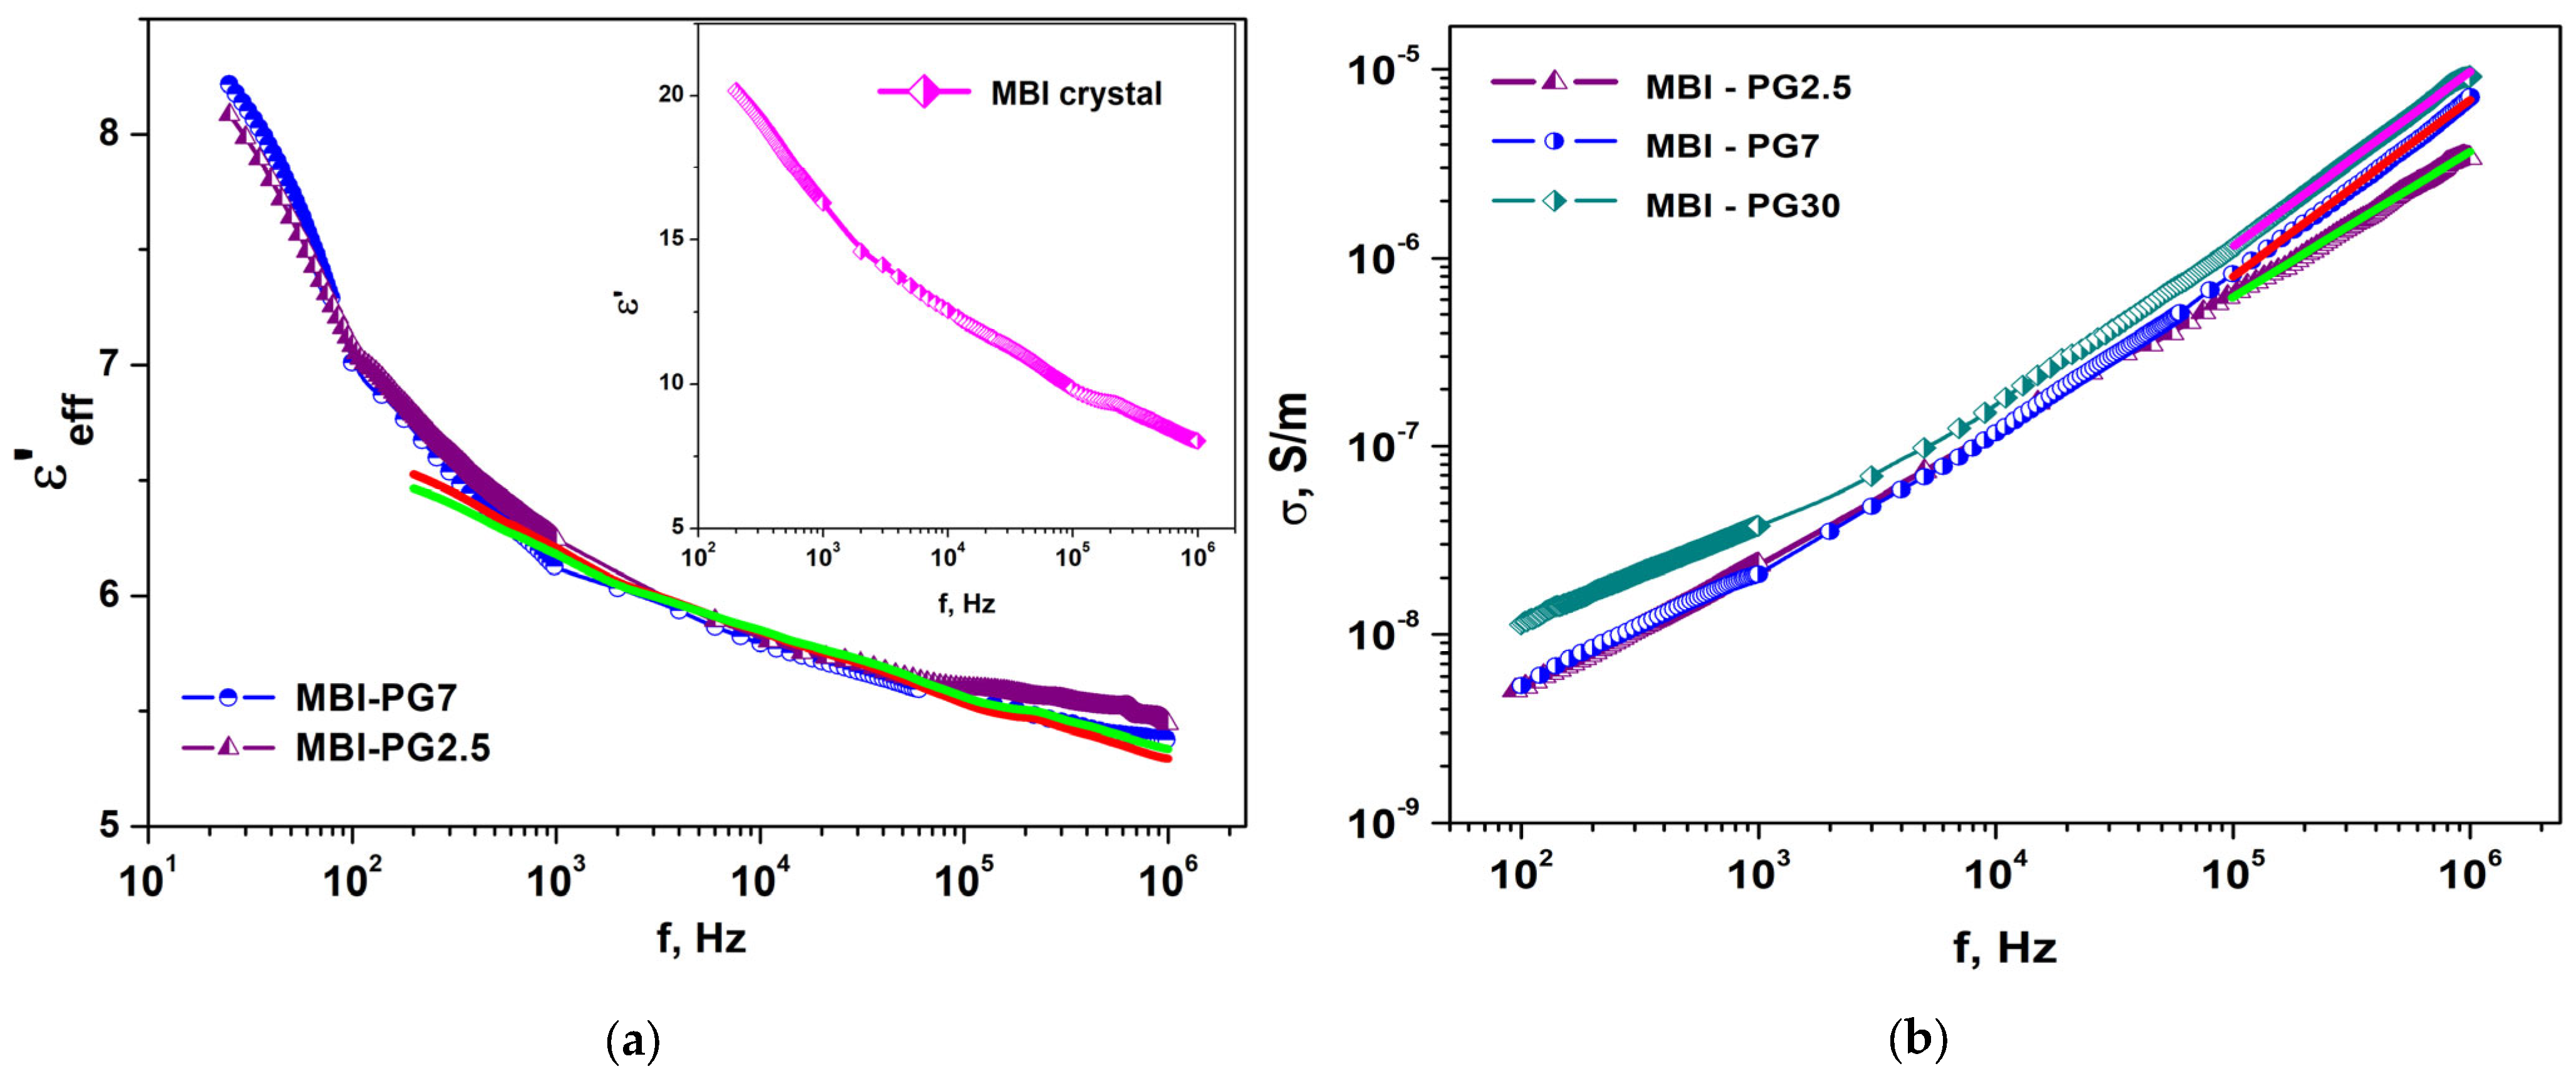
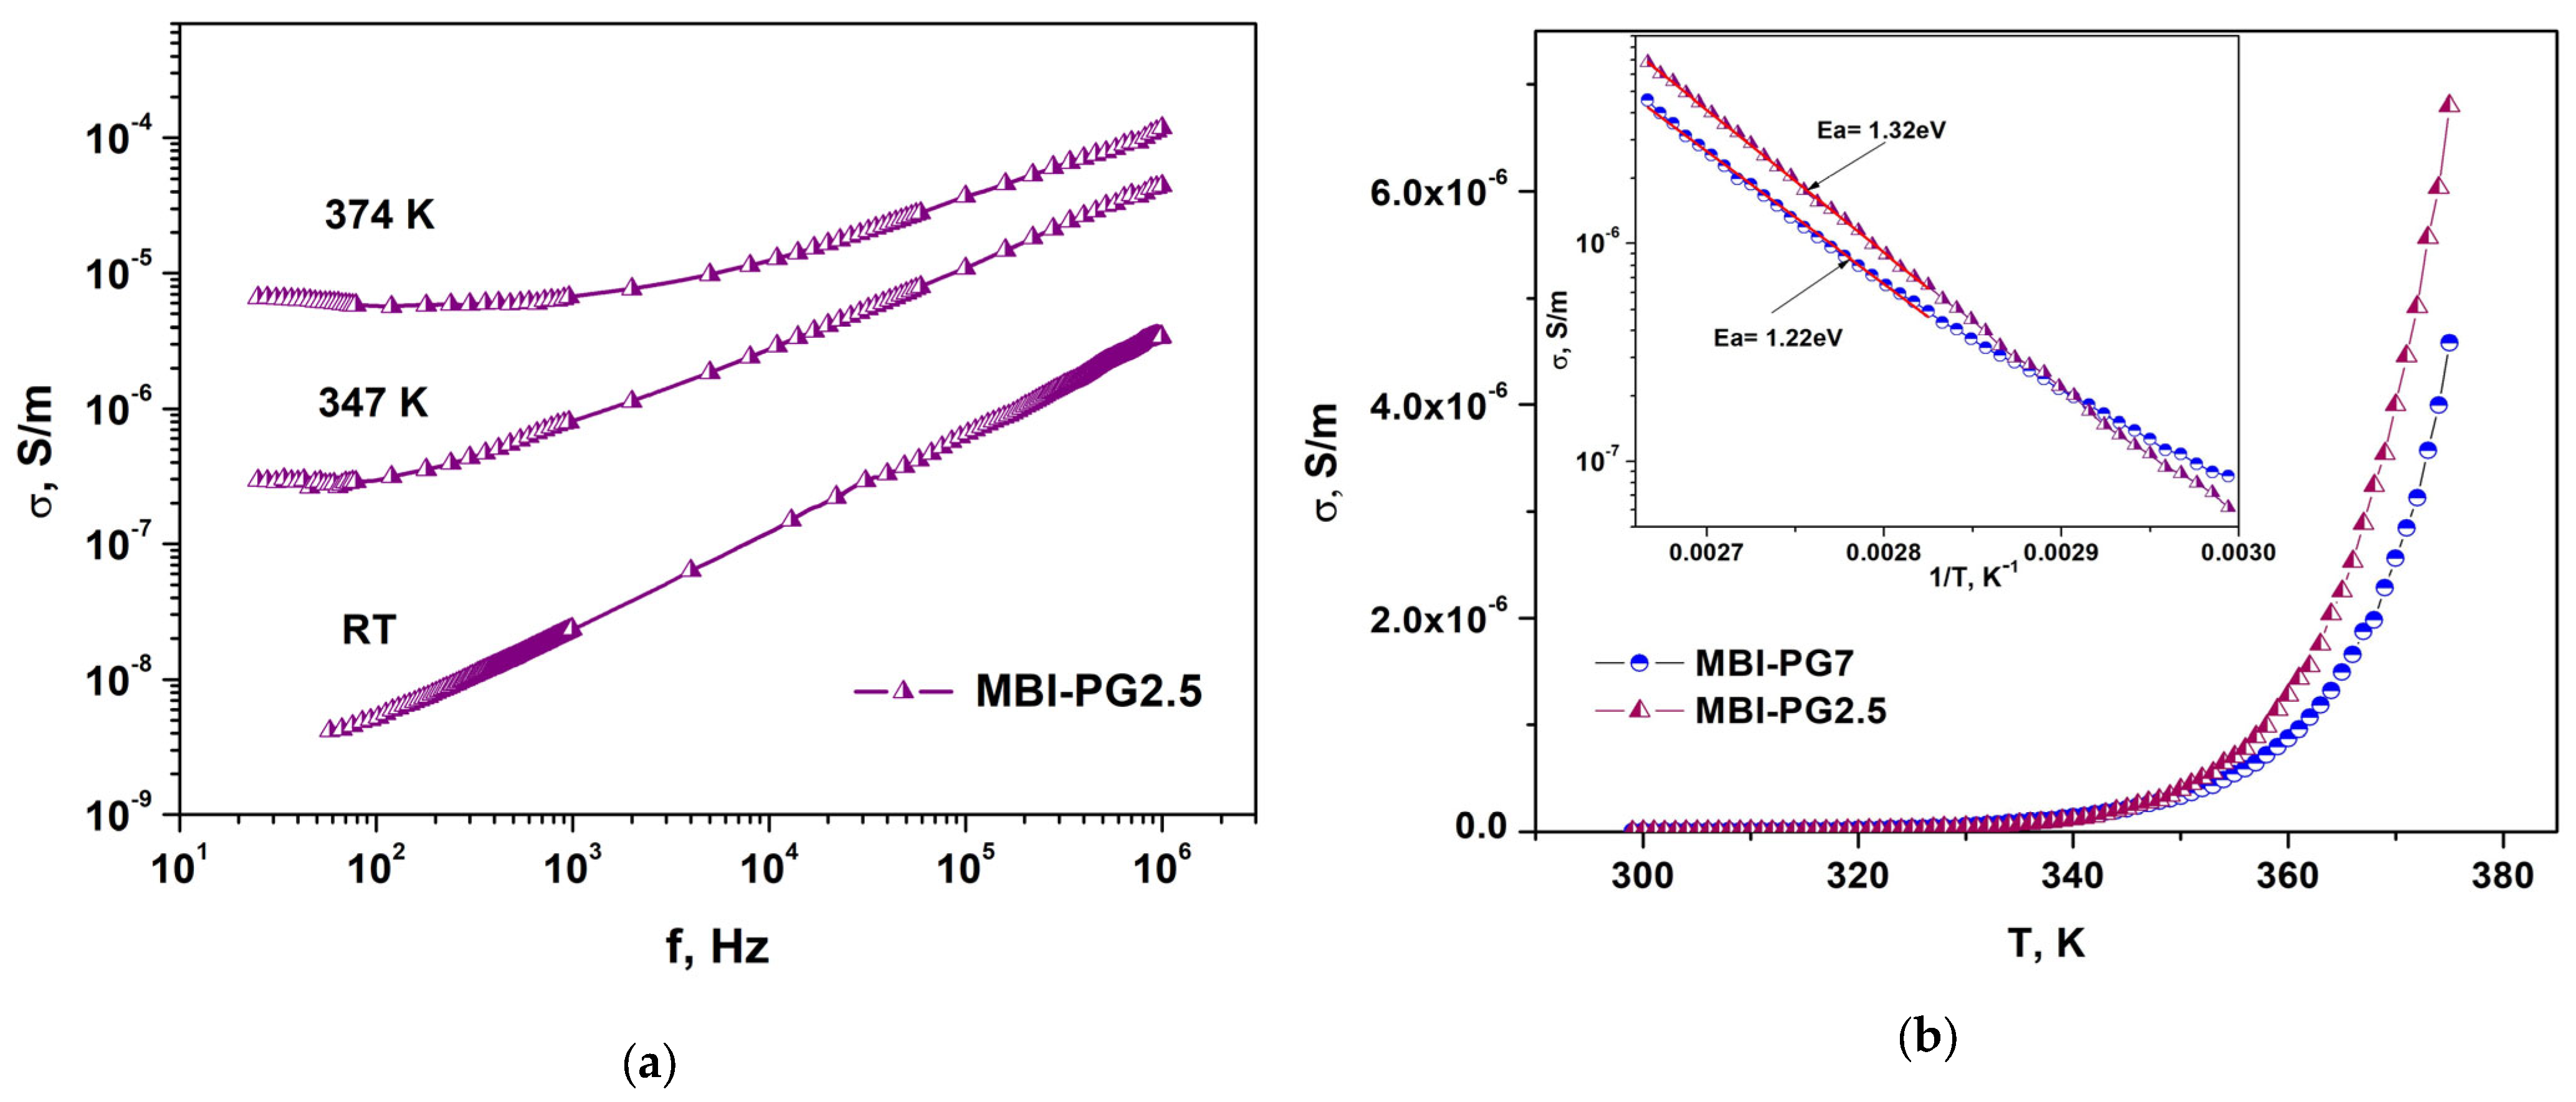
2.3.2. MBI in PG
2.3.3. Calculations
3. Materials and Methods
3.1. Sample Preparation
3.2. Details of X-ray Diffraction Experiment and Analysis
3.2.1. Measurement of XRD Patterns
3.2.2. Determination of Microstructure Parameters from XRD Patterns by Methods of Analyzing the Profiles of Observed XRD Reflections
3.2.3. Rietveld Quantitative Analysis
3.2.4. Le Bail Fitting
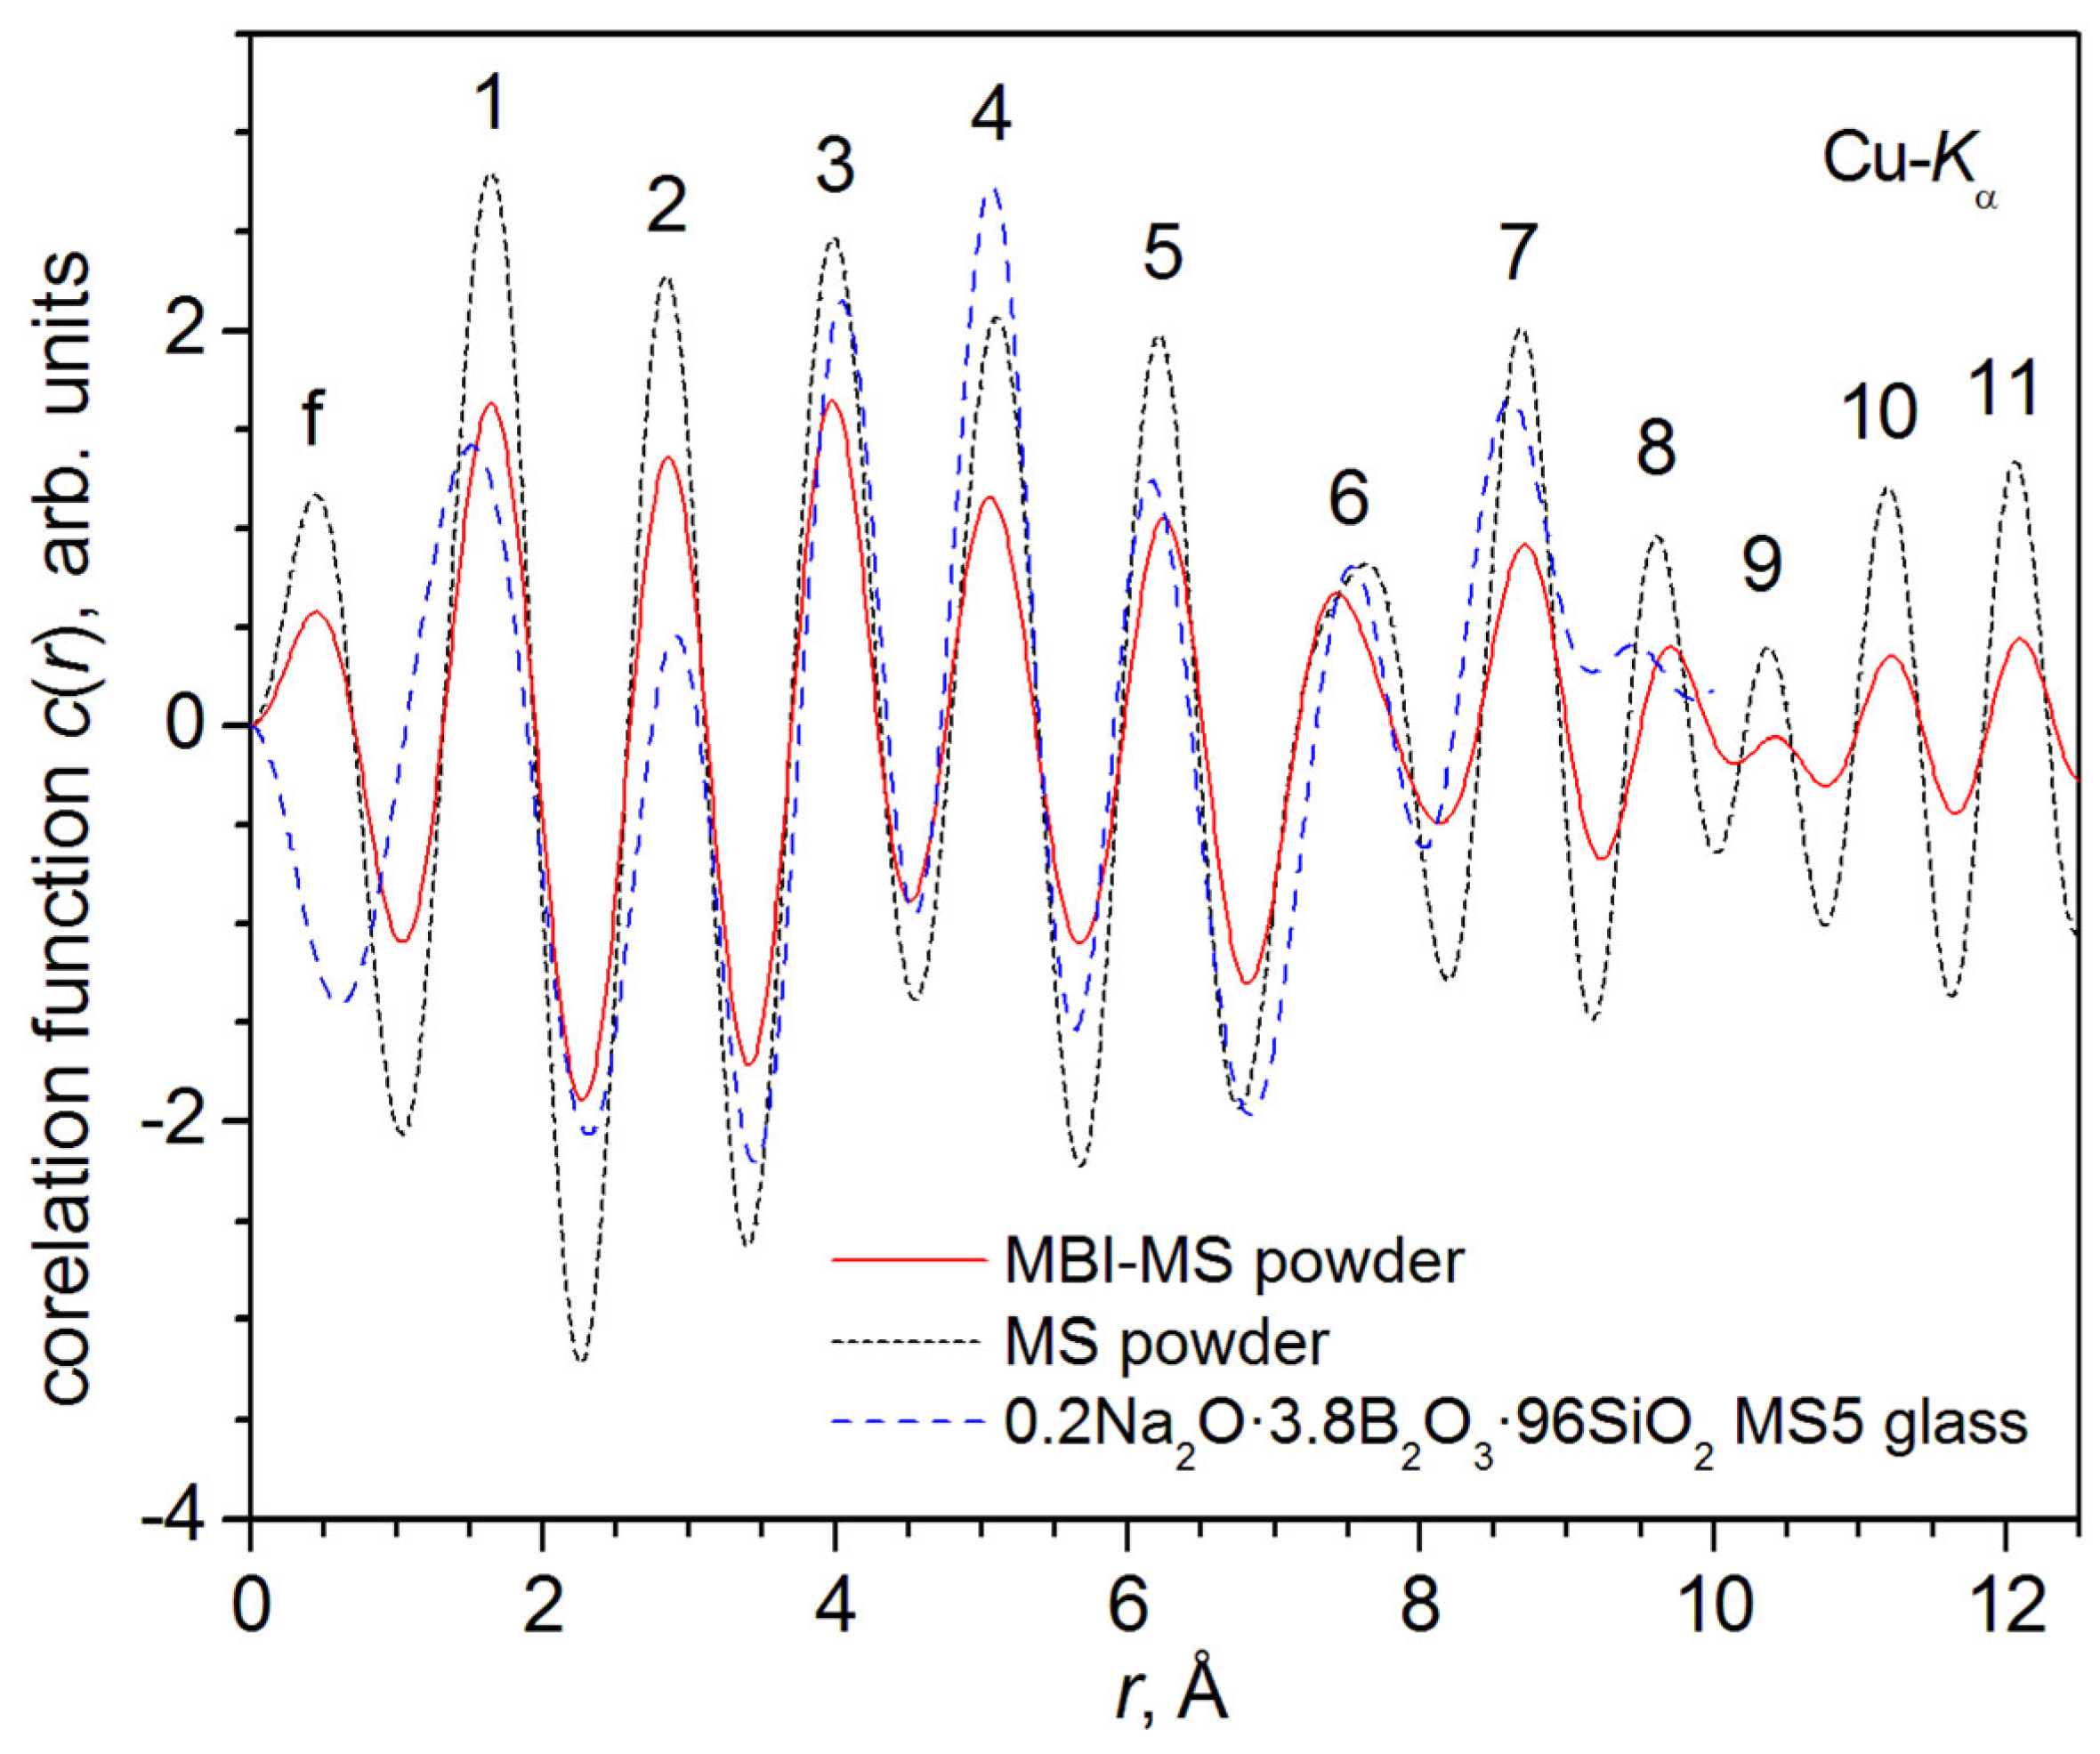
3.2.5. Calculation of Correlation Function
3.3. Optical and Dielectric Measurements
4. Conclusions
Supplementary Materials
Author Contributions
Funding
Institutional Review Board Statement
Informed Consent Statement
Data Availability Statement
Acknowledgments
Conflicts of Interest
Abbreviations
| MBI | 2-methylbenzimidazole or C8H8N2 |
| Dpore | characteristic pore or tube diameter |
| dmol | maximum molecular size of MBI |
| D | characteristic size of crystallites |
| a | MBI lattice parameter |
| c | MBI lattice parameter |
| Vcell | unit cell volume |
| PG | borate porous glasses |
| ChA | chrysotile asbestos |
| MS | mesoporous silica |
| PG2.5 | PG with a pore diameter of 2.5 nm |
| PG7 | PG with a pore diameter of 2.5 nm and 7 nm |
| MBI-PG2.5 | PG2.5 filled by MBI from melt |
| MBI-PG7 | PG7 filled by MBI from melt |
| MBI-PG7g | PG7 filled by MBI from gas |
| MBI-MS | mesoporous silica filled by MBI |
| PL | photoluminescence |
| Phases in MBI PG2.5 | |
| MBI-PG2.5L | MBI phase Large |
| MBI-PG2.5M | MBI phase Mean |
| MBI-PG2.5S | MBI phase Small |
| Phases in MBI-PG7 | |
| MBI-PG7L | MBI phase Large |
| MBI-PG7M1 | MBI phase Mean1 |
| MBI-PG27M2 | MBI phase Mean2 |
| MBI-PG7S | MBI phase Small |
| Phases in MBI-ChA | |
| MBI-ChA1 | MBI phase 1 |
| MBI-ChA2 | MBI phase 2 |
| Eph | photon energy |
| f, ω | frequency, ω = 2πf |
| εeff | effective permittivity |
| tgδ | dielectric loss |
| σ | conductivity |
References
- Alshammari, B.H.; Lashin, M.M.A.; Mahmood, M.A.; Al-Mubaddel, F.S.; de Nasir Ilyas, R.N.; Sohail, M.; Khan, A.; Abdullaev, S.S.; Khan, R. Organic and inorganic nanomaterials: Fabrication, properties and applications. RSC Adv. 2023, 13, 13735. [Google Scholar] [CrossRef] [PubMed]
- Zeijl, H.W. Thin Film Technologies for Micro/Nano Systems; A Review. ECS Trans. 2014, 61, 191–206. [Google Scholar] [CrossRef]
- Plawsky, J.L.; Fedorov, A.G.; Garimella, S.V.; Ma, H.B.; Maroo, S.C.; Chen, L.; Nam, Y. Nano-and Microstructures for Thin-Film Evaporation—A Review. Nanoscale Microscale Thermophys. Eng. 2014, 18, 251–269. [Google Scholar] [CrossRef]
- Krishnamoorthy, G.; Chidambaram, R. Nanostructured thin films and nanocoatings. In Micro and Nano Technologies, Emerging Applications of Nanoparticles and Architecture Nanostructures; Barhoum, A., Makhlouf, A.A.S., Eds.; Elsevier: Amsterdam, The Netherlands, 2018; pp. 533–552. ISBN 9780323512541. [Google Scholar] [CrossRef]
- Bune, A.V.; Fridkin, V.M.; Ducharme, S.; Blinov, L.M.; Palto, S.P.; Sorokin, A.V.; Yudin, S.G.; Zlatkin, A. Two-dimensional ferroelectric films. Nature 1998, 391, 874–877. [Google Scholar] [CrossRef]
- Agarwal, P.; Qi, H.; Archer, L.A. The Ages in a Self-Suspended Nanoparticle Liquid. Nano Lett. 2010, 10, 111–115. [Google Scholar] [CrossRef]
- Wells, J.; Kazakova, J.; Posth, O.; Steinhoff, U.; Petronis, S.; Bogart, L.K.; Southern, P.; Pankhurst, Q.; Johansson, C. Standardisation of magnetic nanoparticles in liquid suspension. J. Phys. D Appl. Phys. 2017, 50, 383003. [Google Scholar] [CrossRef]
- Pergher, S.; Rodríguez-Castellón, E. Nanoporous Materials and Their Applications. Appl. Sci. 2019, 9, 1314. [Google Scholar] [CrossRef]
- Sivasankaran, S. (Ed.) Nanocomposites Recent Evolutions. In Open Access Peer-Reviewed Edited Volume; IntechOpen: London, UK, 2019. [Google Scholar] [CrossRef]
- Sharma, A.K.; Priya; Kaith, B.S. Polymer Nanocomposite Matrices: Classification, Synthesis Methods, and Applications. In Handbook of Polymer and Ceramic Nanotechnology; Hussain, C.M., Thomas, S., Eds.; Springer: Cham, Switzerland, 2021. [Google Scholar] [CrossRef]
- Bréchet, Y.; Cavaillé, J.Y.Y.; Chabert, E.; Chazeau, L.; Dendievel, R.; Flandin, L.; Gauthier, C. Polymer based nanocomposites: Effect of filler-filler and filler-matrix interactions. Adv. Eng. Mater. 2001, 3, 571–577. [Google Scholar] [CrossRef]
- Popov, V.N. Carbon Nanotubes: Properties and Application. Mater. Sci. Eng. R Rep. 2004, 43, 61–102. [Google Scholar] [CrossRef]
- Lin, Y.; Taylor, S.; Li, H.; Fernando, K.A.S.; Qu, L.; Wang, W.; Gu, L.; Zhou, B.; Sun, Y.P. Advances toward Bioapplications of Carbon Nanotubes. J. Mater. Chem. 2004, 14, 527–541. [Google Scholar] [CrossRef]
- Vasconcelos, A.A.; Len, T.; de Nazaré de Oliveira, A.; da Costa, A.A.F.; da Costa, C.E.F.; Luque, R.; da Rocha Filho, G.N.; Noronha, R.C.R.; do Nascimento, L.A.S. Zeolites: A Theoretical and Practical Approach with Uses in (Bio) Chemical Processes. Appl. Sci. 2023, 13, 1897. [Google Scholar] [CrossRef]
- Rahaman, M.N.; Liang, W.; Day, D.E. Preparation and Bioactive Characteristics of Porous Borate Glass Substrates. In Advances in Bioceramics and Biocomposites: Ceramic Engineering and Science Proceedings; Mizuno, M., Ed.; The American Ceramic Society: Westerville, OH, USA, 2005. [Google Scholar] [CrossRef]
- Ege, D.; Zheng, K.; Boccaccini, A.R. Borate Bioactive Glasses (BBG): Bone Regeneration, Wound Healing Applications, and Future Directions. ACS Appl. Bio Mater. 2022, 5, 3608–3622. [Google Scholar] [CrossRef] [PubMed]
- Pye, A.M. A review of asbestos substitute materials in industrial applications. J. Hazard. Mater. 1979, 3, 125–147. [Google Scholar] [CrossRef]
- Porrang, S.; Davaran, S.; Rahemi, N.; Allahyari, S.; Mostafavi, E. How Advancing are Mesoporous Silica Nanoparticles? A Comprehensive Review of the Literature. Int. J. Nanomed. 2022, 17, 1803–1827. [Google Scholar] [CrossRef]
- Niculescu, V.-C. Mesoporous Silica Nanoparticles for Bio-Applications. Front. Mater. 2020, 7, 36. [Google Scholar] [CrossRef]
- Atwood, J.L.; Steed, J.W. (Eds.) Organic Nanostructures; John Wiley & Sons: Hoboken, NJ, USA, 2008; 370p, ISBN 978-3-527-31836-0. [Google Scholar]
- O’Carrol, D.M. Organic photonic nanostructures. In Handbook of Organic Materials for Electronic and Photonic Devices, 2nd ed.; Woodhead Publishing Series in Electronic and Optical Materials; Woodhead Publishing: Cambridge, UK, 2019; pp. 111–138. [Google Scholar]
- Al-Shamery, K.; Rubahn, H.-G.; Sitter, H. Organic Nanostructures for Next Generation Devices, 2nd ed.; Woodhead Publishing Series in Electronic and Optical Materials; Woodhead Publishing: Cambridge, UK, 2019; pp. 111–138. [Google Scholar]
- Lombardo, D.; Pasqua, L.; Magazù, S. Self-Assembly of Organic Nanomaterials and Biomaterials: The Bottom-Up Approach for Functional Nanostructures Formation and Advanced Applcations. Materials 2020, 13, 1048. [Google Scholar] [CrossRef]
- Balashova, E.; Levin, A.A.; Davydov, V.; Smirnov, A.; Starukhin, A.; Pavlov, S.; Krichevtsov, B.; Zolotarev, A.; Zhang, H.; Li, F.; et al. Croconic Acid Doped Glycine Single Crystals: Growth, Crystal Structure, UV-Vis, FTIR, Raman and Photoluminescence Spectroscopy. Crystals 2022, 12, 1342. [Google Scholar] [CrossRef]
- Kermani, F.; Nazarnezhad, S.; Mollaei, Z.; Mollazadeh, S.; Ebrahimzadeh-Bideskan, A.; Askari, V.R.; Oskuee, R.K.; Moradi, A.; Hosseini, S.A.; Azari, Z.; et al. Zinc-and Copper-Doped Mesoporous Borate Bioactive Glasses: Promising Additives for Potential Use in Skin Wound Healing Applications. Int. J. Mol. Sci. 2023, 24, 1304. [Google Scholar] [CrossRef]
- Wang, H.; Cheng, Z.; Zhang, P.; Ye, J.; Ding, L.; Jia, W. Ultra-high adsorption behavior of zeolitic imidazole framework-67 nanoparticles for removing brilliant green dye. AIP Adv. 2021, 11, 095304. [Google Scholar] [CrossRef]
- Kumzerov, Y.; Vakhrushev, S. Nanostructures within porous materials. In Encyclopedia of Nanoscience and Nanotechnology; Nalwa, H.S., Ed.; American Scientific Publishers: Los Angeles, CA, USA, 2004; Volume 3, pp. 811–849. [Google Scholar]
- Obodovskaya, A.E.; Starikova, Z.A.; Belous, S.N.; Pokrovskaya, I.E. Crystal and molecular structure of 2-methylbenzimidazole. J. Struct. Chem. 1991, 32, 421–422. [Google Scholar] [CrossRef]
- Horiuchi, S.; Kagawa, F.; Hatahara, K.; Kobayashi, K.; Kumai, R.; Murakami, Y.; Tokura, Y. Above-room-temperature ferroelectricity and antiferroelectricity in benzimidazoles. Nat. Commun. 2012, 3, 1308. [Google Scholar] [CrossRef]
- Balashova, E.V.; Krichevtsov, B.B.; Kunkel, T.S.; Ankudinov, A.V. AFM Visualization of Ferroelastic and Ferroelectric Domains in 2-Methylbenzimidazole C8H8N2 Crystals. J. Surf. Investig. X-ray Synchrotron Neutron Tech. 2021, 15, 1165–1167. [Google Scholar] [CrossRef]
- Balashova, E.V.; Svinarev, F.B.; Ankudinov, A.V.; Pankova, G.A.; Lityagin, G.A.; Kunkel, T.S.; Krichevtsov, B.B. Polarization switching, dielectric, structural and elastic properties of 2-Methylbenzimidazole crystals and films. Ferroelectrics. 2019, 538, 74–82. [Google Scholar] [CrossRef]
- Svinarev, F.B.; Balashova, E.V.; Krichevtsov, B.B. Dielectric properties of self-assembled spherulite films of organic ferroelectric 2-methylbenzimidazole. Ferroelectrics 2019, 543, 167–174. [Google Scholar] [CrossRef]
- Yuan, Y.; Ni, Y.; Jiang, X.; Yun, Y.; Li, J.; Xu, X. Highly Oriented Organic Ferroelectric Films with Single-Crystal-Level Properties from Restrained Crystallization. Cryst. Growth Des. 2022, 22, 2124–2131. [Google Scholar] [CrossRef]
- Noda, Y.; Yamada, T.; Kobayashi, K.; Kumai, R.; Horiuchi, S.; Kagawa, F.; Hasegawa, T. Few-Volt Operation of Printed Organic Ferroelectric Capacitor. Adv. Mater. 2015, 27, 6475. [Google Scholar] [CrossRef]
- Kinoshita, Y.; Sotome, M.; Miyamoto, T.; Uemura, Y.; Arai, S.; Horiuchi, S.; Hasegawa, T.; Okamoto, H.; Kida, N. Observation of the Three-Dimensional Polarization Vector in Films of Organic Molecular Ferroelectrics Using Terahertz Radiation Emission. Phys. Rev. Appl. 2020, 14, 054002. [Google Scholar] [CrossRef]
- Langford, J.I.; Cernik, R.J.; Louer, D. The Breadth and Shape of Instrumental Line Profiles in High-Resolution Powder Diffraction. J. Appl. Phys. 1991, 24, 913–919. [Google Scholar] [CrossRef]
- Levin, A.A. Program SizeCr for Calculation of the Microstructure Parameters from X-ray Diffraction Data. Preprint. 2022. Available online: https://www.iucr.org/resources/other-directories/software/sizecr (accessed on 1 October 2022).
- Hahn, T. International Tables for Crystallography. Volume A. Space Group Symmetry; D. Reidel Publishing Company: Dordrecht, The Netherlands; Boston, MA, USA, 1983; pp. 344–345. [Google Scholar]
- Kraus, W.; Nolze, G. POWDER CELL—A program for the representation and manipulation of crystal structures and calculation of the resulting X-ray powder patterns. J. Appl. Crystallogr. 1996, 29, 301–303. [Google Scholar] [CrossRef]
- Fokin, A.V.; Kumzerov, Y.A.; Okuneva, N.M.; Naberezhnov, A.A.; Vakhrushev, S.B.; Golosovsky, I.V.; Kurbakov, A.I. Temperature Evolution of Sodium Nitrite Structure in a Restricted Geometry. Phys. Rev. Lett. 2002, 89, 175503. [Google Scholar] [CrossRef]
- Golosovsky, I.V.; Delaplane, R.G.; Naberezhnov, A.A.; Kumzerov, Y.A. Thermal motions in lead confined within porous glass. Phys. Rev. B 2004, 69, 132301. [Google Scholar] [CrossRef]
- Golosovsky, I.V.; Smirnov, O.P.; Delaplane, R.G.; Wannberg, A.; Kibalin, Y.A.; Naberezhnov, A.A.; Vakhrushev, S.B. Atomic motion in Se nanoparticles embedded into a porous glass matrix. Eur. Phys. J. 2006, B54, 211–216. [Google Scholar] [CrossRef]
- Le Bail, A.; Duroy, H.; Fourquet, J.L. Ab-initio structure determination of LiSbWO6 by X-ray powder diffraction. Mater. Res. Bull. 1988, 23, 447–452. [Google Scholar] [CrossRef]
- Paufler, P.; Filatov, S.K.; Shakhverdova, I.P.; Bubnova, R.S.; Reibold, M.; Müller, B.; Levin, A.A.; Meyer, D.C. Mechanical properties and structure of a nanoporous sodium borosilicate glass. Glass Phys. Chem. 2007, 33, 187–198. [Google Scholar] [CrossRef]
- Spectral Database for Organic Compounds, SDBS. National Institute of Advanced Industrial Science and Technology (AIST) Japan. Available online: https://sdbs.db.aist.go.jp (accessed on 1 October 2022).
- Güllüoglu, M.T.; Özduran, M.; Kurt, M.; Kalaichelvan, S.; Sundaraganesan, N. Molecular structure and vibrational spectra of 2- and 5-methylbenzimidazole molecules by density functional theory. Spectrochim. Acta Part A Mol. Biomol. Spectrosc. 2010, 76, 107–114. [Google Scholar] [CrossRef] [PubMed]
- Anbalagan, G.; SakthiMurugesan, K.; Balakrishnan, M.; Gunasekaran, S. Structural analysis, optical absorption and EPR spectroscopic studies on chrysotile. Appl. Clay Sci. 2008, 42, 175–179. [Google Scholar] [CrossRef]
- Frost, R.L.; Scholz, R.; Belotti, F.M.; López, A.; Theiss, F.L. A vibrational spectroscopic study of the phosphate mineral vantasselite Al4(PO4)3(OH)39H2O. Spectrochim. Acta A Mol. Biomol. Spectrosc. 2015, 147, 185–192. [Google Scholar] [CrossRef] [PubMed]
- Balashova, E.V.; Svinarev, F.B.; Zolotarev, A.A.; Levin, A.A.; Brunkov, P.N.; Davydov, V.Y.; Smirnov, A.N.; Redkov, A.V.; Pankova, G.A.; Krichevtsov, B.B. Crystal structure, Raman spectroscopy and dielectric properties of new semi-organic crystals based on 2-methylbenzimidazole. Crystals 2019, 9, 573. [Google Scholar] [CrossRef]
- Bartoš, J.; Arrese-Igor, S.; Švajdlenková, H.; Kleinová, A.; Alegría, A. Dynamics of Confined Short-Chain alkanol in MCM-41 by Dielectric Spectroscopy: Effects of matrix and system Treatments and Filling Factor. Polymers 2020, 12, 610. [Google Scholar] [CrossRef]
- Chen, D.; Wang, H.J. HOMO-LUMO Gaps of Homogeneous Polycyclic Aromatic Hydrocarbon Clusters. Phys. Chem. C 2019, 123, 27785–27793. [Google Scholar] [CrossRef]
- Gutina, A.; Axelrod, E.; Puzenko, A.; Rysiakiewicz-Pasek, E.; Kozlovich, N.; Feldman, Y. Dielectric relaxation of porous glasses. J. Non-Cryst. Solids 1998, 235–237, 302–307. [Google Scholar] [CrossRef]
- Datta, A.K.; Bhattacherjee, S. An electrical study of chrysotile asbestos. J. Mater. Sci. 1986, 21, 1041–1045. [Google Scholar] [CrossRef]
- Sherman, V.O.; Tagantsev, A.K.; Setter, N. Ferroelectric-dielectric tunable composites. J. Appl. Phys. 2006, 99, 074104. [Google Scholar] [CrossRef]
- Bruggeman, D.A.G. Dielectric constant and conductivity of mixtures of isotropic materials. Ann. Phys. 1935, 24, 636–679. [Google Scholar] [CrossRef]
- Jonscher, A.K. The ‘universal’ dielectric response. Nature 1977, 267, 673–679. [Google Scholar] [CrossRef]
- Jonscher, A.K. A new understanding of the dielectric relaxation of solids. J. Mater. Sci. 1981, 16, 2037–2060. [Google Scholar] [CrossRef]
- Pike, G.E. ac Conductivity of Scandium Oxide and a New Hopping Model for Conductivity. Phys. Rev. B 1972, 6, 1572. [Google Scholar] [CrossRef]
- Hutton, S.L.; Fehst, I.; Böhmer, R.; Braune, M.; Mertz, B.; Lunkenheimer, P.; Loidl, A. Proton glass behavior and hopping conductivity in solid solutions of antiferroelectric betaine phosphate and ferroelectric betaine phosphite. Phys. Rev. Lett. 1991, 66, 1990. [Google Scholar] [CrossRef]
- Totz, J.; Michel, D.; Banys, J.; Klopperpieper, A. Conductivity processes in deuterated betaine phosphate1−xbetaine phosphitex mixed crystals. J. Phys. Condens. Matter 1998, 10, 9281–9292. [Google Scholar] [CrossRef]
- Balashova, E.; Levin, A.A.; Fokin, A.; Redkov, A.; Krichevtsov, B. Structural Properties and Dielectric Hysteresis of Molecular Organic Ferroelectric Grown from Different Solvents. Crystals 2021, 11, 1278. [Google Scholar] [CrossRef]
- Morimoto, S. Porous Glass: Preparation and Properties. Key Engineering Materials; Trans Tech Publications, Ltd.: Stafa-Zurich, Switzerland, 1995; Volume 115, pp. 147–158. [Google Scholar] [CrossRef]
- Zhu, B.; Zhang, Z.; Zhang, W.; Wu, Y.; Zhang, J.; Imran, Z.; Zhang, D. Synthesis and Applications of Porous Glass. J. Shanghai Jiaotong Univ. Sci. 2019, 24, 681–698. [Google Scholar] [CrossRef]
- Inayat, A.; Reinhardt, B.; Jan Herwig, J.; Küster, C.; Uhlig, H.; Krenkel, S.; Edda Raedlein, E.; Enke, D. Recent advances in the synthesis of hierarchically porous silica materials on the basis of porous glasses. New J. Chem. 2016, 40, 4095–4114. [Google Scholar] [CrossRef]
- Trofimova, E.Y.; Kurdyukov, D.A.; Yakovlev, S.A.; Kirilenko, D.A.; Kukushkina, Y.A.; Nashchekin, A.V.; Sitnikova, A.A.; Yagovkina, M.A.; Golubev, V.G. Monodisperse spherical mesoporous silica particles: Fast synthesis procedure and fabrication of photonic-crystal films. Nanotechnology 2013, 24, 155601. [Google Scholar] [CrossRef]
- Diffrac. Suite Eva, Version 5.1.0.5; Bruker AXS: Karlsruhe, Germany, 2019.
- International Centre for Diffraction Data (ICDD). Powder Diffraction File-2 Release 2014; ICDD: Newton Square, PA, USA, 2014. [Google Scholar]
- Bruker AXS. Technical reference. In TOPAS Version 5; Bruker AXS: Karlsruhe, Germany, 2014. [Google Scholar]
- Rehani, B.R.; Joshi, P.B.; Lad, K.N.; Pratap, A. Crystallite size estimation of elemental and composite silver nano-powders using XRD principles. Indian J. Pure Appl. Phys. 2006, 44, 157–161. [Google Scholar]
- Stokes, A.R.; Wilson, A.J.C. The diffraction of X-rays by distorted crystal aggregates. Proc. Phys. Soc. Lond. 1944, 56, 174–181. [Google Scholar] [CrossRef]
- Scherrer, P. Bestimmung der Grösse und der inneren Struktur von Kolloidteilchen mittels Röntgenstrahlen. Nachr. Königl. Ges. Wiss. Göttingen. 1918, 26, 98–100. [Google Scholar]
- Maunders, C.; Etheridge, J.; Wright, N.; Whitfield, H.J. Structure and microstructure of hexagonal Ba3Ti2RuO9 by electron diffraction and microscopy. Acta Cryst. B 2005, 61, 154–159. [Google Scholar] [CrossRef]
- Rietveld, H.M. Line profiles of neutron powder-diffraction peaks for structure Refinement. Acta Crystallogr. 1967, 22, 151–152. [Google Scholar] [CrossRef]
- Cambridge Crystallographic Data Center (CCDC). Available online: https://www.ccdc.cam.ac.uk/about-us/ (accessed on 8 October 2022).
- Rietveld, H.M. The Rietveld Method: A retrospection. Z. Kristallogr. 2010, 225, 545–547. [Google Scholar] [CrossRef]
- Berger, H. Study of the K alpha emission spectrum of copper. X-ray Spectrom. 1986, 15, 241–243. [Google Scholar] [CrossRef]
- Hall Jnr, M.M.; Veeraraghavan, V.G.; Rubin, H.; Winchell, P.G. The approximation of symmetric X-ray peaks by Pearson type VII distributions. J. Appl. Crystallogr. 1977, 10, 66–68. [Google Scholar] [CrossRef]
- Cheary, R.W.; Coelho, A.A. A fundamental parameters approach to X-ray line-profile fitting. J. Appl. Crystallogr. 1992, 25, 109–121. [Google Scholar] [CrossRef]
- Balzar, D. Voigt-function model in diffraction line-broadening analysis. In Defect and Microstructure Analysis by Diffraction; Snyder, R.L., Fiala, J., Bunge, H.J., Eds.; IUCr, Oxford University Press: Oxford, UK, 1999; pp. 94–126. [Google Scholar]
- Dollase, W.A. Correction of Intensities of Preferred Orientation in Powder Diffractometry: Application of the March Model. J. Appl. Crystallogr. 1986, 19, 267–272. [Google Scholar] [CrossRef]
- Jarvinen, M. Application of symmetrized harmonics expansion to correction of the preferred orientation effect. J. Appl. Crystallogr. 1993, 26, 525–531. [Google Scholar] [CrossRef]
- Hill, R.J.; Fischer, R.X. Profile Agreement Indices in Rietveld and Pattern-Fitting Analysis. J. Appl. Crystallogr. 1990, 23, 462–468. [Google Scholar] [CrossRef]
- Levin, A.A. Program RietESD for Correction of Estimated Standard Deviations Obtained in Rietveld-Refinement Program. Preprint. 2022. Available online: https://www.iucr.org/resources/other-directories/software/rietesd (accessed on 1 October 2022).
- Bérar, J.-F.; Lelann, P. ESD’s and Estimated Probable Error Obtained in Rietveld Refinements with Local Correlations. J. Appl. Crystallogr. 1991, 24, 1–5. [Google Scholar] [CrossRef]
- Moberly, J.G.; Bernards, M.T.; Waynant, K.V. Key features and updates for Origin. J. Cheminform. 2018, 10, 5. [Google Scholar] [CrossRef]
- Lipson, H.; Langford, J.I.; Hu, H.-C. Trigonometric intensity factors. In International Tables for Crystallography, Vol. C, Mathematical, Physical and Chemical Tables, 3rd ed.; Prince, E., Ed.; International Union of Crystallography, Kluwer Academic Publishers: Dordrecht, The Netherlands; Boston, MA, USA, 2004; pp. 596–598. [Google Scholar]
- Maslen, E.N. X-ray absorption. In International Tables for Crystallography, Vol. C, Mathematical, Physical and Chemical Tables, 3rd ed.; Prince, E., Ed.; International Union of Crystallography, Kluwer Academic Publishers: Dordrecht, The Netherlands; Boston, MA, USA, 2004; pp. 599–608. [Google Scholar]
- Brown, A.G.; Fox, A.G.; Maslen, E.N.; O’Keefe, M.A.; Willis, B.T.M. Intensity of diffracted intensities. In International Tables for Crystallography, Vol. C, Mathematical, Physical and Chemical Tables, 3rd ed.; Prince, E., Ed.; International Union of Crystallography, Kluwer Academic Publishers: Dordrecht, The Netherlands; Boston, MA, USA, 2004; pp. 554–595. [Google Scholar]


| Crystalline Phase a | a, Å c, Å | Vcell, Å3 | DTOPAS, nm εsTOPAS, % | DSSP, nm εsSSP, % | Wt, wt.% Bisooverall, Å−2 | RB, % rMD b | Rwp, % Rp, % | cRwp, % cRp, % |
|---|---|---|---|---|---|---|---|---|
| MBI-PG2.5L + MBI-PG2.5M + MBI-PG2.5S, me.s.d. = 7.529 c | ||||||||
| MBI-PG2.5L | 13.979(8) | 1220.3 (2.1) | 107(1) | 119(20) d | 0.80(2) | 2.68 | 1.36 1.00 7.529 | 18.86 19.86 |
| 7.211(11) | 0.082(1) | 0.16(4) d | 0.5(5) | 0.34(1) | ||||
| MBI-PG2.5M | 13.873(60) | 1209.4 (7.5) | 12(1) | 15(5) d | 25.5(7) | 0.39 | ||
| 7.256(9) | 0 | 0 d | 4.3(4) | 0.53(1) | ||||
| MBI-PG72.5S | 14.060(45) | 1240.0 (14.0) | 2.4(2) | – | 73.7(7) | 1.07 | ||
| 7.243(75) | 0 | – | BisooverallMBI-M | 5.8(6) | ||||
| Crystalline Phase a | a, Å c, Å | Vcell, Å3 | DTOPAS, nm εsTOPAS, % | DSSP, nm εsSSP, % | Wt, wt.% Bisooverall, Å−2 | RB, % rMD b | Rwp, % Rp, % | cRwp, % cRp, % |
|---|---|---|---|---|---|---|---|---|
| MBI-PG7L + MBI-PG7M1 + MBI-PG7M2 + MBI-PG7S, me.s.d. = 5.832 c | ||||||||
| MBI-PG7L | 13.943(2) | 1224.3 (6) | 61(3) | 57(5) d | 0.80(2) | 0.47 | 1.63 1.27 | 13.02 16.15 |
| 7.272(3) | 0.014(6) | 0.06(12) d | 1.0(4) | 1.24(3) | ||||
| MBI-PG7M1 | 14.025(11) | 1230.1 (1.4) | 28(1) | 31(3) d | 5.70(9) | 0.40 | ||
| 7.221(2) | 0 | 0 d | 4.3(6) | 0.62(1) | ||||
| MBI-PG7M2 | 14.014(17) | 1222.9 (2.9) | 17(1) | 18(4) d | 9.71(17) | 1.26 | ||
| 7.190(12) | 0 | 0 d | 3.9(5) | 0.21(1) | ||||
| MBI-PG7S | 13.910(58) | 1202.5 (9.1) | 2.7(1) | – | 71.33(14) | 0.27 | ||
| 7.176(34) | 0 | – | BisooverallMBI-M2 | 0.10(1) | ||||
| Crystalline Phase a | a, Å c, Å | Vcell, Å3 | DTOPAS, nm b εsTOPAS, % b | Wt, wt.% c | Rwp, % Rp, % | cRwp, % cRp, % |
|---|---|---|---|---|---|---|
| MBI-ChA, me.s.d. = 4.715 d | ||||||
| MBI-ChA1 | 14.062(1) 7.156(1) | 1225.4(2) | 9.98(6) 0.000(3) | 62.4 | 3.58 2.49 | 4.01 2.91 |
| MBI-ChA2 | 13.630(3) 7.129(2) | 1147.0(5) | 9.13(7) 0.006(7) | 35.6 | ||
| MBI-ChA-mill, me.s.d. = 7.492 d | ||||||
| MBI-ChA1 | 14.063(3) 7.160(4) | 1226.3(8) | 9.41(7) 0.000(70) | 77.3 | 3.87 2.33 | 4.71 3.12 |
| MBI-ChA2 | 13.620(6) 7.131(2) | 1145.6(8) | 8.43(11) 0.002(90) | 22.7 | ||
| ν, cm−1 | Assignment from [46] |
|---|---|
| 1219 | δCCH + νCN + νCC |
| 1271 | νCN + νCC + δCCH |
| 1360 | νCCH + νCN |
| 1389 | νCC + νCN + MδCH2 |
| 1418 | MδCH2 + δCCH |
| 1448 | δCCH + νCC |
| 1485 | MδCH2 + ΓCCCN + δCCH |
| 1555 | νCN + νCC |
| 1624 | νCC + νCN |
| 2544 | |
| 2583 | |
| 2679 | |
| 2725 | |
| 2756 | |
| 2791 | |
| 2847 | |
| 2876 | |
| 2918 | |
| 2995 | |
| 3061 | MνCH |
| 3096 | MνCH |
| 3111 | MνCH |
| 3177 | νCH |
| s | Wm, eV | a, Å | |
|---|---|---|---|
| ChA | 0.80 | 0.77 | 12 |
| MBI-ChA | 0.94 | 2.58 | 4.4 |
| MBI-PG30 | 0.91 | 1.72 | 6.6 |
| PG7 | 0.90 | 1.55 | 5.1 |
| MBI-PG7 | 0.94 | 2.58 | 7.3 |
| MBI-PG2.5 | 0.79 | 0.74 | 18.1 |
Disclaimer/Publisher’s Note: The statements, opinions and data contained in all publications are solely those of the individual author(s) and contributor(s) and not of MDPI and/or the editor(s). MDPI and/or the editor(s) disclaim responsibility for any injury to people or property resulting from any ideas, methods, instructions or products referred to in the content. |
© 2023 by the authors. Licensee MDPI, Basel, Switzerland. This article is an open access article distributed under the terms and conditions of the Creative Commons Attribution (CC BY) license (https://creativecommons.org/licenses/by/4.0/).
Share and Cite
Balashova, E.; Levin, A.A.; Pavlov, S.; Starukhin, A.; Fokin, A.; Kurdyukov, D.; Eurov, D.; Krichevtsov, B. Synthesis and Study of Organic Nanostructures Fabricated by Inclusion of 2-Methylbenzimidazole Molecules in Nanotubes of Chrysotile Asbestos, Mesoporous Silica, and Nanopores of Borate Glasses. Int. J. Mol. Sci. 2023, 24, 13740. https://doi.org/10.3390/ijms241813740
Balashova E, Levin AA, Pavlov S, Starukhin A, Fokin A, Kurdyukov D, Eurov D, Krichevtsov B. Synthesis and Study of Organic Nanostructures Fabricated by Inclusion of 2-Methylbenzimidazole Molecules in Nanotubes of Chrysotile Asbestos, Mesoporous Silica, and Nanopores of Borate Glasses. International Journal of Molecular Sciences. 2023; 24(18):13740. https://doi.org/10.3390/ijms241813740
Chicago/Turabian StyleBalashova, Elena, Aleksandr A. Levin, Sergey Pavlov, Anatoly Starukhin, Alexander Fokin, Dmitry Kurdyukov, Daniil Eurov, and Boris Krichevtsov. 2023. "Synthesis and Study of Organic Nanostructures Fabricated by Inclusion of 2-Methylbenzimidazole Molecules in Nanotubes of Chrysotile Asbestos, Mesoporous Silica, and Nanopores of Borate Glasses" International Journal of Molecular Sciences 24, no. 18: 13740. https://doi.org/10.3390/ijms241813740
APA StyleBalashova, E., Levin, A. A., Pavlov, S., Starukhin, A., Fokin, A., Kurdyukov, D., Eurov, D., & Krichevtsov, B. (2023). Synthesis and Study of Organic Nanostructures Fabricated by Inclusion of 2-Methylbenzimidazole Molecules in Nanotubes of Chrysotile Asbestos, Mesoporous Silica, and Nanopores of Borate Glasses. International Journal of Molecular Sciences, 24(18), 13740. https://doi.org/10.3390/ijms241813740