

Investigation of Molecular Interactions Mechanism of Pembrolizumab and PD-1


Abstract
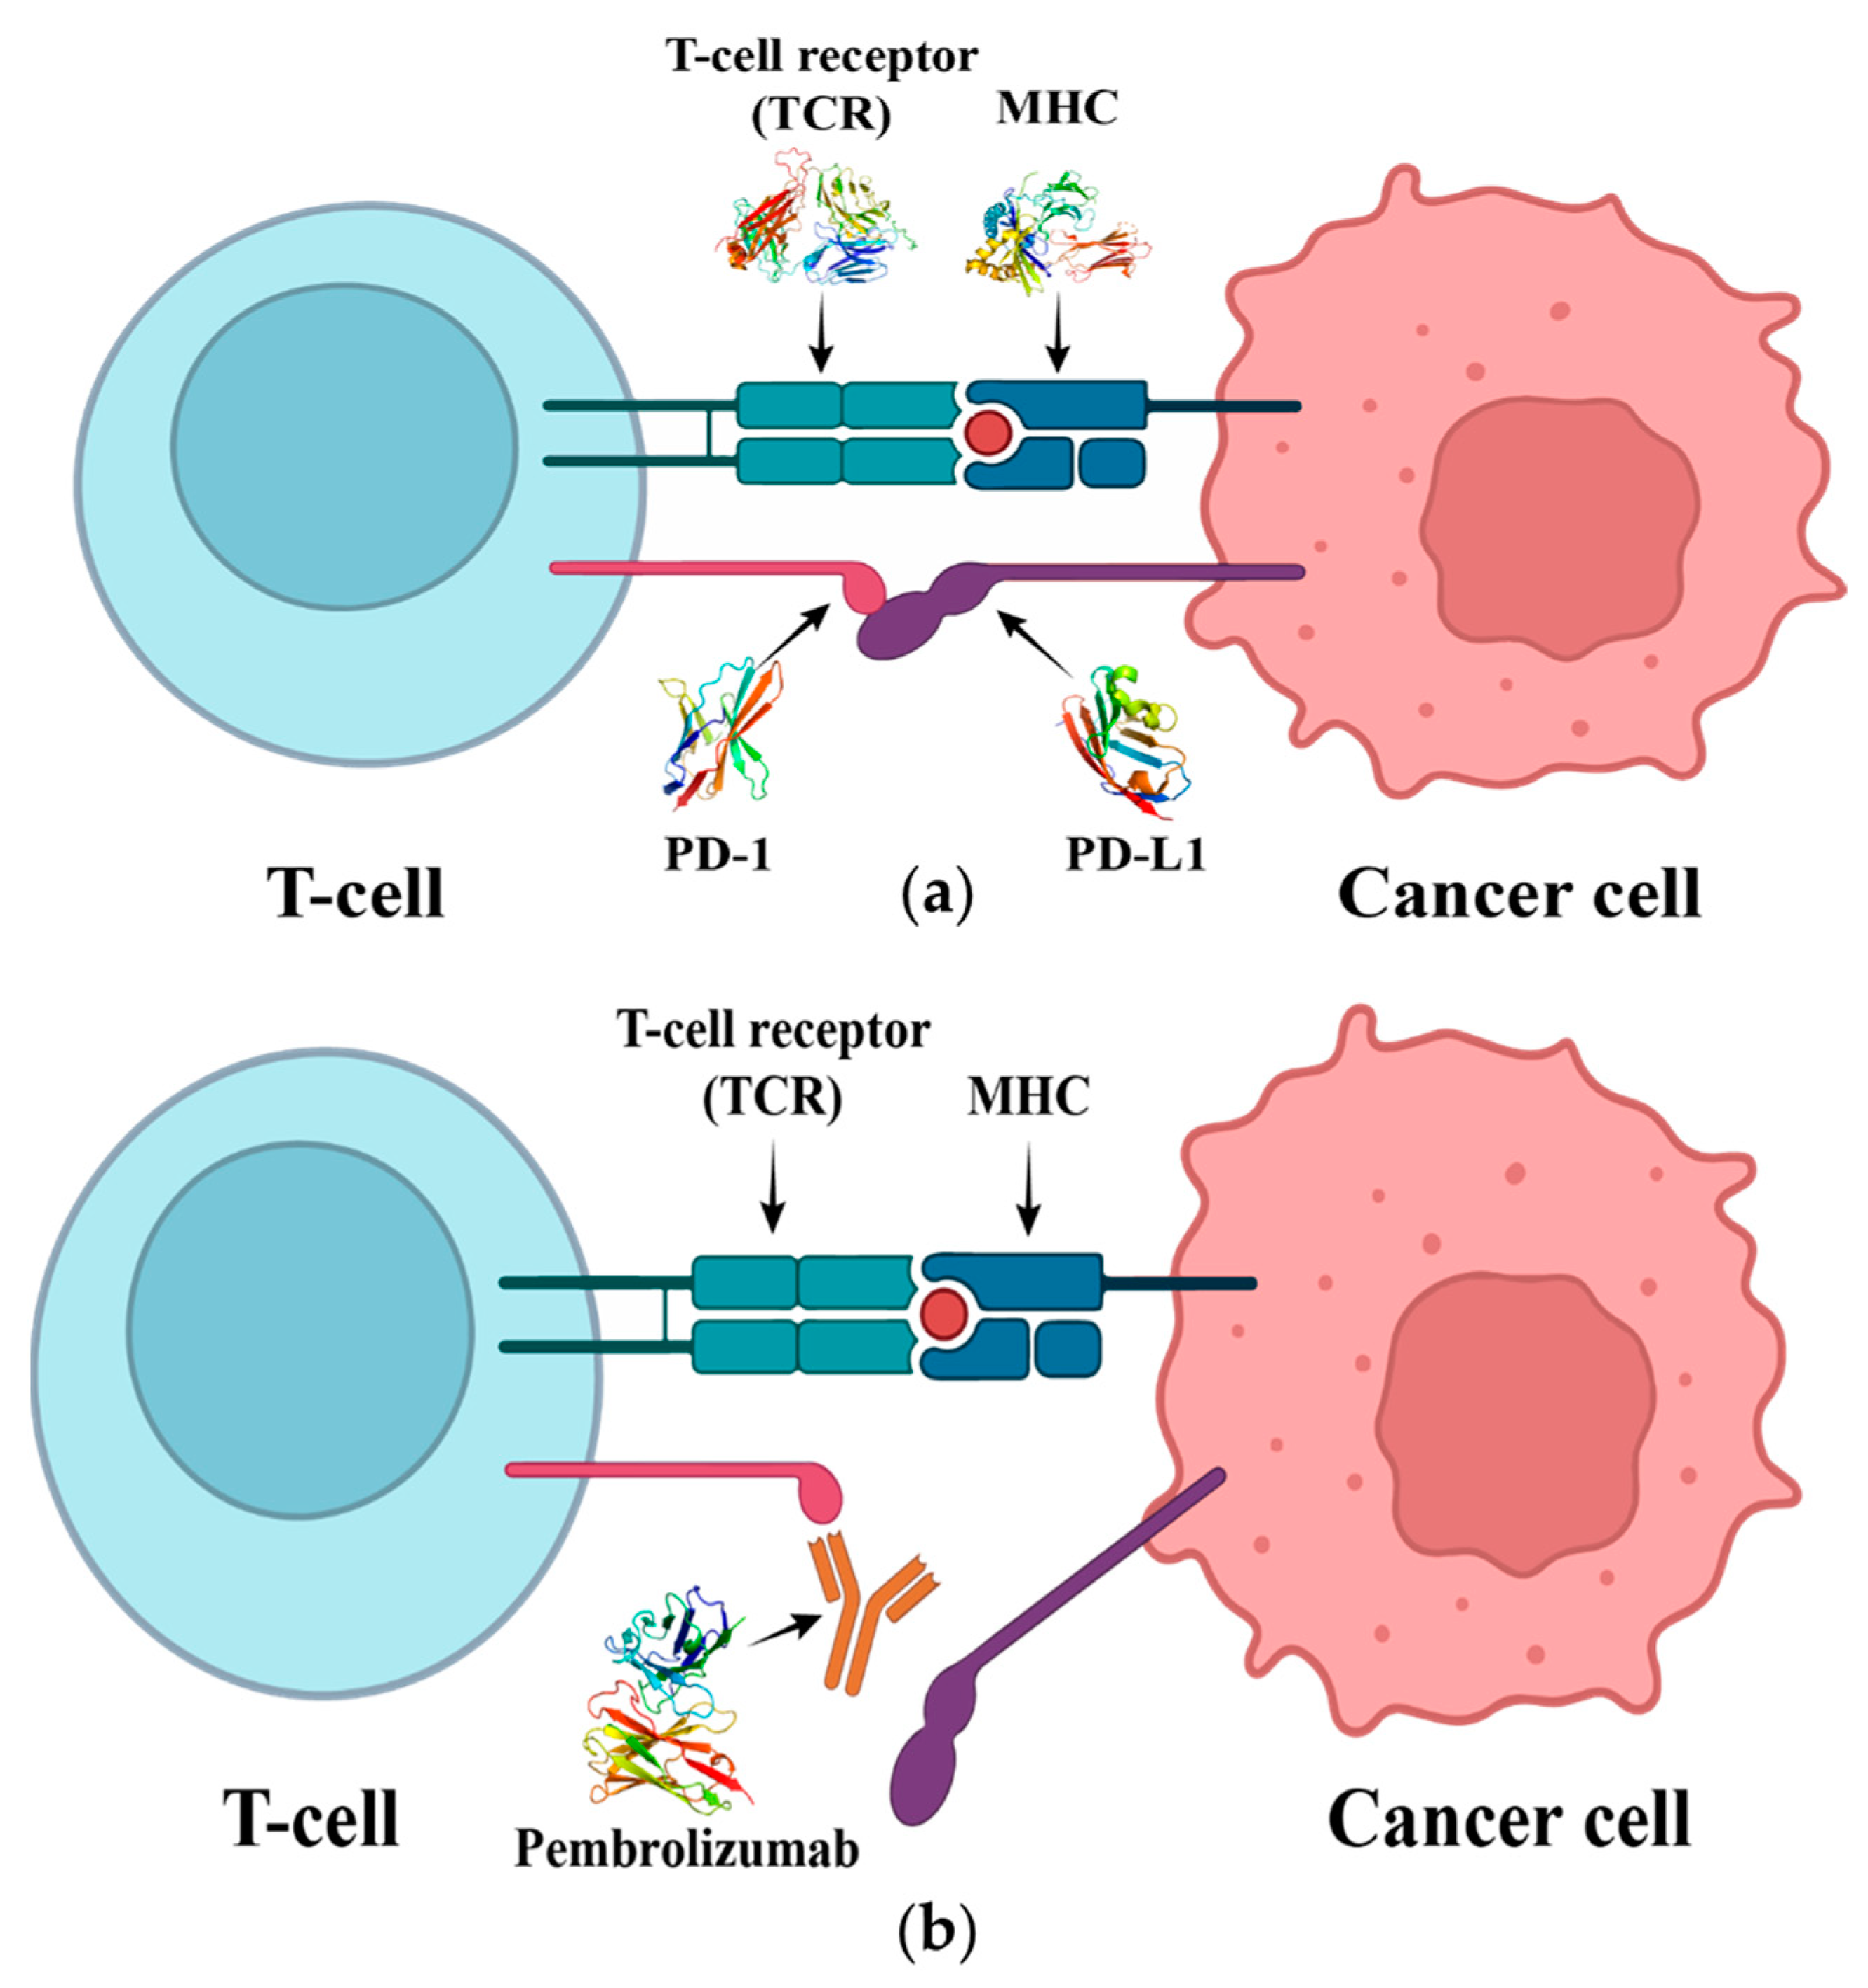
1. Introduction
2. Results
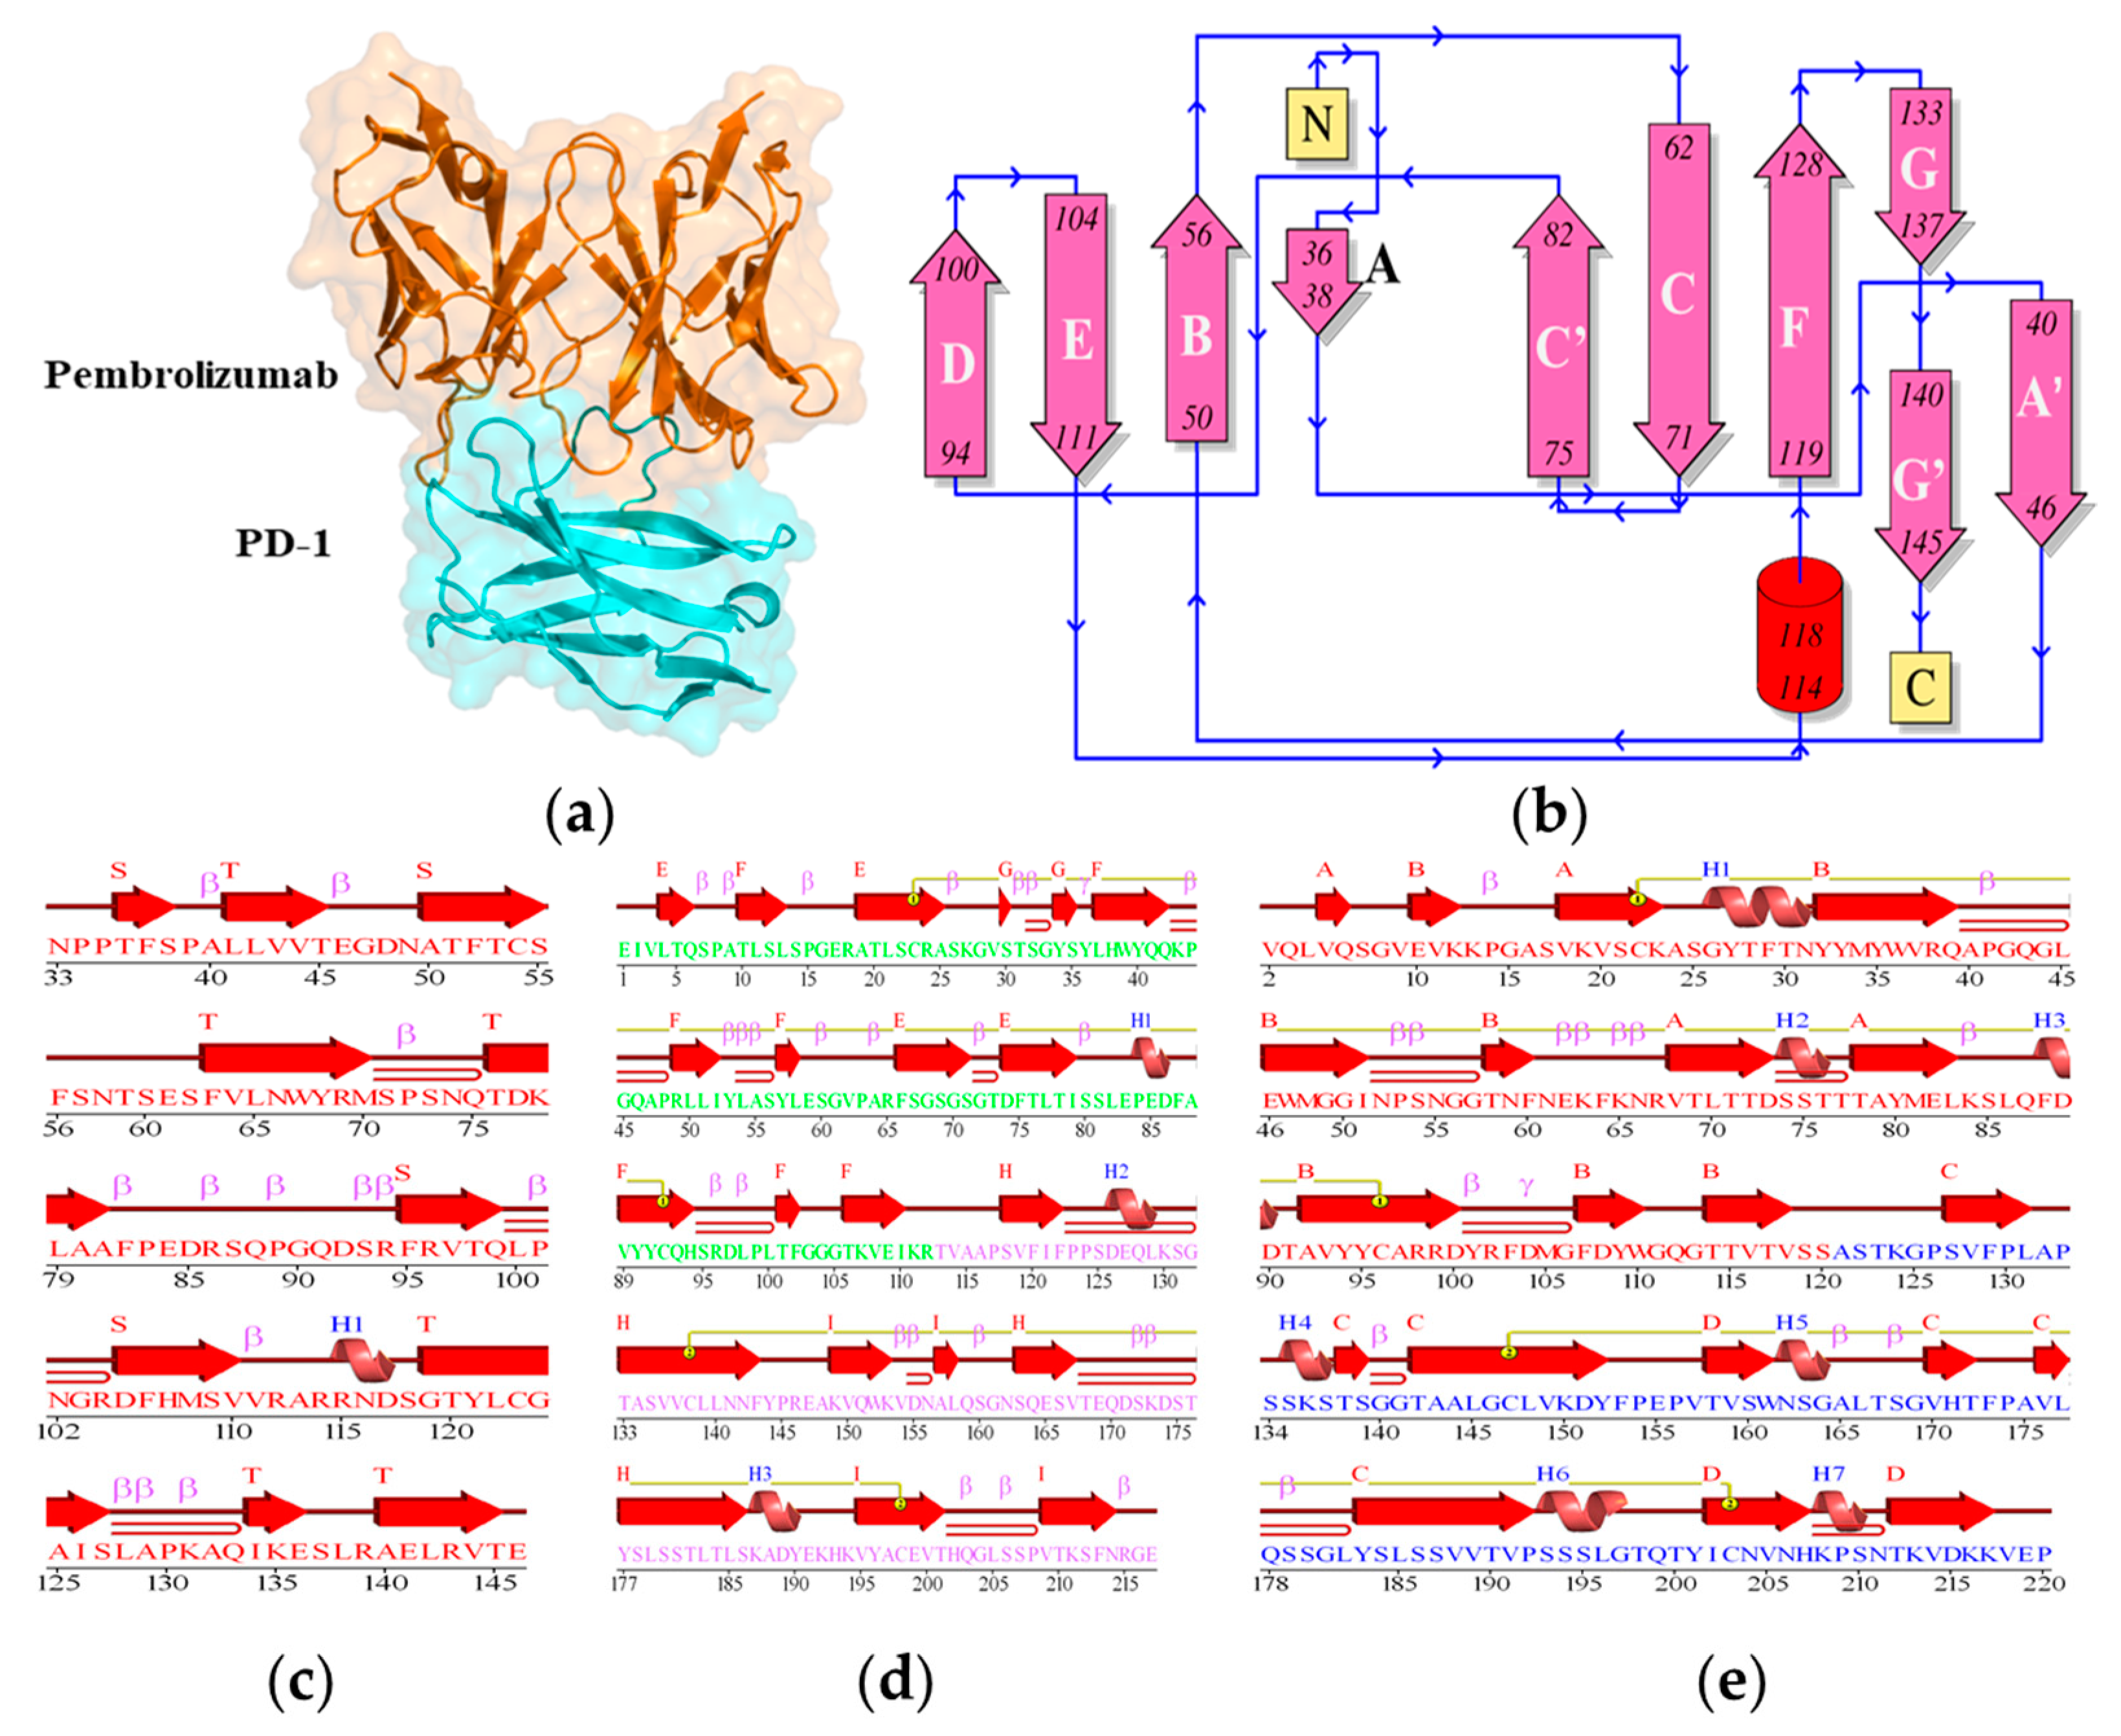
2.1. Structure Analysis of PD-1 Complex
2.2. Structure Conformation of PD-1/Pembrolizumab Complex
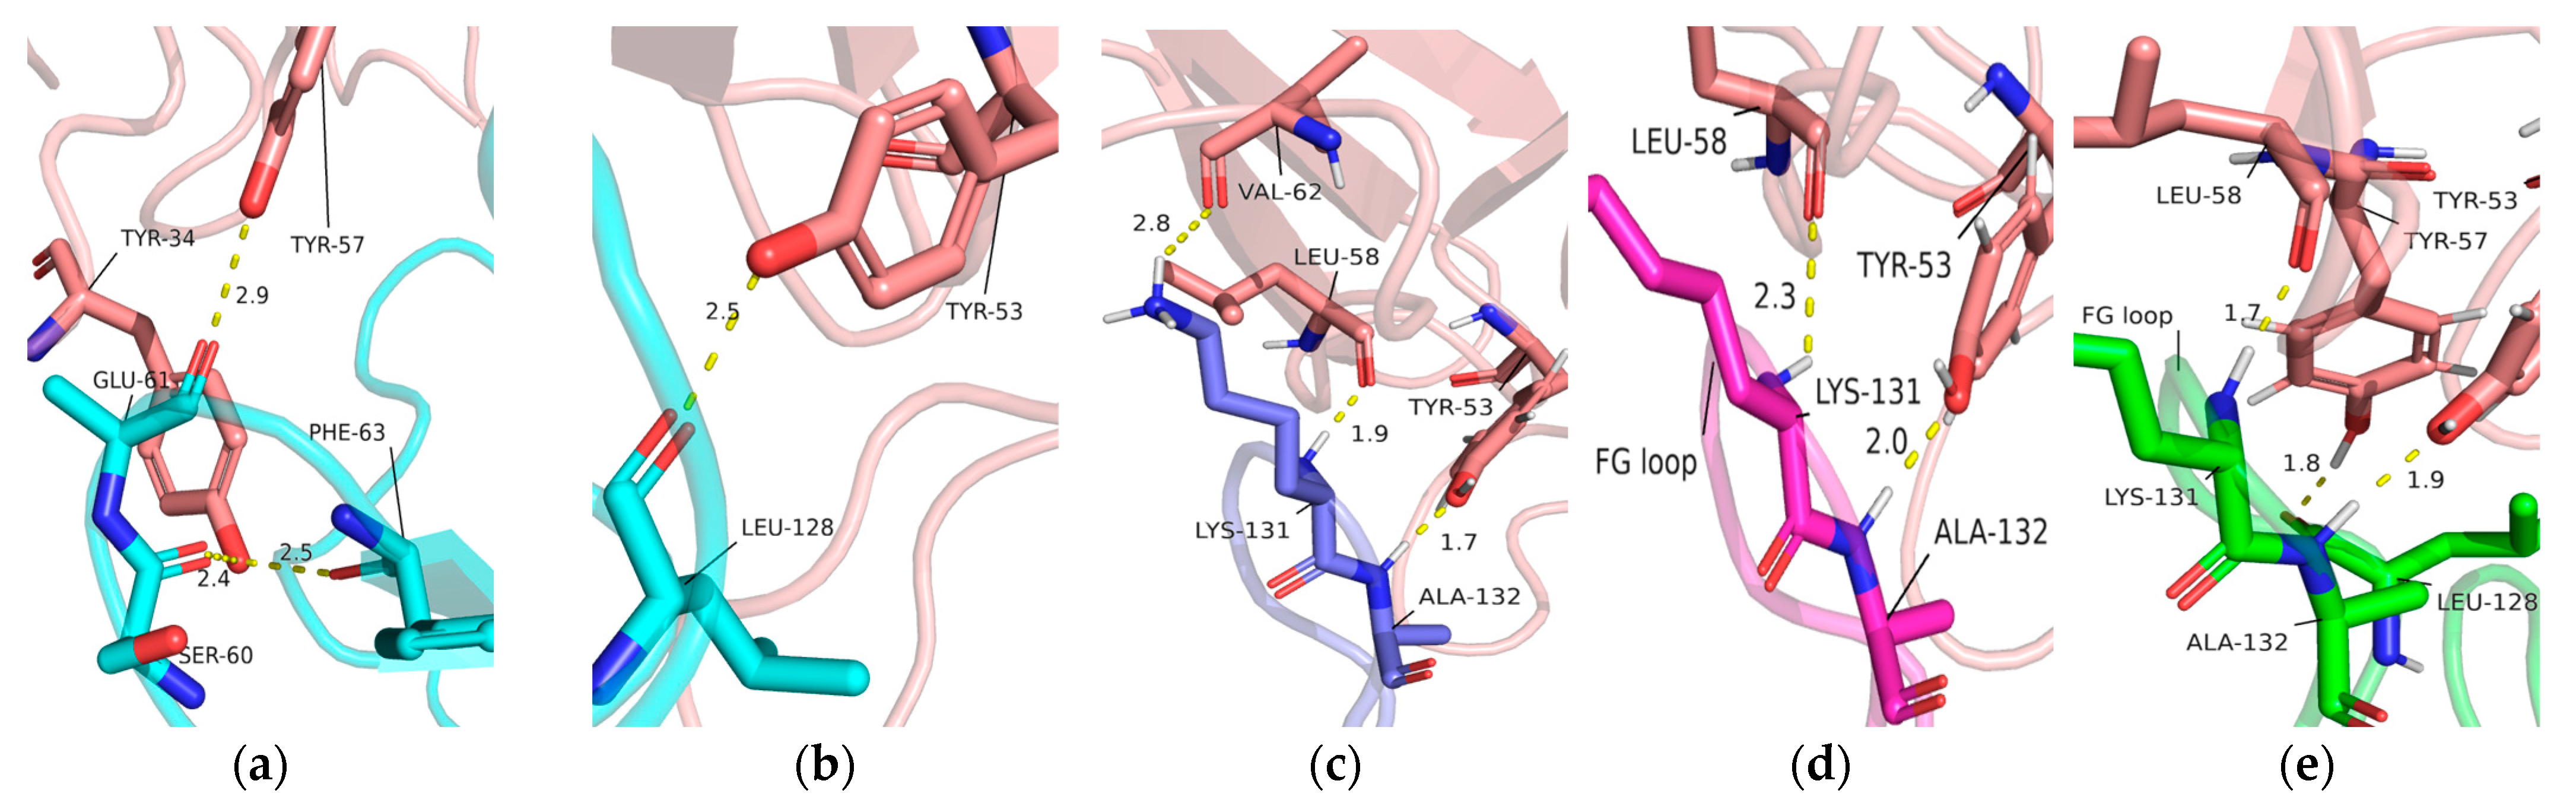
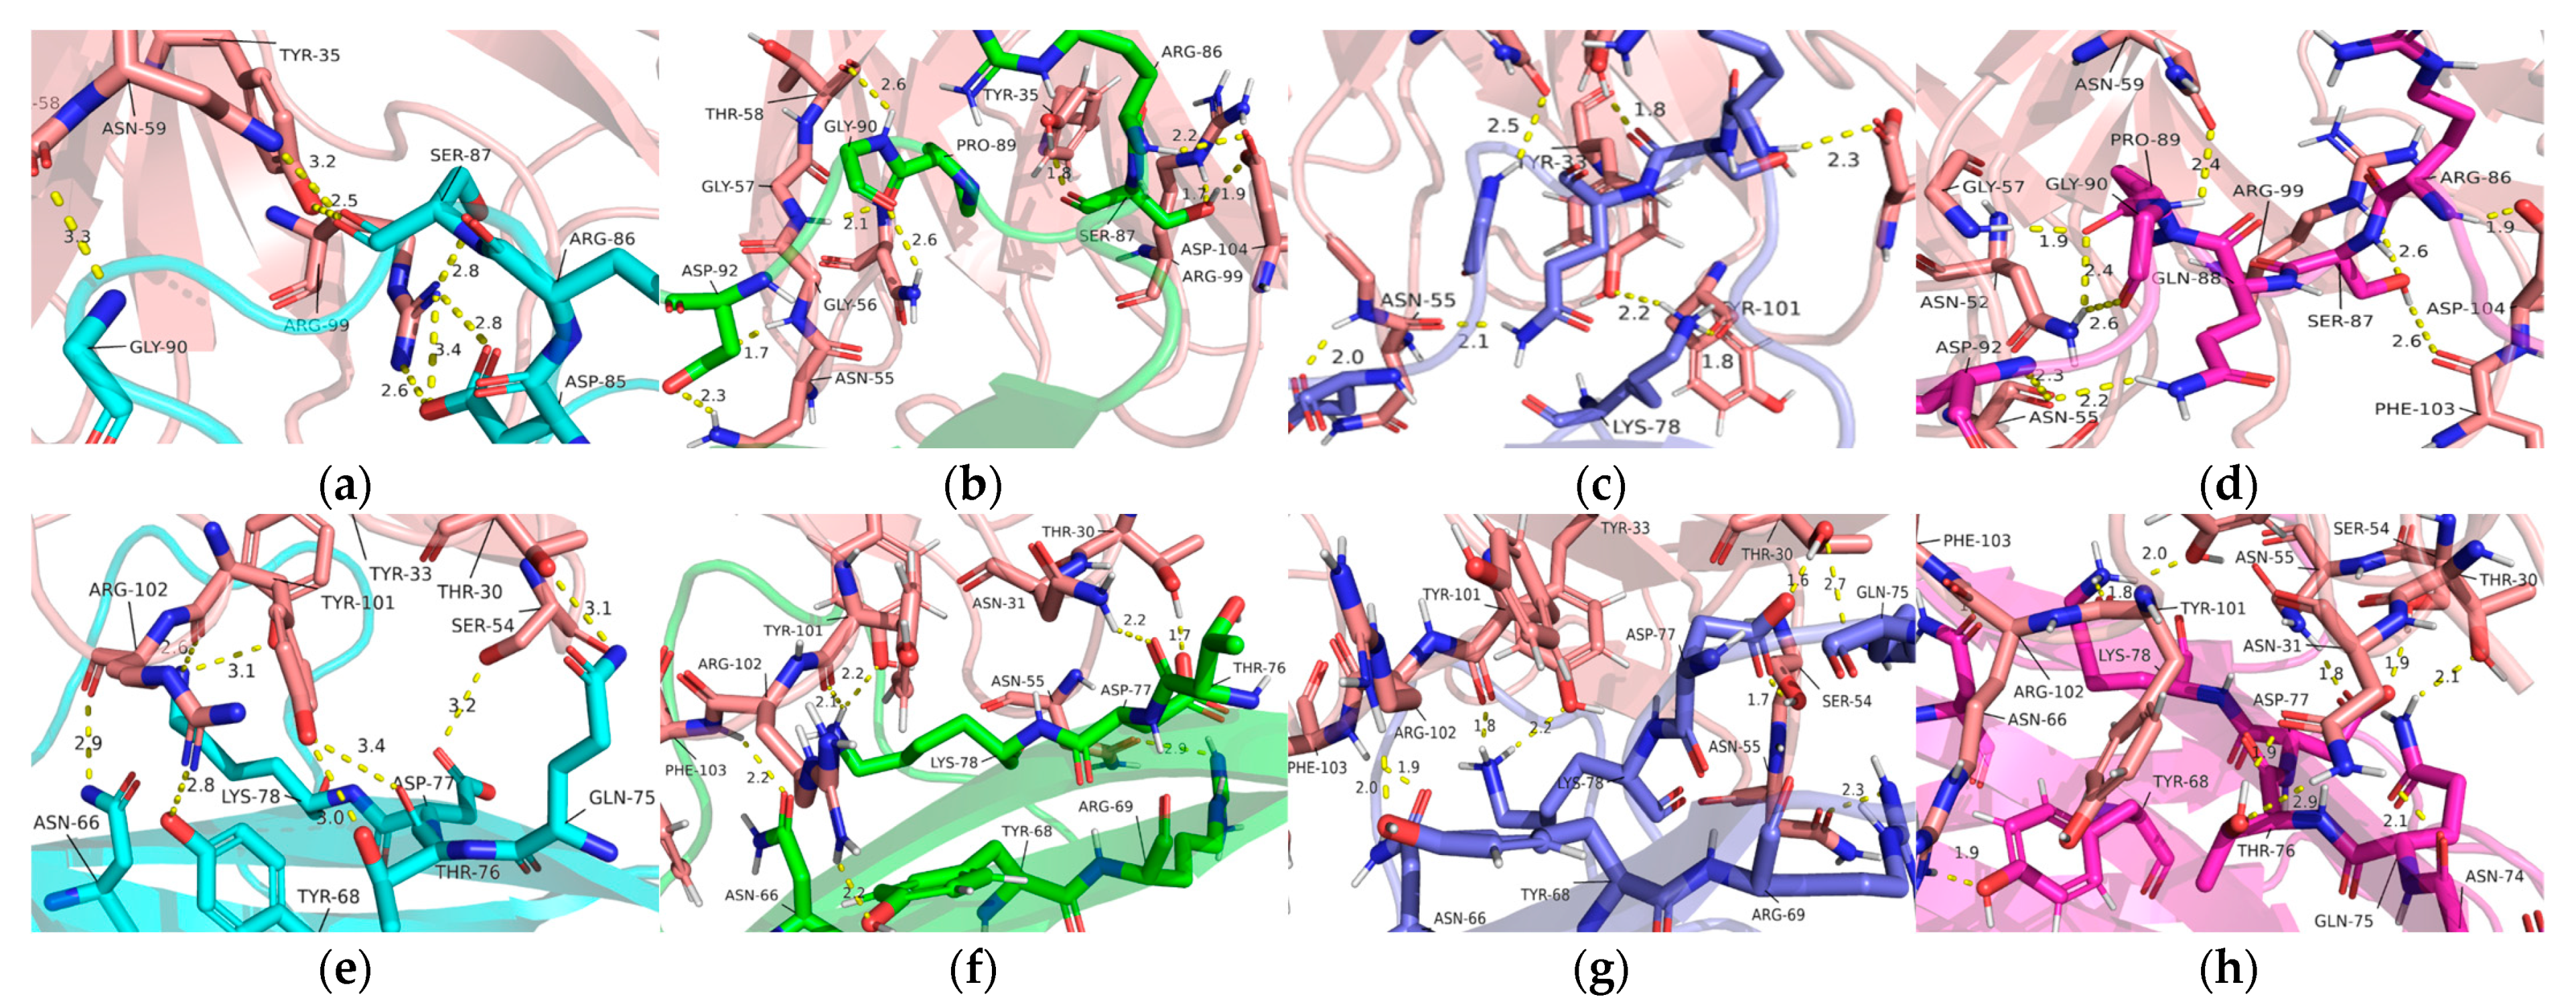
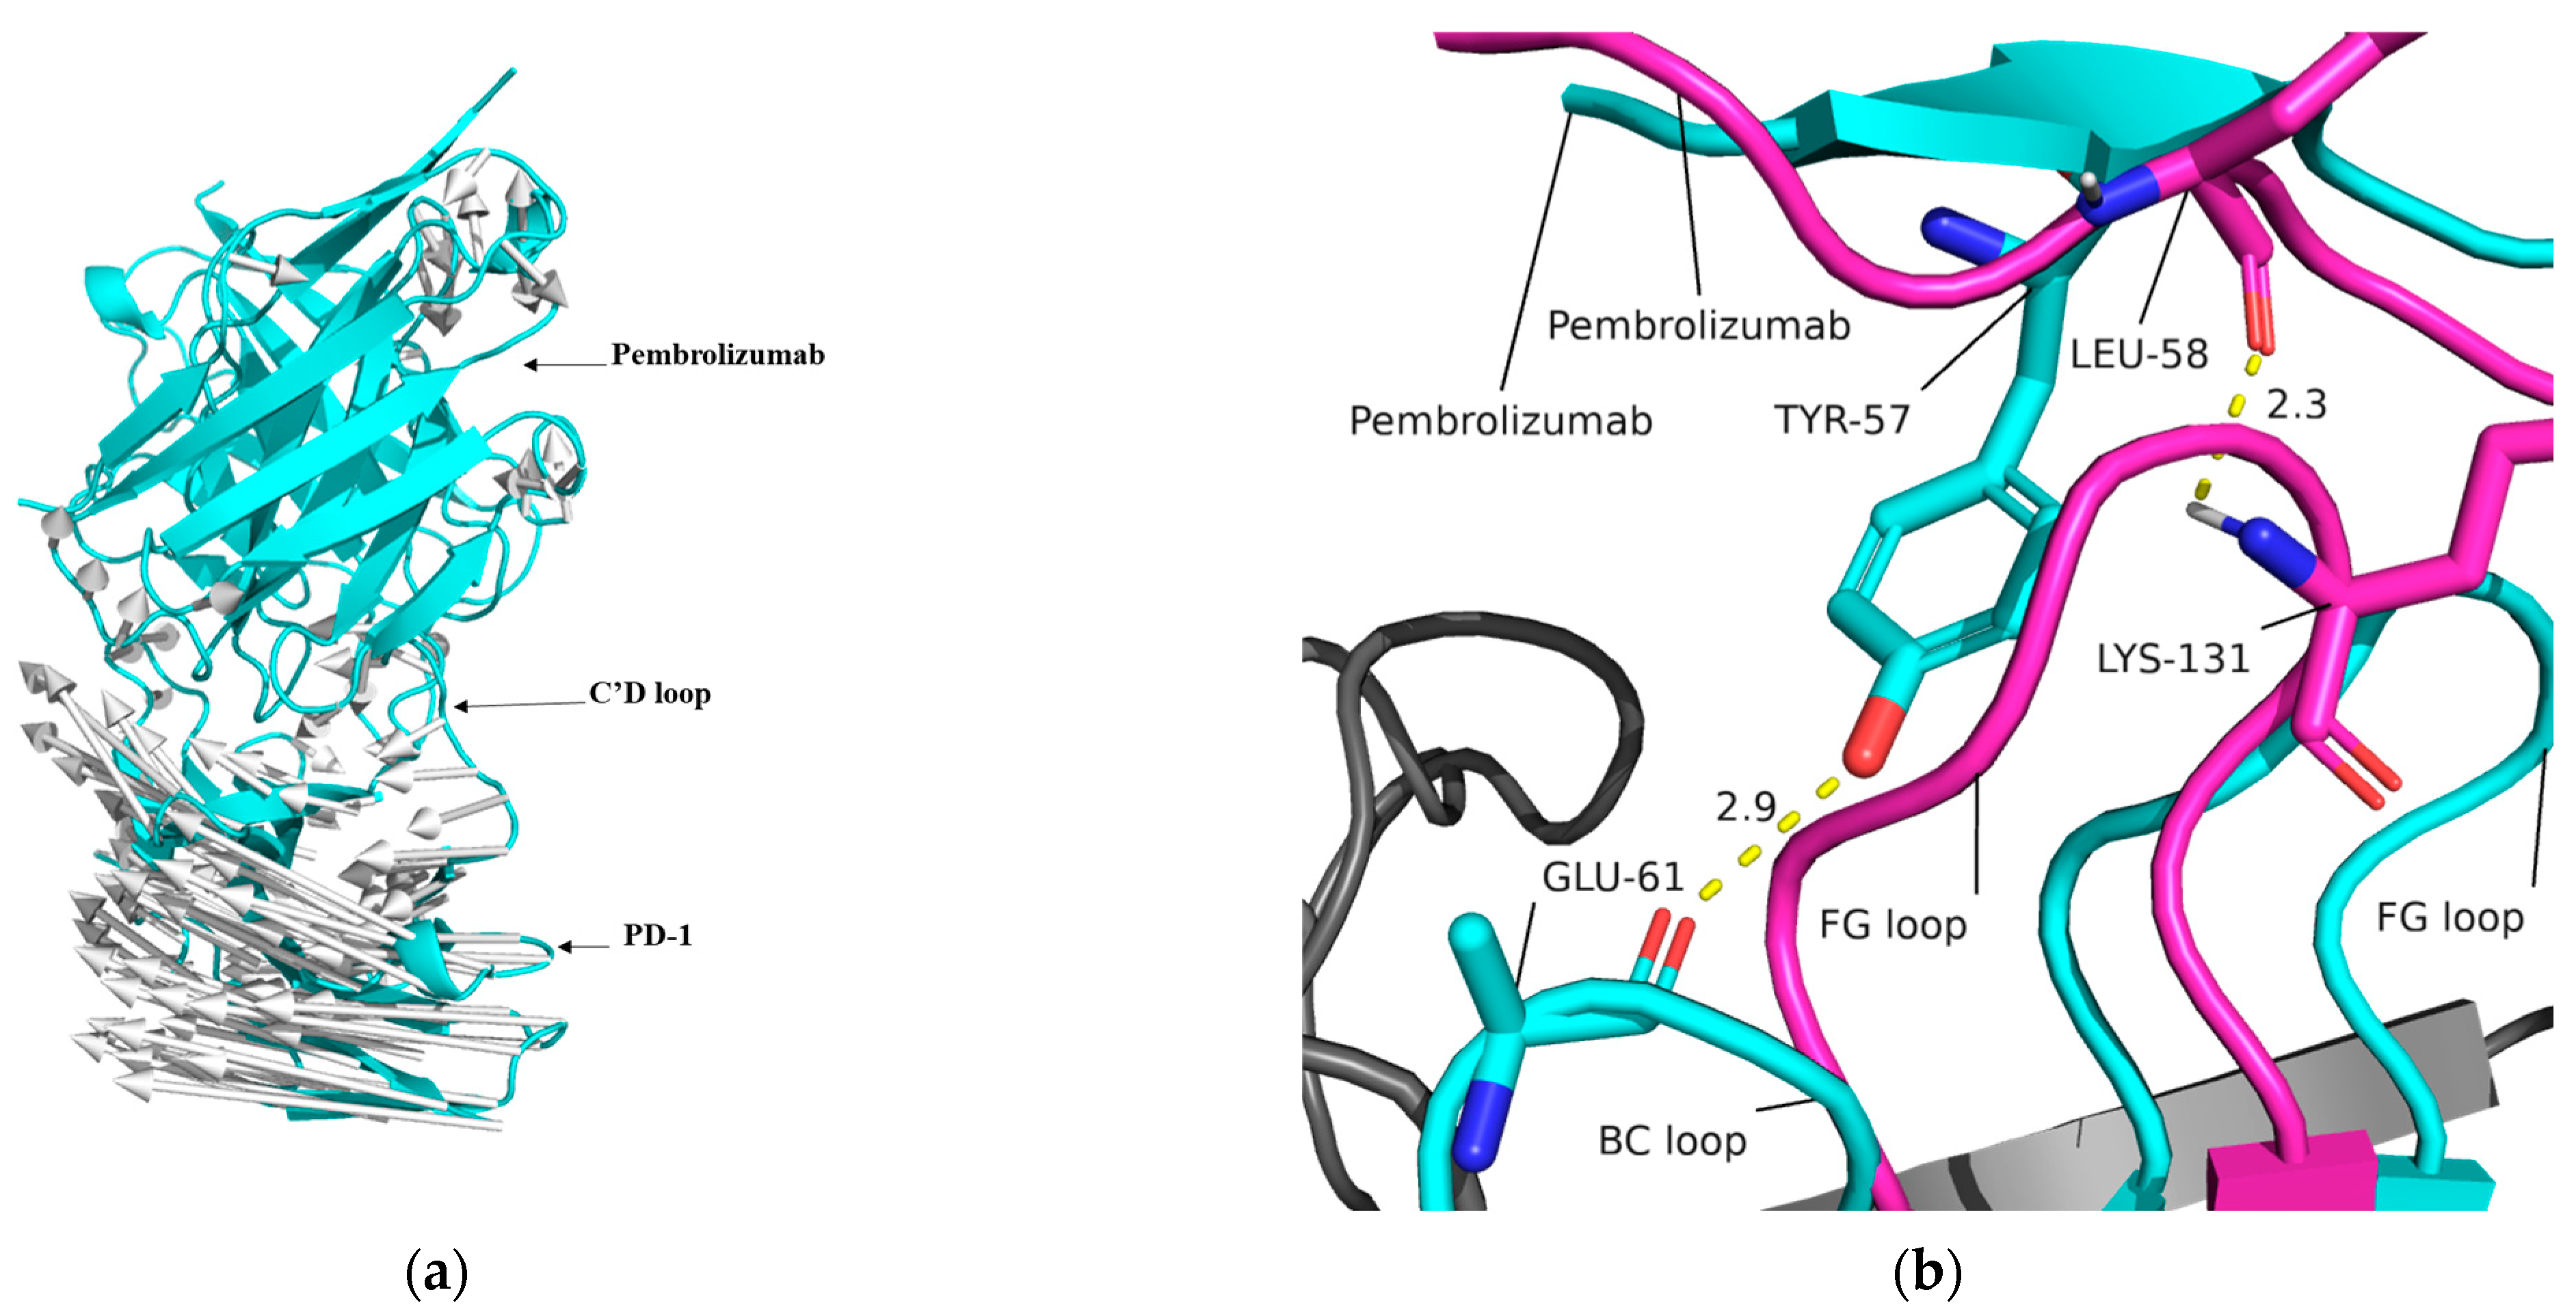
2.3. Interaction of Pembrolizumab and PD-1
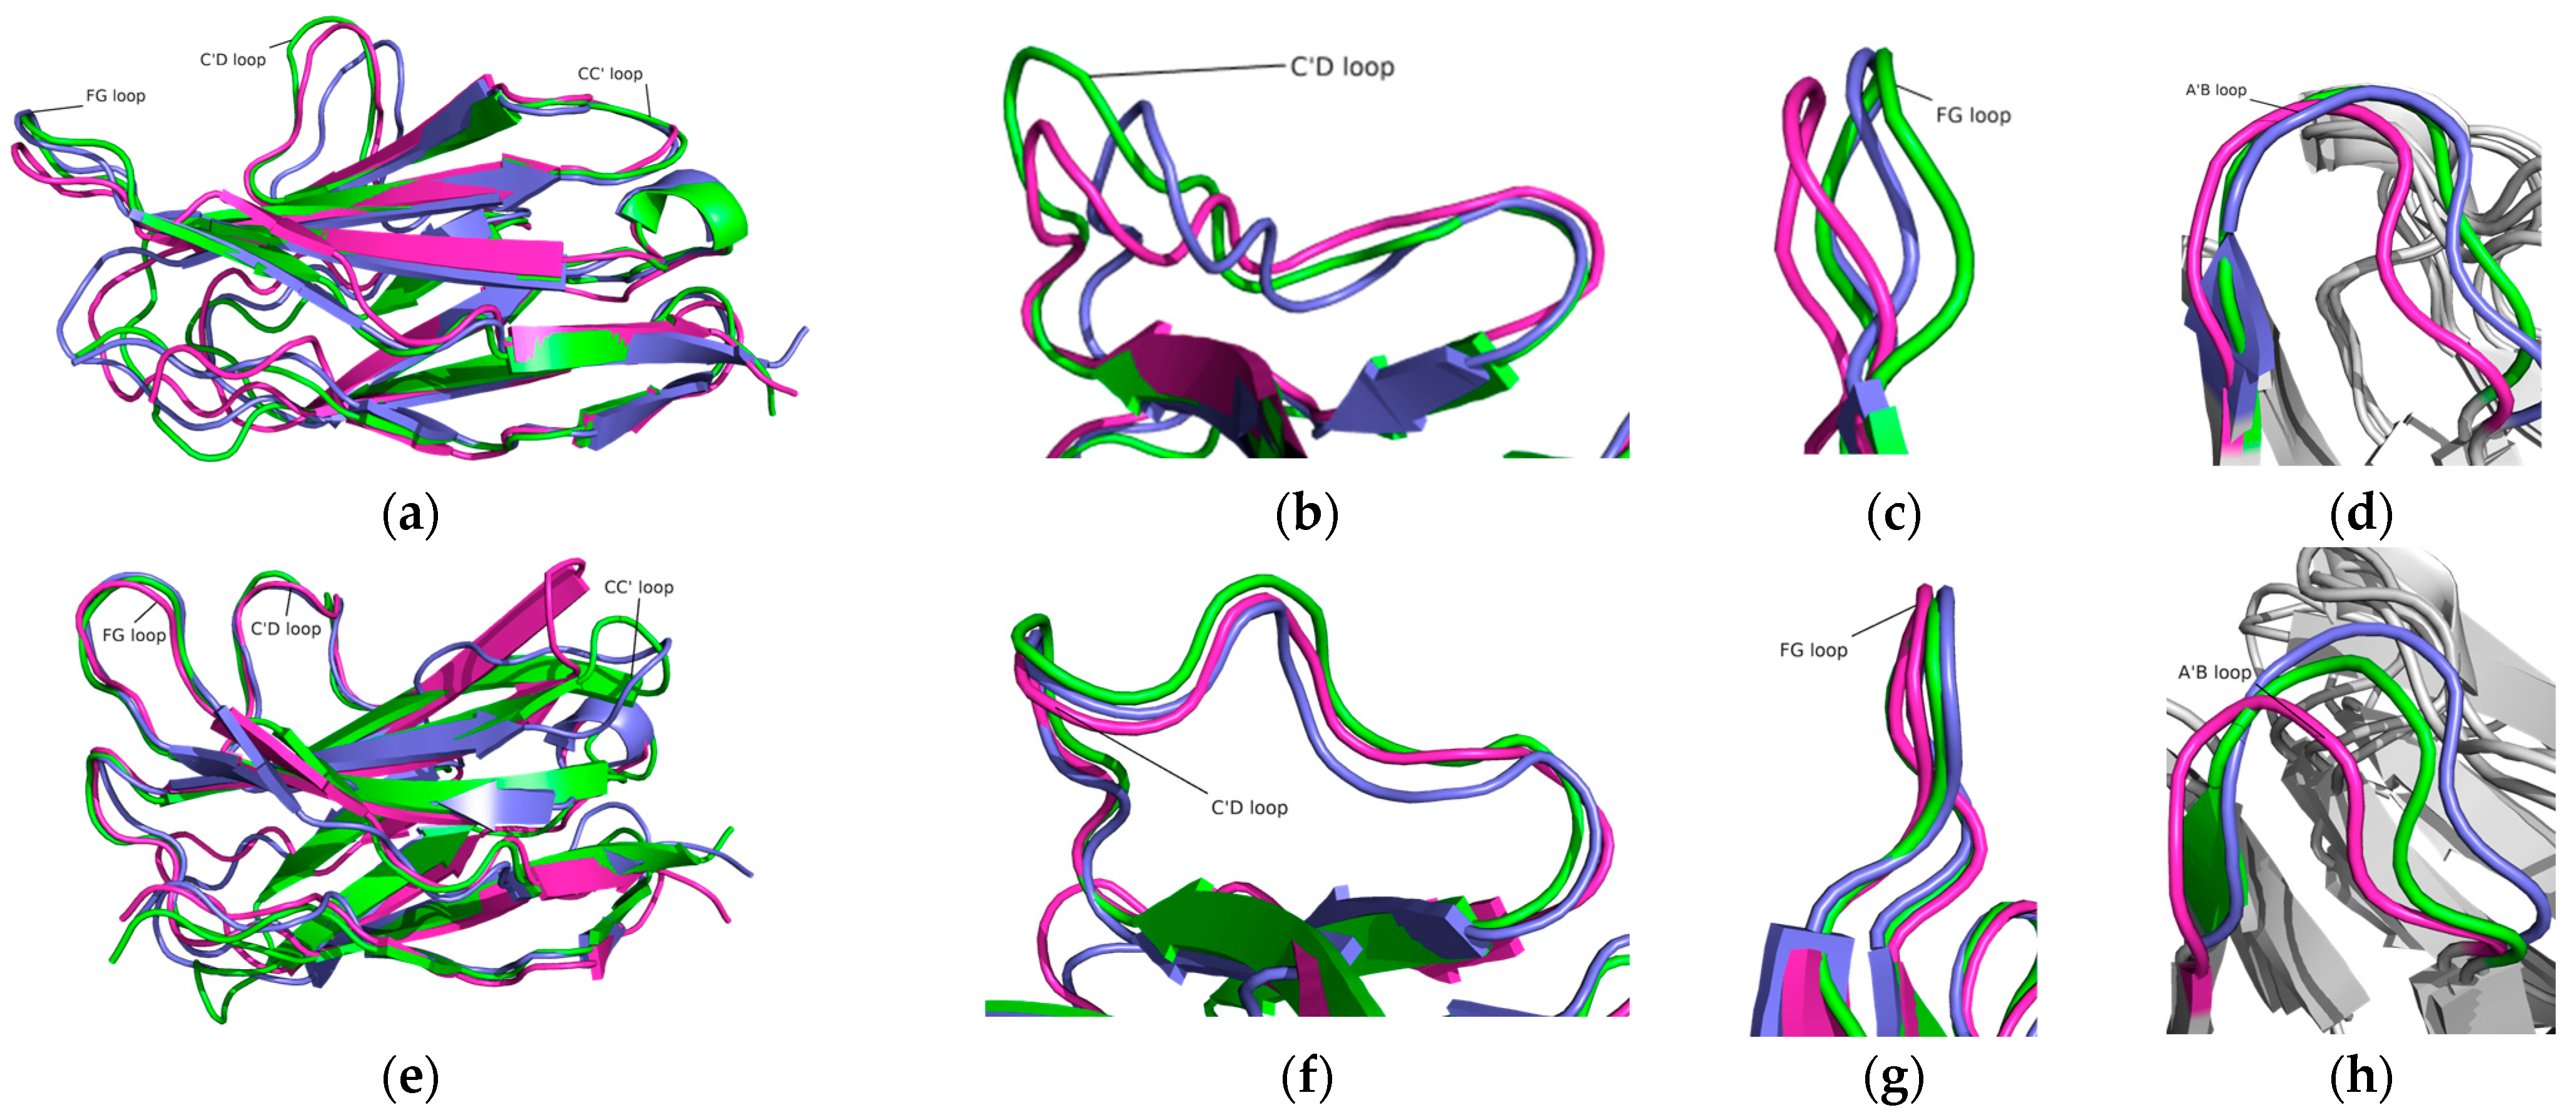
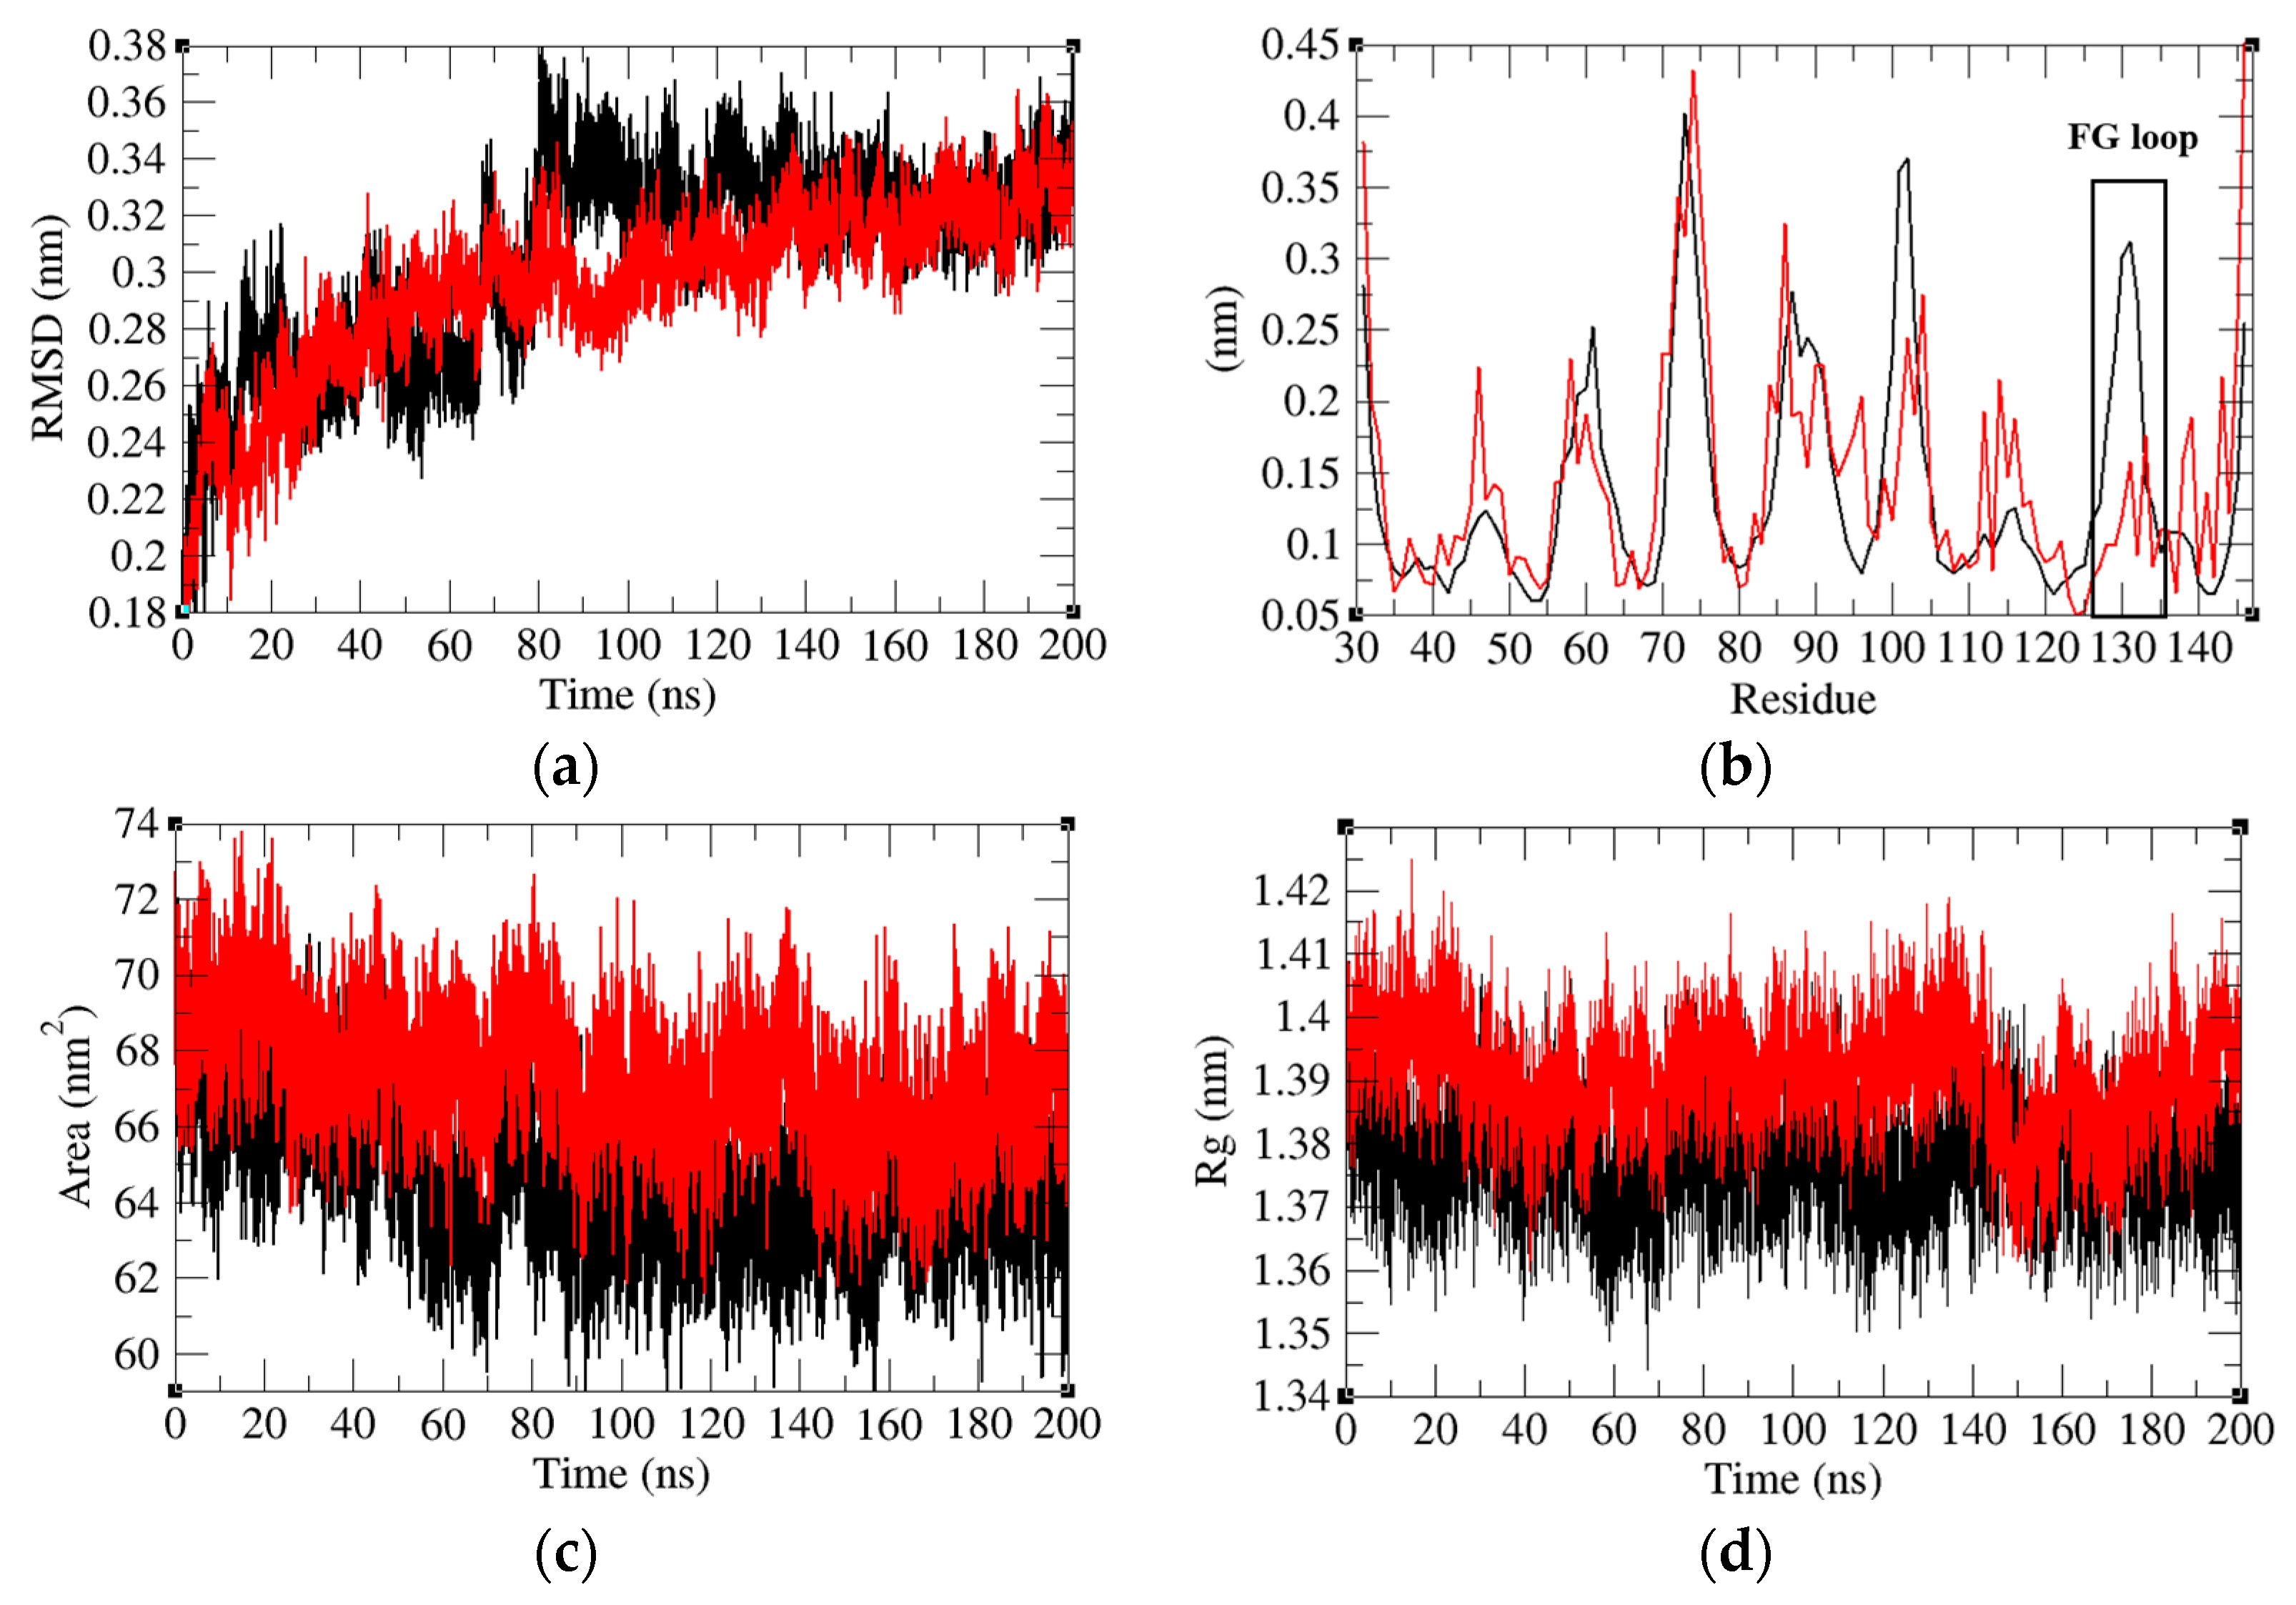
2.4. Structure Deviations and Compactness
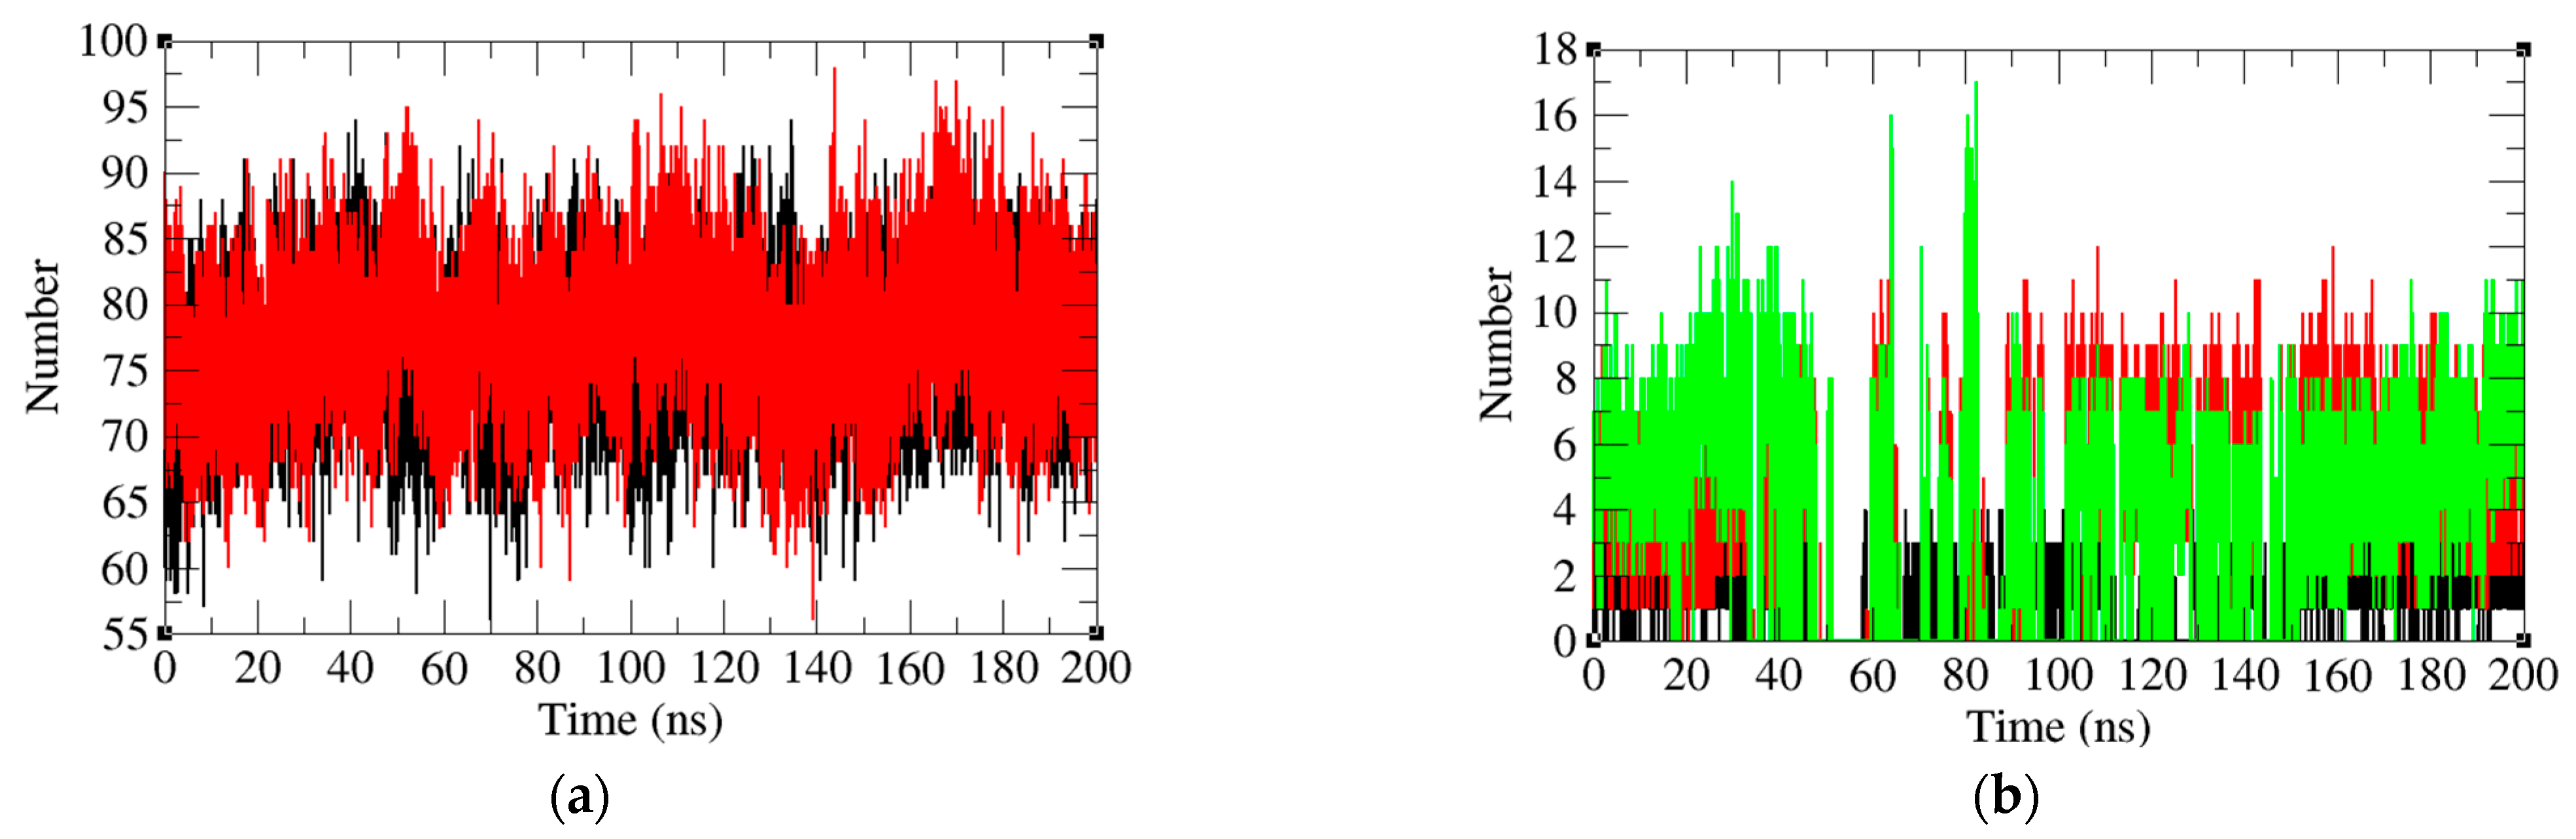
2.5. Analysis of Intermolecular and Intramolecular Hydrogen Bonds
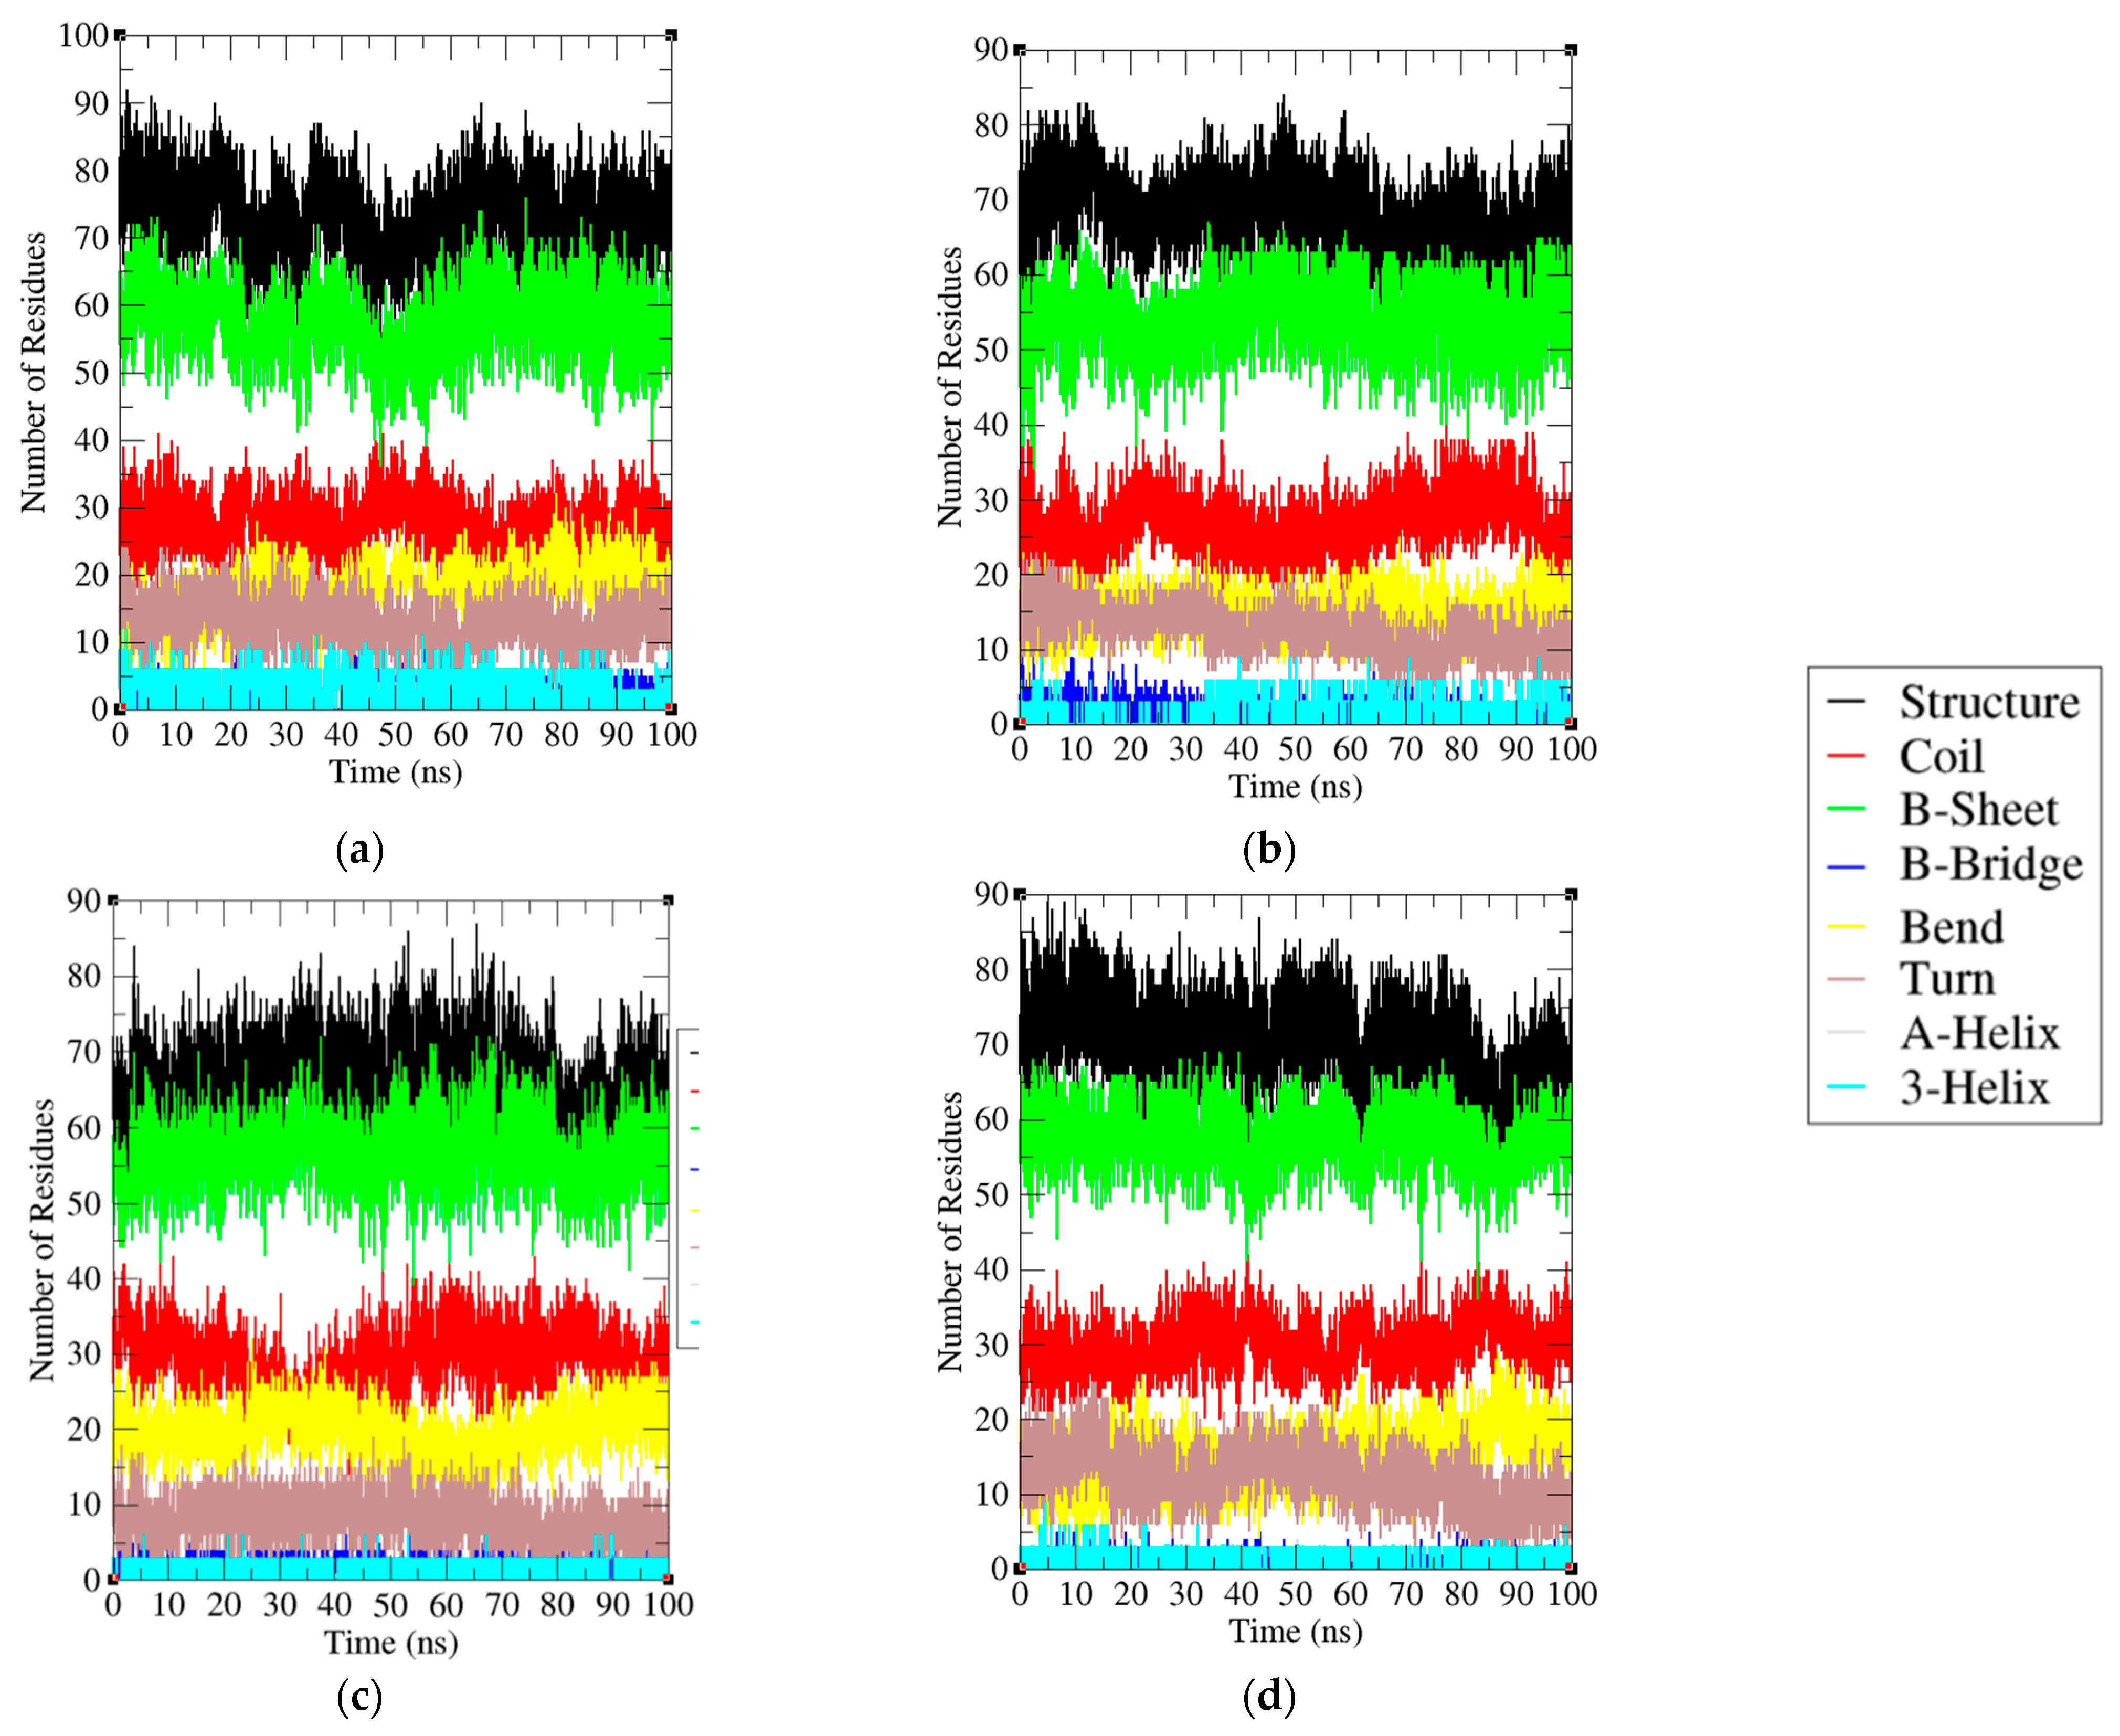
2.6. Secondary Structural Analysis
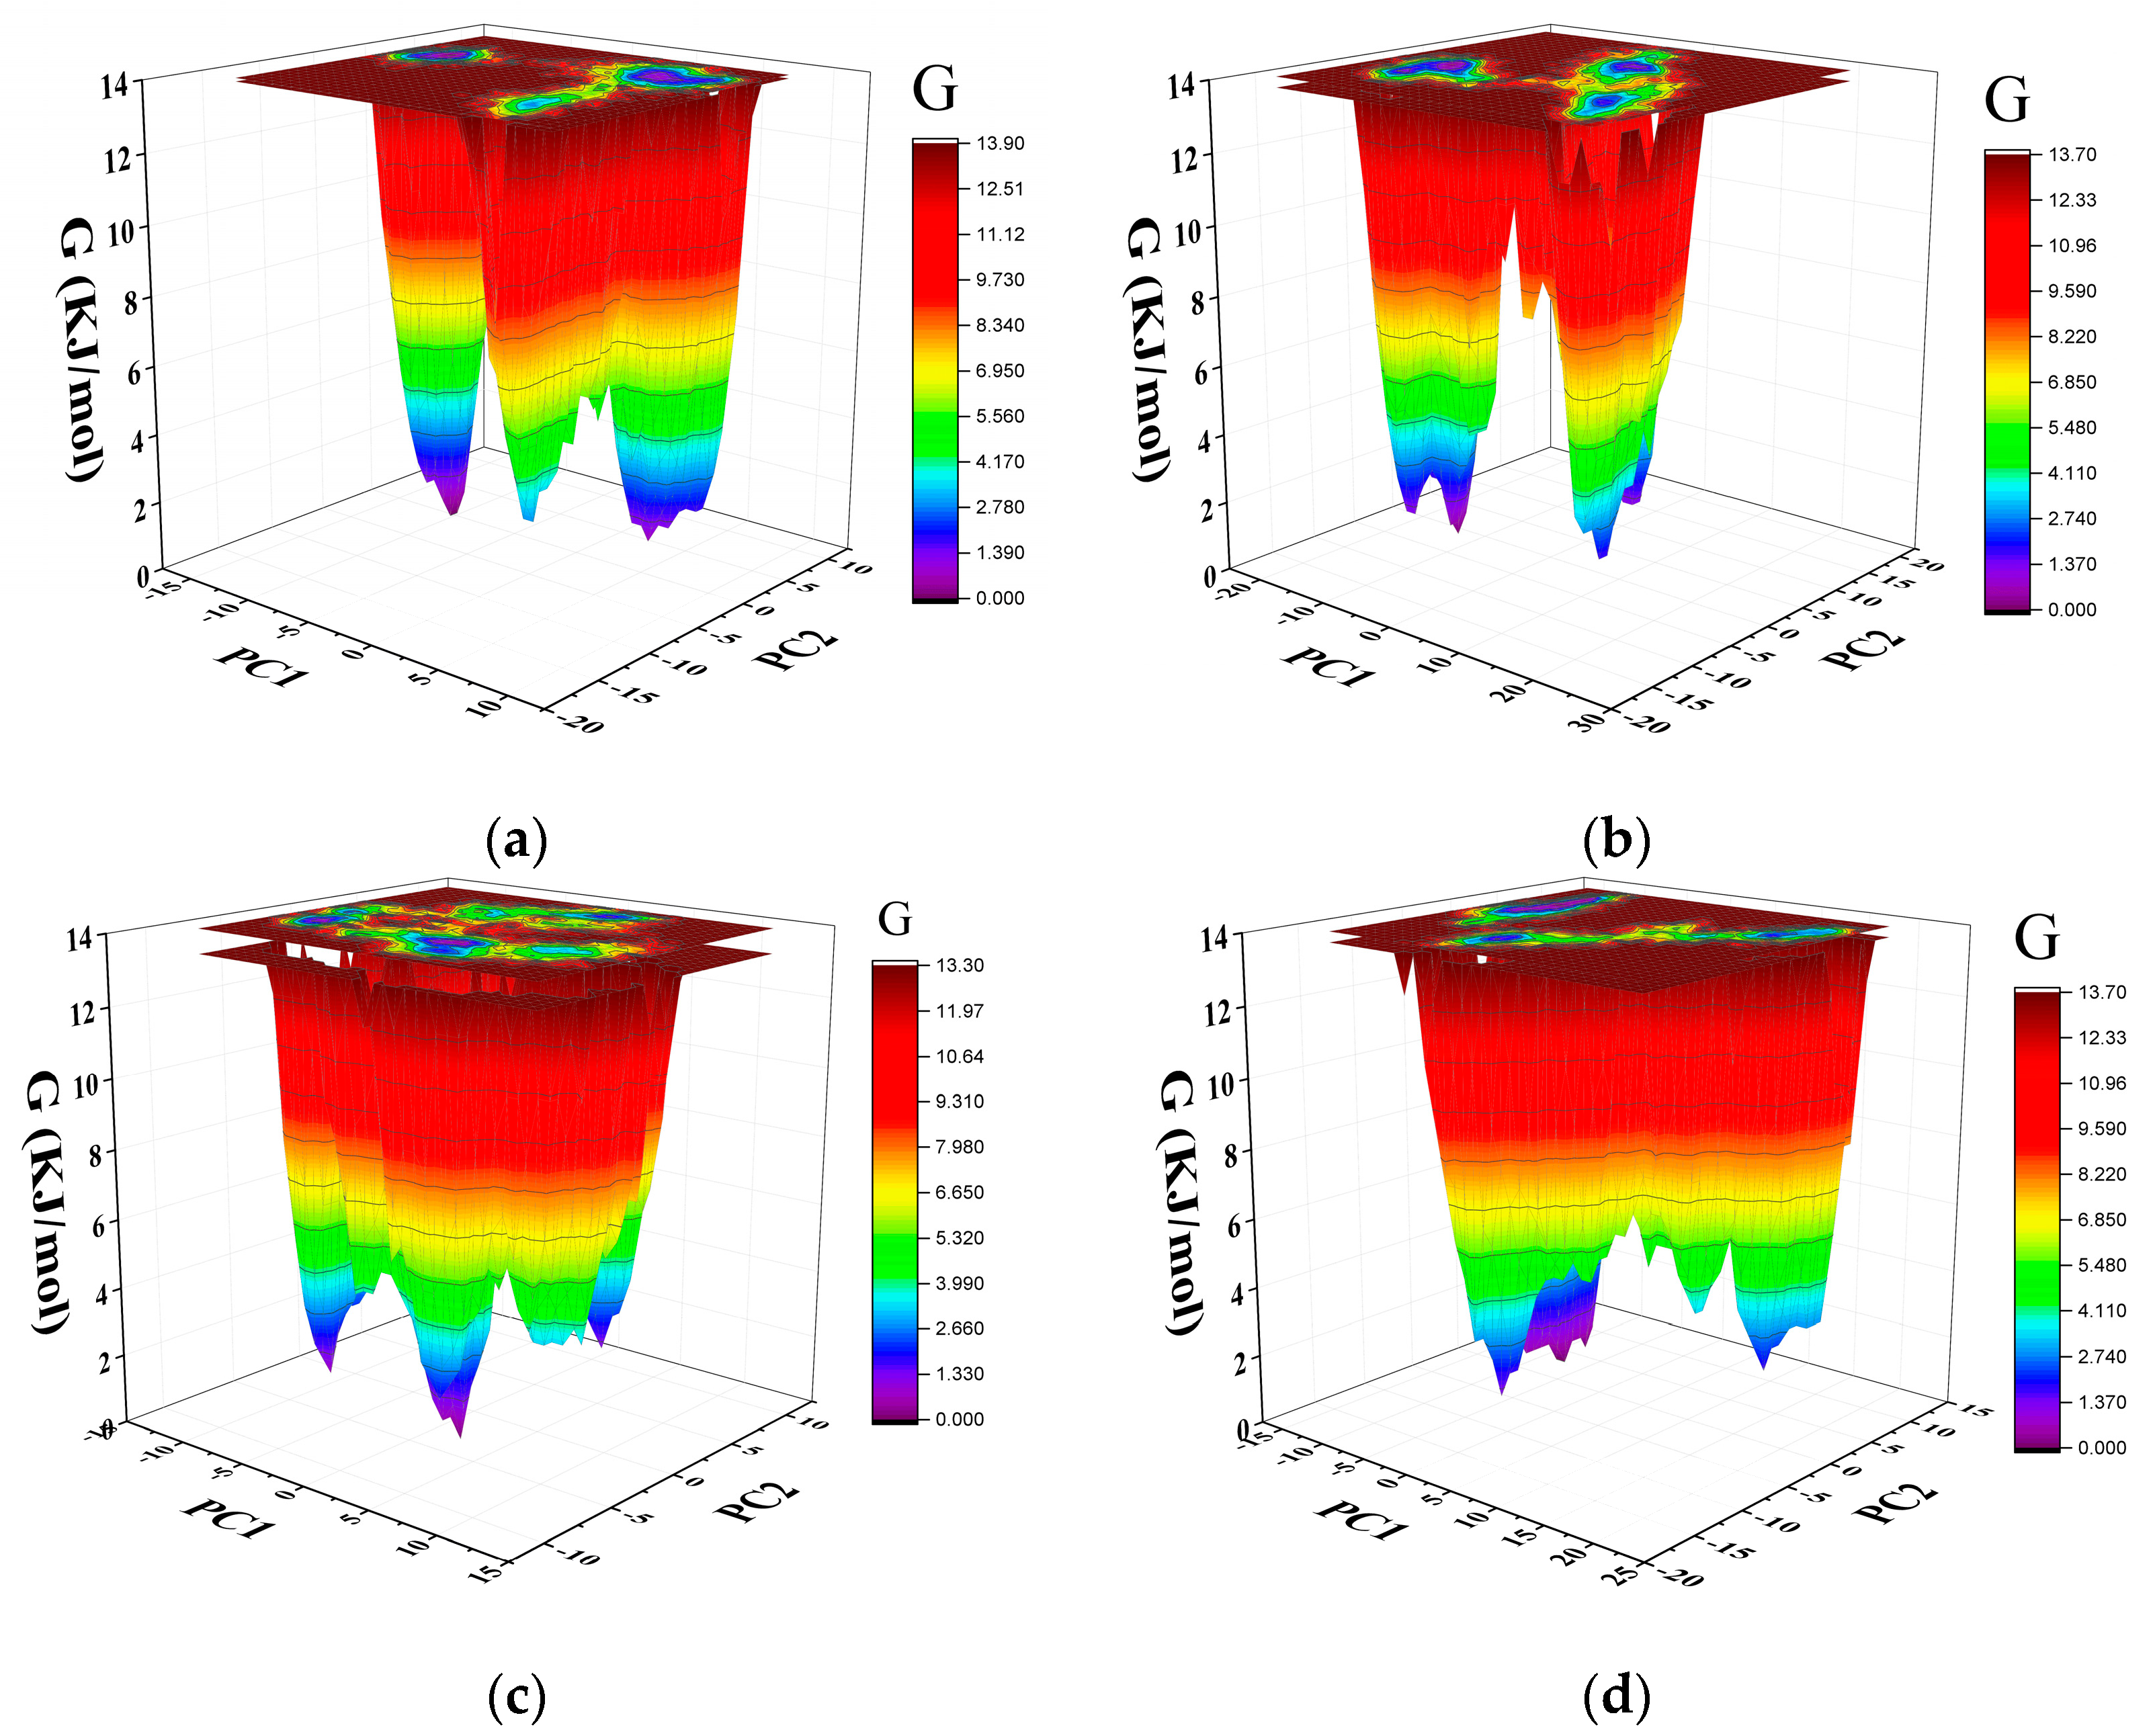
2.7. Gibbs Free Energy Landscape
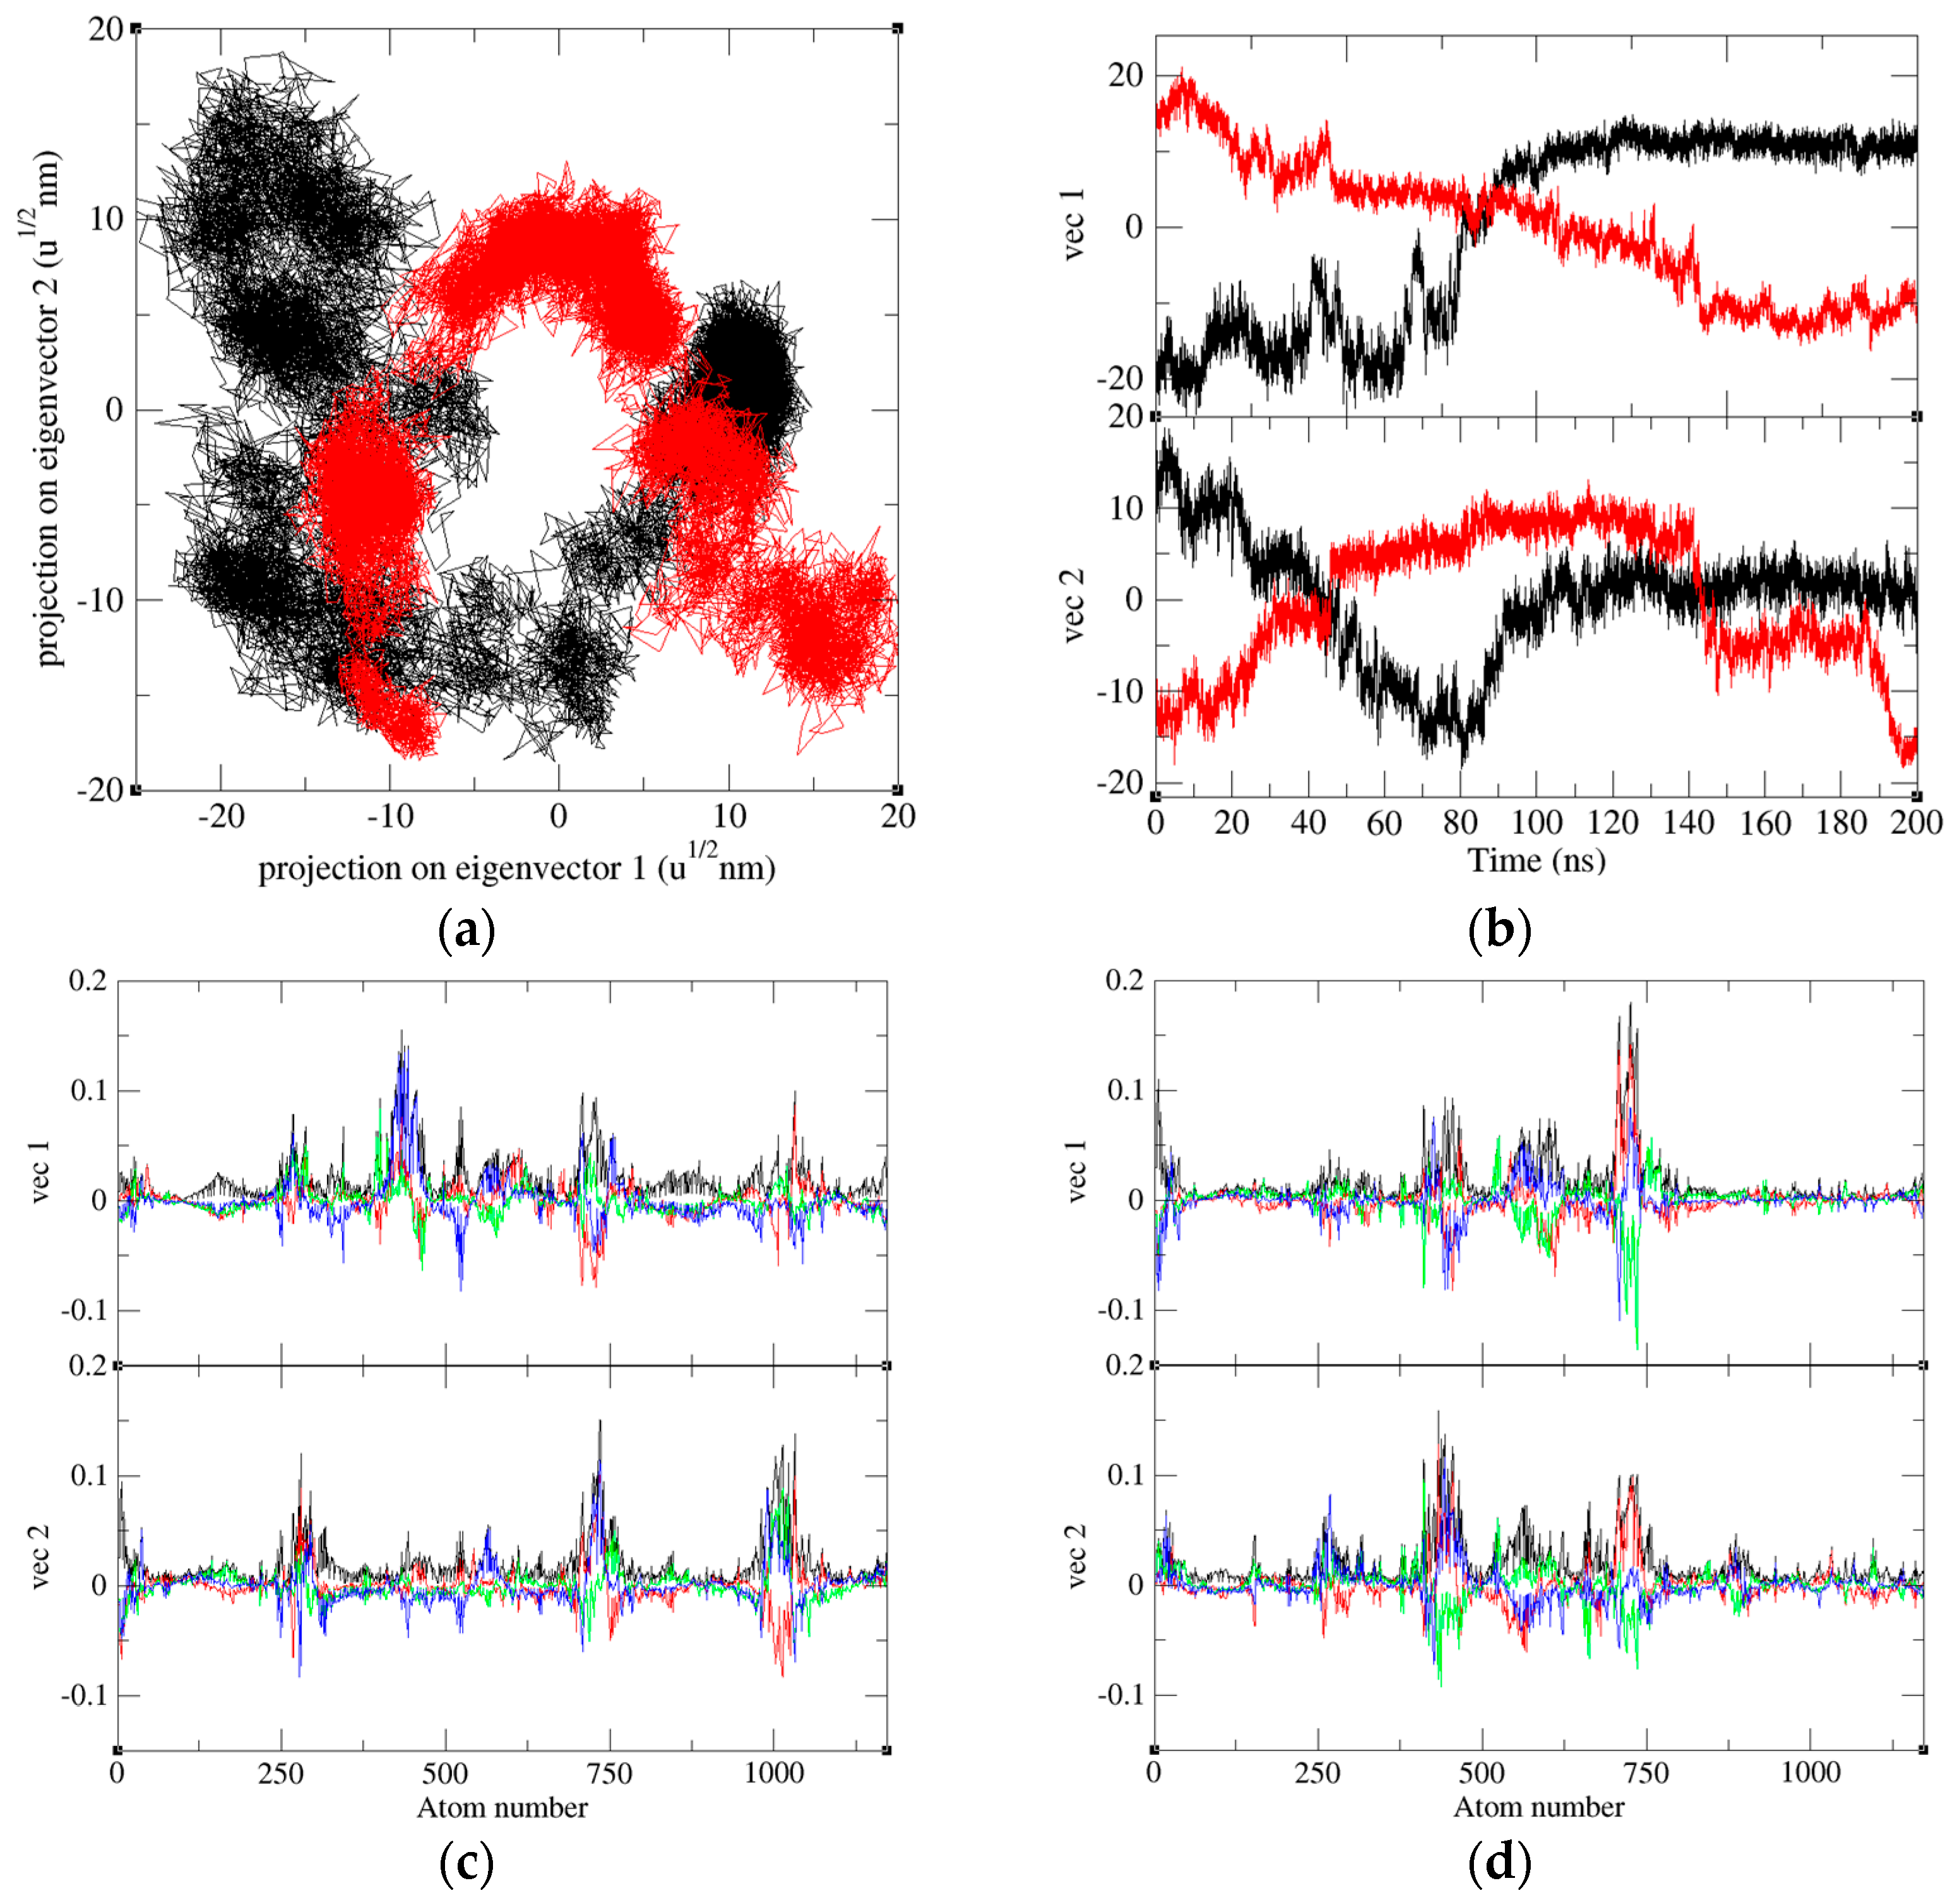
2.8. Principal Component Analysis
2.9. Mechanism of PD-1 and Pembrolizumab Interaction
3. Discussion
4. Materials and Methods
4.1. Molecular Modeling
4.2. Molecular Dynamics Simulations
4.2.1. Root Mean Square Deviation
4.2.2. Root Mean Square Fluctuation
4.2.3. Radius of Gyration
4.3. Principal Component Analysis
4.4. Gibbs Free Energy Landscape
5. Conclusions
Author Contributions
Funding
Institutional Review Board Statement
Informed Consent Statement
Data Availability Statement
Acknowledgments
Conflicts of Interest
References
- Sung, H.; Ferlay, J.; Siegel, R.L.; Laversanne, M.; Soerjomataram, I.; Jemal, A.; Bray, F. Global cancer statistics 2020: GLOBOCAN estimates of incidence and mortality worldwide for 36 cancers in 185 countries. CA A Cancer J. Clin. 2021, 71, 209–249. [Google Scholar] [CrossRef] [PubMed]
- Feain, I.J.; Court, L.; Palta, J.R.; Beddar, S.; Keall, P. Innovations in radiotherapy technology. Clin. Oncol. R Coll. Radiol. 2017, 29, 120–128. [Google Scholar] [CrossRef]
- Waldmann, T.A. Immunotherapy: Past, present and future. Nat. Med. 2003, 9, 269–277. [Google Scholar] [CrossRef] [PubMed]
- Couzin-Frankel, J. Cancer Immunotherapy; American Association for the Advancement of Science: Washington, DC, USA, 2013. [Google Scholar]
- Wu, M.; Huang, Q.; Xie, Y.; Wu, X.; Ma, H.; Zhang, Y.; Xia, Y. Improvement of the anticancer efficacy of PD-1/PD-L1 blockade via combination therapy and PD-L1 regulation. J. Hematol. Oncol. 2022, 15, 24. [Google Scholar] [CrossRef]
- Sewell, A.K. Why must T cells be cross-reactive? Nat. Rev. Immunol. 2012, 12, 669–677. [Google Scholar] [CrossRef]
- Fife, B.T.; Pauken, K.E. The role of the PD-1 pathway in autoimmunity and peripheral tolerance. Ann. N. Y. Acad. Sci. 2011, 1217, 45–59. [Google Scholar] [CrossRef]
- Robert, C.; Ribas, A.; Wolchok, J.D.; Hodi, F.S.; Hamid, O.; Kefford, R.; Weber, J.S.; Joshua, A.M.; Hwu, W.-J.; Gangadhar, T.C. Anti-programmed-death-receptor-1 treatment with pembrolizumab in ipilimumab-refractory advanced melanoma: A randomised dose-comparison cohort of a phase 1 trial. Lancet 2014, 384, 1109–1117. [Google Scholar] [CrossRef]
- Yi, M.; Zheng, X.; Niu, M.; Zhu, S.; Ge, H.; Wu, K. Combination strategies with PD-1/PD-L1 blockade: Current advances and future directions. Mol. Cancer 2022, 21, 28. [Google Scholar] [CrossRef]
- Gong, J.; Chehrazi-Raffle, A.; Reddi, S.; Salgia, R. Development of PD-1 and PD-L1 inhibitors as a form of cancer immunotherapy: A comprehensive review of registration trials and future considerations. J. Immunother. Cancer 2018, 6, 8. [Google Scholar] [CrossRef]
- Patsoukis, N.; Wang, Q.; Strauss, L.; Boussiotis, V.A. Revisiting the PD-1 pathway. Sci. Adv. 2020, 6, eabd2712. [Google Scholar] [CrossRef]
- Han, Y.; Liu, D.; Li, L. PD-1/PD-L1 pathway: Current researches in cancer. Am. J. Cancer Res. 2020, 10, 727. [Google Scholar] [PubMed]
- Francisco, L.M.; Sage, P.T.; Sharpe, A.H. The PD-1 pathway in tolerance and autoimmunity. Immunol. Rev. 2010, 236, 219–242. [Google Scholar] [CrossRef]
- Shi, D.; Zhou, S.; Liu, X.; Zhao, C.; Liu, H.; Yao, X. Understanding the structural and energetic basis of PD-1 and monoclonal antibodies bound to PD-L1: A molecular modeling perspective. Biochim. Biophys. Acta BBA-Gen. Subj. 2018, 1862, 576–588. [Google Scholar] [CrossRef] [PubMed]
- Sun, X.; Yan, X.; Zhuo, W.; Gu, J.; Zuo, K.; Liu, W.; Liang, L.; Gan, Y.; He, G.; Wan, H. PD-L1 nanobody competitively inhibits the formation of the PD-1/PD-L1 complex: Comparative molecular dynamics simulations. Int. J. Mol. Sci. 2018, 19, 1984. [Google Scholar] [CrossRef] [PubMed]
- Horita, S.; Nomura, Y.; Sato, Y.; Shimamura, T.; Iwata, S.; Nomura, N. High-resolution crystal structure of the therapeutic antibody pembrolizumab bound to the human PD-1. Sci. Rep. 2016, 6, 35297. [Google Scholar] [CrossRef]
- Hollingsworth, S.A.; Dror, R.O. Molecular dynamics simulation for all. Neuron 2018, 99, 1129–1143. [Google Scholar] [CrossRef]
- Klepeis, J.L.; Lindorff-Larsen, K.; Dror, R.O.; Shaw, D.E. Long-timescale molecular dynamics simulations of protein structure and function. Curr. Opin. Struct. Biol. 2009, 19, 120–127. [Google Scholar] [CrossRef] [PubMed]
- Karplus, M.; McCammon, J.A. Molecular dynamics simulations of biomolecules. Nat. Struct. Biol. 2002, 9, 646–652. [Google Scholar] [CrossRef]
- Alsaab, H.O.; Sau, S.; Alzhrani, R.; Tatiparti, K.; Bhise, K.; Kashaw, S.K.; Iyer, A.K. PD-1 and PD-L1 checkpoint signaling inhibition for cancer immunotherapy: Mechanism, combinations, and clinical outcome. Front. Pharmacol. 2017, 8, 561. [Google Scholar] [CrossRef]
- Lee, H.T.; Lee, S.H.; Heo, Y.S. Molecular interactions of antibody drugs targeting PD-1, PD-L1, and CTLA-4 in immuno-oncology. Molecules 2019, 24, 1190. [Google Scholar] [CrossRef]
- Baig, M.H.; Ahmad, K.; Roy, S.; Ashraf, J.M.; Adil, M.; Siddiqui, M.H.; Khan, S.; Kamal, M.A.; Provazník, I.; Choi, I. Computer aided drug design: Success and limitations. Curr. Pharm. Des. 2016, 22, 572–581. [Google Scholar] [CrossRef]
- Bernstein, F.C.; Koetzle, T.F.; Williams, G.J.; Meyer, E.F.J.; Brice, M.D.; Rodgers, J.R.; Kennard, O.; Shimanouchi, T.; Tasumi, M. The protein data bank: A computer-based archival file for macromolecular structures. J. Mol. Biol. 1977, 112, 535–542. [Google Scholar] [CrossRef]
- Webb, B.; Sali, A. Comparative protein structure modeling using MODELLER. Curr. Protoc. Bioinform. 2016, 54, 5–6. [Google Scholar] [CrossRef] [PubMed]
- Khan, F.I.; Nizami, B.; Anwer, R.; Gu, K.R.; Bisetty, K.; Hassan, M.I.; Wei, D.Q. Structure prediction and functional analyses of a thermostable lipase obtained from Shewanella putrefaciens. J. Biomol. Struct. Dyn. 2017, 35, 2123–2135. [Google Scholar] [CrossRef] [PubMed]
- Khan, F.I.; Wei, D.Q.; Gu, K.R.; Hassan, M.I.; Tabrez, S. Current updates on computer aided protein modeling and designing. Int. J. Biol. Macromol. 2016, 85, 48–62. [Google Scholar] [CrossRef]
- Khan, F.I.; Govender, A.; Permaul, K.; Singh, S.; Bisetty, K. Thermostable chitinase II from thermomyces lanuginosus SSBP: Cloning, structure prediction and molecular dynamics simulations. J. Theor. Biol. 2015, 374, 107–114. [Google Scholar] [CrossRef]
- Khan, F.I.; Song, H.; Hassan, F.; Tian, J.; Tang, L.; Lai, D.; Juan, F. Impact of amino acid substitutions on the behavior of a photoactivatable near infrared fluorescent protein PAiRFP1. Spectrochim. Acta. Part A Mol. Biomol. Spectrosc. 2021, 253, 119572. [Google Scholar] [CrossRef] [PubMed]
- Khan, F.I.; Lan, D.; Durrani, R.; Huan, W.; Zhao, Z.; Wang, Y. The lid domain in lipases: Structural and functional determinant of enzymatic properties. Front. Bioeng. Biotechnol. 2017, 5, 16. [Google Scholar] [CrossRef]
- Laskowski, R.A.; Jabłońska, J.; Pravda, L.; Vařeková, R.S.; Thornton, J.M. PDBsum: Structural summaries of PDB entries. Protein Sci. A Publ. Protein Soc. 2018, 27, 129–134. [Google Scholar] [CrossRef]
- Biovia, D.S. Discovery Studio Modeling Environment. Release. 2017. Available online: https://www.bibsonomy.org/bibtex/23b2245c892c43eb0c25b9e7096a7737a/salotz (accessed on 6 June 2023).
- DeLano, W.L. The PyMOL Molecular Graphics System. 2002. Available online: http://www.pymol.org (accessed on 6 June 2023).
- Khan, F.I.; Hassan, F.; Anwer, R.; Juan, F.; Lai, D. Comparative analysis of bacteriophytochrome Agp2 and its engineered photoactivatable NIR fluorescent proteins PAiRFP1 and PAiRFP2. Biomolecules 2020, 10, 1286. [Google Scholar] [CrossRef]
- Khan, F.I.; Gupta, P.; Roy, S.; Azum, N.; Alamry, K.A.; Asiri, A.M.; Lai, D.; Hassan, M.I. Mechanistic insights into the urea-induced denaturation of human sphingosine kinase 1. Int. J. Biol. Macromol. 2020, 161, 1496–1505. [Google Scholar] [CrossRef] [PubMed]
- Khan, F.I.; Hassan, F.; Ali, H.; Lai, D. Mechanism of pH-induced conformational changes in MurE ligase obtained from salmonella enterica serovar typhi. J. Biomol. Struct. Dyn. 2021, 39, 1898–1905. [Google Scholar] [CrossRef]
- Hess, B.; Kutzner, C.; Van Der Spoel, D.; Lindahl, E. GROMACS 4: Algorithms for highly efficient, load-balanced, and scalable molecular simulation. J. Chem. Theory Comput. 2008, 4, 435–447. [Google Scholar] [CrossRef]
- Khan, F.I.; Kang, T.; Ali, H.; Lai, D. Remdesivir strongly binds to RNA-dependent RNA polymerase, membrane protein, and main protease of SARS-CoV-2: Indication from molecular modeling and simulations. Front. Pharmacol. 2021, 12, 710778. [Google Scholar] [CrossRef] [PubMed]
- Khan, F.I.; Ali, S.; Chen, W.; Anjum, F.; Shafie, A.; Hassan, M.; Lai, D. High-resolution MD simulation studies to get mechanistic insights into the urea-induced denaturation of human sphingosine kinase 1. Curr. Top. Med. Chem. 2021, 21, 2839–2850. [Google Scholar] [CrossRef] [PubMed]


| Complex | Hydrogen Bonds | Van Der Waals | Salt Bridges |
|---|---|---|---|
| PD-1—Light chain of Pembrolizumab | Ser60-Tyr34, Glu61-Tyr57 and Leu128-Tyr53 | Glu61-Gly33 and Glu61-Tyr34 | Arg86-Arg96 |
| PD-1—Heavy chain of Pembrolizumab | Asn66-Arg102, Gln75-Thr30, Thr76-Tyr101, Asp77-Ser54, Lys78-Tyr101, Lys78-Thr33, Ser87-Arg99, Ser87-Asn59, Ser87-Thr35 and Gly90-Thr58 | Gln75-Thr28, Lys78-Arg99, Lys78-Arg102, Arg86-Tyr33, Asp85-Tyr101, Ser87-Ser95, Ser87-Leu98, Ser87-Leu100, Gly90-Gly57 and Gly90-Asn59 | Asp85-Arg99 |
| Protein | Structure | Coil | β-Sheet | β-Bridge | Bend | Turn | α-Helix | 3-Helix |
|---|---|---|---|---|---|---|---|---|
| PD-1 | 57% | 25% | 49% | 1% | 17% | 7% | 0% | 1% |
| PD-1/Pembrolizumab complex | 61% | 25% | 50% | 0% | 13% | 11% | 0% | 1% |
Disclaimer/Publisher’s Note: The statements, opinions and data contained in all publications are solely those of the individual author(s) and contributor(s) and not of MDPI and/or the editor(s). MDPI and/or the editor(s) disclaim responsibility for any injury to people or property resulting from any ideas, methods, instructions or products referred to in the content. |
© 2023 by the authors. Licensee MDPI, Basel, Switzerland. This article is an open access article distributed under the terms and conditions of the Creative Commons Attribution (CC BY) license (https://creativecommons.org/licenses/by/4.0/).
Share and Cite
Wang, S.; Khan, F.I. Investigation of Molecular Interactions Mechanism of Pembrolizumab and PD-1. Int. J. Mol. Sci. 2023, 24, 10684. https://doi.org/10.3390/ijms241310684
Wang S, Khan FI. Investigation of Molecular Interactions Mechanism of Pembrolizumab and PD-1. International Journal of Molecular Sciences. 2023; 24(13):10684. https://doi.org/10.3390/ijms241310684
Chicago/Turabian StyleWang, Simiao, and Faez Iqbal Khan. 2023. "Investigation of Molecular Interactions Mechanism of Pembrolizumab and PD-1" International Journal of Molecular Sciences 24, no. 13: 10684. https://doi.org/10.3390/ijms241310684
APA StyleWang, S., & Khan, F. I. (2023). Investigation of Molecular Interactions Mechanism of Pembrolizumab and PD-1. International Journal of Molecular Sciences, 24(13), 10684. https://doi.org/10.3390/ijms241310684