Article

DNA Methylation of Genes Participating in Hepatic Metabolisms and Function in Fetal Calf Liver Is Altered by Maternal Undernutrition during Gestation

1
Division of Animal Products Research, NARO Institute of Livestock and Grassland Science (NILGS), Tsukuba 305-0901, Ibaraki, Japan
2
Joint Faculty of Veterinary Medicine, Kagoshima University, Korimoto 1-21-24, Kagoshima 890-8580, Kagoshima, Japan
3
Division of Year-Round Grazing Research, NARO Western Region Agricultural Research Center, 60 Yoshinaga, Ohda 694-0013, Shimane, Japan
4
Department of Agricultural Sciences and Natural Resources, Kagoshima University, Korimoto 1-21-24, Kagoshima 890-8580, Kagoshima, Japan
5
Field Science Center for Northern Biosphere, Hokkaido University, N11W10, Kita, Sapporo 060-0811, Hokkaido, Japan
*
Author to whom correspondence should be addressed.
Int. J. Mol. Sci. 2023, 24(13), 10682; https://doi.org/10.3390/ijms241310682
Submission received: 29 May 2023 / Revised: 18 June 2023 / Accepted: 21 June 2023 / Published: 26 June 2023

Abstract

:
This study aimed to elucidate the effects of maternal undernutrition (MUN) on epigenetic modification of hepatic genes in Japanese Black fetal calves during gestation. Using a previously established experimental design feeding the dams with 60% (LN) or 120% (HN) of their global nutritional requirements during the 8.5-month gestational period, DNA methylation in the fetal liver was analyzed with reduced representation bisulfite sequencing (RRBS). The promoters and gene bodies in the LN fetuses were hypomethylated compared to HN fetuses. Pathway analysis showed that the genes with DMR in the exon/intron in the LN group were associated with pathways involved in Cushing syndrome, gastric acid secretion, and aldosterone synthesis and secretion. Promoter hypomethylation in the LN group was frequently observed in genes participating in various signaling pathways (thyroid hormone, Ras/Rap1, PIK3-Akt, cAMP), fatty acid metabolism, and cholesterol metabolism. The promoter hypomethylated genes ALPL and GNAS were upregulated in the LN group, whereas the promoter hypermethylated genes GRB10 and POR were downregulated. The intron/exon hypomethylated genes IGF2, IGF2R, ACAD8, TAT, RARB, PINK1, and SOAT2 were downregulated, whereas the hypermethylated genes IGF2BP2, NOS3, and NR2F1 were upregulated. Collectively, MUN alters the promoter and gene body methylation of genes associated with hepatic metabolisms (energy, cholesterol, mitochondria) and function, suggesting an impact of altered gene methylation on the dysregulation of gene expression in the fetal liver.

1. Introduction

In the early life stages of mammals, the nutrient levels of proteins, amino acids (AAs), carbohydrates, fatty acids (FAs), vitamins, and minerals are crucial for development, growth, and subsequent health maintenance [1]. The deficiency of these nutrients in maternal nutrition during gestation has a severe impact on the fetus, leading to fetal growth restriction (FGR) [1,2]. The malnourished fetal environment does not satisfy the demand for energy and resources to accumulate proteins for skeletal muscle growth in fetal calves [3]. Prolonged nutrition stress due to maternal undernutrition (MUN) impairs not only the growth of a variety of organs, including the skeletal muscles and liver [4,5,6,7,8], but also systemic metabolism by altering the secretion of/sensitivity to glucose, insulin, and insulin-like growth factor-1 (IGF1) [2]. Furthermore, altered glucose homeostasis in MUN-exposed animals often causes long-lasting metabolic diseases in adolescence and adulthood, such as obesity, type II diabetes, and hypertension in humans and animal models [1,9].
The MUN effects are also evident in early epidemiological studies of the Dutch Famine Winter during World War II, which gave rise to the “Developmental Origin of Health and Diseases (DOHaD)” hypothesis, a concept that environmental and nutritional stress experienced by animals in early developmental stages leads to severe chronic diseases in later life [10]. In other words, the systemic metabolism over a life-long period can be programmed by the nutrient levels to which the animals are exposed during early developmental stages via changes in metabolic response to the environmental and nutritional conditions. DNA methylation, the epigenetic mechanism underlying this phenomenon, has been proposed to play a major role in metabolic programming in early life stages [11,12]. However, direct evidence regarding the role of DNA methylation in this programming phenomenon remains limited.
The initial phenotypic effect of MUN on fetuses appears as FGR, which is considered to vary among animal species, gestational stage, restricted nutrients, and period of exposure to low nutrients [13]. The results of FGR differ between animal organs [4,8,14], suggesting that MUN affects fetal DNA methylation differently in different organs. The liver plays an indispensable role in whole-body homeostasis because it plays a role as the center of metabolic regulation [15]; therefore, a functional disturbance of the liver seriously impairs health throughout life. During fetal development, liver growth and function are susceptible to the restriction of global nutrients or calories in pregnant mice [16], rats, guinea pigs, sheep, and cattle [17,18,19,20,21]. In fetal calves, energy metabolism, IGFs, and hormone-mediated gene regulatory networks are disrupted [21]. Moreover, these liver disturbances potentially result in a predisposition of the fetus to systemic homeostatic disorders and subsequent metabolic diseases in later life [11], such as obesity, type II diabetes, and non-alcoholic fatty liver disease (NAFLD) [22]. These observations suggest that the adverse phenotypic effects of MUN in later life are mediated by DNA methylation.
In the offspring of pregnant protein-restricted rat dams, hepatic DNA methylation of peroxisomal proliferator-activated receptor α (PPARA) and glucocorticoid receptor (GR) is lowered, which is accompanied by transcriptional upregulation [23,24,25]. A low-protein diet fed to dams during gestation alters the gene methylation of insulin-like growth factor 2 (IGF2), nuclear receptor 3C1 (NR3C1), cytochrome P450-2C34 (CYP2C34), and liver X-receptor α (LXRA) in mouse, rat, and pig offspring [26,27,28]. Thus, the methylation of these key metabolic genes in the fetal liver is likely altered by aberrant dietary nutrient levels in pregnant dams. Recently, we observed a notable disturbance in gene expression specific to liver functions, such as gluconeogenesis, steroid biosynthesis, glucuronidation, and the urea cycle in bovine MUN fetuses [21]. This suggests that DNA methylation of genes associated with liver-specific functions could be altered by MUN.
The effect of MUN on fetal growth and metabolism is of primal importance in farm animals, leading to the alteration of productive traits, including meat yield and quality. The adverse effects of MUN on animals lead to significant economic losses in the animal industry. Meanwhile, intramuscular triglyceride content is upregulated in the nutrition-restricted fetal skeletal muscles [29]. This indicated that the skeletal muscles of nutrition-restricted fetuses are predisposed to insulin resistance by fetal programming, which can lead to intramuscular fat accumulation in beef, an important attribute for high marbled beef, especially for Wagyu (Japanese Black; JB) cattle. Epigenetic modifications, such as DNA methylation, potentially underlie the MUN effect; therefore, methylated CpG (CG) loci could be potential biomarkers for predicting livestock productivity to select advantageously programmed animals. In addition, farm animals, including sheep, are good models for investigating the impact of MUN on human health and disease because of their similarity to human placental and fetal development compared to rodents [9].
With this background, the present study addressed the effect of global nutrient restriction in pregnant cows on the fetal calf liver epigenetics, focusing on the CG methylation of hepatic genes. Dams of JB cattle were fed 60% (LN) and 120% (HN) of nutritional requirement levels based on protein, fat, and energy contents during the gestation until month 8.5 post-conception, with 120% nutritional level for non-pregnant cows being considered as a control level. This nutritional level meets approximately 100% of the requirements for the maintenance of pregnant JB cows, based on the Japanese Feeding Standard for Beef Cattle (JFSBC) (2008 ed.) [30]. Using this experimental design, we previously observed significant phenotypic differences in various tissues between LN and HN fetuses [3,8,21]. Here, CG methylation of the fetal liver was analyzed by reduced representation bisulfite sequencing (RRBS), the data of which were further subjected to bioinformatics analyses to understand the impact of MUN on CG methylation of genes in the fetal liver.

2. Results

2.1. Phenotypic Effect of Maternal Nutrient Restriction on Fetuses

The growth of the entire body and liver of fetal calves was affected by MUN. The ratios of body weight (BW) to liver weight in the LN group to those in the HN group were 0.71 and 0.74, respectively, indicating significantly lower BW and liver weight in the LN fetuses compared to the HN fetuses (p ≤ 0.05) (Table 1). No significant difference in the percentage of liver weight was observed between groups. MUN markedly decreased liver mass in the LN group.

2.2. Distribution of DNA Methylation in LN and HN Fetal Liver Genome

To investigate the effect of MUN on genomic DNA (gDNA) methylation in the fetal liver, we conducted an RRBS analysis of differentially methylated DNA. For downstream analyses of the sequencing, we calculated single-base read coverage and genome coverage distribution, which confirmed that the average base coverage of the genome was more than 10× across the samples. The mapping result of the obtained sequences to the reference genome showed that the total cytosine coverage of the genome was 62.2–81.1 Mb across the samples, whereas the average methylation level of all the cytosines was 6.56–6.61% (Table S1). These results indicated that despite the lower site number, CG was much more methylated than CHG and CHH. In addition, variations in the methylation levels in each genomic region were much higher in the CHG and CHH contexts than in the CG context. Therefore, we focused on methylation levels in the CG for subsequent analyses.
The analysis of methylation levels in each functional genomic region revealed that the methylation in the 5′-untranslated region (UTR5) was at a minimal level (Figure 1A). In contrast, the levels of methylation in the 3′-untranslated region (UTR3) and repeated region were notably higher compared to other regions in both the LN and HN groups. In the exon, intron, UTR3, and repeat regions, the methylation levels were slightly lower in the LN group than in the HN group. Within the gene structure, methylation was at the lowest level at the translation start site (TSS). The methylation level was increased with the distance from the TSS towards upstream or downstream in the coding regions (Figure 1B). The downstream region at a distance of 2 kb from the translation end site (TES) had a lower methylation level compared to TES.

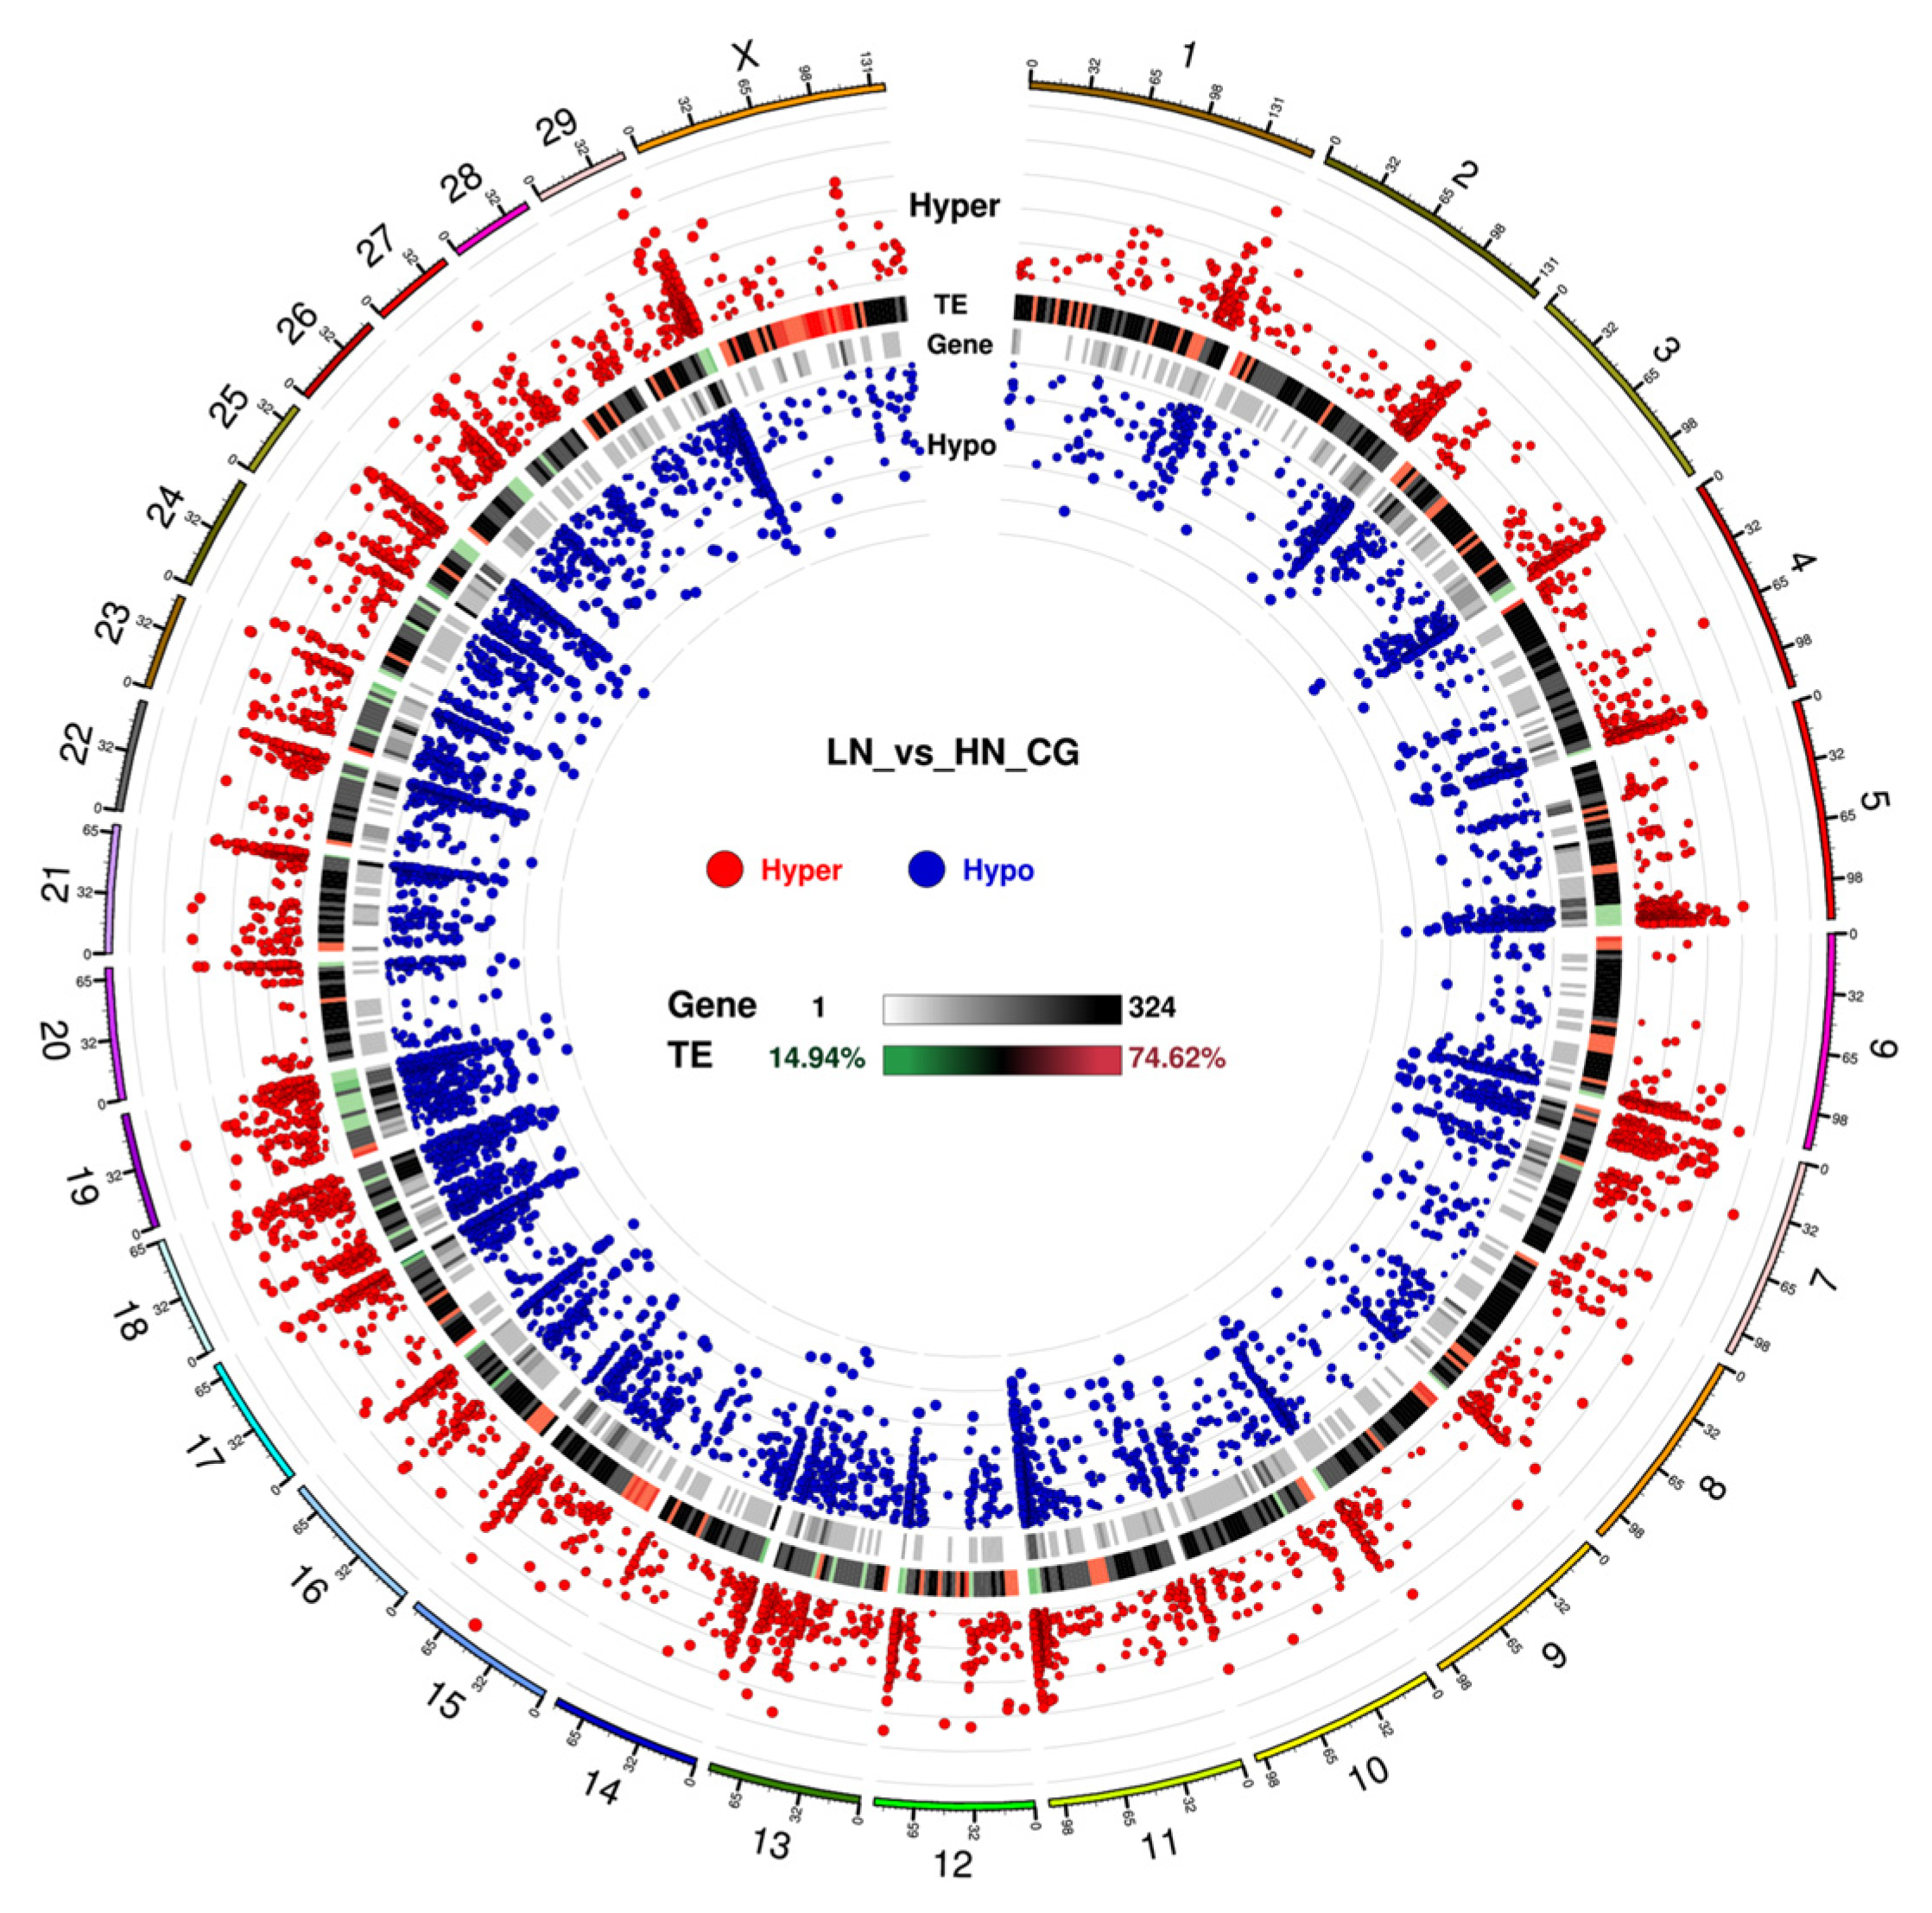
2.3. Differential DNA Methylation between LN and HN Fetal Liver

The distribution of the differentially methylated (DM) region (DMR) and CG locus (DML) in each functional genomic region revealed a remarkable trend, where hypomethylation was more predominant than hypermethylation in the promoter, exon, and intron regions of genes in LN fetal liver (Table 2, Figure 2). In particular, the number of hypomethylated CG loci was approximately 1.3-fold higher than that of hypermethylated loci in the entire genome, especially the exon and intron regions (Table 2).
In the promoter region, the number of hypomethylated loci was 1.19-fold higher than that of the hypermethylated loci in the LN fetuses. Notably, in the gene body and repeat regions, the ratio of the hypermethylated loci/total hypermethylated loci was similar to the ratio of the hypomethylated loci/total hypomethylated loci, whereas the ratio of hypermethylated loci was slightly different from that of hypomethylated loci in promoter and UTR. The significance and distribution of DMR on specific chromosomes are illustrated in a circus plot (Figure 3). The telomeric region in most of the chromosomes showed an abundance trend in both hyper- and hypo DMR. Meanwhile, chromosomes 18, 19, 23, and 25 were dense with uniformly distributed DMR. Notably, the upstream region, excluding the telomeric region, of chromosome 7 was abundantly hypermethylated and hypomethylated, which was not observed in the other chromosomes.

2.4. Kyoto Encyclopedia of Genes and Genomes (KEGG) Pathways Associated with Differentially Methylated Genes

KEGG pathway analysis was performed using all DMR to understand the molecular and cellular events associated with the DM genes (Figure 4 and Figure 5). Regulation of the actin cytoskeleton, Rap1 signaling pathway, oxytocin signaling pathway, MAPK signaling pathway, leukocyte transendothelial migration, Hippo signaling pathway, axon guidance, focal adhesion, calcium signaling pathway, and Cushing syndrome, as well as pathways related to cancer (FDR < 0.0005), were extracted as the top 20 molecular pathways using all DMR-including genes (Figure 4A,B).
When limited to the promoter region, hypermethylated genes were enriched only in the regulation of the actin cytoskeleton (FDR = 0.0083). In contrast, hypomethylated genes were enriched in cellular regulatory pathways, such as Ras signaling pathway, adrenergic signaling in cardiomyocytes, hypertrophic cardiomyopathy (HCM), MAPK signaling pathway, PI3K-Akt signaling pathway, adherens junction, p53 signaling pathway, regulation of actin cytoskeleton, Rap1 signaling pathway, and FA metabolism (FDR < 0.0500; Figure 5A,B). As most of the top 20 pathways were commonly observed in both hyper- and hypomethylated genes when extracted from DM genes in promotor, gene body, and/or UTR, we disregarded the resultant pathways with FDR ≥ 0.001. Of the remaining pathways, after excluding the commonly extracted pathways, six pathways were found to be specific to hypermethylated genes, including mTOR signaling, apelin signaling, and inositol phosphate metabolism (Table 3).
Meanwhile, 26 were identified as pathways specific to hypomethylated genes, including the metabolism of gastric acid secretion and cortisol synthesis/secretion, as well as signaling pathways involving insulin, Ras, PI3K-Akt, neurotrophin, and thyroid hormones.

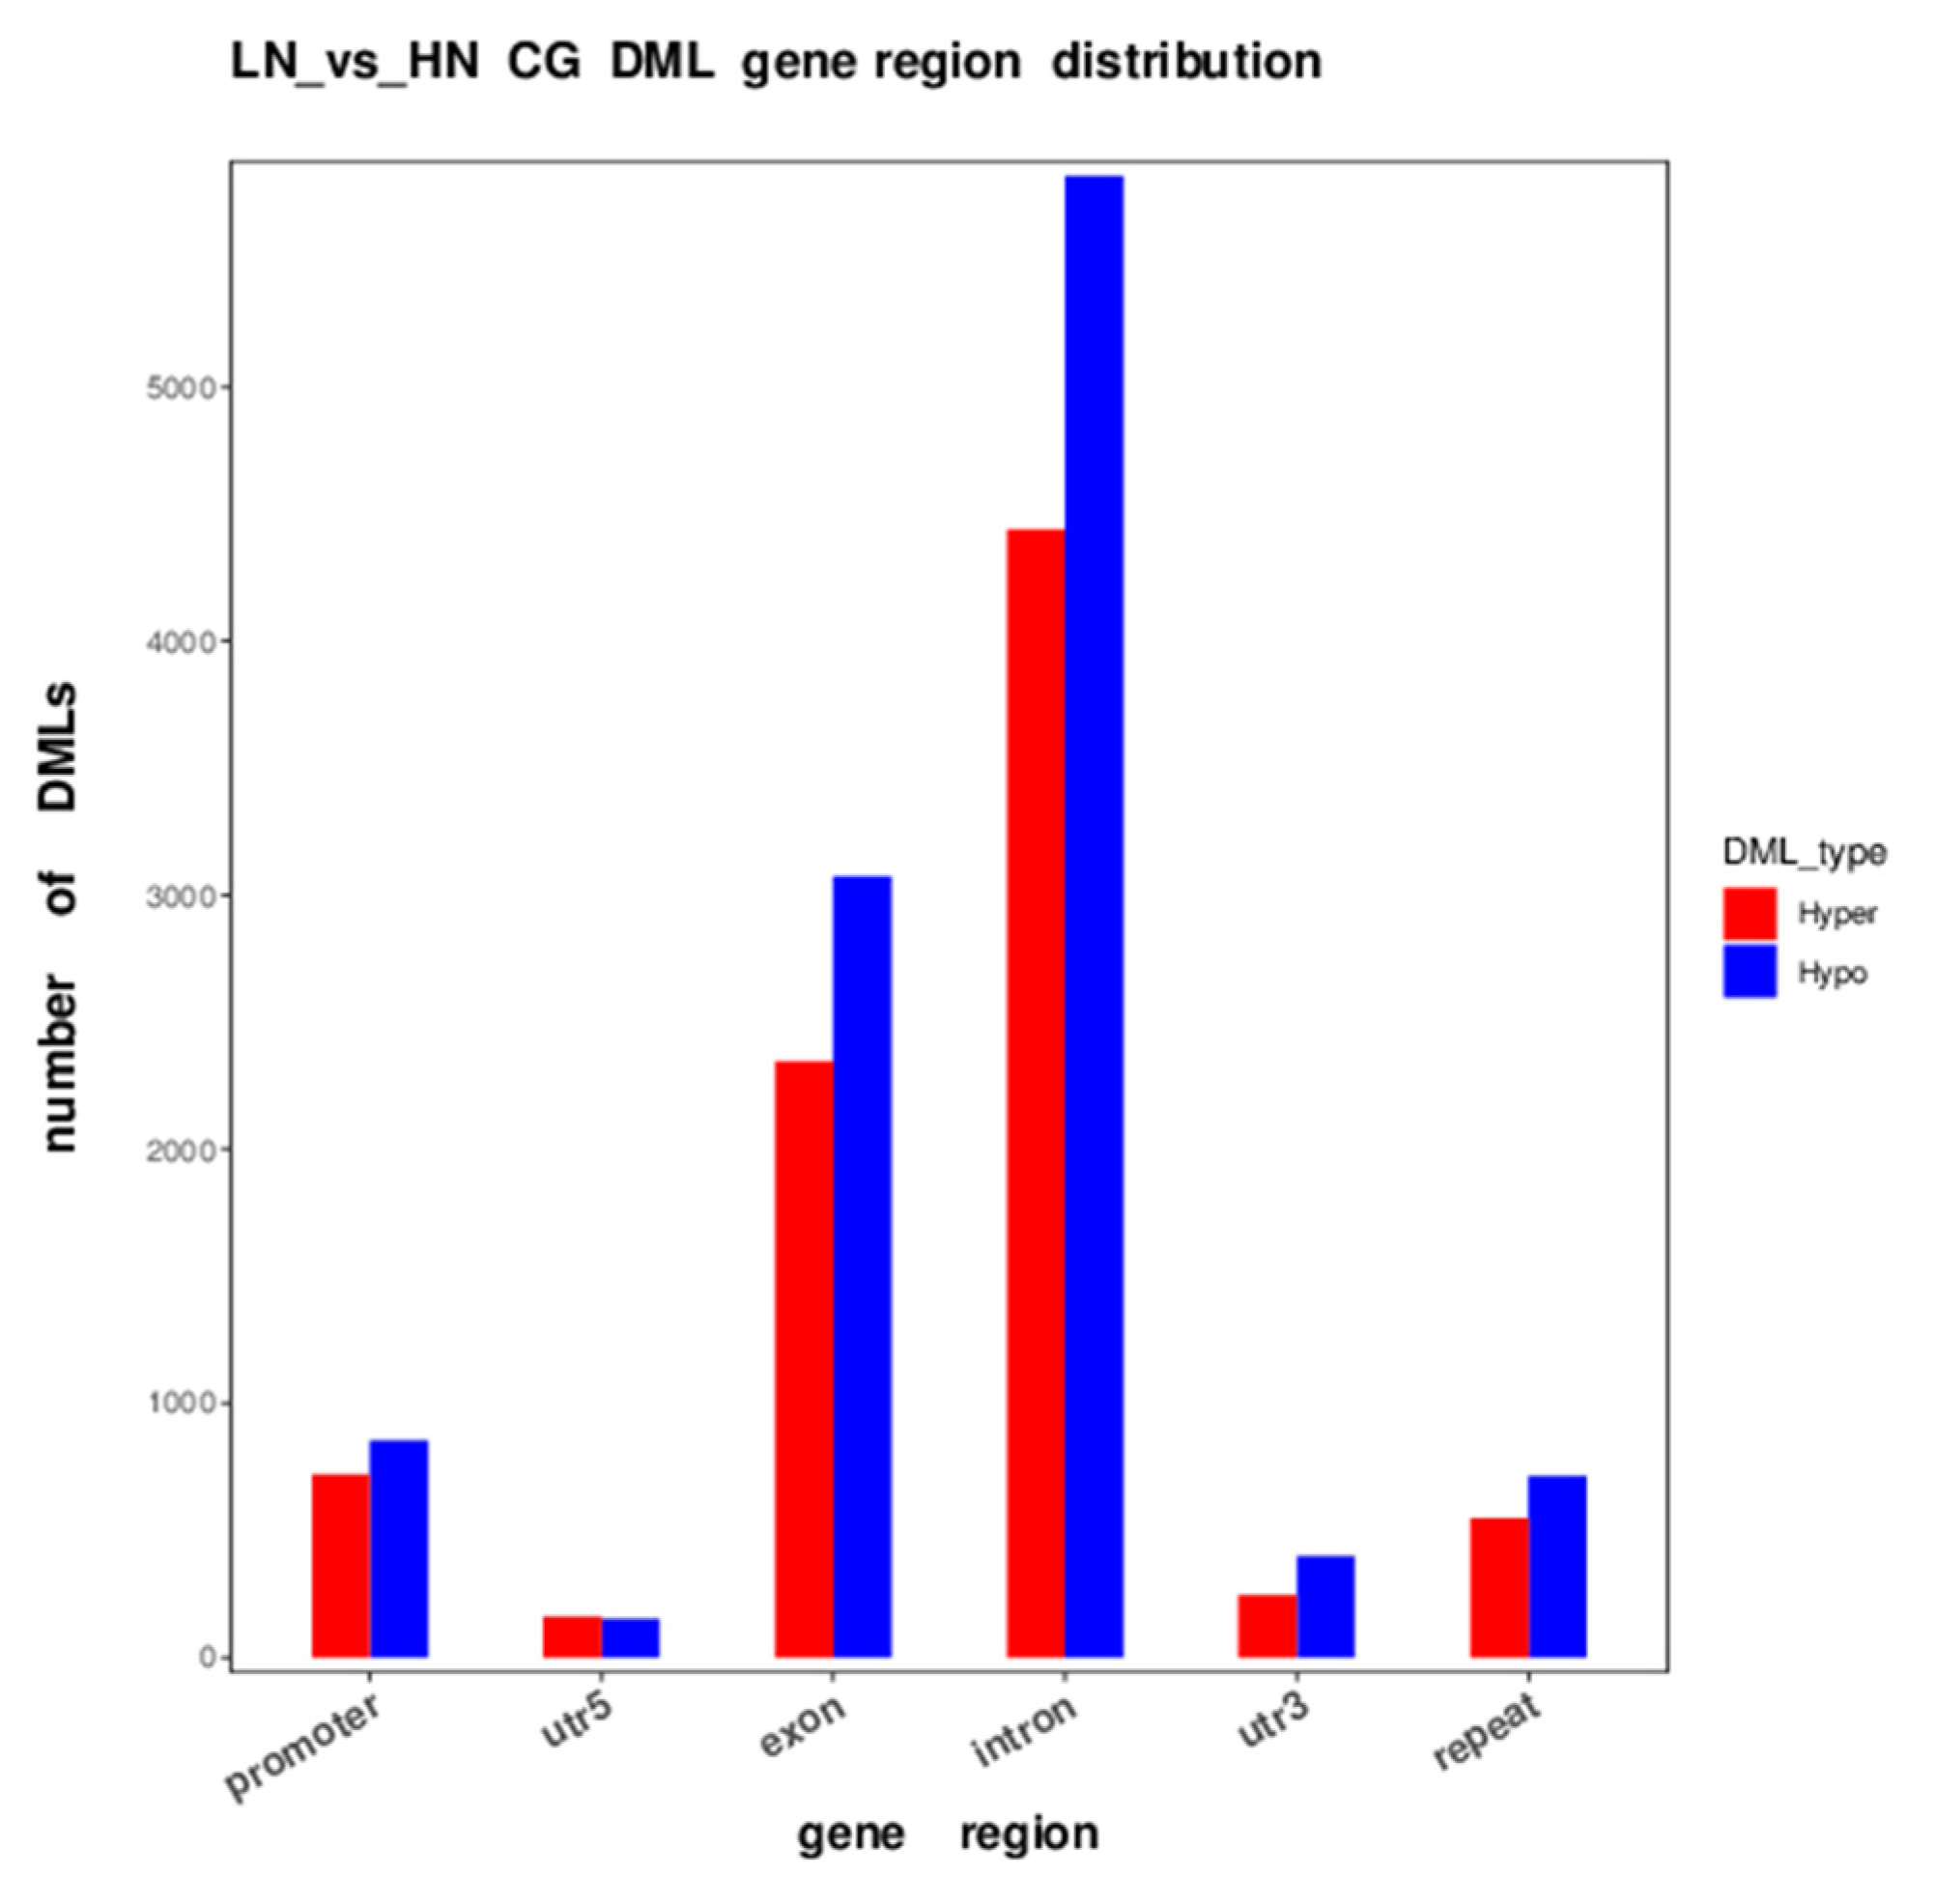
2.5. Genes with Differentially Methylated Loci in Each Genomic Feature

As shown in Figure 2, MUN-altered methylated loci were enriched in the exon, intron, and promoter regions, which raised the possibility of a regional genomic preference for the MUN effect on methylation. Therefore, we focused on the genes with distinct loci in each genomic region. Based on the statistical analysis, significant DML between LN and HN fetuses was extracted. Subsequently, utilizing the extent of the level of CG methylation difference, we identified the top 15 genes that were significantly hypermethylated (Table S2) and hypomethylated (Table S3) in the promoter, exon, and intron regions between the two fetus groups.
Of the promotor hypermethylated genes, lymphocyte-specific protein 1 (LSP1), cytochrome p450 oxidoreductase (POR), and ankyrin repeat and BTB domain-containing 1 (ABTB1) were downregulated in mRNA expression in LN fetal liver at LN/HN ratios of 0.661, 0.873, and 0.796, respectively (p < 0.092), in microarray analysis (Table 4). However, no exon/intron-hypermethylated genes showed significant transcriptional differences between LN and HN fetal livers.
G-protein α subunit (GNAS) and ribosomal protein S29 (RPS29) mRNA expression were upregulated at LN/HN ratios of 1.410 and 1.312, respectively (p < 0.060), whereas insulin-like growth factor 2 (IGF2) was downregulated (Table 4). The exon/intron-hypomethylated genes unc-13 homolog D (UNC13D), sterol O-acyltransferase 2 (SOAT2), solute carrier family 39 member 11 (SLC39A11), IGF2, and nth-like DNA glycosylase 1 (NTHL1) were downregulated at LN/HN ratios of 0.699, 0.692, 0.798, 0.851, and 0.888, respectively (p < 0.090). These results indicated that altered CG methylation in the promoter, exon, and intron regions potentially impact gene expression, with MUN-induced gene-body methylation being particularly associated with the downregulation of hepatic genes.

2.6. Alteration in CG Methylation and Gene Expression Is Associated with Energy Metabolism, Steroid Synthesis, and IGF2 Signaling Pathway

During late gestation in the fetal liver, metabolism related to glucose, lipids, tyrosine, steroid hormones, cholesterol synthesis, and reduction–oxidation (redox) processes are affected by the LN status [21]. Moreover, LN conditions altered CG methylation and expression of genes associated with metabolism related to energy homeostasis (GNAS), cholesterol (SOAT2), insulin/IGF signaling (IGF2), oxidative stress (POR), and the PI3K/AKT/FOXO1 pathway (ABTB1) (Figure 4, Table 4). The expression of these genes can be up- or downregulated by CG methylation in their promoter and/or gene body regions [31]. Accordingly, among significant DM genes participating in IGF signaling, energy homeostasis, redox, and cholesterol metabolisms, we further investigated whether the expression of the relevant genes is linked with the DNA methylation changes or not.
In the quantitative PCR (qPCR) analyses targeting a total of 58 candidate genes, downregulated expression was observed in genes for the regulator downstream of IGF2 signaling, growth factor receptor-binding protein 10 (GRB10; promoter hypermethylated), a urea cycle enzyme, tyrosine aminotransferase (TAT; intron-hypomethylated), IGF2 receptor (IGF2R; intron-hypomethylated), a pivotal signal transducer in lipid metabolism, adenylate kinase 3 (ADCY3; promotor hypomethylated), a multifunctional metabolic enzyme, pyruvate carboxylase (PC; intron-hypermethylated), and the key mitophagic factor, PTEN-induced kinase 1 (PINK1; exon/UTR3-hypomethylated) (Table 5). In addition, the genes associated with lipid homeostasis, retinoic acid receptor β (RARB), and acyl-CoA dehydrogenase family member 8 (ACAD8) were intron-hypomethylated and downregulated.
Meanwhile, upregulated expression was observed in the genes encoding a NO-controlling enzyme, cystathionine γ-lyase (CTH; intron-hypomethylated), a repressor of gluconeogenesis and lipogenesis, C-terminal binding protein 2 (CTBP2; intron-hypomethylated), an energy homeostasis regulator, phosphatidylinositol 3-kinase regulatory subunit 1 (PIK3R1; exon/UTR3-hypomethylated), and tissue-nonspecific alkaline phosphatase (ALPL/TNAP; promoter hypomethylated). The intron-hypermethylated genes for angiogenesis/blood pressure regulator, nitric oxide synthase 3 (NOS3), a repressor of hormone-induced receptor responses, nuclear receptor subfamily 2 group F member 1 (NR2F1/COUP-TF1), and IGF2 mRNA-binding protein 2 (IGF2BP2/IMP2) were also upregulated. Thus, the alterations in methylation patterns in these genes indicated that MUN impacts CG methylation of genes associated with IGF2 signaling, glucose and lipid homeostasis, oxidative stress, and haptic key metabolisms.

3. Discussion

3.1. Impact of MUN on the Hepatic Genome and Molecular Networks in Fetal Calves

In the present study, global maternal undernutrition from the early to late gestation period altered DNA methylation in fetal calf liver. The LN fetal liver had a lower average weight than the HN fetal liver, indicating the severity of the impact of low maternal dietary nutrition on the fetal calf liver. The impact on liver growth might be attributed to the altered methylation of IGF2 and downstream signaling genes. The RRBS results revealed that the number of hypomethylated CG sites in the genomic DNA of the LN fetal liver was higher than that in the hypermethylated CG sites across the promoter, UTR5, exon, intron, UTR3, and repeat regions, indicating that hypomethylated loci in these gene features were more abundant in LN fetuses than in HN fetuses. Additionally, the DMLs were abundant prominently in the exon and intron regions and were frequently located in proximity to the telomeric end of each chromosome, with some exceptions of the broadly distributed abundance on chromosomes 13, 18, 19, and 25 and a localization near the centromeric region of chromosome 7, as shown in Figure 3. In human chromosomes, DNA methylation is dense in the proximity of telomeres [32]; however, the reason why DMLs are dense in bovines 13, 18, 19, and 25 remains unclear. This trend also suggests that these genomic regions are abundant with genes that are sensitive to MUN impact, although only a few genes are known to be associated with these regions to date.
RRBS, followed by DML analyses, revealed that the number of hypomethylated CG loci in the promoters, exons, introns, and UTR3 regions was higher than that of hypermethylated loci. It is well established that hypermethylation of promoter CpG islands exerts a suppressive effect on gene expression [31]. In addition, in most cases, the exon and intron regions positively affect gene expression, except for the first exon and intron in some cases [33,34]. Hypomethylation is also predominant in the UTR3 region of genes that are expressed [33]. In this study, we identified essential metabolic genes such as GNAS, SOAT2, ADCY3, PIK3R1, TAT, ACAD8, and PINK1, as the genes hypomethylated in promotor and gene body in LN fetal liver. Based on the KEGG pathway analysis using the hypomethylated genes, we extracted the relevant pathways regarding vascular endothelial growth factor (VEGF), cGMP, gastric acid, phospholipase D, cortisol, insulin, PI3K-Akt, and thyroid hormone (Table 3). These results suggest the crucial impact of MUN on the fetal liver via DNA hypomethylation.
Taking a closer look at hyper/hypomethylation in the promoter, gene body, and UTRs, 11 pathways/metabolisms were listed as common to both hyper- and hypomethylated genes, including signaling pathways of phosphatidylinositol, Rap1, oxytocin, and calcium. These signaling pathways play a key role in the regulation of various fundamental metabolic pathways in the liver, as evidenced by their influence on the regulation of insulin and glucagon [35,36,37]. One of the representative terms in the pathway analysis, Cushing’s syndrome, is a common metabolic syndrome caused by prolonged exposure to excess cortisol. Chronically elevated glucocorticoid (GC) levels result in hepatic steatosis, insulin resistance, visceral obesity, muscle myopathy, hypertension, and symptoms similar to those of metabolic syndrome [38]. Maintenance of the relevant metabolism is mediated by cAMP signaling [39], which plays multiple roles in hepatic autophagy and glucose, lipid, and cholesterol metabolism [40], cooperatively with other signaling pathways. Accordingly, the molecular network underlying Cushing’s syndrome is likely common to the mechanism where CG methylation changes in the LN fetal liver affect hepatic metabolisms.
The KEGG pathways specific to hypermethylation or hypomethylation were extracted, resulting in a 4.3-fold greater number of pathways from hypomethylated genes compared to hypermethylated genes in LN fetuses. This indicates that metabolisms in the fetal calf liver may be modified by hypomethylation rather than hypermethylation under MUN impact. Hypermethylation-associated pathways in LN fetuses included apelin signaling, mTOR signaling, and inositol phosphate metabolism, which are responsible for lipid metabolism and autophagy in the liver [35,36,41]. The hypomethylation-associated pathways included signaling pathways and metabolisms that are essential for hepatic angiogenesis, gastric acid secretion, adaptive nutrient homeostasis, and hormonal growth regulation [40,42,43], such as insulin/IGF signaling and PI3K-Akt signaling (Table 3). Disruption of any of the above-mentioned pathways/metabolisms results in hepatic steatosis, insulin resistance, fibrosis, and/or cirrhosis [35,36,41].
Intriguingly, promoter hypomethylated genes in the LN fetal liver were found to be significantly associated with essential hepatic metabolisms, such as cholesterol metabolism and FA metabolism. The number of significant molecular events associated with promoter hypomethylated genes was significantly higher compared to hypermethylated genes, which was similar to the differences between hypermethylation and hypomethylation in the gene body. Thus, MUN during gestation in cattle has an epigenetic impact on fetal liver growth and function via hypomethylation of the hepatic essential genes in both promotor and gene body, rather than by hypermethylation.
The present bioinformatics results suggest that the MUN of pregnant dams predisposes the fetal calf liver to metabolic disorders, which can lead to prolonged disruption in energy and cholesterol metabolism in the offspring. Notably, the animals used in this study showed that MUN also altered the metabolite content and gene expression associated with the urea cycle, glucose and lipid metabolism, FA oxidation, cholesterol, and bile acid metabolism, steroid hormone synthesis, and sphingolipid metabolism in our previous study using metabolomic and transcriptomic approaches [21]. Gene expression analyses revealed that genes associated with ketogenesis (HMGCS2), gluconeogenesis (G6PC, PCK1), steroid hormone synthesis (FDPS, HSD11B1), urea cycle (ASS1, CPS1), redox processes (SAO, PIPOX), and FA metabolism (ADH4, EHHADH) were downregulated, indicating that these metabolic pathways were suppressed in the fetal liver. Collectively, the suppressed metabolic activities may be the result of alterations in DNA methylation of the relevant genes identified in this study.

3.2. Hyper/Hypomethylated Genes Essential for Hepatic Metabolisms and Function

Functions of the top DML genes and KEGG pathways indicated that genes with altered methylation were associated with IGF signaling, glucose metabolism, FA oxidation, cholesterol metabolism, steroid hormone synthesis, autophagy, and angiogenesis. Among these, several DM genes showed a trend of changes in transcription, as well as CG methylation (Table 4 and Table 5).
The insulin/IGF growth factor axis is a key regulatory endocrine factor in pre-and postnatal growth [44]. Among the DM genes associated with IGF signaling, IGF2BP2 and IGF2R play contrasting roles, with IGF2BP2 exerting a positive influence and IGF2R exerting a negative influence on IGF2 signaling [45,46,47] (Figure 6). GRB10 is a negative regulator of receptor-type tyrosine kinases, including IGF1R, a major receptor for IGF2, although the effect of GRB10 on IGF signaling is controversial [48]. Intriguingly, the expression of these IGF signaling molecules was modulated in a direction to amplify the IGF2 signal in the LN fetal liver. GRB10 was downregulated, which could be due to the hypermethylation of its promoter. In contrast, IGF2 expression was negatively modulated in LN fetuses, although its promoter was hypomethylated. One possible explanation for the inconsistency in IGF2 expression compared to other activated IGF signaling genes is that IGF2 may be downregulated at the transcriptional level by another repressor.
Our RRBS analyses revealed that the PI3K-Akt signaling, phosphatidylinositol signaling, and inositol phosphate pathways were also different between the LN and HN groups. The PI3K-Akt signaling pathway plays a central role in the physiological adaptation to the cellular environment and nutrition, especially in energy homeostasis mediated by insulin signaling [49] (Figure 6). The PIK3R1, the key regulator of the PI3K-Akt signaling pathway, is hypomethylated in exon/UTR3 and upregulated in LN fetuses. Despite the unknown relationship between hypermethylation and upregulated expression, hypermethylation may affect the expression or alternative splicing of this gene. The upregulation of PIK3R1 could support signals from upstream pathways derived from the IGF1R.
In addition, the PI3K-Akt signaling pathway mediates hormone-induced cAMP signaling, including ADCY3, as the central player in energy homeostasis [50,51], and mTORC1/2 stimulation via Rap1 activation [36]. GSα encoded by the GNAS gene is the stimulatory subunit that can activate ADCY3 to promote the production of cAMP, disruption of which results in obese and insulin-resistant phenotypes [50,52]. In this context, hypomethylation of ADCY3 and GNAS promoters was reasonable under the MUN environment because promoter hypomethylation would result in the activation of gene expression and subsequent energy metabolic adaptation via downstream signaling. In LN fetuses, however, ADCY3 expression was downregulated in a similar manner to the IGF2 expression, which may be attributed to negative regulation exerted by certain repressors.
The PI3K-Akt pathway downstream genes associated with lipid metabolism and gluconeogenesis were hypermethylated or hypomethylated by MUN. Some of these genes were activated by growth factor (GF) and/or hormone signals via downstream pathways, such as FOXO and mTOR signaling (Figure 6). POR and ACAD8 were promoter hypermethylated and intron-hypomethylated, respectively, and both were downregulated in LN fetuses. In hepatic lipid metabolism, POR plays a central role in catabolic activity by metabolizing xenobiotics and steroid hormones [53,54]; additionally, it plays a key role in cholesterol [55] and steroid synthesis [56]. ACAD8 is a gene encoding isobutyryl-CoA dehydrogenase, the dysregulation of which leads to hepatic steatosis via mitochondriopathy [57]. Regulated by acyl-CoA and NADH, CTBP2 reciprocally modulates lipid metabolism and FOXO-mediated gluconeogenesis by acting as a transcriptional repressor [58]. CTBP2 is hypomethylated in its intron, but its expression is downregulated in LN fetuses, which may be affected by other transcriptional modulators. These findings suggest that MUN modulates hepatic lipid metabolism via altered DNA methylation of PIK3R1 and mTOR signaling genes, as well as POR and ACAD8 in fetal calves. In addition, PC and TAT, mitochondrial gluconeogenic genes that respond to insulin, glucocorticoids, and/or glucagon [59,60,61,62], were downregulated with altered DNA methylation in LN fetuses. All the genes involved in lipid metabolism and gluconeogenesis were downregulated. Collectively, these gene expressions may be modulated by DNA methylation changes, thereby restricting glucose production and FA oxidation in LN fetal liver.
Mitochondrial activities and viability may be compromised in LN fetuses, as indicated by the downregulation of PINK1, a key player in mitophagy [63] (Figure 6). In the calf liver, low levels of PINK1 expression are associated with reactive oxygen species (ROS) overproduction in cows with a fatty liver, which causes ROS overproduction and lipid accumulation in hepatocytes [64]. The low level of mitophagy marker indicated impaired mitophagy and its potential impact on the stability of mitochondrial DNA. This was further supported by the downregulation of NTHL1, a mitochondrial DNA glycosylase, which was downregulated due to MUN. Low PINK1 expression may be induced by mTOR signaling activity originating from upstream GF and hormone signals [65]. The notable abundance of DM hepatic genes encoding key mitochondrial metabolic enzymes (PC, TAT, ACAD8, PINK1, and NTHL1) is a noteworthy finding that highlights the central role of mitochondria in metabolic adaptations in response to nutritional stress in the fetal liver. However, the mechanisms underlying the transduction of nutritional signals into alterations in nuclear DNA methylation remain unclear.
Though the alterations in methylation differed, CTH and NOS3 were upregulated in LN fetuses. CTH-deficient mice exhibited elevated oxidative stress and impaired eNOS, the NOS3 product, resulting in reduced NO levels [66]. CTH generates H2S, which, in turn, controls endothelial NO bioavailability and blood pressure [67] and protects against oxidative stress [68]. Thus, CTH and NOS3 cooperatively fine-tune NO levels and regulate blood pressure and/or angiogenesis [69,70,71]. Altered methylation of these genes may contribute to the maintenance of angiogenesis and blood pressure in fetuses with LN.
POR, a hypermethylated gene in LN fetuses, plays an essential role in bile production [53,56] and steroid synthesis [56,72]. Despite the functional importance, POR expression was suppressed in MUN condition, which might be due to the reduced demand for its activity in steroid metabolism, as indicated by our previous study [21]. In addition, a key gene for the hepatic cholesterol-esterifying enzyme SOAT2 was downregulated due to MUN and hypomethylated in its exon and intron. A deficiency in its activity results in decreased retention of triglycerides (TG) and cholesteryl esters in the liver [73,74]. Furthermore, ALPL, a key player in bile secretion in hepatocyte and cholangiocyte membranes facing bile canaliculi and ducts [75], was hypomethylated and upregulated. The POR activity for steroid hormone synthesis was likely restricted in LN fetuses, although ALPL expression may promote bile secretion, particularly in LN fetuses. Taken together, altered methylation of genes involved in cholesterol metabolism suggests that less bile secretion and lipid accumulation in the liver are prioritized in the LN fetal liver. This response may be crucial for the physiological adaptation of dams to adverse nutritional stress.
MUN-induced RARB downregulation may affect the quiescence of hematopoietic stem cells (HSC) in the fetal liver, where HSC proliferation and development during normal fetal life are maintained [76]. RARB was hypomethylated in its intron and downregulated in LN fetuses. The role of RARB as a regulator of the protein translation rate and ROS levels in dormant HSC has been recently reported [77]. This is important for maintaining quiescence in HSCs. In addition, the maintenance of HSC was found to be dependent on 4-oxo-retinoic acid (RA), a potent agonist that specifically targets RARβ [78,79], as well as the expression of RARβ itself [80]. Hypomethylation of RARB may regulate HSC quiescence in the LN liver and predispose the cells to an activated state in the offspring. The transcriptional repressor COUP-TF1 (NR2F1 product) regulates the expression of hepatic genes, including mitochondrial HMG-CoA synthase (HMGCS2), phosphoenolpyruvate carboxykinase (PCK1), and angiotensinogen, cooperatively with hepatocyte nuclear factor 4 (HNF-4) [81,82]. This repressor was hypermethylated with concomitant upregulation in the present study. Coincidently, HMGCS2 expression is downregulated in the LN fetal liver [21], which could be the result of hypermethylation and upregulation of the repressor NR2F1. Further, NR2F1 is also thought to repress nuclear receptors, including RARs, thyroid hormone receptors (TR), and peroxisome proliferator-activated receptors (PPAR) [83]. Accordingly, the upregulation of NR2F1 may have a significant impact on the hormonal induction of metabolic disorders in LN fetuses and postnatal life.

4. Materials and Methods

4.1. Animals and Dietary Treatment

Eleven multiparous JB cows (initial BW 488 ± 9.6 kg) fed at the Iriki farm of Kagoshima University and the farm of the Western Region Agricultural Research Center (NARO) were managed and used, and fetuses were obtained as previously described [21]. Briefly, individual diets were designed for pregnant JB cows to meet 60% or 120% of the energy requirement and other nutrients based on the standard diet calculated for BW before pregnancy according to the Japanese Feeding Standard for Beef Cattle (2008 ed.) (NARO) [30]. The diet composition was designed as previously described [21]. Cows were randomly assigned to LN (n = 5) or HN (n = 6) diet groups and fed their respective diets during gestation. Fetuses were obtained from cows via cesarean section. The animals were maintained in accordance with the Guide for the Care and Use of Experimental Animals. The experimental design was approved by the Animal Care and Use Committee of Kagoshima University (#A18007).

4.2. Sample Collection

The fetuses were injected with lidocaine (AstraZeneca, Osaka, Japan) into the jugular vein and euthanized by exsanguination at day 260 ± 8.3 of gestation. From the dissected fetal carcass, liver samples were obtained, a portion of which were frozen using liquid nitrogen for DNA preparation or soaked in RNAlater® (Thermo Fisher Scientific, Tokyo, Japan) for gene expression analysis, and stored at −80 °C until used for subsequent analyses. Among the fetuses from the cows, the three with the highest BW and three with the lowest BW were selected as HN and LN fetuses, respectively, for subsequent comparisons, including differential methylation analyses.

4.3. Genomic DNA Preparation

The genomic DNA samples were extracted using a QIAamp DNA Mini Kit (Qiagen, Hilden, Germany), according to the manufacturer’s protocol for the preparation of RRBS samples. The prepared gDNAs were quantified using a Quant-iT dsDNA High-Sensitivity Assay Kit (Life Technologies, Tokyo, Japan) and a VersaFluor spectrometer (Bio-Rad, Hercules, CA, USA). The quality of the gDNA samples was confirmed by resolution in 1% agarose gel electrophoresis based on the extent of DNA fragmentation and RNA contamination.

4.4. Reduced Representation Bisulfite Sequencing (RRBS)

The qualified samples were digested using the methylation-insensitive restriction enzyme MspI, followed by dA-tailing and ligation to sequencing adaptors. DNA fragments with insertion lengths ranging from 40 bp to 220 bp were selected by isolating specific gel bands. The selected DNA fragments were treated with bisulfite using the EZ DNA Methylation Gold Kit (Zymo Research, Orange, CA, USA), after which the fragments were amplified using PCR. The constructed library was quantified with a Qubit 2.0 Fluorometer (Thermo Fisher Scientific), followed by accurate quantification of the library concentration by Q-PCR (effective library concentration > 2 nM) to ensure library quality. Sequencing was performed for different libraries according to the concentration and data demand on the Illumina HiSeq/NovaSeq platform (Illumina, San Diego, CA, USA). The raw reads obtained in FASTQ format were filtered to remove contaminated adapter sequences, and low-quality reads using Trimmomatic-0.36 (Illumina). Bisulfite-treated reads were aligned to a reference genome (ARS-UCD1.2/bosTau9, April 2018), and methylated CG calling and annotations of the promoter, gene body, and CpG islands were performed by Bismark [84] using the deduplicate_bismark and bismark_genome_preparation commands.

4.5. Analyses of DMR and DML

To identify the true methylated sites, methylated and unmethylated counts at each site from the Bismark output were tested using a binomial distribution. The following set of thresholds was set in the analysis process to find accurate methylated sites [85,86]: (1) the sequencing depth was greater than or equal to five, and (2) the q-value (FDR) was less than or equal to 0.01. For the methylated sites, the methylation level was calculated using the following formula: ML = mC/(mC + umC), where ML represents the methylation level and mC and umC represent the number of methylated and unmethylated cytosines, respectively.
DMR and DML were analyzed using the DSS-single (DSS_2.12.0) pipeline [87,88], which provides the average methylation level of the DMR to draw the methylation level distribution as a heatmap of hierarchically clustered regions. Considering the spatial correlation of the DMR, smoothing was applied during the analysis. For DMR distribution in the genomic context, hyper- and hypomethylated regions were statistically analyzed for promoters, exons, introns, repeats, TSS, TES, and other regions. DMR distribution in the genome and significant analysis were also illustrated by a Circos plot using circos-0.62-1 [89]. DMR screening was controlled with cut-off values of minimum length (50 bp), CG content (three sites), and adjusted P-value (false discovery rate; FDR) for comparison between the groups (FDR = 0.10). In the DMR and DML analyses, differences were considered significant at FDR ≤ 0.10.

4.6. Pathway Enrichment Analyses for Hyper- or Hypo-Methylated Genes

Kyoto Encyclopedia of Genes and Genomes (KEGG) pathway enrichment analysis (http://www.kegg.jp/, accessed on 26 March 2023) [90], KOBAS (2.0) [91] was used. The analysis was performed based on the distribution of DMR in the genome of the promoter, gene body region (from TSS to TES), and overlapping genes with DMR in CG dinucleotide sequences. In this analysis, a hypergeometric test was used to identify the biological metabolism and pathways that were significantly enriched in DMR-related genes compared to the entire genomic background. An adjusted p-value < 0.10 (FDR) was regarded as significant.

4.7. Microarray Analysis

The fetuses analyzed were those with the lowest BW in the LN group (four animals) and those with the highest BW in the HN group (four animals). Total RNA samples from four fetuses in the HN and LN groups were subjected to Bovine (v2) Gene Expression 4× 44 K Microarray (Agilent Technologies, Waldbronn, Germany). The details are described in a previous study [21]. Signals from the hybridized probes were detected using an Agilent microarray scanner (Agilent). Results were normalized using the quantile method in GeneSpring GX (Agilent).

4.8. Gene Expression Analysis in Quantitative PCR

The total RNA extraction from LN and HN fetal livers and the cDNA synthesis were performed as described previously [21]. To test the expressions of the differentially methylated (DM) genes, qPCR was performed using the cDNA templates of liver samples. The sequences of the primers used for qPCR are provided in Table S4. The ribosomal protein lateral stalk subunit P0 (RPLP0) was used as an internal control. Melting curve analysis was performed to confirm the specificity of amplification reactions.

4.9. Statistical Analyses

To compare the gene expression between LN and HN groups, the BW and liver weight were analyzed by the two-sided Student’s t-test. The PCR data were analyzed by the one-sided Student’s t-test, based on the trend of gene expression in previous microarray analysis [21]. Differences were considered significant at p ≤ 0.05 or a trend at p ≤ 0.10 for the microarray and PCR results.

5. Conclusions

DNA methylation status was altered in the genes associated with fundamental hepatic metabolism in the fetal calf liver at the late gestational stage when maternal nutrient levels were globally restricted. DNA methylation of IGF2 and critical metabolic genes changed concomitantly with liver growth retardation, resulting in a reduced fetal liver mass. The modification in gene expression, regulatory pathways, and metabolism in the fetal calf liver was predominantly regulated by hypomethylation rather than hypermethylation under MUN conditions. DMLs for both hyper- and hypomethylation were involved in essential signaling pathways for growth and liver metabolism, such as IGF2, mTOR, PI3K-Akt, cAMP, and FOXO signaling. Methylation-altered ADCY3, GNAS, and PIK3R1 may have critical roles in gene activation and subsequent cellular metabolic adaptation via downstream signaling. It is most likely that DNA methylation in the LN fetal liver downregulated the expression of genes involved in lipid metabolism, gluconeogenesis, cholesterol metabolism, and mitochondrial viability. Thus, MUN treatment had a significant impact on the DNA methylation of hepatic genes, hepatic metabolism, and functions of the fetal calf liver. These alterations may affect the development of metabolic disorders during the later life of the offspring.

Supplementary Materials

The following supporting information can be downloaded at: https://www.mdpi.com/article/10.3390/ijms241310682/s1.

Author Contributions

S.M. and T.G. conceived and designed research; K.O. (Konosuke Otomaru), K.O. (Kazunaga Oshima), I.O. and T.G. performed the trials of maternal nutrition restriction; K.O. (Koichi Ojima) and T.G. performed collection and analysis of carcass data; S.M. and K.O. (Koichi Ojima) conducted DNA methylation, microarray and PCR analyses; S.M. analyzed the methylome, metabolism and transcriptomics data; S.M. drafted the manuscript; S.M. edited and revised the manuscript. All authors have read and agreed to the published version of the manuscript.

Funding

This research was supported by the Japan Society for the Promotion of Science (JSPS KAKENHI 22K05963 to S.M.), the Canon Fund (R15-0089), the Livestock Promotional Subsidy of the Japan Racing Association (JRA), and the Leave a Nest Co., Ltd.

Institutional Review Board Statement

The fetuses were obtained from the cows through cesarean section. Animals were maintained according to the Guide for the Care and Use of Experimental Animals. The experimental design was approved by the Animal Care and Use Committee of Kagoshima University (#A18007). There was no use of human participants, data, or tissues.

Informed Consent Statement

Not applicable.

Data Availability Statement

Array data were deposited in the National Center for Biotechnology Information (NCBI) Gene Expression Omnibus (GEO) database and are accessible through GEO Series accession number GSE191179 (http://www.ncbi.nlm.nih.gov/geo).

Acknowledgments

We thank the personnel at the farm staff of the Kagoshima University and Western Region Agricultural Research Center, NARO, for their great support in managing and feeding cattle. We especially thank Y. Zhang, Y. Okamura, A. Kinoshita, R. Saneshima, Y. Nagao (Kagoshima Univ.), M. Sano (Univ. of Shiga prefecture), S. Roh (Tohoku Univ.), M. Oe, C. Shindo, and M. Ichimura (NILGS) for their technical supports.

Conflicts of Interest

The authors declare no conflict of interest.

References

  1. Govoni, K.E.; Reed, S.A.; Zinn, S.A. Cell biology symposium: Metabolic responses to stress: From animal to cell: Poor maternal nutrition during gestation: Effects on offspring whole-body and tissue-specific metabolism in livestock species. J. Anim. Sci. 2019, 97, 3142–3152. [Google Scholar] [CrossRef] [PubMed]
  2. Devaskar, S.U.; Chu, A. Intrauterine Growth Restriction: Hungry for an Answer. Physiology 2016, 31, 131–146. [Google Scholar] [CrossRef] [PubMed] [Green Version]
  3. Muroya, S.; Zhang, Y.; Kinoshita, A.; Otomaru, K.; Oshima, K.; Gotoh, Y.; Oshima, I.; Sano, M.; Roh, S.; Oe, M.; et al. Maternal Undernutrition during Pregnancy Alters Amino Acid Metabolism and Gene Expression Associated with Energy Metabolism and Angiogenesis in Fetal Calf Muscle. Metabolites 2021, 11, 582. [Google Scholar] [CrossRef] [PubMed]
  4. Osgerby, J.C.; Wathes, D.C.; Howard, D.; Gadd, T.S. The effect of maternal undernutrition on ovine fetal growth. J. Endocrinol. 2002, 173, 131–141. [Google Scholar] [CrossRef] [PubMed] [Green Version]
  5. Vonnahme, K.A.; Hess, B.W.; Hansen, T.R.; McCormick, R.J.; Rule, D.C.; Moss, G.E.; Murdoch, W.J.; Nijland, M.J.; Skinner, D.C.; Nathanielsz, P.W.; et al. Maternal undernutrition from early- to mid-gestation leads to growth retardation, cardiac ventricular hypertrophy, and increased liver weight in the fetal sheep. Biol. Reprod. 2003, 69, 133–140. [Google Scholar] [CrossRef] [PubMed] [Green Version]
  6. Lloyd, L.J.; Foster, T.; Rhodes, P.; Rhind, S.M.; Gardner, D.S. Protein-energy malnutrition during early gestation in sheep blunts fetal renal vascular and nephron development and compromises adult renal function. J. Physiol. 2012, 590, 377–393. [Google Scholar] [CrossRef] [Green Version]
  7. George, L.A.; Zhang, L.; Tuersunjiang, N.; Ma, Y.; Long, N.M.; Uthlaut, A.B.; Smith, D.T.; Nathanielsz, P.W.; Ford, S.P.; Lie, S.; et al. Early maternal undernutrition programs increased feed intake, altered glucose metabolism and insulin secretion, and liver function in aged female offspring. Am. J. Physiol. Integr. Comp. Physiol. 2012, 302, R795–R804. [Google Scholar] [CrossRef] [Green Version]
  8. Zhang, Y.; Otomaru, K.; Oshima, K.; Goto, Y.; Oshima, I.; Muroya, S.; Sano, M.; Saneshima, R.; Nagao, Y.; Kinoshita, A.; et al. Effects of low and high levels of maternal nutrition consumed for the entirety of gestation on the development of muscle, adipose tissue, bone, and the organs of Wagyu cattle fetuses. Anim. Sci. J. 2021, 92, e13600. [Google Scholar] [CrossRef]
  9. Morrison, J.L. Sheep models of intrauterine growth restriction: Fetal adaptations and consequences. Clin. Exp. Pharmacol. Physiol. 2008, 35, 730–743. [Google Scholar] [CrossRef]
  10. Godfrey, K.M.; Barker, D.J. Fetal programming and adult health. Public Health Nutr. 2001, 4, 611–624. [Google Scholar] [CrossRef] [Green Version]
  11. Lee, H.S. Impact of Maternal Diet on the Epigenome during In Utero Life and the Developmental Programming of Diseases in Childhood and Adulthood. Nutrients 2015, 7, 9492–9507. [Google Scholar] [CrossRef] [Green Version]
  12. Goyal, D.; Limesand, S.W.; Goyal, R. Epigenetic responses and the developmental origins of health and disease. J. Endocrinol. 2019, 242, T105–T119. [Google Scholar] [CrossRef] [Green Version]
  13. Sandoval, C.; Askelson, K.; Lambo, C.A.; Dunlap, K.A.; Satterfield, M.C. Effect of maternal nutrient restriction on expression of glucose transporters (SLC2A4 and SLC2A1) and insulin signaling in skeletal muscle of SGA and Non-SGA sheep fetuses. Domest. Anim. Endocrinol. 2021, 74, 106556. [Google Scholar] [CrossRef]
  14. Desai, M.; Crowther, N.; Lucas, A.; Hales, C.N. Organ-selective growth in the offspring of protein-restricted mothers. Br. J. Nutr. 1996, 76, 591–603. [Google Scholar] [CrossRef] [Green Version]
  15. Chandel, N.S. Navigating Metabolism; Cold Spring Harbor Laboratory Press: New York, NY, USA, 2015. [Google Scholar]
  16. Preidis, G.A.; Keaton, M.A.; Campeau, P.M.; Bessard, B.C.; Conner, M.E.; Hotez, P.J. The Undernourished Neonatal Mouse Metabolome Reveals Evidence of Liver and Biliary Dysfunction, Inflammation, and Oxidative Stress. J. Nutr. 2014, 144, 273–281. [Google Scholar] [CrossRef] [Green Version]
  17. Gruppuso, P.A.; Boylan, J.M.; Anand, P.; Bienieki, T.C. Effects of Maternal Starvation on Hepatocyte Proliferation in the Late Gestation Fetal Rat. Pediatr. Res. 2005, 57, 185–191. [Google Scholar] [CrossRef] [Green Version]
  18. Kind, K.L.; Roberts, C.T.; Sohlstrom, A.I.; Katsman, A.; Clifton, P.M.; Robinson, J.S.; Owens, J.A. Chronic maternal feed restriction impairs growth but increases adiposity of the fetal guinea pig. Am. J. Physiol. Regul. Integr. Comp. Physiol. 2005, 288, R119–R126. [Google Scholar] [CrossRef] [Green Version]
  19. Hyatt, M.A.; Gopalakrishnan, G.S.; Bispham, J.; Gentili, S.; McMillen, I.C.; Rhind, S.M.; Rae, M.T.; Kyle, C.E.; Brooks, A.N.; Jones, C.; et al. Maternal nutrient restriction in early pregnancy programs hepatic mRNA expression of growth-related genes and liver size in adult male sheep. J. Endocrinol. 2007, 192, 87–97. [Google Scholar] [CrossRef] [Green Version]
  20. Gao, F.; Liu, Y.; Li, L.; Li, M.; Zhang, C.; Ao, C.; Hou, X. Effects of maternal undernutrition during late pregnancy on the development and function of ovine fetal liver. Anim. Reprod. Sci. 2014, 147, 99–105. [Google Scholar] [CrossRef]
  21. Muroya, S.; Zhang, Y.; Otomaru, K.; Oshima, K.; Oshima, I.; Sano, M.; Roh, S.; Ojima, K.; Gotoh, T. Maternal Nutrient Re-striction Disrupts Gene Expression and Metabolites Associated with Urea Cycle, Steroid Synthesis, Glucose Homeostasis, and Glucuronidation in Fetal Calf Liver. Metabolites 2022, 12, 203. [Google Scholar] [CrossRef]
  22. Wesolowski, S.R.; El Kasmi, K.C.; Jonscher, K.R.; Friedman, J.E. Developmental origins of NAFLD: A womb with a clue. Nat. Rev. Gastroenterol. Hepatol. 2017, 14, 81–96. [Google Scholar] [CrossRef] [PubMed] [Green Version]
  23. Lillycrop, K.A.; Phillips, E.S.; Jackson, A.A.; Hanson, M.A.; Burdge, G.C. Dietary Protein Restriction of Pregnant Rats Induces and Folic Acid Supplementation Prevents Epigenetic Modification of Hepatic Gene Expression in the Offspring. J. Nutr. 2005, 135, 1382–1386. [Google Scholar] [CrossRef] [PubMed] [Green Version]
  24. Lillycrop, K.A.; Phillips, E.S.; Torrens, C.; Hanson, M.A.; Jackson, A.A.; Burdge, G.C. Feeding pregnant rats a protein-restricted diet persistently alters the methylation of specific cytosines in the hepatic PPAR alpha promoter of the off-spring. Br. J. Nutr. 2008, 100, 278–282. [Google Scholar] [CrossRef] [PubMed] [Green Version]
  25. Burdge, G.C.; Slater-Jefferies, J.; Torrens, C.; Phillips, E.S.; Hanson, M.A.; Lillycrop, K.A. Dietary protein restriction of pregnant rats in the F0 generation induces altered methylation of hepatic gene promoters in the adult male offspring in the F1 and F2 generations. Br. J. Nutr. 2007, 97, 435–439. [Google Scholar] [CrossRef] [Green Version]
  26. Gong, L.; Pan, Y.-X.; Chen, H. Gestational low protein diet in the rat mediates Igf2 gene expression in male offspring via altered hepatic DNA methylation. Epigenetics 2010, 5, 619–626. [Google Scholar] [CrossRef] [Green Version]
  27. Altmann, S.; Murani, E.; Schwerin, M.; Metges, C.C.; Wimmers, K.; Ponsuksili, S. Dietary protein restriction and excess of pregnant German Landrace sows induce changes in hepatic gene expression and promoter methylation of key metabolic genes in the offspring. J. Nutr. Biochem. 2013, 24, 484–495. [Google Scholar] [CrossRef]
  28. Van Straten, E.M.; Bloks, V.W.; Huijkman, N.C.; Baller, J.F.; van Meer, H.; Lutjohann, D.; Kuipers, F.; Plosch, T. The liver X-receptor gene promoter is hypermethylated in a mouse model of prenatal protein restriction. Am. J. Physiol. Regul. Integr. Comp. Physiol. 2010, 298, R275–R282. [Google Scholar] [CrossRef] [Green Version]
  29. Zhu, M.J.; Ford, S.P.; Means, W.J.; Hess, B.W.; Nathanielsz, P.W.; Du, M. Maternal nutrient restriction affects properties of skeletal muscle in offspring. J. Physiol. 2006, 575 Pt 1, 241–250. [Google Scholar] [CrossRef]
  30. National Agriculture and Food Research Organization. Japanese Feeding Standard for Beef Cattle 2008 edn; Japan Livestock Industry Association: Tokyo, Japan, 2009. (In Japanese) [Google Scholar]
  31. Devailly, G.; Joshi, A. Comprehensive analysis of epigenetic signatures of human transcription control. Mol. Omics 2021, 17, 692–705. [Google Scholar] [CrossRef]
  32. Brock, G.J.; Charlton, J.; Bird, A. Densely methylated sequences that are preferentially localized at telomere-proximal regions of human chromosomes. Gene 1999, 240, 269–277. [Google Scholar] [CrossRef]
  33. Li, Y.; Zhu, J.; Tian, G.; Li, N.; Li, Q.; Ye, M.; Zheng, H.; Yu, J.; Wu, H.; Sun, J.; et al. The DNA Methylome of Human Peripheral Blood Mononuclear Cells. PLoS Biol. 2010, 8, e1000533. [Google Scholar] [CrossRef]
  34. Anastasiadi, D.; Esteve-Codina, A.; Piferrer, F. Consistent inverse correlation between DNA methylation of the first intron and gene expression across tissues and species. Epigenet. Chromatin 2018, 11, 37. [Google Scholar] [CrossRef]
  35. Anand, P.; Boylan, J.M.; Ou, Y.; Gruppuso, P.A. Insulin signaling during perinatal liver development in the rat. Am. J. Physiol. Metab. 2002, 283, E844–E852. [Google Scholar] [CrossRef] [Green Version]
  36. Sunilkumar, S.; Kimball, S.R.; Dennis, M.D. Glucagon transiently stimulates mTORC1 by activation of an EPAC/Rap1 signaling axis. Cell Signal. 2021, 84, 110010. [Google Scholar] [CrossRef]
  37. Assinder, S.J. The Importance of Experimental Investigation of the Peripheral Oxytocin System. Methods Mol. Biol. 2022, 2384, 1–27. [Google Scholar] [CrossRef]
  38. Morgan, S.A.; Hassan-Smith, Z.K.; Lavery, G.G. Mechanisms in endocrinology: Tissue-specific activation of cortisol in Cushing’s syndrome. Eur. J. Endocrinol. 2016, 175, R81–R87. [Google Scholar] [CrossRef] [Green Version]
  39. Christ-Crain, M.; Kola, B.; Lolli, F.; Fekete, C.; Seboek, D.; Wittmann, G.; Feltrin, D.; Igreja, S.C.; Ajodha, S.; Harvey-White, J.; et al. AMP-activated protein kinase mediates glucocorticoid-induced metabolic changes: A novel mechanism in Cushing’s syndrome. FASEB J. 2008, 22, 1672–1683. [Google Scholar] [CrossRef] [Green Version]
  40. Byrnes, K.; Blessinger, S.; Bailey, N.T.; Scaife, R.; Liu, G.; Khambu, B. Therapeutic regulation of autophagy in hepatic metabolism. Acta Pharm. Sin. B 2022, 12, 33–49. [Google Scholar] [CrossRef]
  41. Lv, S.-Y.; Cui, B.; Chen, W.-D.; Wang, Y.-D. Apelin/APJ system: A key therapeutic target for liver disease. Oncotarget 2017, 8, 112145–112151. [Google Scholar] [CrossRef] [Green Version]
  42. Dong, X.C.; Copps, K.D.; Guo, S.; Li, Y.; Kollipara, R.; DePinho, R.A.; White, M.F. Inactivation of hepatic Foxo1 by insulin signaling is required for adaptive nutrient homeostasis and endocrine growth regulation. Cell Metab. 2008, 8, 65–76. [Google Scholar] [CrossRef] [Green Version]
  43. Zvibel, I.; Atias, D.; Phillips, A.; Halpern, Z.; Oren, R. Thyroid hormones induce activation of rat hepatic stellate cells through increased expression of p75 neurotrophin receptor and direct activation of Rho. Lab. Investig. 2010, 90, 674–684. [Google Scholar] [CrossRef] [PubMed] [Green Version]
  44. Moore, G.E.; Ishida, M.; Demetriou, C.; Al-Olabi, L.; Leon, L.J.; Thomas, A.C.; Abu-Amero, S.; Frost, J.M.; Stafford, J.L.; Chaoqun, Y.; et al. The role and interaction of imprinted genes in human fetal growth. Philos. Trans. R. Soc. Lond. Ser. B Biol. Sci. 2015, 370, 20140074. [Google Scholar] [CrossRef] [PubMed] [Green Version]
  45. Christiansen, J.; Kolte, A.M.; Hansen, T.; Nielsen, F.C. IGF2 mRNA-binding protein 2: Biological function and putative role in type 2 diabetes. J. Mol. Endocrinol. 2009, 43, 187–195. [Google Scholar] [CrossRef] [PubMed]
  46. Dai, N.; Rapley, J.; Angel, M.; Yanik, M.F.; Blower, M.D.; Avruch, J. mTOR phosphorylates IMP2 to promote IGF2 mRNA translation by internal ribosomal entry. Genes Dev. 2011, 25, 1159–1172. [Google Scholar] [CrossRef] [PubMed] [Green Version]
  47. Willison, K. Opposite imprinting of the mouse Igf2 and Igf2r genes. Trends Genet. TIG 1991, 7, 107–109. [Google Scholar] [CrossRef]
  48. Charalambous, M.; Smith, F.M.; Bennett, W.R.; Crew, T.E.; Mackenzie, F.; Ward, A. Disruption of the imprinted Grb10 gene leads to disproportionate overgrowth by an Igf2-independent mechanism. Proc. Natl. Acad. Sci. USA 2003, 100, 8292–8297. [Google Scholar] [CrossRef] [Green Version]
  49. Kwok, A.; Zvetkova, I.; Virtue, S.; Luijten, I.; Huang-Doran, I.; Tomlinson, P.; Bulger, D.A.; West, J.; Murfitt, S.; Griffin, J.; et al. Truncation of Pik3r1 causes severe insulin resistance uncoupled from obesity and dyslipidaemia by increased energy expenditure. Mol. Metab. 2020, 40, 101020. [Google Scholar] [CrossRef]
  50. Wang, Z.; Li, V.; Chan, G.C.K.; Phan, T.; Nudelman, A.S.; Xia, Z.; Storm, D.R. Adult Type 3 Adenylyl Cyclase-Deficient Mice Are Obese. PLoS ONE 2009, 4, e6979. [Google Scholar] [CrossRef] [Green Version]
  51. Liang, C.; Bu, S.; Fan, X. Suppressive effect of microRNA-29b on hepatic stellate cell activation and its crosstalk with TGF-beta1/Smad3. Cell Biochem. Funct. 2016, 34, 326–333. [Google Scholar] [CrossRef]
  52. Chen, M.; Gavrilova, O.; Liu, J.; Xie, T.; Deng, C.; Nguyen, A.T.; Nackers, L.M.; Lorenzo, J.; Shen, L.; Weinstein, L.S. Alternative Gnas gene products have opposite effects on glucose and lipid metabolism. Proc. Natl. Acad. Sci. USA 2005, 102, 7386–7391. [Google Scholar] [CrossRef] [Green Version]
  53. Wang, X.J.; Chamberlain, M.; Vassieva, O.; Henderson, C.J.; Wolf, C.R. Relationship between hepatic phenotype and changes in gene expression in cytochrome P450 reductase (POR) null mice. Biochem. J. 2005, 388 Pt 3, 857–867. [Google Scholar] [CrossRef] [Green Version]
  54. Mutch, D.M.; Klocke, B.; Morrison, P.; Murray, C.A.; Henderson, C.J.; Seifert, M.; Williamson, G. The disruption of hepatic cytochrome p450 reductase alters mouse lipid metabolism. J. Proteome Res. 2007, 6, 3976–3984. [Google Scholar] [CrossRef]
  55. Porter, T.D. New insights into the role of cytochrome P450 reductase (POR) in microsomal redox biology. Acta Pharm. Sin. B 2012, 2, 102–106. [Google Scholar] [CrossRef] [Green Version]
  56. Riddick, D.S.; Ding, X.; Wolf, C.R.; Porter, T.D.; Pandey, A.V.; Zhang, Q.Y.; Gu, J.; Finn, R.D.; Ronseaux, S.; McLaughlin, L.A.; et al. NADPH-cytochrome P450 oxidoreductase: Roles in physiology, pharmacology, and toxicology. Drug Metab. Dispos. Biol. Fate Chem. 2013, 41, 12–23. [Google Scholar] [CrossRef] [Green Version]
  57. Sabbagha, N.G.A.A.-A.; Kao, H.-J.; Yang, C.-F.; Huang, C.-C.; Lin, W.-D.; Tsai, F.-J.; Chen, T.-H.; Tarn, W.-Y.; Wu, J.-Y.; Chen, Y.-T. Alternative Splicing in Acad8 Resulting a Mitochondrial Defect and Progressive Hepatic Steatosis in Mice. Pediatr. Res. 2011, 70, 31–36. [Google Scholar] [CrossRef] [Green Version]
  58. Sekiya, M.; Kainoh, K.; Sugasawa, T.; Yoshino, R.; Hirokawa, T.; Tokiwa, H.; Nakano, S.; Nagatoishi, S.; Tsumoto, K.; Takeuchi, Y.; et al. The transcriptional corepressor CtBP2 serves as a metabolite sensor orchestrating hepatic glucose and lipid homeostasis. Nat. Commun. 2021, 12, 6315. [Google Scholar] [CrossRef]
  59. Moore, P.S.; Koontz, J.W. Regulation of Tyrosine Aminotransferase by Insulin and Cyclic AMP: Similar Effects on Activity but Opposite Effects on Transcription. Mol. Endocrinol. 1989, 3, 1724–1732. [Google Scholar] [CrossRef] [Green Version]
  60. Valera, A.; Rodriguez-Gil, J.E.; Yun, J.S.; McGrane, M.M.; Hanson, R.W.; Bosch, F. Glucose metabolism in transgenic mice containing a chimeric P-enolpyruvate carboxykinase/bovine growth hormone gene. FASEB J. 1993, 7, 791–800. [Google Scholar] [CrossRef]
  61. Jitrapakdee, S.; Wallace, J.C. Structure, function and regulation of pyruvate carboxylase. Biochem. J. 1999, 340 Pt 1, 1–16. [Google Scholar]
  62. Jitrapakdee, S.; Vidal-Puig, A.; Wallace, J.C. Anaplerotic roles of pyruvate carboxylase in mammalian tissues. Cell. Mol. Life Sci. 2006, 63, 843–854. [Google Scholar] [CrossRef]
  63. Choubey, V.; Zeb, A.; Kaasik, A. Molecular Mechanisms and Regulation of Mammalian Mitophagy. Cells 2021, 11, 38. [Google Scholar] [CrossRef] [PubMed]
  64. Fang, Z.; Liu, G.; Zhu, M.; Wang, S.; Jiang, Q.; Loor, J.J.; Yu, H.; Hao, X.; Chen, M.; Gao, W.; et al. Low abundance of mitophagy markers is associated with reactive oxygen species overproduction in cows with fatty liver and causes reactive oxygen species overproduction and lipid accumulation in calf hepatocytes. J. Dairy Sci. 2022, 105, 7829–7841. [Google Scholar] [CrossRef] [PubMed]
  65. Arvidsson Kvissberg, M.E.; Hu, G.; Chi, L.; Bourdon, C.; Ling, C.; ChenMi, Y.; Germain, K.; van Peppel, I.P.; Weise, L.; Zhang, L.; et al. Inhibition of mTOR improves malnutrition induced hepatic metabolic dysfunction. Sci. Rep. 2022, 12, 19948. [Google Scholar] [CrossRef] [PubMed]
  66. King, A.L.; Polhemus, D.J.; Bhushan, S.; Otsuka, H.; Kondo, K.; Nicholson, C.K.; Bradley, J.M.; Islam, K.N.; Calvert, J.W.; Tao, Y.-X.; et al. Hydrogen sulfide cytoprotective signaling is endothelial nitric oxide synthase-nitric oxide dependent. Proc. Natl. Acad. Sci. USA 2014, 111, 3182–3187. [Google Scholar] [CrossRef] [PubMed] [Green Version]
  67. Szijártó, I.A.; Markó, L.; Filipovic, M.R.; Miljkovic, J.L.; Tabeling, C.; Tsvetkov, D.; Wang, N.; Rabelo, L.A.; Witzenrath, M.; Diedrich, A.; et al. Cystathionine γ-Lyase-Produced Hydrogen Sul-fide Controls Endothelial NO Bioavailability and Blood Pressure. Hypertension 2018, 71, 1210–1217. [Google Scholar] [CrossRef]
  68. Ishii, I.; Akahoshi, N.; Yamada, H.; Nakano, S.; Izumi, T.; Suematsu, M. Cystathionine gamma-Lyase-deficient mice require dietary cysteine to protect against acute lethal myopathy and oxidative injury. J. Biol. Chem. 2010, 285, 26358–26368. [Google Scholar] [CrossRef] [Green Version]
  69. Wallerath, T.; Gödecke, A.; Molojavyi, A.; Li, H.; Schrader, J.; Förstermann, U. Dexamethasone lacks effect on blood pressure in mice with a disrupted endothelial NO synthase gene. Nitric Oxide 2004, 10, 36–41. [Google Scholar] [CrossRef]
  70. Zhao, C.X.; Xu, X.; Cui, Y.; Wang, P.; Wei, X.; Yang, S.; Edin, M.L.; Zeldin, D.C.; Wang, D.W. Increased endothelial nitric-oxide synthase expression reduces hypertension and hyperinsulinemia in fructose-treated rats. J. Pharmacol. Exp. Ther. 2009, 328, 610–620. [Google Scholar] [CrossRef]
  71. Yoshida, D.; Akahoshi, T.; Kawanaka, H.; Yamaguchi, S.; Kinjo, N.; Taketomi, A.; Tomikawa, M.; Shirabe, K.; Maehara, Y.; Hashizume, M. Roles of vascular endothelial growth factor and endothelial nitric oxide synthase during revascularization and regeneration after partial hepatectomy in a rat model. Surg. Today 2011, 41, 1622–1629. [Google Scholar] [CrossRef]
  72. Gu, J.; Weng, Y.; Zhang, Q.Y.; Cui, H.; Behr, M.; Wu, L.; Yang, W.; Zhang, L.; Ding, X. Liver-specific deletion of the NADPH-cytochrome P450 reductase gene: Impact on plasma cholesterol homeostasis and the function and regulation of microsomal cytochrome P450 and heme oxygenase. J. Biol. Chem. 2003, 278, 25895–25901. [Google Scholar] [CrossRef] [Green Version]
  73. Marshall, S.M.; Gromovsky, A.D.; Kelley, K.L.; Davis, M.A.; Wilson, M.D.; Lee, R.G.; Crooke, R.M.; Graham, M.J.; Rudel, L.L.; Brown, J.M.; et al. Acute Sterol O-Acyltransferase 2 (SOAT2) Knockdown Rapidly Mobilizes Hepatic Cholesterol for Fecal Excretion. PLoS ONE 2014, 9, e98953. [Google Scholar] [CrossRef] [Green Version]
  74. Pramfalk, C.; Ahmed, O.; Pedrelli, M.; Minniti, M.E.; Luquet, S.; Denis, R.G.; Olin, M.; Härdfeldt, J.; Vedin, L.L.; Steffensen, K.R.; et al. Soat2 ties cholesterol metabolism to β-oxidation and glucose tolerance in male mice. J. Intern. Med. 2022, 292, 296–307. [Google Scholar] [CrossRef]
  75. Briolay, A.; Bessueille, L.; Magne, D. TNAP: A New Multitask Enzyme in Energy Metabolism. Int. J. Mol. Sci. 2021, 22, 10470. [Google Scholar] [CrossRef]
  76. Giancotti, A.; Monti, M.; Nevi, L.; Safarikia, S.; D’ambrosio, V.; Brunelli, R.; Pajno, C.; Corno, S.; Di Donato, V.; Musella, A.; et al. Functions and the Emerging Role of the Foetal Liver into Regenerative Medicine. Cells 2019, 8, 914. [Google Scholar] [CrossRef] [Green Version]
  77. Cabezas-Wallscheid, N.; Buettner, F.; Sommerkamp, P.; Klimmeck, D.; Ladel, L.; Thalheimer, F.B.; Pastor-Flores, D.; Roma, L.P.; Renders, S.; Zeisberger, P.; et al. Vitamin A-Retinoic Acid Signaling Regulates Hematopoietic Stem Cell Dormancy. Cell 2017, 169, 807–823.e19. [Google Scholar] [CrossRef] [Green Version]
  78. Faria, T.N.; Mendelsohn, C.; Chambon, P.; Gudas, L.J. The targeted disruption of both alleles of RARbeta(2) in F9 cells results in the loss of retinoic acid-associated growth arrest. J. Biol. Chem. 1999, 274, 26783–26788. [Google Scholar] [CrossRef] [Green Version]
  79. Idres, N.; Marill, J.; Flexor, M.A.; Chabot, G.G. Activation of Retinoic Acid Receptor-dependent Transcription by All-trans-retinoic Acid Metabolites and Isomers. J. Biol. Chem. 2002, 277, 31491–31498. [Google Scholar] [CrossRef] [Green Version]
  80. Schönberger, K.; Obier, N.; Romero-Mulero, M.C.; Cauchy, P.; Mess, J.; Pavlovich, P.V.; Zhang, Y.W.; Mitterer, M.; Rettkowski, J.; Lalioti, M.E.; et al. Multilayer omics analysis reveals a non-classical retinoic acid signaling axis that regulates hematopoietic stem cell identity. Cell Stem Cell 2022, 29, 131–148.e10. [Google Scholar] [CrossRef]
  81. Hall, R.K.; Sladek, F.M.; Granner, D.K. The orphan receptors COUP-TF and HNF-4 serve as accessory factors required for induction of phosphoenolpyruvate carboxykinase gene transcription by glucocorticoids. Proc. Natl. Acad. Sci. USA 1995, 92, 412–416. [Google Scholar] [CrossRef] [Green Version]
  82. Rodríguez, J.C.; Ortiz, J.A.; Hegardt, F.G.; Haro, D. Chicken ovalbumin upstream-promoter transcription factor (COUP-TF) could act as a transcriptional activator or repressor of the mitochondrial 3-hydroxy-3-methylglutaryl-CoA synthase gene. Biochem. J. 1997, 326 Pt 2, 587–592. [Google Scholar] [CrossRef] [Green Version]
  83. Park, J.-I.; Tsai, S.Y.; Tsai, M.-J. Molecular mechanism of chicken ovalbumin upstream promoter-transcription factor (COUP-TF) actions. Keio J. Med. 2003, 52, 174–181. [Google Scholar] [CrossRef] [PubMed]
  84. Krueger, F.; Andrews, S.R. Bismark: A flexible aligner and methylation caller for Bisulfite-Seq applications. Bioinformatics 2011, 27, 1571–1572. [Google Scholar] [CrossRef] [PubMed] [Green Version]
  85. Habibi, E.; Brinkman, A.B.; Arand, J.; Kroeze, L.I.; Kerstens, H.H.; Matarese, F.; Lepikhov, K.; Gut, M.; Brun-Heath, I.; Hubner, N.C.; et al. Whole-Genome Bisulfite Sequencing of Two Distinct Interconvertible DNA Methylomes of Mouse Embryonic Stem Cells. Cell Stem Cell 2013, 13, 360–369. [Google Scholar] [CrossRef] [PubMed] [Green Version]
  86. Gifford, C.A.; Ziller, M.J.; Gu, H.; Trapnell, C.; Donaghey, J.; Tsankov, A.; Shalek, A.K.; Kelley, D.R.; Shishkin, A.A.; Issner, R.; et al. Transcriptional and epigenetic dynamics during specification of human embryonic stem cells. Cell 2013, 153, 1149–1163. [Google Scholar] [CrossRef] [Green Version]
  87. Feng, H.; Conneely, K.N.; Wu, H. A Bayesian hierarchical model to detect differentially methylated loci from single nucleotide resolution sequencing data. Nucleic Acids Res. 2014, 42, e69. [Google Scholar] [CrossRef] [Green Version]
  88. Wu, H.; Xu, T.; Feng, H.; Chen, L.; Ben Li, B.; Yao, B.; Qin, Z.; Jin, P.; Conneely, K.N. Detection of differentially methylated regions from whole-genome bisulfite sequencing data without replicates. Nucleic Acids Res. 2015, 43, e141. [Google Scholar] [CrossRef] [Green Version]
  89. Krzywinski, M.; Schein, J.; Birol, I.; Connors, J.; Gascoyne, R.; Horsman, D.; Jones, S.J.; Marra, M.A. Circos: An information aesthetic for comparative genomics. Genome Res. 2009, 19, 1639–1645. [Google Scholar] [CrossRef] [Green Version]
  90. Kanehisa, M.; Araki, M.; Goto, S.; Hattori, M.; Hirakawa, M.; Itoh, M.; Katayama, T.; Kawashima, S.; Okuda, S.; Tokimatsu, T.; et al. KEGG for linking genomes to life and the environment. Nucleic Acids Res. 2008, 36, D480–D484. [Google Scholar] [CrossRef]
  91. Mao, X.; Cai, T.; Olyarchuk, J.G.; Wei, L. Automated genome annotation and pathway identification using the KEGG Orthology (KO) as a controlled vocabulary. Bioinformatics 2005, 21, 3787–3793. [Google Scholar] [CrossRef]
Figure 1. Genomic locus-dependent distribution of CG methylation level in the context of functional genetic elements (A) and upstream/downstream 2kb-regions of gene body (B). After combining the samples with biological repeats, each region is divided into 20 bins (A), or 50 bins (B), and the methylation level is calculated in each bin. X-axis: functional genetic elements or regions, y-axis: methylation level. LN: red, HN: blue.
Ijms 24 10682 g001
Figure 2. DML distribution in CG context in different functional regions. The x-axis is functional regions; the y-axis is the number of hyper/hypo DMR in each region. Hyper and hypo DMLs in LN fetuses are indicated as red and blue, respectively.
Ijms 24 10682 g002
Figure 3. Circos plot for DMR condition in CG context. The circos plot represents (from outside to inside): (1) Hyper DMR statistical value: log5 (|areaStat|). The higher and bigger the point, the larger differences between the two groups. (2) TE, the heatmap of the percentage of repeat elements (if repeats are provided). (3) Heatmap of gene density. (4) Hypo DMR statistical value: log5 (|areaStat|). The higher and bigger the point, the larger differences between the two groups. The number shown in the outside indicates the chromosome number.
Ijms 24 10682 g003
Figure 4. The scattered plot of DMR-related pathways analyzed by KEGG enrichment. (A) Genes of all hyper DMR regions, (B) genes of all hypo DMR regions. The x-axis represents the Rich factor, and the y-axis represents the pathway name. The size of points stands for DMR-related gene counts, and the colors stand for different q-values ranges.
Ijms 24 10682 g004
Figure 5. The scattered plot of DMR-related pathways analyzed by KEGG enrichment. (A) Genes of hyper DMR in promotor, (B) genes of hypo DMR in promotor. The x-axis represents the Rich factor, and the y-axis represents the pathway name. The size of points stands for DMR-related gene counts, and the colors stand for different q-values ranges.
Ijms 24 10682 g005
Figure 6. Hypothetic scheme of DM gene-associated molecular regulatory networks and metabolisms in MUN fetal liver. Up- and downward arrows indicate hyper- and hypomethylation in promotor (red) or gene-body (blue), respectively. The pathway/metabolism boxes filled in blue are significantly extracted as relevant to DM genes. Grayed genes are not determined in this study. Solid and chain lines indicate direct and indirect regulations and indirect relationships, respectively.
Ijms 24 10682 g006
Table 1. Effect of maternal nutritional restriction on fetal phenotypes.
TraitHN (n = 3)LN (n = 3)p-Value
MeanSEM 1MeanSEM 1
Age (d)261.332.03257.670.880.173
BW (kg)33.310.4223.51.720.005
Liver (g)659.374.49485.1520.980.001
%BW1.980.012.080.150.529
1 SEM: standard error of the mean.
Table 2. The number of differentially methylated CG loci in LN fetal liver for each genomic feature 1.
Genomic RegionHyperHypo
Loci%Loci%
Promoter7188.508547.75
UTR51591.881501.36
Exon234427.73307527.90
Intron444052.53583252.92
UTR32442.893973.60
Repeat5476.477126.46
Total8452100.0011,020100.00
1 The number of differentially methylated loci in the LN fetuses compared to HN fetuses was separately indicated as hypermethylation or hypomethylation type.
Table 3. Significant KEGG pathways specific to hyper- and hypomethylated genes in promotor, gene body, and/or UTRs 1.
Type of DifferenceKEGG PathwayFDR
Hypermethylation
Apelin signaling pathway0.000156
mTOR signaling pathway0.000525
AGE-RAGE signaling pathway in diabetic complications0.000548
Inositol phosphate metabolism0.000651
Wnt signaling pathway0.000862
Amoebiasis0.000884
Hypomethylation
Adrenergic signaling in cardiomyocytes0.000008
Inflammatory mediator regulation of TRP channels0.000011
Parathyroid hormone synthesis, secretion, and action0.000012
VEGF signaling pathway0.000029
cGMP-PKG signaling pathway0.000043
Gastric acid secretion0.000043
Signaling pathways regulating pluripotency of stem cells0.000046
Platelet activation0.000066
Phospholipase D signaling pathway0.000142
Cortisol synthesis and secretion0.000167
GnRH signaling pathway0.000167
Type II diabetes mellitus0.000167
Relaxin signaling pathway0.000184
Sphingolipid signaling pathway0.000275
Insulin signaling pathway0.000306
Yersinia infection0.000370
Ras signaling pathway0.000370
Dopaminergic synapse0.000390
Human papillomavirus infection0.000390
Vascular smooth muscle contraction0.000417
Insulin resistance0.000444
Tight junction0.000552
PI3K-Akt signaling pathway0.000615
Neurotrophin signaling pathway0.000662
Human cytomegalovirus infection0.000767
Thyroid hormone signaling pathway0.000988
1 KEGG pathways extracted from DM genes in the LN fetuses were separately indicated as hypermethylation or hypomethylation type.
Table 4. Hyper- and hypomethylated genes accompanied by transcriptional changes.
Chr. No. 1PositionMethylation DifferenceGene NameGenomic RegionFDRMicroarray
LN/HN 2p-Value
2949,625,5420.425LSP1promoter0.0170.6610.010
2534,197,0230.342PORpromoter0.0590.8730.056
2259,839,2580.335ABTB1promoter0.0030.7960.092
1357,484,897−0.147GNASpromoter0.0021.4100.003
1042,629,559−0.366RPS29promoter0.0011.3120.060
1955,784,207−0.394UNC13Dexon0.0000.6990.003
526,877,080−0.456SOAT2intron0.0030.6920.031
526,877,156−0.470SOAT2exon0.0010.6920.031
1958,319,907−0.566SLC39A11intron0.0010.7980.090
2949,403,320−0.571IGF2intron0.0000.8510.056
2949,403,299−0.571IGF2promoter0.0010.8510.056
251,592,534−0.594NTHL1intron0.0000.8880.040
1 Chr. no.: chromosome number. 2 LN/HN: ratio of gene expression of LN to HN.
Table 5. Hyper- and hypomethylated genes associated with hepatic growth, energy, cholesterol, and mitochondrial metabolisms.
Chr. No. 1PositionMethylation DifferenceGene NameGenomic RegionFDRPCR
LN/HN 2p-Value
45,187,3370.358GRB10promoter0.0250.3410.074
1839,490,208−0.197TATintron0.0230.5540.043
996,221,893−0.436IGF2Rintron0.0000.5550.058
1174,335,256−0.205ADCY3promoter0.0500.5810.086
2740,235,976−0.226RARBintron0.0650.5920.076
2944,889,9600.191PCintron0.0780.6230.070
2131,986,576−0.382PINK1exon/utr30.0000.7170.049
1583,530,698−0.588ACAD8intron0.0000.7970.100
374,775,896−0.423CTHintron0.0671.4880.059
4113,578,2060.286NOS3intron0.0061.7510.079
793,056,0760.205NR2F1intron0.0002.0350.097
2011,399,276−0.489PIK3R1exon/utr30.0202.0430.027
1 Chr. no.: chromosome number. 2 LN/HN: ratio of gene expression of LN to HN.
Disclaimer/Publisher’s Note: The statements, opinions and data contained in all publications are solely those of the individual author(s) and contributor(s) and not of MDPI and/or the editor(s). MDPI and/or the editor(s) disclaim responsibility for any injury to people or property resulting from any ideas, methods, instructions or products referred to in the content.

