


Thymoquinone Inhibition of Chemokines in TNF-α-Induced Inflammatory and Metastatic Effects in Triple-Negative Breast Cancer Cells

 , , and
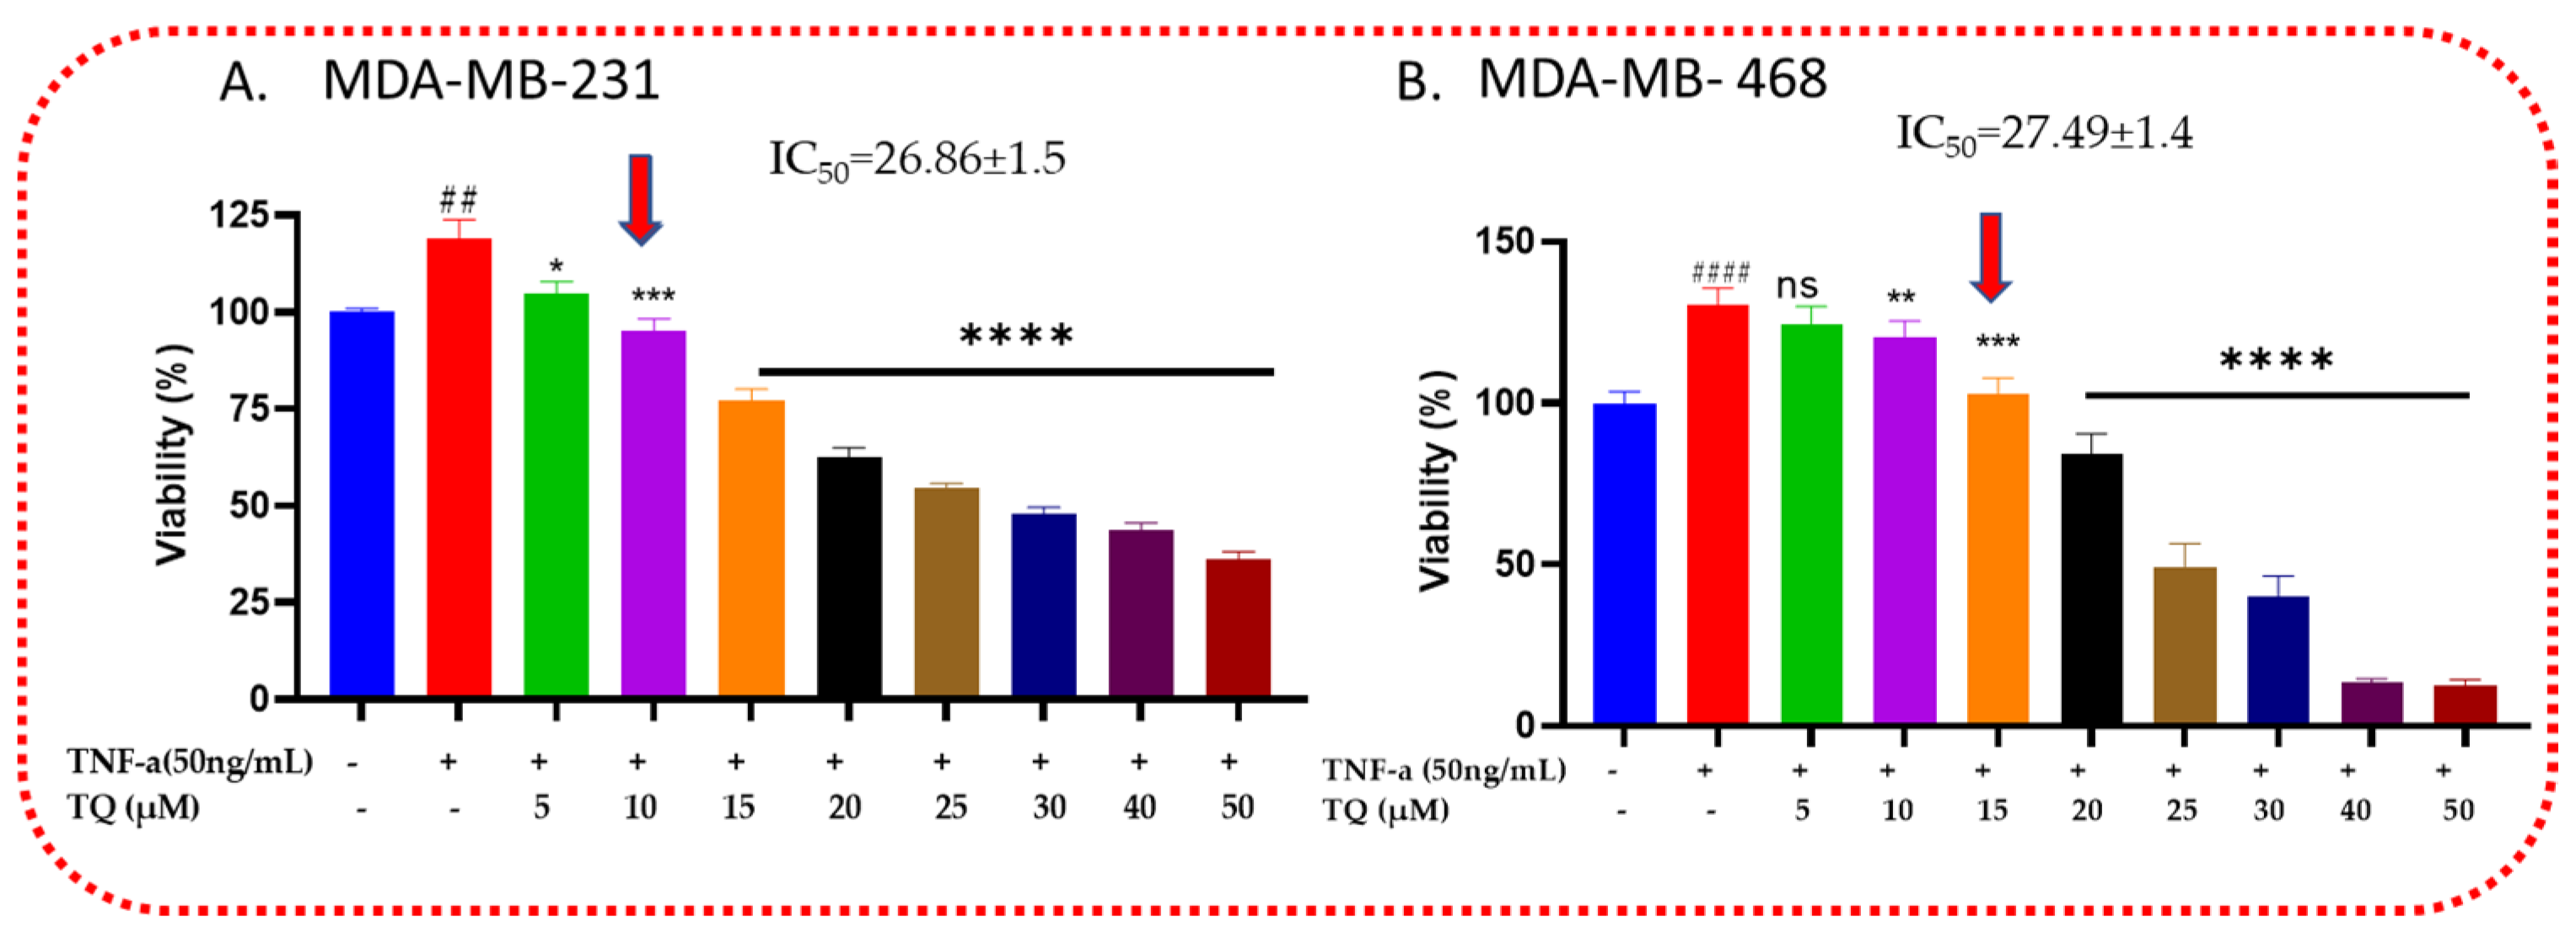
Abstract
1. Introduction
2. Results
2.1. Thymoquinone Decreases the Viability of TNF-α-Treated TNBC Cells
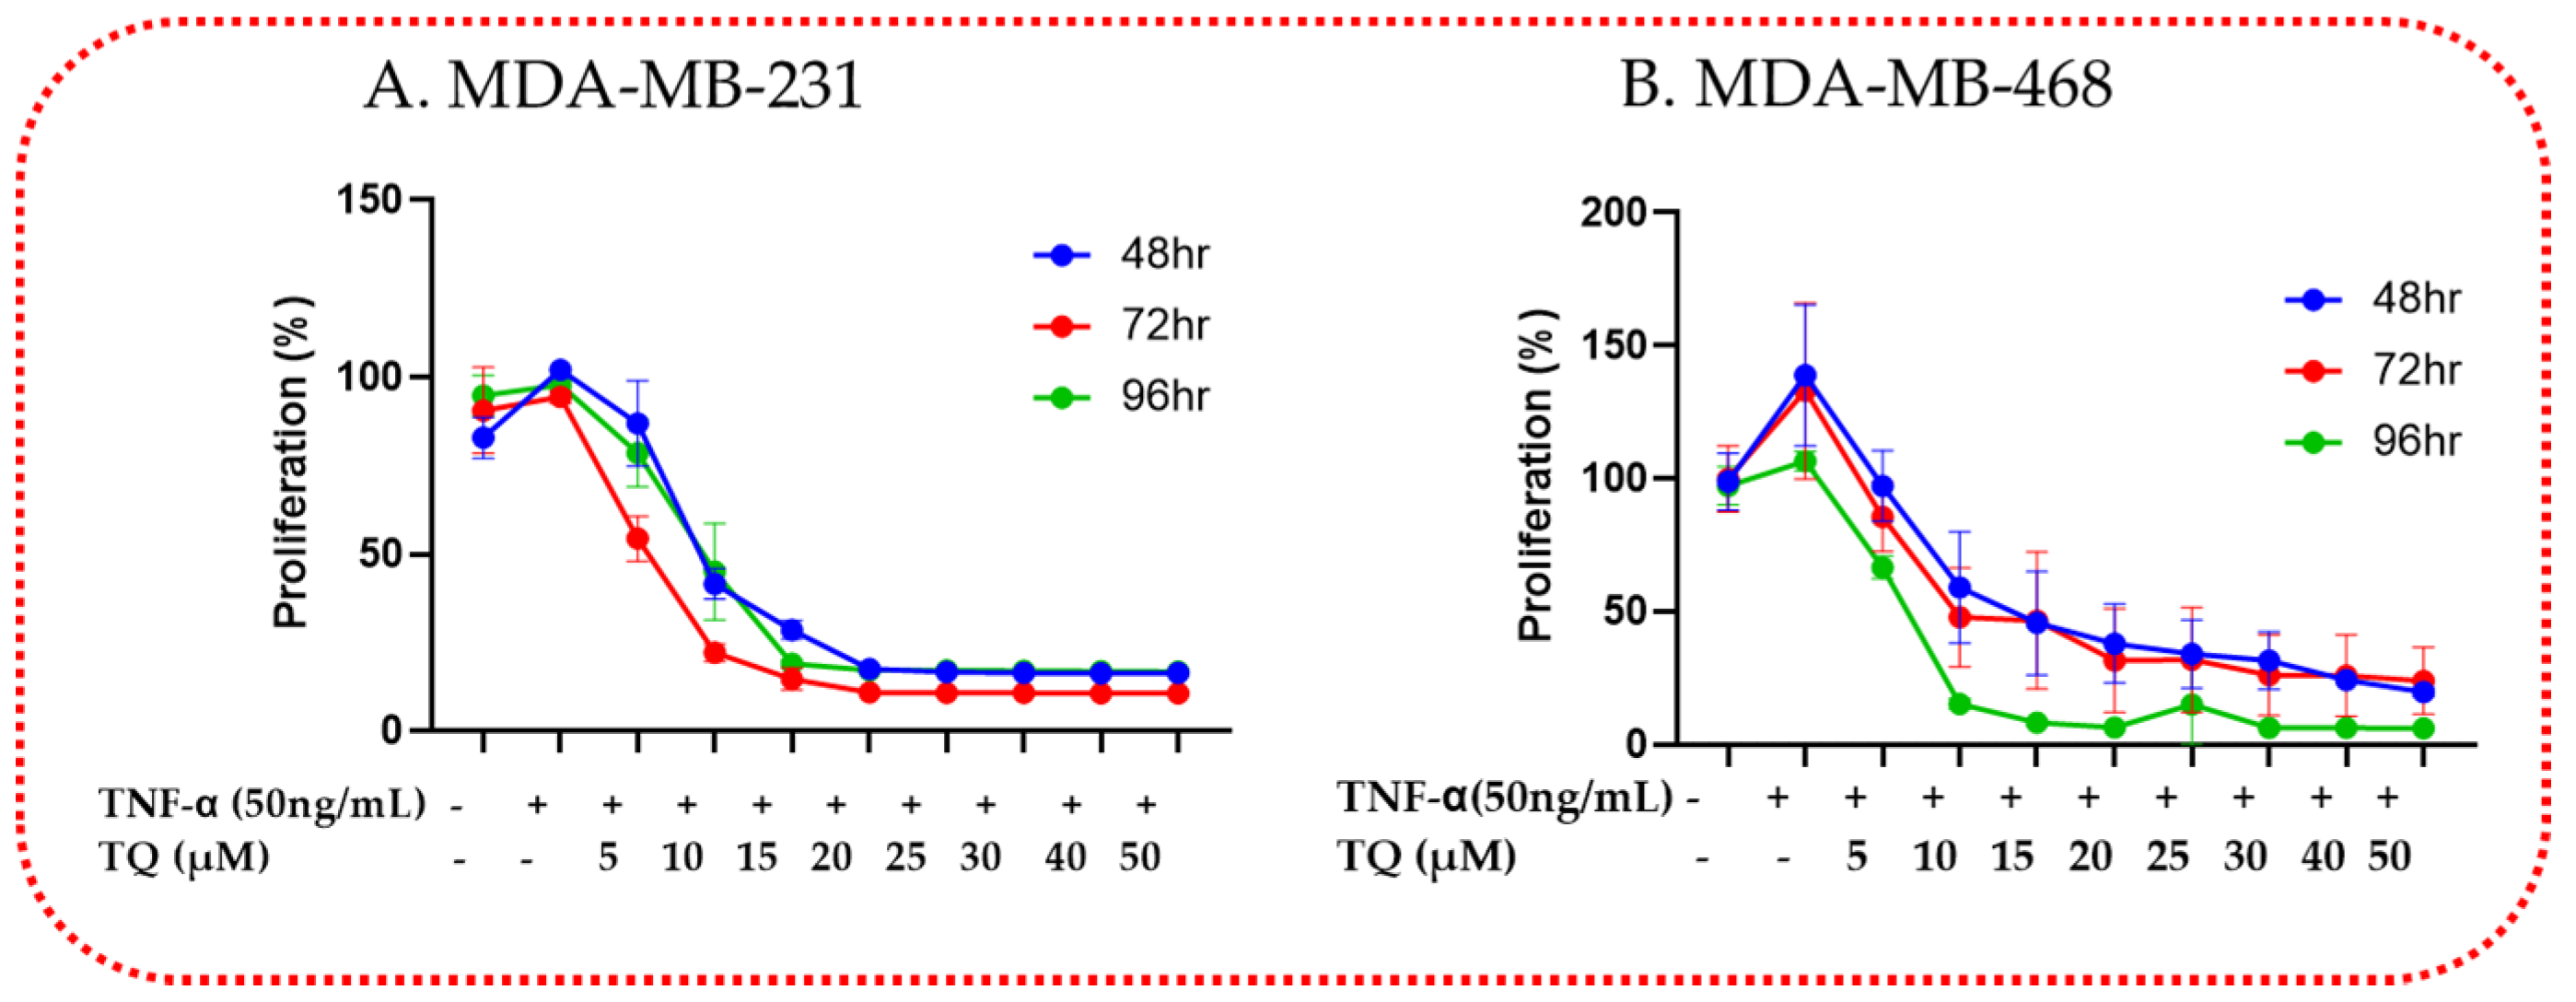
2.2. TQ Reduced TNF-α-Induced Proliferation of TNBC
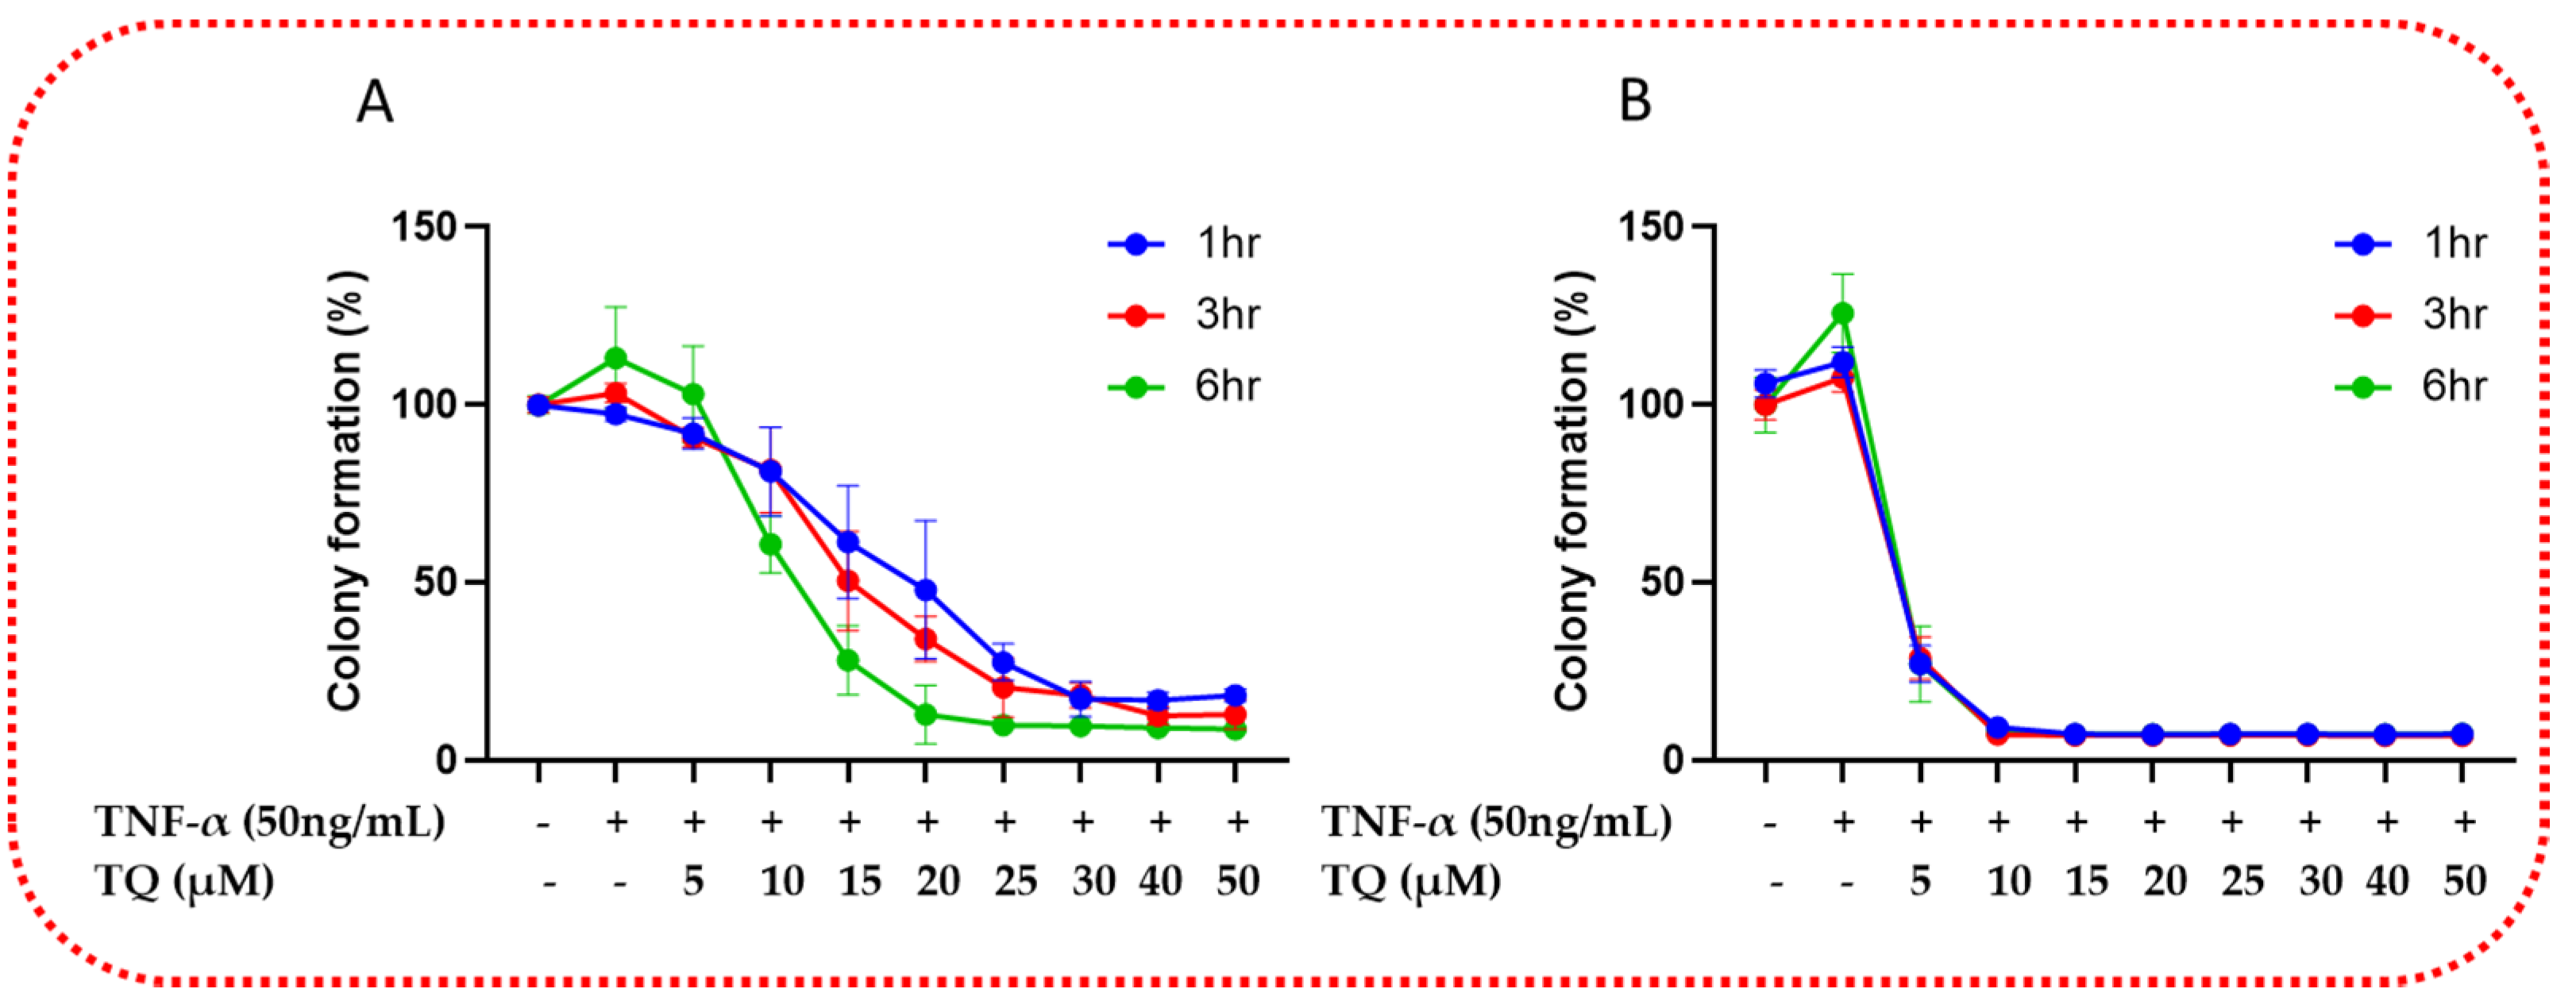
2.3. TQ Inhibited TNF-α-Induced Clonogenicity of TNBC
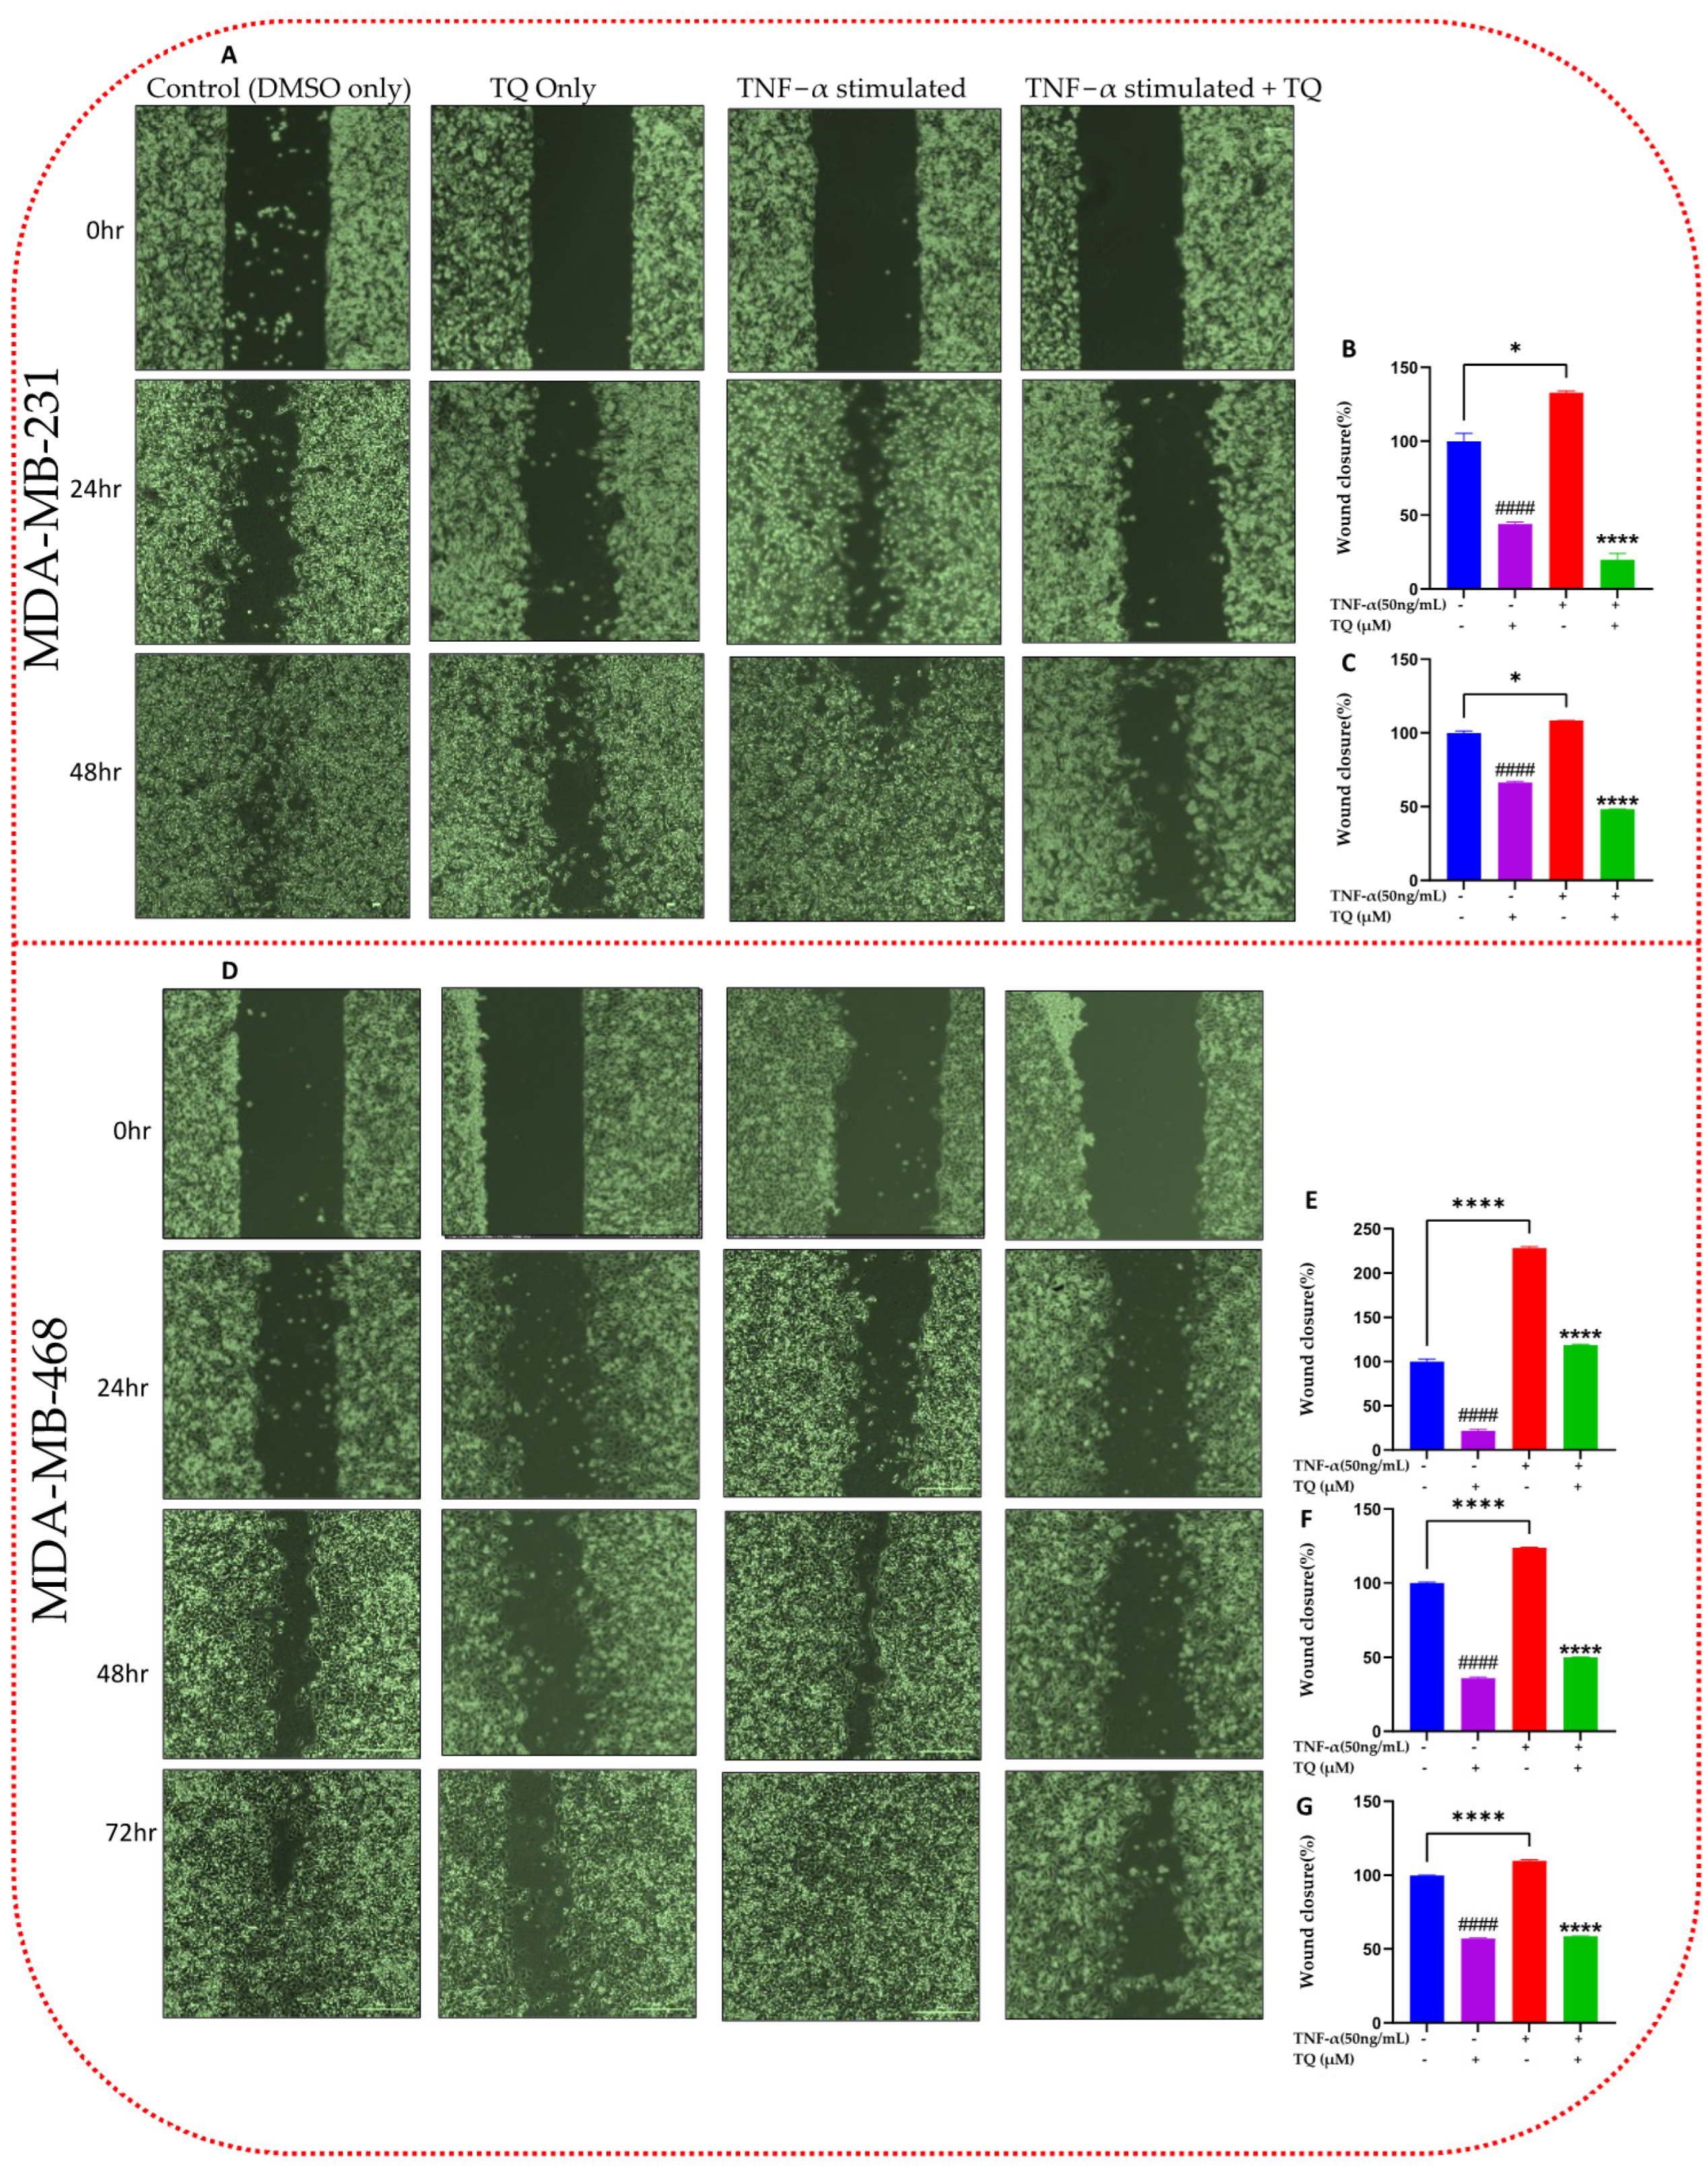
2.4. TQ Inhibits TNF-α-Induced Migration of TNBC Cells
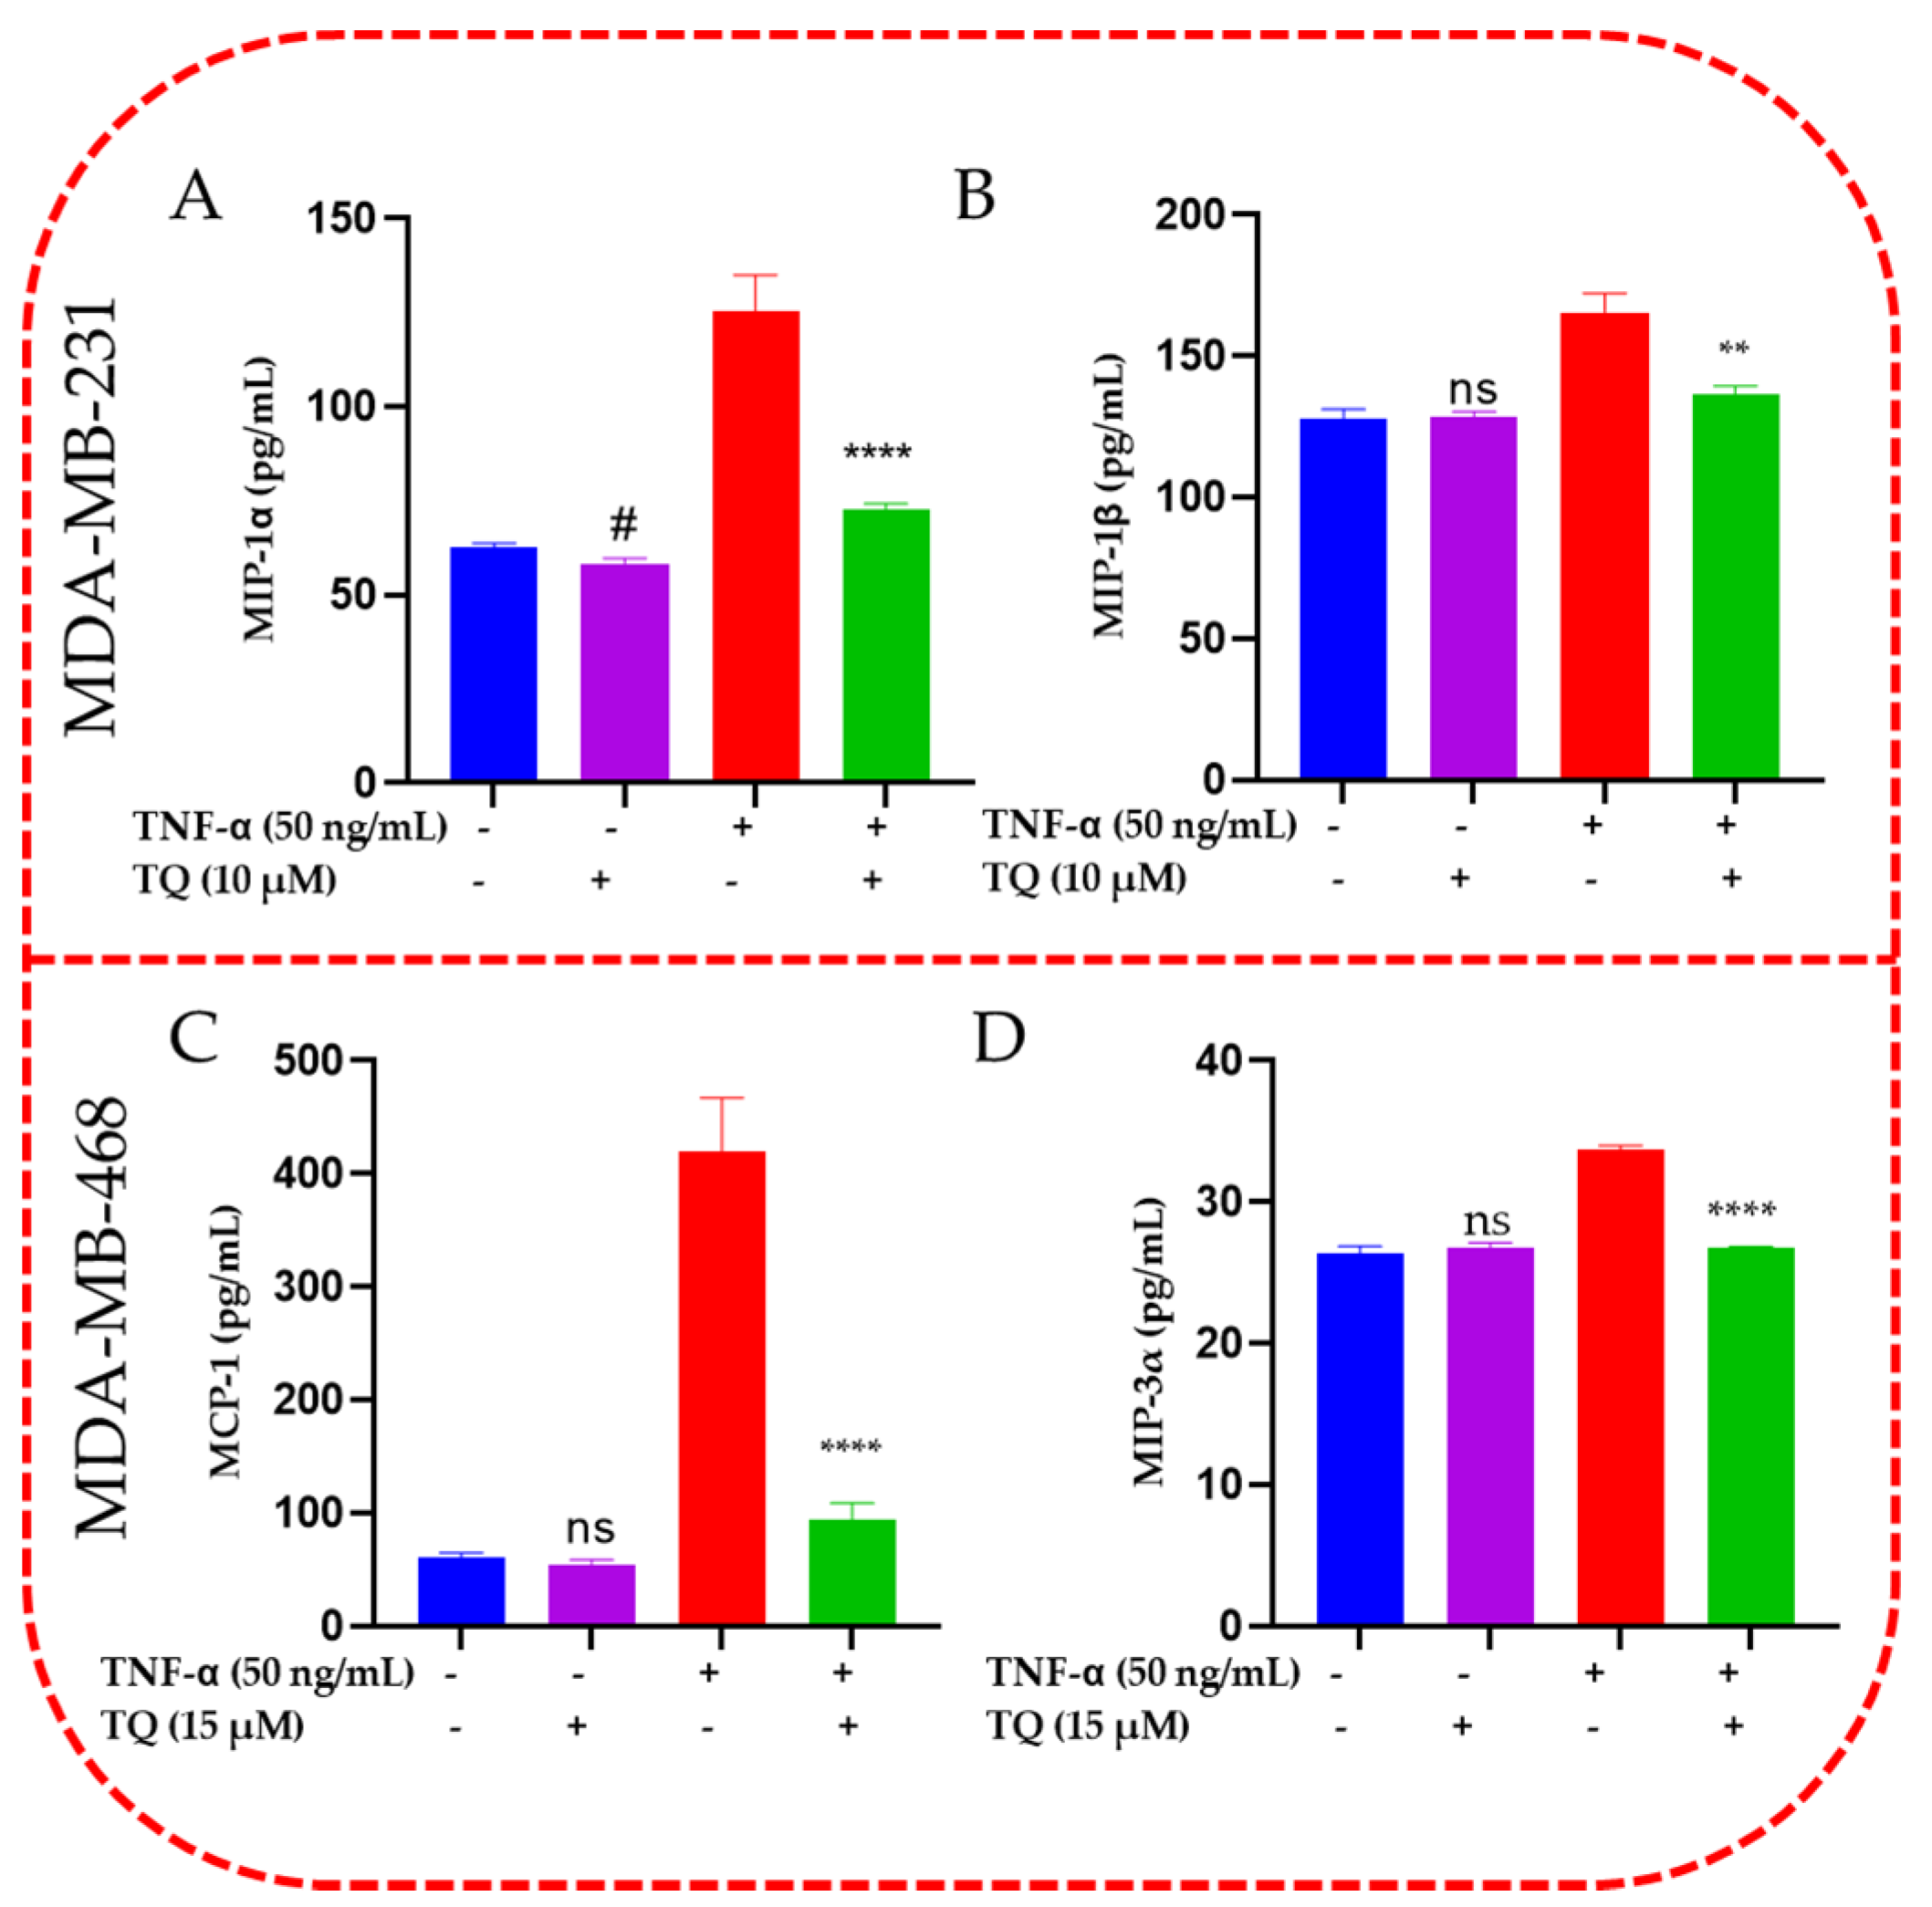
2.5. TQ Inhibits the Release of Chemokines in TNBC Cells
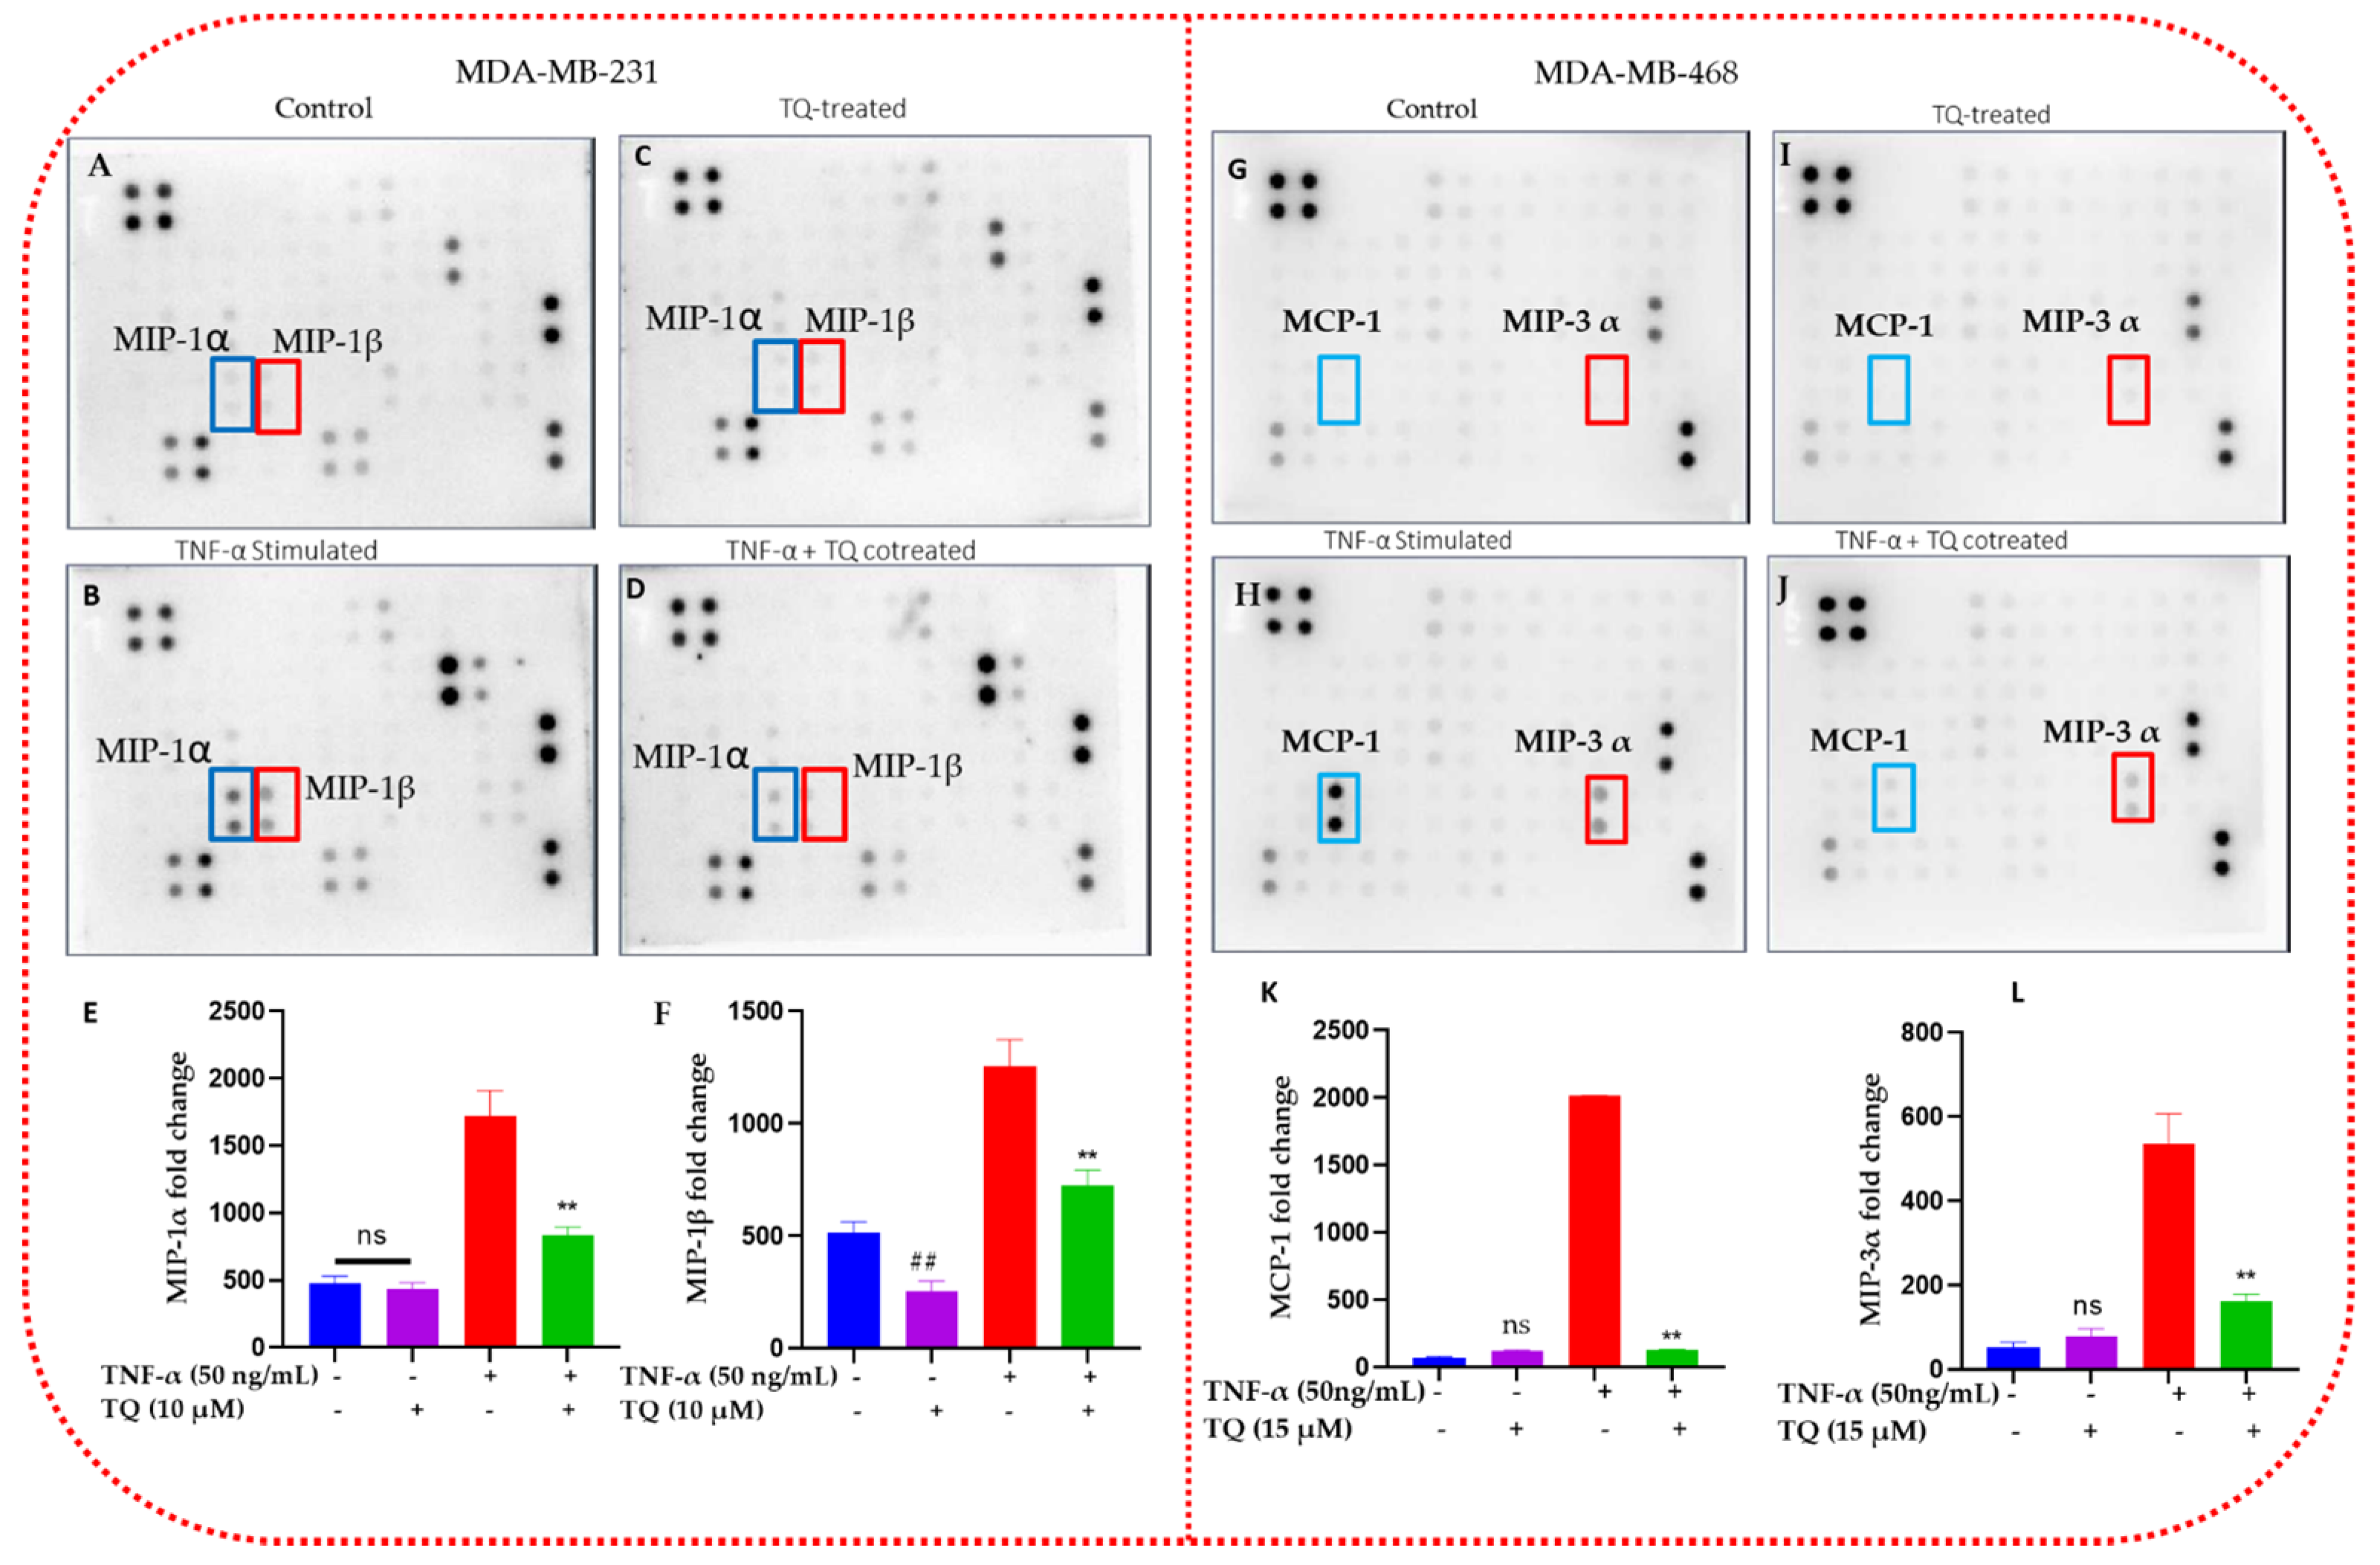
2.6. TQ Inhibited Induction of Chemokines in TNF-α-Stimulated TNBC Cells
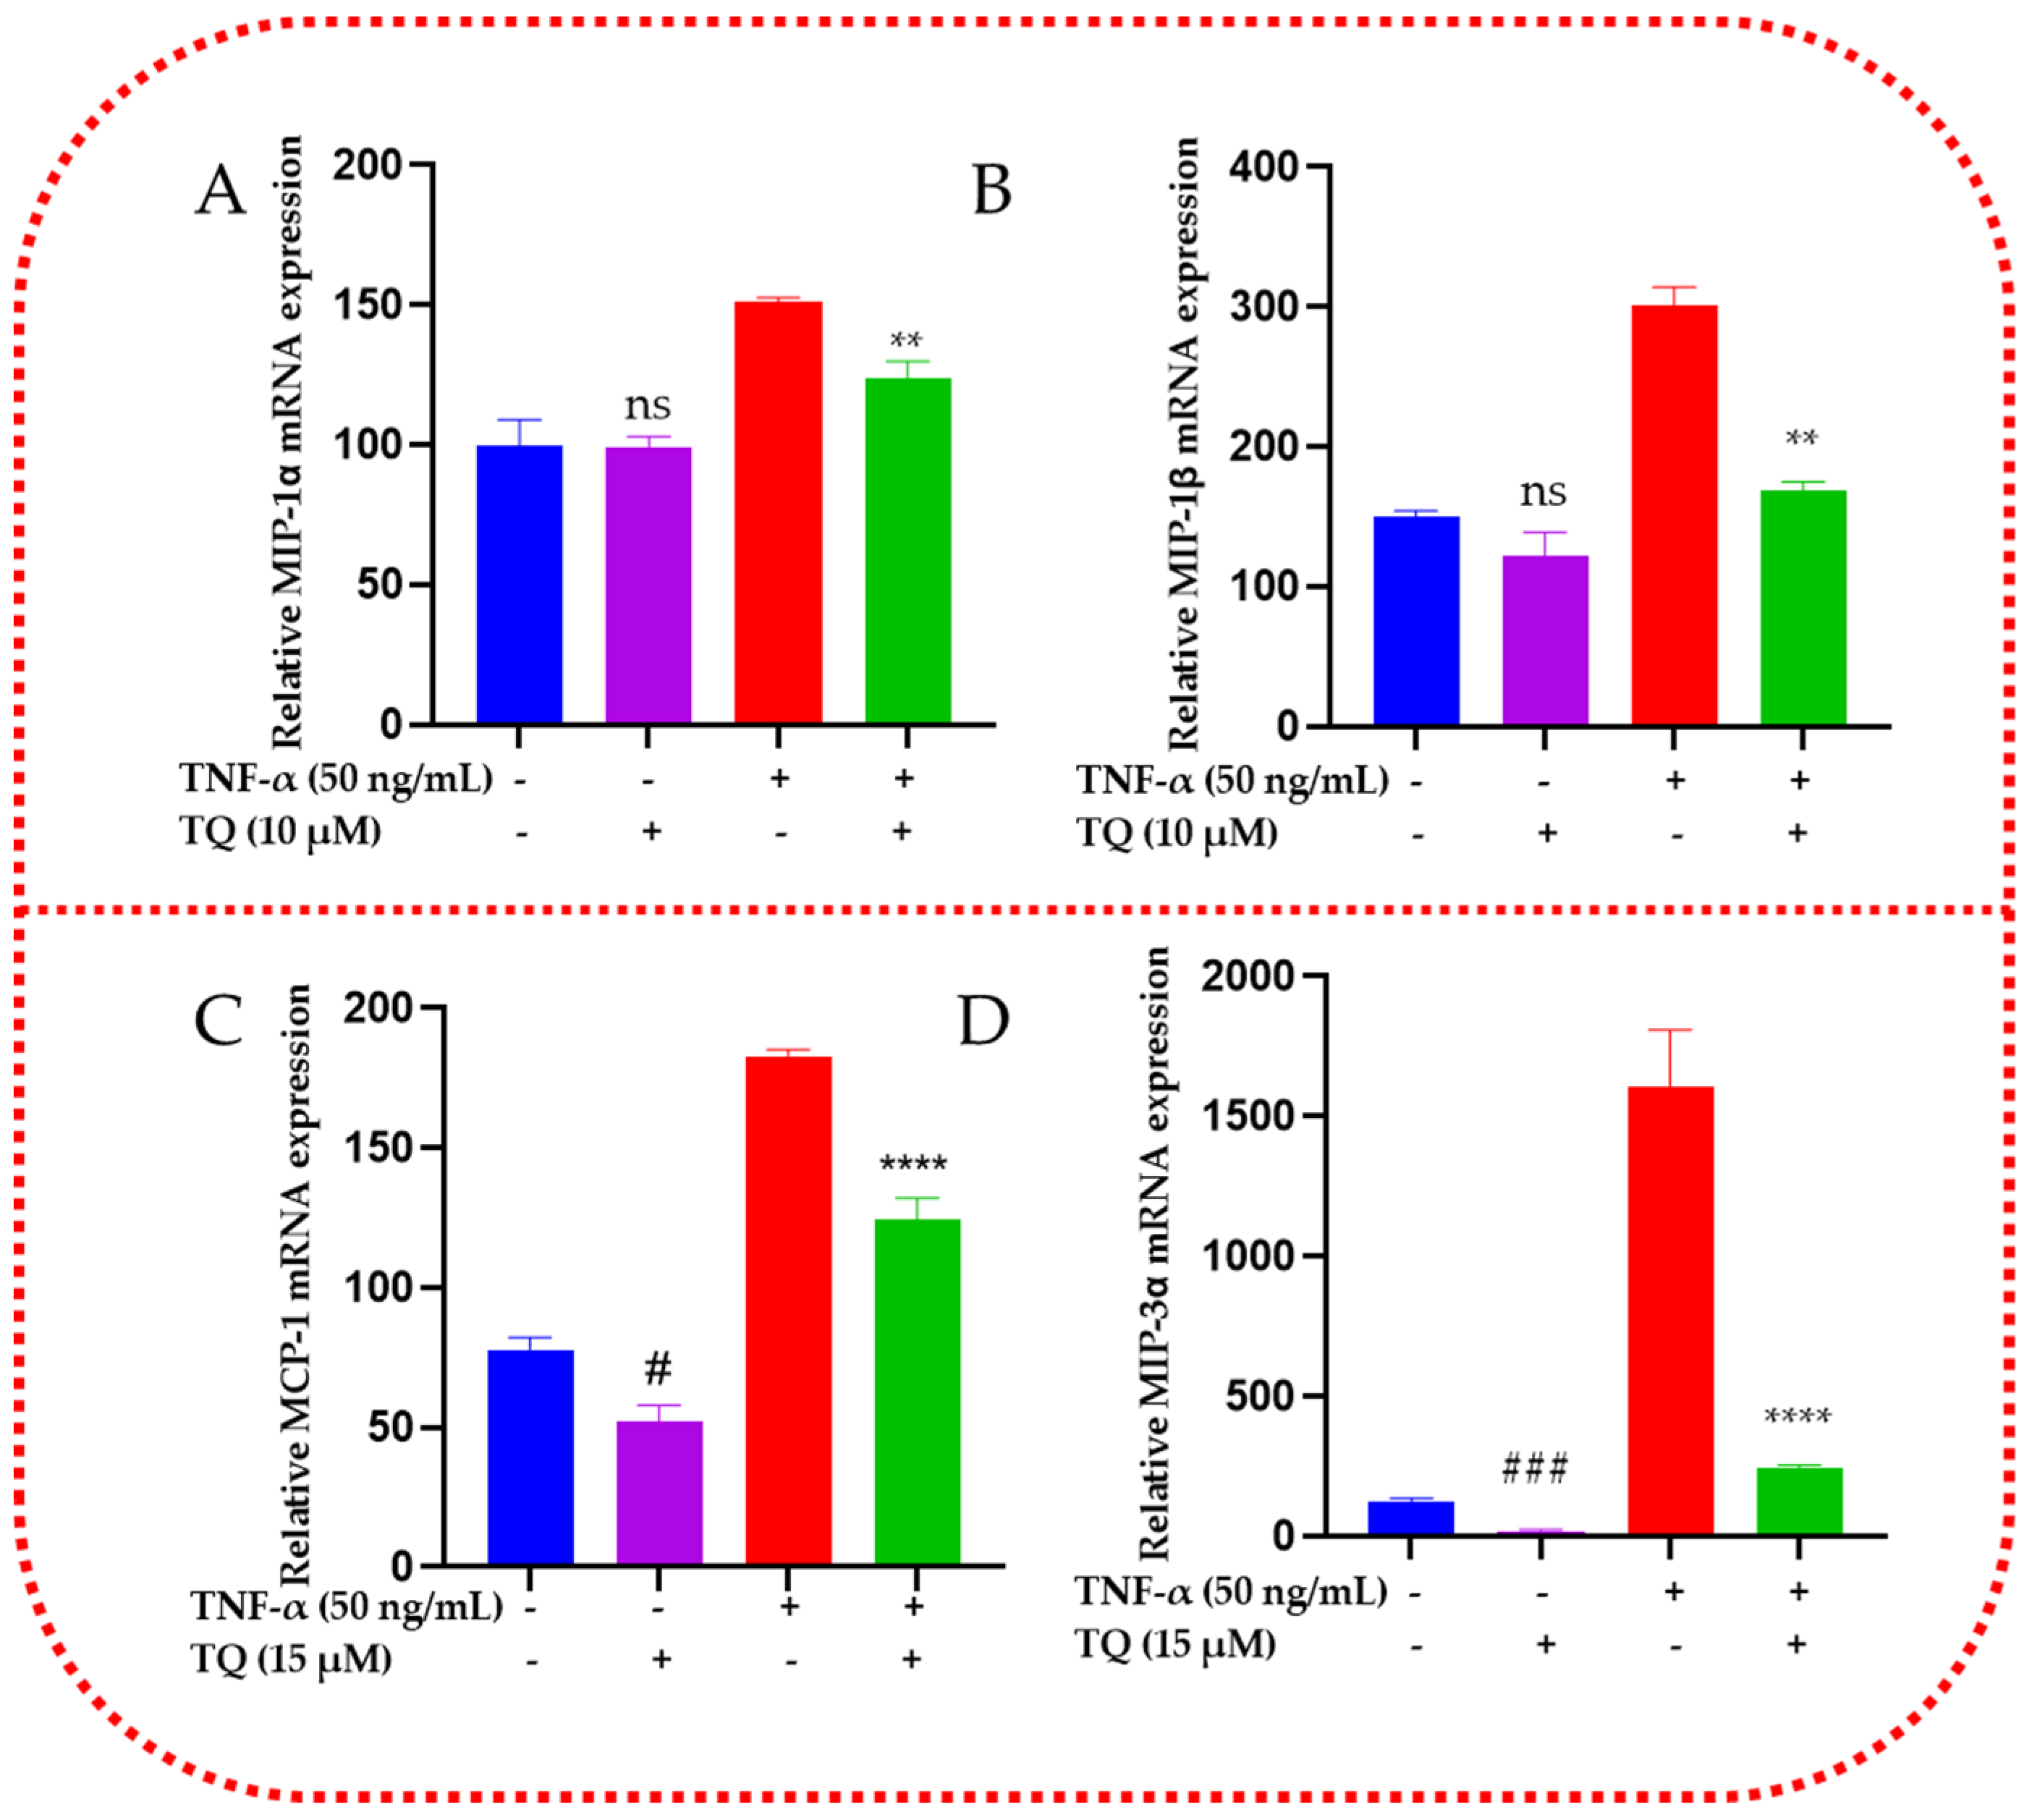
2.7. TQ Represses the mRNA Expression of the Chemokines in TNF-α-Stimulated TNBC Cells
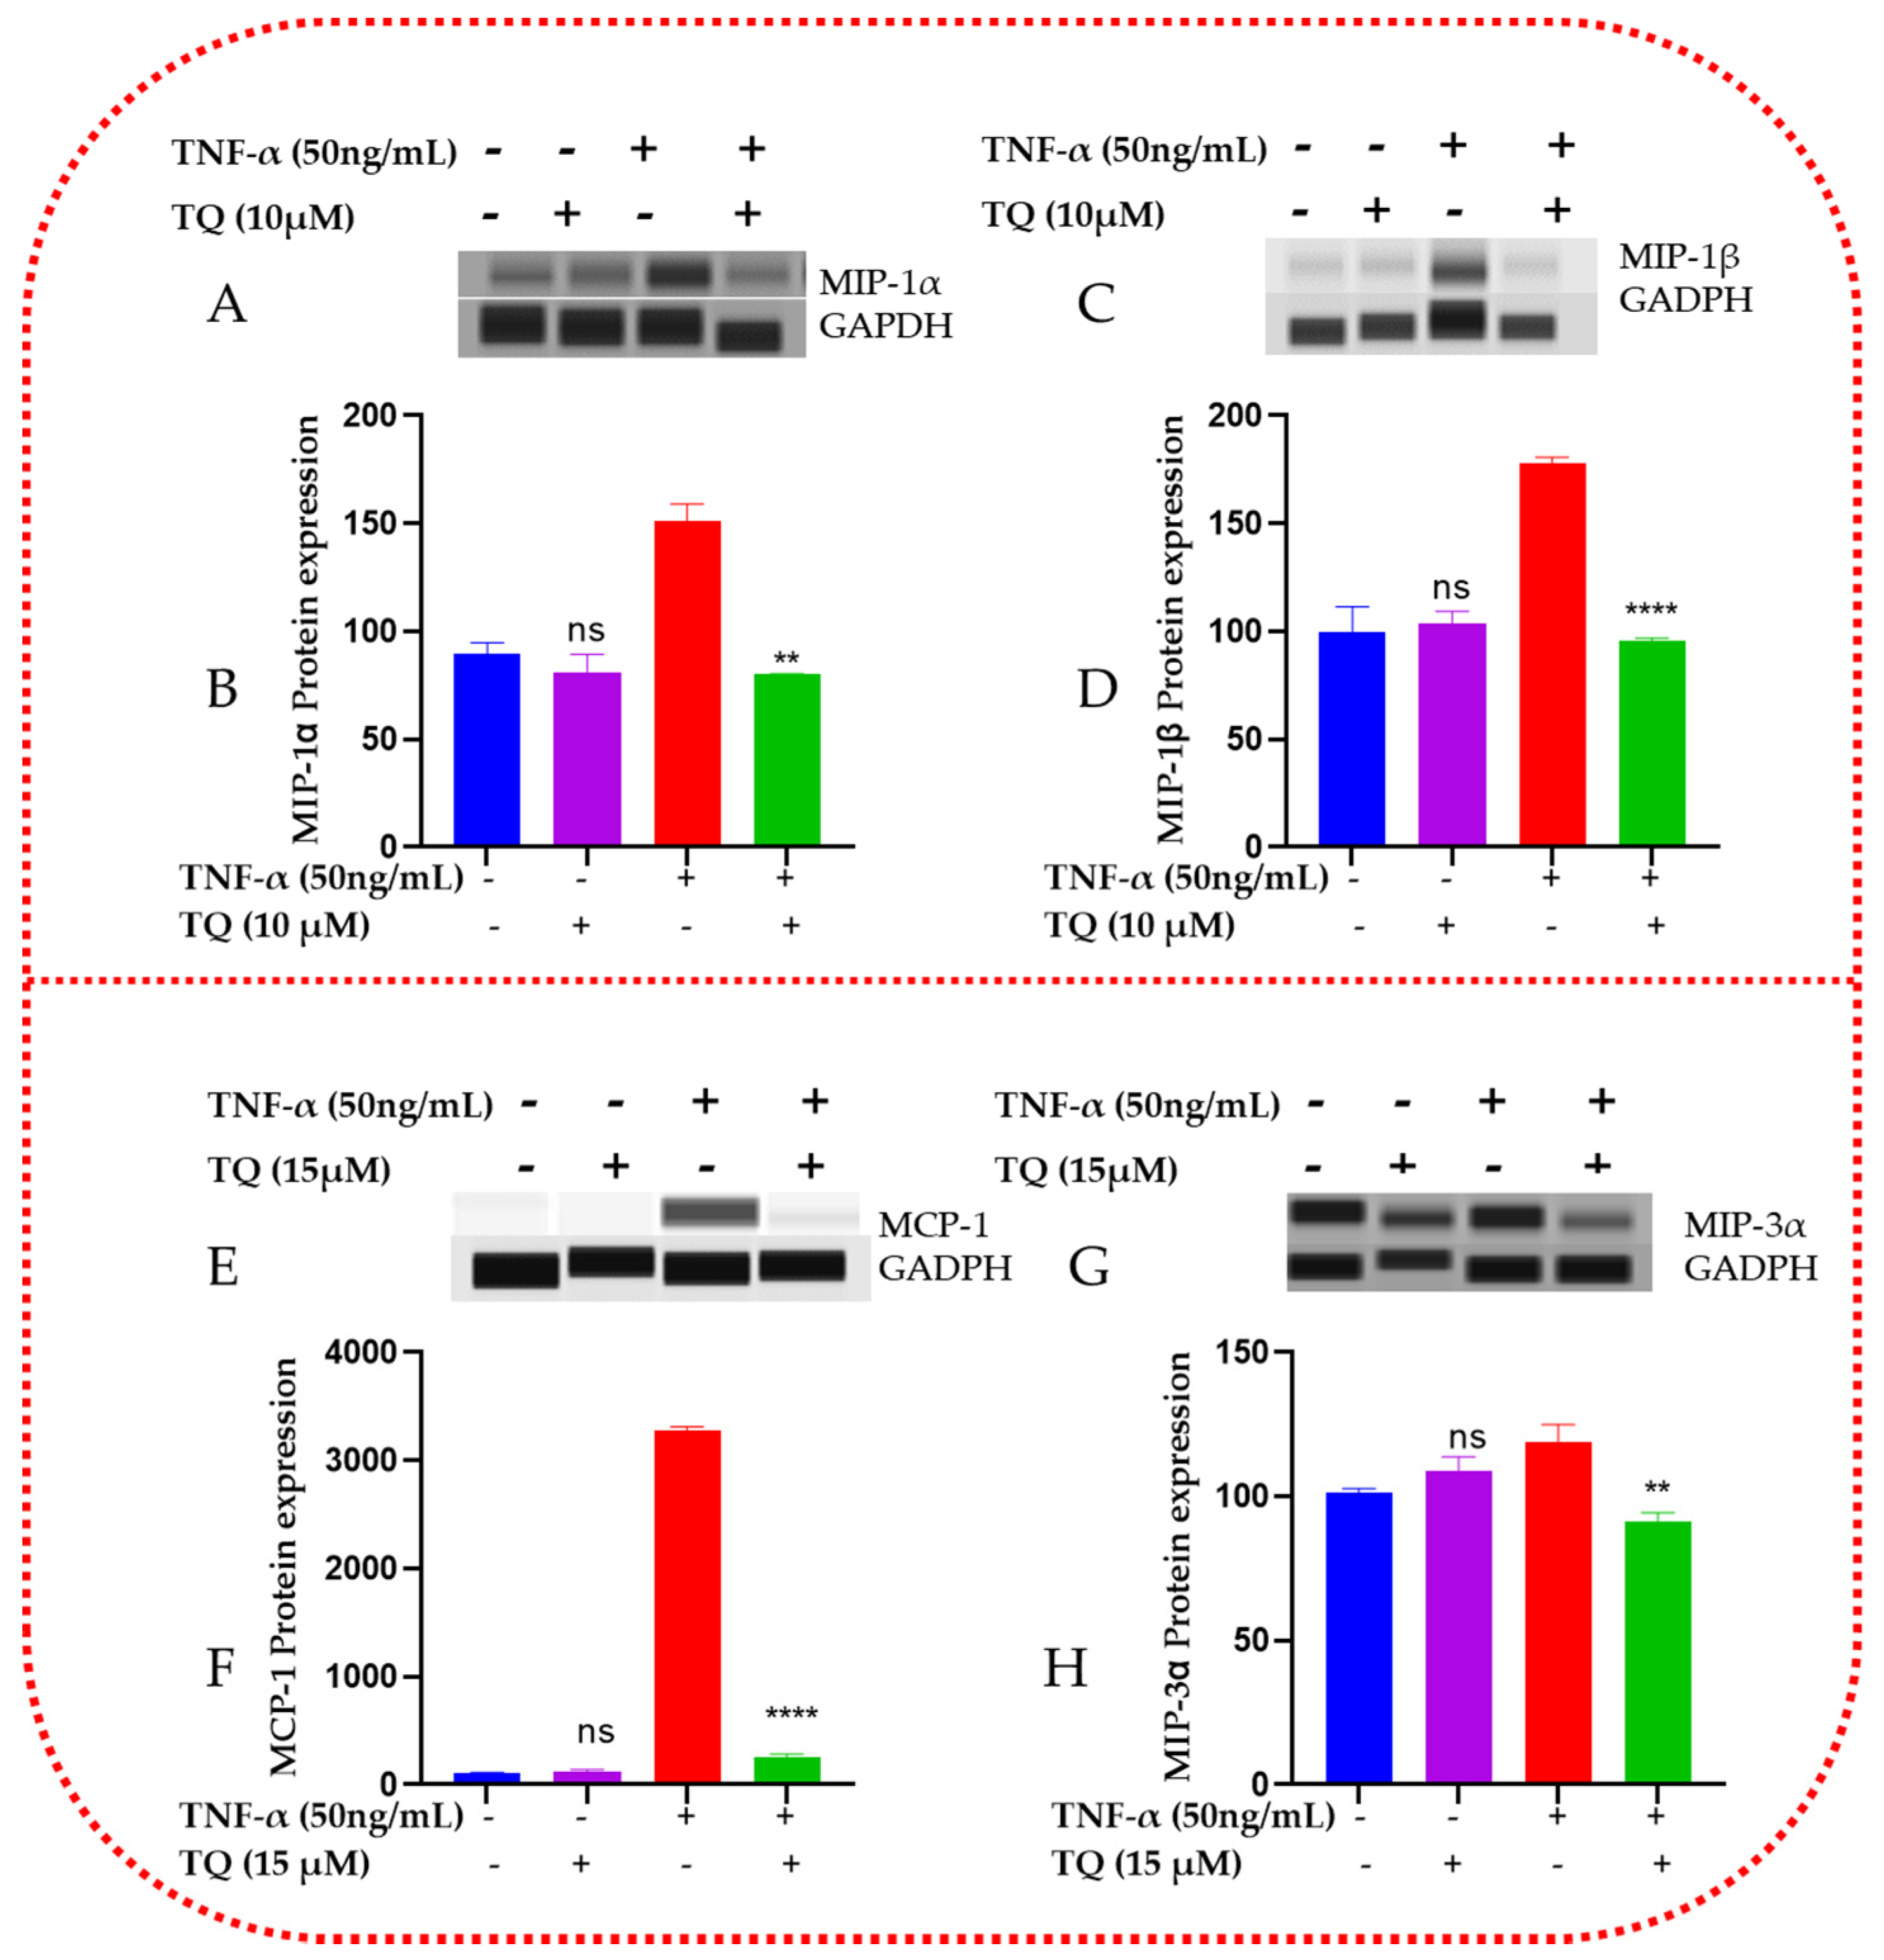
2.8. TQ Represses the Protein Expression of the Chemokines in TNF-α-Stimulated TNBC Cells
3. Discussion
4. Materials and Methods
4.1. Materials and Reagents
4.2. Cell Culture
4.3. Cytotoxicity Assay Using Alamar Blue
4.4. Cell Proliferation Assay
4.5. Colony Forming Assay
4.6. Migration Assay
4.7. Human Cytokine Antibody Arrays Membrane
4.8. Human Chemokine ELISA and Quantification
4.9. Gene Expression Study
4.9.1. RNA Extraction
4.9.2. Complementary DNA (cDNA) Synthesis
4.9.3. Quantitative Reverse Transcription–Polymerase Chain Reaction (qRT-PCR)
4.10. Capillary Electrophoresis Western Analysis
4.11. Statistical Analysis
5. Conclusions
Author Contributions
Funding
Institutional Review Board Statement
Informed Consent Statement
Data Availability Statement
Acknowledgments
Conflicts of Interest
References
- Siegel, R.L.; Miller, K.D.; Fuchs, H.E.; Jemal, A. Cancer statistics, 2022. CA Cancer J. Clin. 2022, 72, 7–33. [Google Scholar] [CrossRef] [PubMed]
- Mehraj, U.; Mushtaq, U.; Mir, M.A.; Saleem, A.; Macha, M.A.; Lone, M.N.; Hamid, A.; Zargar, M.A.; Ahmad, S.M.; Wani, N.A. Chemokines in triple-negative breast cancer heterogeneity: New challenges for clinical implications. Semin. Cancer Biol. 2022, 86, 769–783. [Google Scholar] [CrossRef] [PubMed]
- Adinew, G.M.; Taka, E.; Mendonca, P.; Messeha, S.S.; Soliman, K.F.A. The Anticancer Effects of Flavonoids through miRNAs Modulations in Triple-Negative Breast Cancer. Nutrients 2021, 13, 1212. [Google Scholar] [CrossRef] [PubMed]
- Adinew, G.M.; Taka, E.; Mochona, B.; Badisa, R.B.; Mazzio, E.A.; Elhag, R.; Soliman, K.F.A. Therapeutic Potential of Thymoquinone in Triple-Negative Breast Cancer Prevention and Progression through the Modulation of the Tumor Microenvironment. Nutrients 2021, 14, 79. [Google Scholar] [CrossRef]
- Coussens, L.M.; Werb, Z. Inflammation and cancer. Nature 2002, 420, 860–867. [Google Scholar] [CrossRef]
- Wang, N.; Liu, W.; Zheng, Y.; Wang, S.; Yang, B.; Li, M.; Song, J.; Zhang, F.; Zhang, X.; Wang, Q.; et al. CXCL1 derived from tumor-associated macrophages promotes breast cancer metastasis via activating NF-kappaB/SOX4 signaling. Cell Death Dis. 2018, 9, 880. [Google Scholar] [CrossRef]
- Griffith, T.S.; Anderson, R.D.; Davidson, B.L.; Williams, R.D.; Ratliff, T.L. Adenoviral-mediated transfer of the TNF-related apoptosis-inducing ligand/Apo-2 ligand gene induces tumor cell apoptosis. J. Immunol. 2000, 165, 2886–2894. [Google Scholar] [CrossRef]
- Mollica Poeta, V.; Massara, M.; Capucetti, A.; Bonecchi, R. Chemokines, and Chemokine Receptors: New Targets for Cancer Immunotherapy. Front. Immunol. 2019, 10, 379. [Google Scholar] [CrossRef]
- Grivennikov, S.I.; Greten, F.R.; Karin, M. Immunity, inflammation, and cancer. Cell 2010, 140, 883–899. [Google Scholar] [CrossRef]
- Raman, D.; Baugher, P.J.; Thu, Y.M.; Richmond, A. Role of chemokines in tumor growth. Cancer Lett. 2007, 256, 137–165. [Google Scholar] [CrossRef]
- Burke, D.L.; Frid, M.G.; Kunrath, C.L.; Karoor, V.; Anwar, A.; Wagner, B.D.; Strassheim, D.; Stenmark, K.R. Sustained hypoxia promotes the development of a pulmonary artery-specific chronic inflammatory microenvironment. Am. J. Physiol. Lung Cell. Mol. Physiol. 2009, 297, L238–L250. [Google Scholar] [CrossRef] [PubMed]
- Shanahan, J.C.; St Clair, W. Tumor necrosis factor-alpha blockade: A novel therapy for rheumatic disease. Clin. Immunol. 2002, 103, 231–242. [Google Scholar] [CrossRef] [PubMed]
- Balkwill, F. Tumor necrosis factor or tumor promoting factor? Cytokine Growth Factor. Rev. 2002, 13, 135–141. [Google Scholar] [CrossRef] [PubMed]
- Balkwill, F. Cancer, and the chemokine network. Nat. Rev. Cancer 2004, 4, 540–550. [Google Scholar] [CrossRef]
- Griffith, J.W.; Sokol, C.L.; Luster, A.D. Chemokines and chemokine receptors: Positioning cells for host defense and immunity. Annu. Rev. Immunol. 2014, 32, 659–702. [Google Scholar] [CrossRef]
- Charo, I.F.; Ransohoff, R.M. The many roles of chemokines and chemokine receptors in inflammation. N. Engl. J. Med. 2006, 354, 610–621. [Google Scholar] [CrossRef]
- Sharma, B.; Nannuru, K.C.; Saxena, S.; Varney, M.L.; Singh, R.K. CXCR2: A Novel Mediator of Mammary Tumor Bone Metastasis. Int. J. Mol. Sci. 2019, 20, 1237. [Google Scholar] [CrossRef]
- Mukaida, N.; Sasaki, S.; Baba, T. Chemokines in cancer development and progression and their potential as targeting molecules for cancer treatment. Mediat. Inflamm. 2014, 2014, 170381. [Google Scholar] [CrossRef]
- Cortazar, P.; Zhang, L.; Untch, M.; Mehta, K.; Costantino, J.P.; Wolmark, N.; Bonnefoi, H.; Cameron, D.; Gianni, L.; Valagussa, P.; et al. Pathological complete response and long-term clinical benefit in breast cancer: The CTNeoBC pooled analysis. Lancet 2014, 384, 164–172. [Google Scholar] [CrossRef]
- Adinew, G.M.; Messeha, S.; Taka, E.; Soliman, K.F.A. The Prognostic and Therapeutic Implications of the Chemoresistance Gene BIRC5 in Triple-Negative Breast Cancer. Cancers 2022, 14, 5180. [Google Scholar] [CrossRef]
- Badary, O.A.; Hamza, M.S.; Tikamdas, R. Thymoquinone: A Promising Natural Compound with Potential Benefits for COVID-19 Prevention and Cure. Drug. Des. Devel Ther. 2021, 15, 1819–1833. [Google Scholar] [CrossRef] [PubMed]
- Adinew, G.M.; Messeha, S.S.; Taka, E.; Badisa, R.B.; Antonie, L.M.; Soliman, K.F.A. Thymoquinone Alterations of the Apoptotic Gene Expressions and Cell Cycle Arrest in Genetically Distinct Triple-Negative Breast Cancer Cells. Nutrients 2022, 14, 2120. [Google Scholar] [CrossRef] [PubMed]
- Adinew, G.; Messeha, S.S.; Badisa, R.; Taka, E.; Soliman, K.F.A. Thymoquinone Anticancer Effects Through the Upregulation of NRF2 and the Downregulation of PD-L1 in MDA-MB-231 Triple-Negative Breast Cancer Cells. FASEB J. 2022, 36 (Suppl. S1). [Google Scholar] [CrossRef] [PubMed]
- Yin, L.; Duan, J.J.; Bian, X.W.; Yu, S.C. Triple-negative breast cancer molecular subtyping and treatment progress. Breast Cancer Res. 2020, 22, 61. [Google Scholar] [CrossRef]
- Bachmeier, B.E.; Mohrenz, I.V.; Mirisola, V.; Schleicher, E.; Romeo, F.; Hohneke, C.; Jochum, M.; Nerlich, A.G.; Pfeffer, U. Curcumin downregulates the inflammatory cytokines CXCL1 and -2 in breast cancer cells via NFkappaB. Carcinogenesis 2008, 29, 779–789. [Google Scholar] [CrossRef]
- Zong, H.; Wang, F.; Fan, Q.X.; Wang, L.X. Curcumin inhibits metastatic progression of breast cancer cell through suppression of urokinase-type plasminogen activator by NF-kappa B signaling pathways. Mol. Biol. Rep. 2012, 39, 4803–4808. [Google Scholar] [CrossRef]
- Liubomirski, Y.; Lerrer, S.; Meshel, T.; Rubinstein-Achiasaf, L.; Morein, D.; Wiemann, S.; Korner, C.; Ben-Baruch, A. Tumor-Stroma-Inflammation Networks Promote Pro-metastatic Chemokines and Aggressiveness Characteristics in Triple-Negative Breast Cancer. Front. Immunol. 2019, 10, 757. [Google Scholar] [CrossRef]
- Liu, W.; Lu, X.; Shi, P.; Yang, G.; Zhou, Z.; Li, W.; Mao, X.; Jiang, D.; Chen, C. TNF-alpha increases breast cancer stem-like cells through upregulating TAZ expression via the non-canonical NF-kappaB pathway. Sci. Rep. 2020, 10, 1804. [Google Scholar] [CrossRef]
- Vilgelm, A.E.; Richmond, A. Chemokines Modulate Immune Surveillance in Tumorigenesis, Metastasis, and Response to Immunotherapy. Front. Immunol. 2019, 10, 333. [Google Scholar] [CrossRef]
- Chow, M.T.; Luster, A.D. Chemokines in cancer. Cancer Immunol. Res. 2014, 2, 1125–1131. [Google Scholar] [CrossRef]
- Nagarsheth, N.; Wicha, M.S.; Zou, W. Chemokines in the cancer microenvironment and their relevance in cancer immunotherapy. Nat. Rev. Immunol. 2017, 17, 559–572. [Google Scholar] [CrossRef] [PubMed]
- Adinew, G.M.; Messeha, S.; Taka, E.; Ahmed, S.A.; Soliman, K.F.A. The Role of Apoptotic Genes and Protein-Protein Interactions in Triple-negative Breast Cancer. Cancer Genom. Proteom. 2023, 20, 247–272. [Google Scholar] [CrossRef] [PubMed]
- Borsig, L.; Wolf, M.J.; Roblek, M.; Lorentzen, A.; Heikenwalder, M. Inflammatory chemokines and metastasis—Tracing the accessory. Oncogene 2014, 33, 3217–3224. [Google Scholar] [CrossRef] [PubMed]
- Liu, M.; Yang, J.; Xu, B.; Zhang, X. Tumor metastasis: Mechanistic insights and therapeutic interventions. MedComm 2021, 2, 587–617. [Google Scholar] [CrossRef] [PubMed]
- Wittekind, C.; Neid, M. Cancer invasion and metastasis. Oncology 2005, 69 (Suppl. S1), 14–16. [Google Scholar] [CrossRef]
- Caparica, R.; Lambertini, M.; de Azambuja, E. How I treat metastatic triple-negative breast cancer. ESMO Open 2019, 4, e000504. [Google Scholar] [CrossRef]
- Chue, B.M.; La Course, B.D. Case report of long-term survival with metastatic triple-negative breast carcinoma: Treatment possibilities for metastatic disease. Medicine 2019, 98, e15302. [Google Scholar] [CrossRef]
- Wani, N.; Nasser, M.W.; Ahirwar, D.K.; Zhao, H.; Miao, Z.; Shilo, K.; Ganju, R.K. C-X-C motif chemokine 12/C-X-C chemokine receptor type 7 signaling regulates breast cancer growth and metastasis by modulating the tumor microenvironment. Breast Cancer Res. 2014, 16, R54. [Google Scholar] [CrossRef]
- Chen, H.J.; Edwards, R.; Tucci, S.; Bu, P.; Milsom, J.; Lee, S.; Edelmann, W.; Gumus, Z.H.; Shen, X.; Lipkin, S. Chemokine 25-induced signaling suppresses colon cancer invasion and metastasis. J. Clin. Investig. 2012, 122, 3184–3196. [Google Scholar] [CrossRef]
- Bolitho, C.; Hahn, M.A.; Baxter, R.C.; Marsh, D.J. The chemokine CXCL1 induces proliferation in epithelial ovarian cancer cells by transactivation of the epidermal growth factor receptor. Endocr. Relat. Cancer 2010, 17, 929–940. [Google Scholar] [CrossRef]
- Zlotnik, A.; Burkhardt, A.M.; Homey, B. Homeostatic chemokine receptors and organ-specific metastasis. Nat. Rev. Immunol. 2011, 11, 597–606. [Google Scholar] [CrossRef] [PubMed]
- Chavey, C.; Bibeau, F.; Gourgou-Bourgade, S.; Burlinchon, S.; Boissiere, F.; Laune, D.; Roques, S.; Lazennec, G. Oestrogen receptor negative breast cancers exhibit high cytokine content. Breast Cancer Res. 2007, 9, R15. [Google Scholar] [CrossRef] [PubMed]
- Ueno, T.; Toi, M.; Saji, H.; Muta, M.; Bando, H.; Kuroi, K.; Koike, M.; Inadera, H.; Matsushima, K. Significance of macrophage chemoattractant protein-1 in macrophage recruitment, angiogenesis, and survival in human breast cancer. Clin. Cancer Res. 2000, 6, 3282–3289. [Google Scholar]
- Salcedo, R.; Ponce, M.L.; Young, H.A.; Wasserman, K.; Ward, J.M.; Kleinman, H.K.; Oppenheim, J.J.; Murphy, W.J. Human endothelial cells express CCR2 and respond to MCP-1: Direct role of MCP-1 in angiogenesis and tumor progression. Blood 2000, 96, 34–40. [Google Scholar] [CrossRef] [PubMed]
- Nam, J.S.; Kang, M.J.; Suchar, A.M.; Shimamura, T.; Kohn, E.A.; Michalowska, A.M.; Jordan, V.C.; Hirohashi, S.; Wakefield, L.M. Chemokine (C-C motif) ligand 2 mediates the prometastatic effect of dysadherin in human breast cancer cells. Cancer Res. 2006, 66, 7176–7184. [Google Scholar] [CrossRef]
- Hembruff, S.L.; Jokar, I.; Yang, L.; Cheng, N. Loss of transforming growth factor-beta signaling in mammary fibroblasts enhances CCL2 secretion to promote mammary tumor progression through macrophage-dependent and -independent mechanisms. Neoplasia 2010, 12, 425–433. [Google Scholar] [CrossRef]
- Qian, B.Z.; Li, J.; Zhang, H.; Kitamura, T.; Zhang, J.; Campion, L.R.; Kaiser, E.A.; Snyder, L.A.; Pollard, J.W. CCL2 recruits inflammatory monocytes to facilitate breast-tumour metastasis. Nature 2011, 475, 222–225. [Google Scholar] [CrossRef]
- Wolf, M.J.; Hoos, A.; Bauer, J.; Boettcher, S.; Knust, M.; Weber, A.; Simonavicius, N.; Schneider, C.; Lang, M.; Sturzl, M.; et al. Endothelial CCR2 signaling induced by colon carcinoma cells enables extravasation via the JAK2-Stat5 and p38MAPK pathways. Cancer Cell 2012, 22, 91–105. [Google Scholar] [CrossRef]
- Bonapace, L.; Coissieux, M.M.; Wyckoff, J.; Mertz, K.D.; Varga, Z.; Junt, T.; Bentires-Alj, M. Cessation of CCL2 inhibition accelerates breast cancer metastasis by promoting angiogenesis. Nature 2014, 515, 130–133. [Google Scholar] [CrossRef]
- Robinson, S.C.; Scott, K.A.; Balkwill, F.R. Chemokine stimulation of monocyte matrix metalloproteinase-9 requires endogenous TNF-alpha. Eur. J. Immunol. 2002, 32, 404–412. [Google Scholar] [CrossRef]
- Fang, W.B.; Jokar, I.; Zou, A.; Lambert, D.; Dendukuri, P.; Cheng, N. CCL2/CCR2 chemokine signaling coordinates survival and motility of breast cancer cells through Smad3 protein- and p42/44 mitogen-activated protein kinase (MAPK)-dependent mechanisms. J. Biol. Chem. 2012, 287, 36593–36608. [Google Scholar] [CrossRef] [PubMed]
- Tsuyada, A.; Chow, A.; Wu, J.; Somlo, G.; Chu, P.; Loera, S.; Luu, T.; Li, A.X.; Wu, X.; Ye, W.; et al. CCL2 mediates cross-talk between cancer cells and stromal fibroblasts that regulates breast cancer stem cells. Cancer Res. 2012, 72, 2768–2779. [Google Scholar] [CrossRef]
- Maghazachi, A.A. Role of chemokines in the biology of natural killer cells. Curr. Top. Microbiol. Immunol. 2010, 341, 37–58. [Google Scholar] [CrossRef] [PubMed]
- Sasaki, S.; Baba, T.; Nishimura, T.; Hayakawa, Y.; Hashimoto, S.; Gotoh, N.; Mukaida, N. Essential roles of the interaction between cancer cell-derived chemokine, CCL4, and intra-bone CCR5-expressing fibroblasts in breast cancer bone metastasis. Cancer Lett. 2016, 378, 23–32. [Google Scholar] [CrossRef] [PubMed]
- Trellakis, S.; Bruderek, K.; Dumitru, C.A.; Gholaman, H.; Gu, X.; Bankfalvi, A.; Scherag, A.; Hutte, J.; Dominas, N.; Lehnerdt, G.F.; et al. Polymorphonuclear granulocytes in human head and neck cancer: Enhanced inflammatory activity, modulation by cancer cells and expansion in advanced disease. Int. J. Cancer 2011, 129, 2183–2193. [Google Scholar] [CrossRef] [PubMed]
- Lien, M.Y.; Lin, C.W.; Tsai, H.C.; Chen, Y.T.; Tsai, M.H.; Hua, C.H.; Yang, S.F.; Tang, C.H. Impact of CCL4 gene polymorphisms and environmental factors on oral cancer development and clinical characteristics. Oncotarget 2017, 8, 31424–31434. [Google Scholar] [CrossRef]
- Kleeff, J.; Kusama, T.; Rossi, D.L.; Ishiwata, T.; Maruyama, H.; Friess, H.; Buchler, M.W.; Zlotnik, A.; Korc, M. Detection and localization of Mip-3alpha/LARC/Exodus, a macrophage pro-inflammatory chemokine, and its CCR6 receptor in human pancreatic cancer. Int. J. Cancer 1999, 81, 650–657. [Google Scholar] [CrossRef]
- Osuala, K.O.; Sloane, B.F. Many Roles of CCL20: Emphasis on Breast Cancer. Postdoc J. 2014, 2, 7–16. [Google Scholar] [CrossRef]
- Boyle, S.T.; Faulkner, J.W.; McColl, S.R.; Kochetkova, M. The chemokine receptor CCR6 facilitates the onset of mammary neoplasia in the MMTV-PyMT mouse model via the recruitment of tumor-promoting macrophages. Mol. Cancer 2015, 14, 115. [Google Scholar] [CrossRef]
- Lee, S.K.; Park, K.K.; Kim, H.J.; Park, J.; Son, S.H.; Kim, K.R.; Chung, W.Y. Human antigen R-regulated CCL20 contributes to osteolytic breast cancer bone metastasis. Sci. Rep. 2017, 7, 9610. [Google Scholar] [CrossRef]
- Andre, F.; Cabioglu, N.; Assi, H.; Sabourin, J.C.; Delaloge, S.; Sahin, A.; Broglio, K.; Spano, J.P.; Combadiere, C.; Bucana, C.; et al. Expression of chemokine receptors predicts the site of metastatic relapse in patients with axillary node-positive primary breast cancer. Ann. Oncol. 2006, 17, 945–951. [Google Scholar] [CrossRef] [PubMed]
- Thomas, J.K.; Mir, H.; Kapur, N.; Bae, S.; Singh, S. CC chemokines are differentially expressed in Breast Cancer and are associated with a disparity in overall survival. Sci. Rep. 2019, 9, 4014. [Google Scholar] [CrossRef] [PubMed]
- Chen, W.; Qin, Y.; Wang, D.; Zhou, L.; Liu, Y.; Chen, S.; Yin, L.; Xiao, Y.; Yao, X.H.; Yang, X.; et al. CCL20 triggered by chemotherapy hinders the therapeutic efficacy of breast cancer. PLoS Biol. 2018, 16, e2005869. [Google Scholar] [CrossRef] [PubMed]


Disclaimer/Publisher’s Note: The statements, opinions and data contained in all publications are solely those of the individual author(s) and contributor(s) and not of MDPI and/or the editor(s). MDPI and/or the editor(s) disclaim responsibility for any injury to people or property resulting from any ideas, methods, instructions or products referred to in the content. |
© 2023 by the authors. Licensee MDPI, Basel, Switzerland. This article is an open access article distributed under the terms and conditions of the Creative Commons Attribution (CC BY) license (https://creativecommons.org/licenses/by/4.0/).
Share and Cite
Adinew, G.M.; Messeha, S.; Taka, E.; Mochona, B.; Redda, K.K.; Soliman, K.F.A. Thymoquinone Inhibition of Chemokines in TNF-α-Induced Inflammatory and Metastatic Effects in Triple-Negative Breast Cancer Cells. Int. J. Mol. Sci. 2023, 24, 9878. https://doi.org/10.3390/ijms24129878
Adinew GM, Messeha S, Taka E, Mochona B, Redda KK, Soliman KFA. Thymoquinone Inhibition of Chemokines in TNF-α-Induced Inflammatory and Metastatic Effects in Triple-Negative Breast Cancer Cells. International Journal of Molecular Sciences. 2023; 24(12):9878. https://doi.org/10.3390/ijms24129878
Chicago/Turabian StyleAdinew, Getinet M., Samia Messeha, Equar Taka, Bereket Mochona, Kinfe K. Redda, and Karam F. A. Soliman. 2023. "Thymoquinone Inhibition of Chemokines in TNF-α-Induced Inflammatory and Metastatic Effects in Triple-Negative Breast Cancer Cells" International Journal of Molecular Sciences 24, no. 12: 9878. https://doi.org/10.3390/ijms24129878
APA StyleAdinew, G. M., Messeha, S., Taka, E., Mochona, B., Redda, K. K., & Soliman, K. F. A. (2023). Thymoquinone Inhibition of Chemokines in TNF-α-Induced Inflammatory and Metastatic Effects in Triple-Negative Breast Cancer Cells. International Journal of Molecular Sciences, 24(12), 9878. https://doi.org/10.3390/ijms24129878