
Denosumab Attenuates Glucolipotoxicity-Induced β-Cell Dysfunction and Apoptosis by Attenuating RANK/RANKL Signals
 , , , and
Abstract
1. Introduction
2. Results
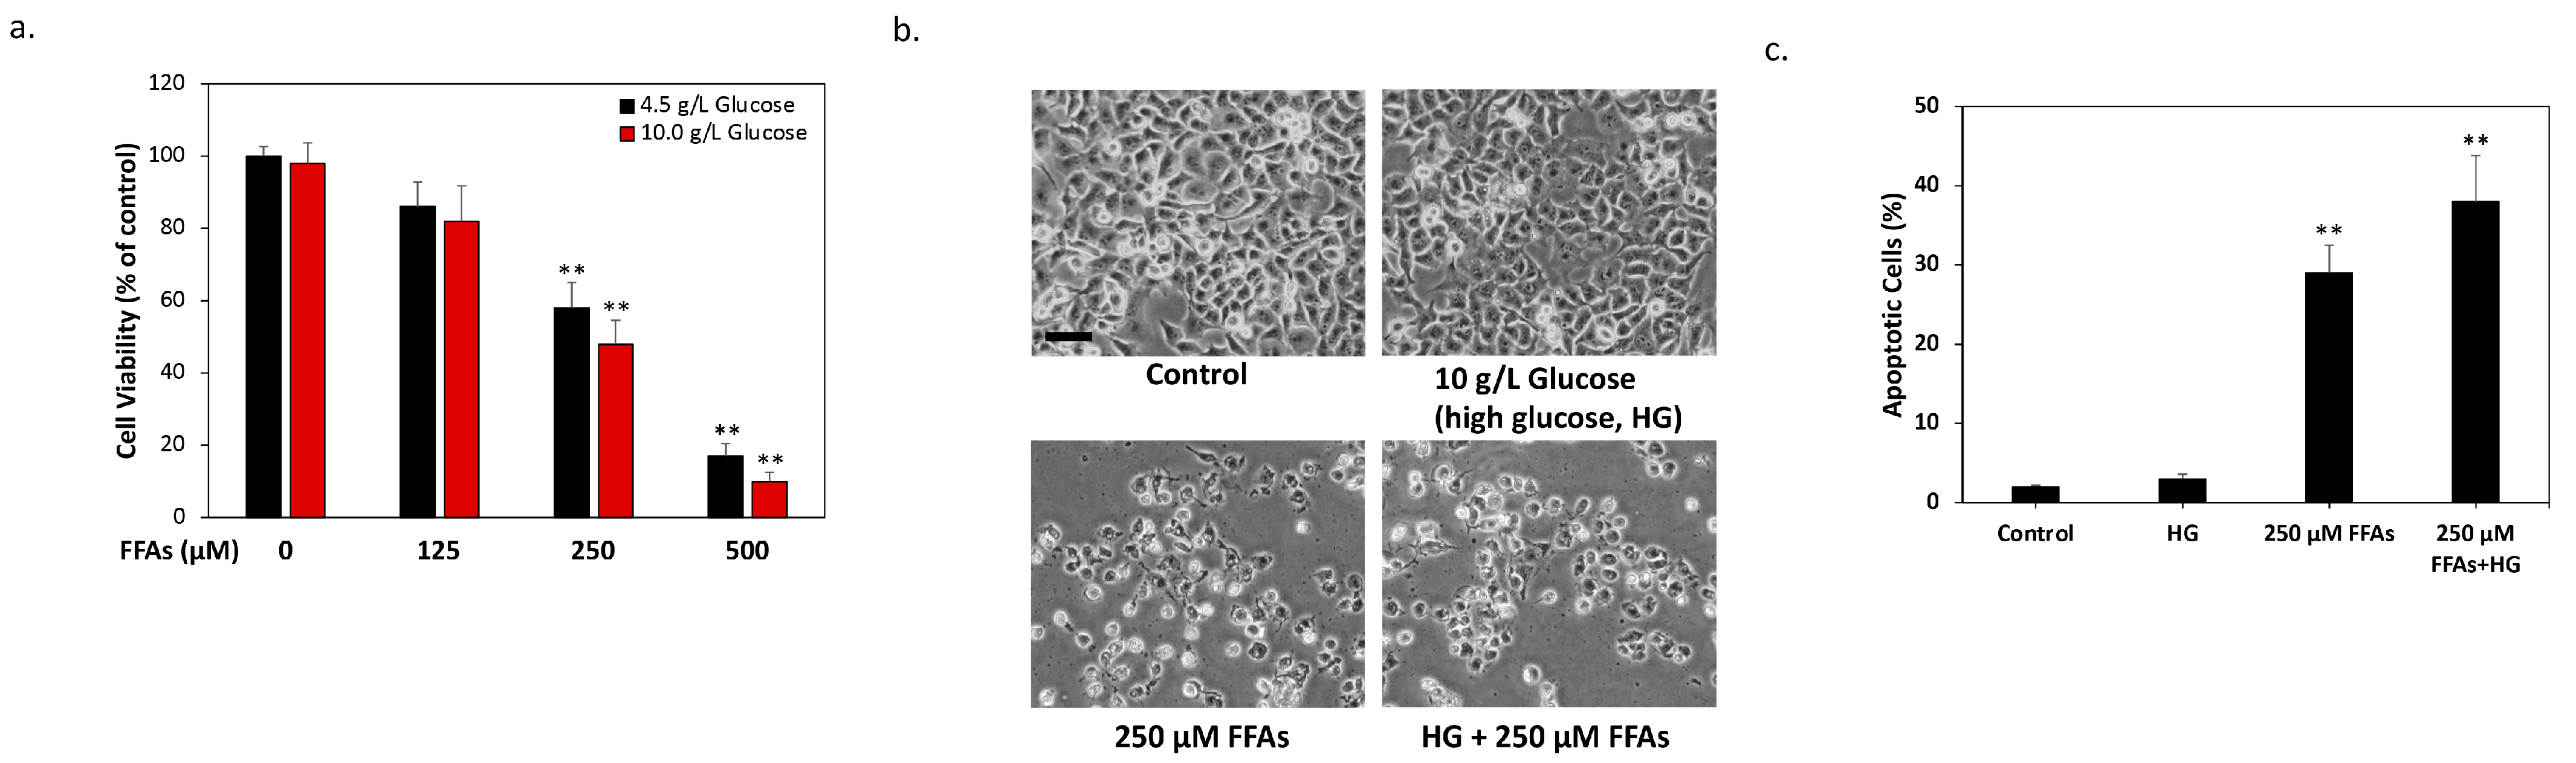
2.1. High Glucose and High FFA Levels Significantly Induce Glucolipotoxicity in 1.4 × 10⁷ Human Pancreatic β-Cells
2.2. DMB Attenuates Glucolipotoxicity-Induced Apoptosis of 1.4 × 10⁷ β-Cells
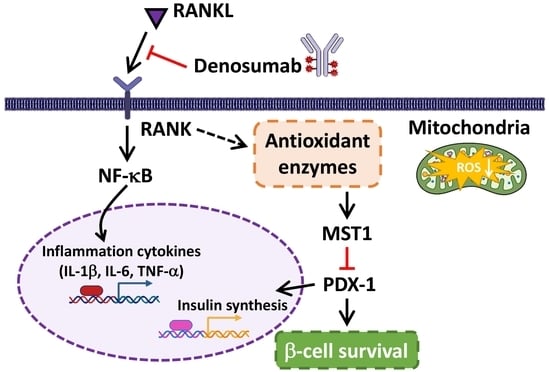
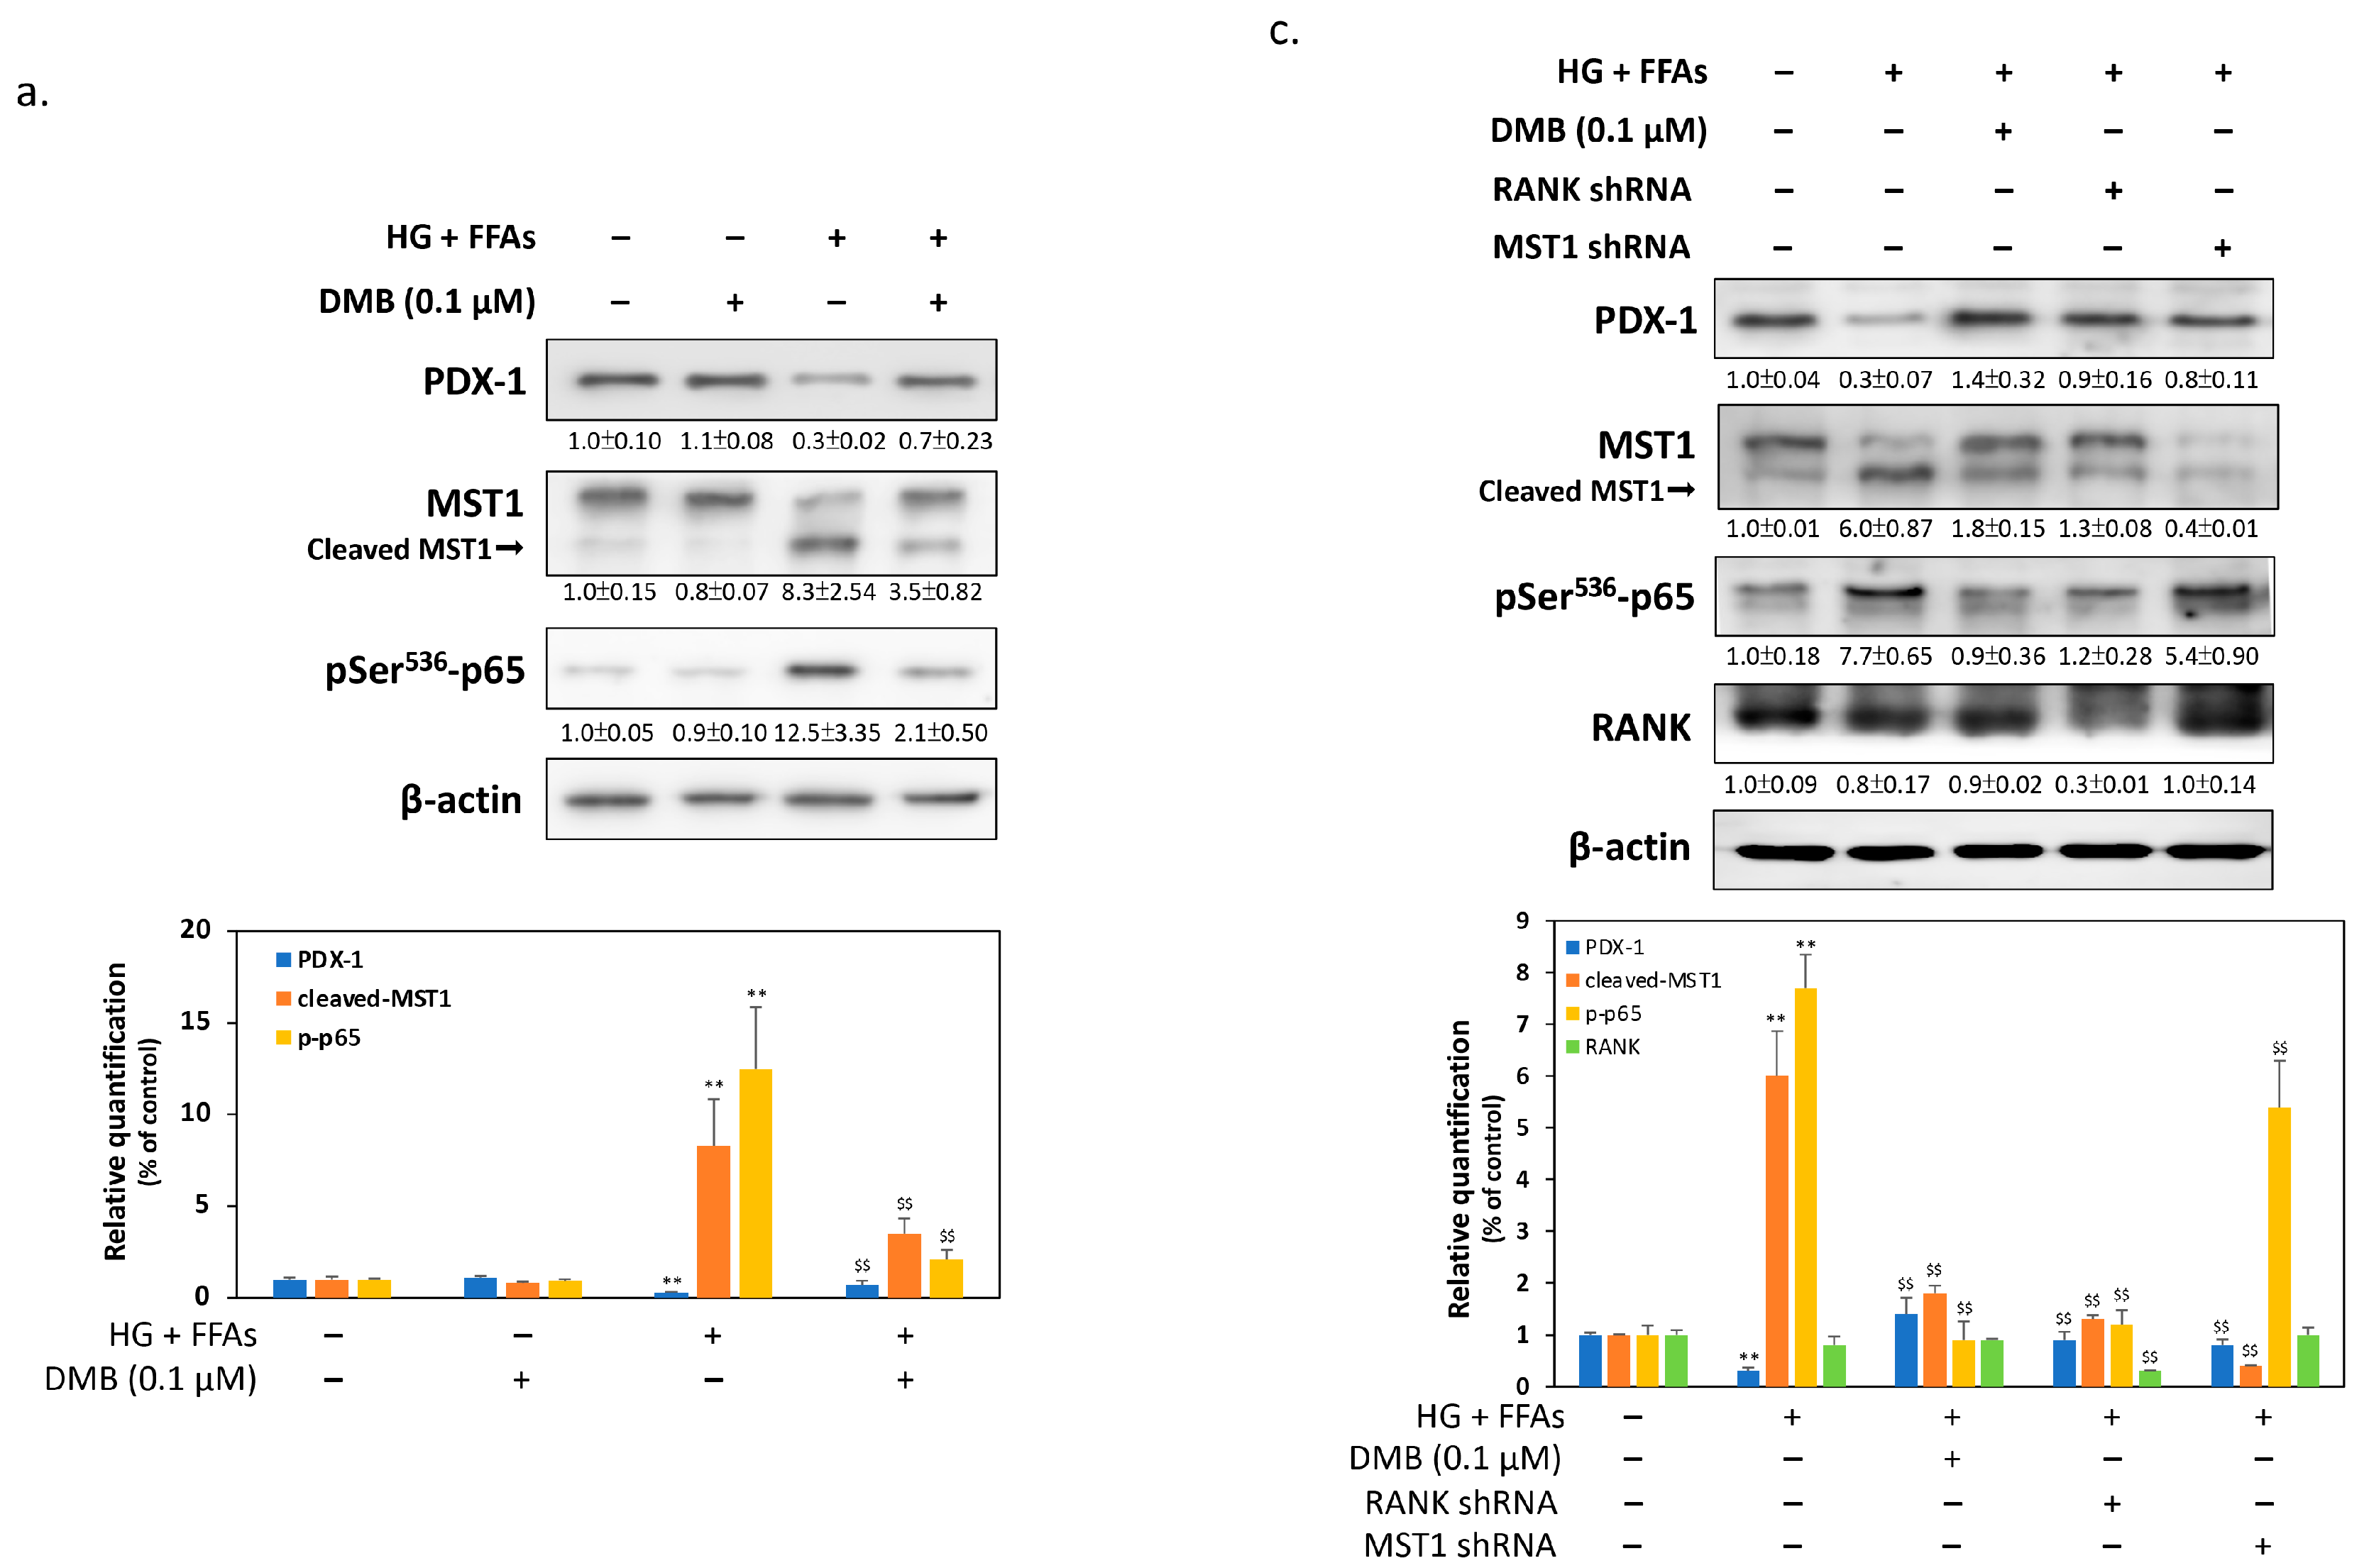
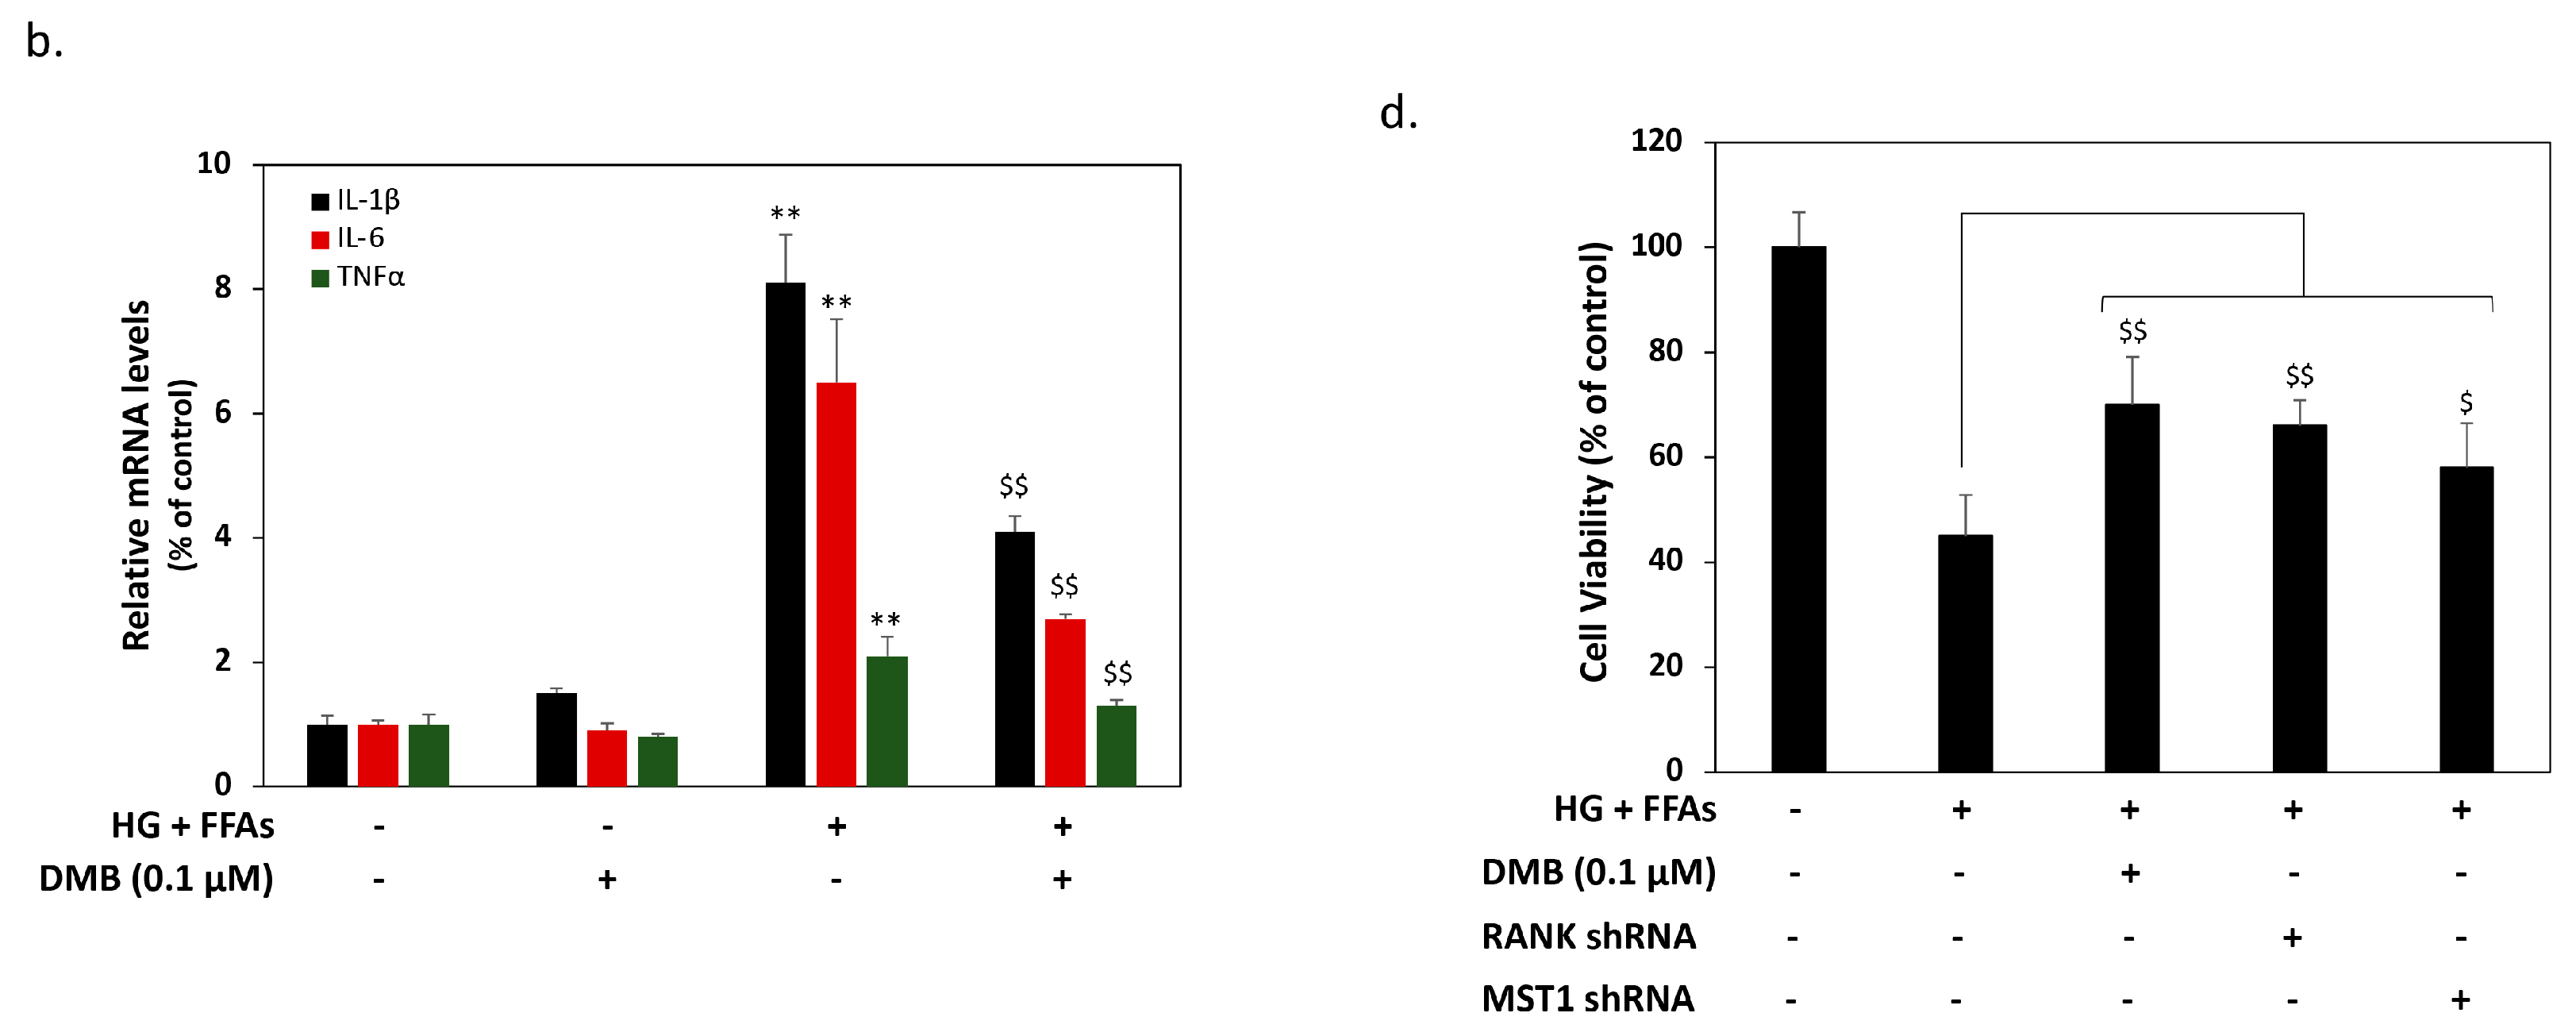
2.3. DMB Reduces MST1 Activation by Suppressing RANKL/RANK Signals in 1.4 × 10⁷ β-Cells
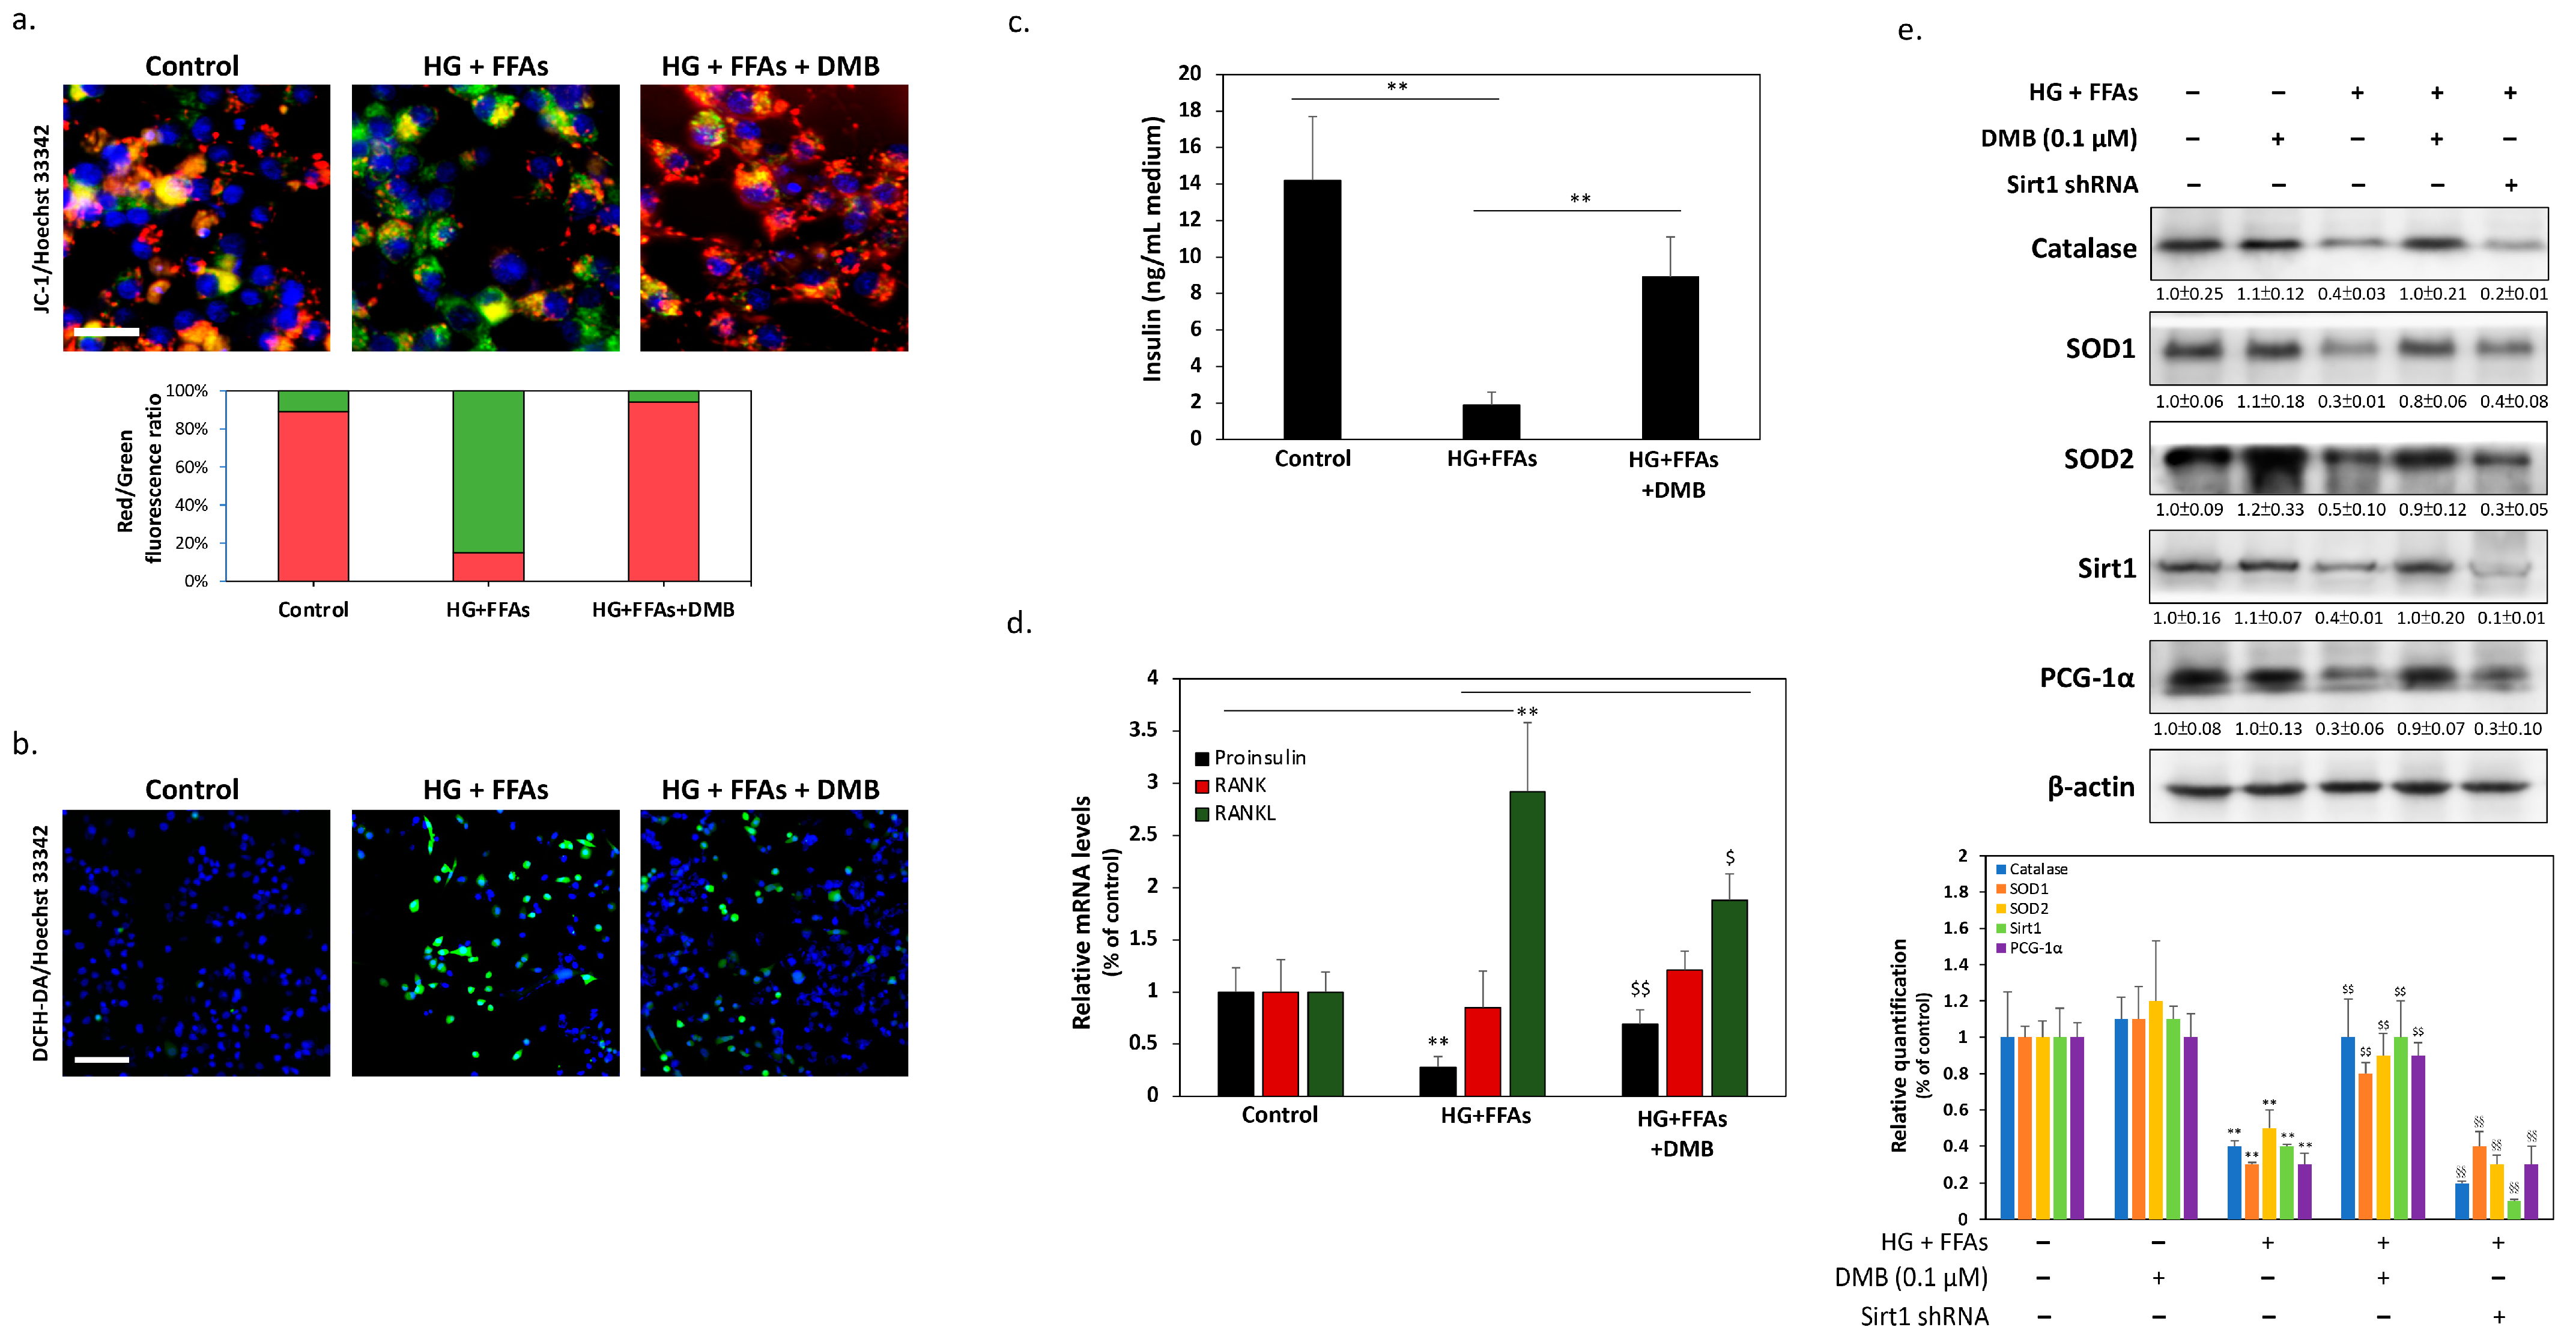
2.4. DMB Protects β-Cells against Glucolipotoxicity by Preserving Mitochondrial Function and Insulin Production/Secretion
3. Discussion
4. Materials and Methods
4.1. Materials
4.2. Cell Culture and Viability Assay
4.3. Acridine Orange (AO)/Propidium Iodide (PI) Assay
4.4. TUNEL Assays
4.5. Western Blot Analysis
4.6. mRNA Expression Analysis Using Reverse-Transcription Quantitative PCR (qPCR)
4.7. Analysis of the Mitochondrial Membrane Potential
4.8. Measurement of Reactive Oxygen Species (ROS)
4.9. ELISA Measurements of TNFα, IL-6, and IL-1β Content
4.10. Statistical Analysis
Author Contributions
Funding
Institutional Review Board Statement
Informed Consent Statement
Data Availability Statement
Conflicts of Interest
References
- Henderson, G.C. Plasma Free Fatty Acid Concentration as a Modifiable Risk Factor for Metabolic Disease. Nutrients 2021, 13, 2590. [Google Scholar] [CrossRef] [PubMed]
- You, S.; Zheng, J.; Chen, Y.; Huang, H. Research progress on the mechanism of beta-cell apoptosis in type 2 diabetes mellitus. Front. Endocrinol. 2022, 13, 976465. [Google Scholar] [CrossRef] [PubMed]
- Cerf, M.E. Beta Cell Physiological Dynamics and Dysfunctional Transitions in Response to Islet Inflammation in Obesity and Diabetes. Metabolites 2020, 10, 452. [Google Scholar] [CrossRef]
- Abe, I.; Ochi, K.; Takashi, Y.; Yamao, Y.; Ohishi, H.; Fujii, H.; Minezaki, M.; Sugimoto, K.; Kudo, T.; Abe, M.; et al. Effect of denosumab, a human monoclonal antibody of receptor activator of nuclear factor kappa-B ligand (RANKL), upon glycemic and metabolic parameters: Effect of denosumab on glycemic parameters. Medicine 2019, 98, e18067. [Google Scholar] [CrossRef]
- Yasuda, H. Discovery of the RANKL/RANK/OPG system. J. Bone Min. Metab. 2021, 39, 2–11. [Google Scholar] [CrossRef]
- Wang, L.T.; Chen, L.R.; Chen, K.H. Hormone-Related and Drug-Induced Osteoporosis: A Cellular and Molecular Overview. Int. J. Mol. Sci. 2023, 24, 5814. [Google Scholar] [CrossRef]
- Romero-Díaz, C.; Duarte-Montero, D.; Gutiérrez-Romero, S.A.; Mendivil, C.O. Diabetes and Bone Fragility. Diabetes 2021, 12, 71–86. [Google Scholar] [CrossRef] [PubMed]
- Napoli, N.; Pannacciulli, N.; Vittinghoff, E.; Crittenden, D.; Yun, J.; Wang, A.; Wagman, R.; Schwartz, A.V. Effect of denosumab on fasting glucose in women with diabetes or prediabetes from the FREEDOM trial. Diabetes Metab. Res. Rev. 2018, 34, e2991. [Google Scholar] [CrossRef] [PubMed]
- Malle, E.K.; Zammit, N.W.; Walters, S.N.; Koay, Y.C.; Wu, J.; Tan, B.M.; Villanueva, J.E.; Brink, R.; Loudovaris, T.; Cantley, J.; et al. Nuclear factor κB-inducing kinase activation as a mechanism of pancreatic β cell failure in obesity. J. Exp. Med. 2015, 212, 1239–1254. [Google Scholar] [CrossRef]
- Kondegowda, N.G.; Fenutria, R.; Pollack, I.R.; Orthofer, M.; Garcia-Ocaña, A.; Penninger, J.M.; Vasavada, R.C. Osteoprotegerin and Denosumab Stimulate Human Beta Cell Proliferation through Inhibition of the Receptor Activator of NF-κB Ligand Pathway. Cell Metab. 2015, 22, 77–85. [Google Scholar] [CrossRef] [PubMed]
- Ebrahim, N.; Shakirova, K.; Dashinimaev, E. PDX1 is the cornerstone of pancreatic β-cell functions and identity. Front. Mol. Biosci. 2022, 9, 1091757. [Google Scholar] [CrossRef] [PubMed]
- Ardestani, A.; Maedler, K. MST1: A promising therapeutic target to restore functional beta cell mass in diabetes. Diabetologia 2016, 59, 1843–1849. [Google Scholar] [CrossRef]
- Yuan, Y.; Zhou, J.; Hu, R.; Zou, L.; Ji, L.; Jiang, G. Piperine protects against pancreatic β-cell dysfunction by alleviating macrophage inflammation in obese mice. Life Sci. 2021, 274, 119312. [Google Scholar] [CrossRef] [PubMed]
- Cui, J.; Zhou, Z.; Yang, H.; Jiao, F.; Li, N.; Gao, Y.; Wang, L.; Chen, J.; Quan, M. MST1 Suppresses Pancreatic Cancer Progression via ROS-Induced Pyroptosis. Mol. Cancer Res. 2019, 17, 1316–1325. [Google Scholar] [CrossRef]
- Kornelius, E.; Li, H.H.; Peng, C.H.; Yang, Y.S.; Chen, W.J.; Chang, Y.Z.; Bai, Y.C.; Liu, S.; Huang, C.N.; Lin, C.L. Liraglutide protects against glucolipotoxicity-induced RIN-m5F β-cell apoptosis through restoration of PDX1 expression. J. Cell Mol. Med. 2019, 23, 619–629. [Google Scholar] [CrossRef]
- Agidigbi, T.S.; Kim, C. Reactive Oxygen Species in Osteoclast Differentiation and Possible Pharmaceutical Targets of ROS-Mediated Osteoclast Diseases. Int. J. Mol. Sci. 2019, 20, 3576. [Google Scholar] [CrossRef] [PubMed]
- Takata, T.; Sakasai-Sakai, A.; Takeuchi, M. Intracellular Toxic Advanced Glycation End-Products in 1.4E7 Cell Line Induce Death with Reduction of Microtubule-Associated Protein 1 Light Chain 3 and p62. Nutrients 2022, 14, 332. [Google Scholar] [CrossRef]
- Weir, G.C. Glucolipotoxicity, β-Cells, and Diabetes: The Emperor Has No Clothes. Diabetes 2020, 69, 273–278. [Google Scholar] [CrossRef]
- Berbudi, A.; Rahmadika, N.; Tjahjadi, A.I.; Ruslami, R. Type 2 Diabetes and its Impact on the Immune System. Curr. Diabetes Rev. 2020, 16, 442–449. [Google Scholar] [CrossRef]
- Graves, D.T.; Ding, Z.; Yang, Y. The impact of diabetes on periodontal diseases. Periodontology 2020, 82, 214–224. [Google Scholar] [CrossRef]
- Bonnet, N.; Bourgoin, L.; Biver, E.; Douni, E.; Ferrari, S. RANKL inhibition improves muscle strength and insulin sensitivity and restores bone mass. J. Clin. Investig. 2019, 129, 3214–3223. [Google Scholar] [CrossRef]
- Eguchi, N.; Vaziri, N.D.; Dafoe, D.C.; Ichii, H. The Role of Oxidative Stress in Pancreatic β Cell Dysfunction in Diabetes. Int. J. Mol. Sci. 2021, 22, 1509. [Google Scholar] [CrossRef]
- Yamaguchi, Y.; Madhyastha, H.; Madhyastha, R.; Choijookhuu, N.; Hishikawa, Y.; Pengjam, Y.; Nakajima, Y.; Maruyama, M. Arsenic acid inhibits proliferation of skin fibroblasts, and increases cellular senescence through ROS mediated MST1-FOXO signaling pathway. J. Toxicol. Sci. 2016, 41, 105–113. [Google Scholar] [CrossRef] [PubMed]
- Shang, H.; VanDusseldorp, T.A.; Ma, R.; Zhao, Y.; Cholewa, J.; Zanchi, N.E.; Xia, Z. Role of MST1 in the regulation of autophagy and mitophagy: Implications for aging-related diseases. J. Physiol. Biochem. 2022, 78, 709–719. [Google Scholar] [CrossRef] [PubMed]
- Alcendor, R.R.; Gao, S.; Zhai, P.; Zablocki, D.; Holle, E.; Yu, X.; Tian, B.; Wagner, T.; Vatner, S.F.; Sadoshima, J. Sirt1 regulates aging and resistance to oxidative stress in the heart. Circ. Res. 2007, 100, 1512–1521. [Google Scholar] [CrossRef]
- Scuto, M.; Ontario, M.L.; Salinaro, A.T.; Caligiuri, I.; Rampulla, F.; Zimbone, V.; Modafferi, S.; Rizzolio, F.; Canzonieri, V.; Calabrese, E.J.; et al. Redox modulation by plant polyphenols targeting vitagenes for chemoprevention and therapy: Relevance to novel anti-cancer interventions and mini-brain organoid technology. Free Radic. Biol. Med. 2022, 179, 59–75. [Google Scholar] [CrossRef] [PubMed]
- Orhan, C.; Gencoglu, H.; Tuzcu, M.; Sahin, N.; Ojalvo, S.P.; Sylla, S.; Komorowski, J.R.; Sahin, K. Maca could improve endurance capacity possibly by increasing mitochondrial biogenesis pathways and antioxidant response in exercised rats. J. Food Biochem. 2022, 46, e14159. [Google Scholar] [CrossRef] [PubMed]
- Habibi, P.; Ahmadiasl, N.; Nourazarian, A.; Yousefi, H. Swimming exercise improves SIRT1, NF-κB, and IL-1β protein levels and pancreatic tissue injury in ovariectomized diabetic rats. Horm. Mol. Biol. Clin. Investig. 2022, 43, 345–352. [Google Scholar] [CrossRef]
- Pacheco-Soto, B.T.; Elguezabal-Rodelo, R.G.; Porchia, L.M.; Torres-Rasgado, E.; Pérez-Fuentes, R.; Gonzalez-Mejia, M.E. Denosumab improves glucose parameters in patients with impaired glucose tolerance: A systematic review and meta-analysis. J. Drug Assess. 2021, 10, 97–105. [Google Scholar] [CrossRef]
- Cohrs, C.M.; Panzer, J.K.; Drotar, D.M.; Enos, S.J.; Kipke, N.; Chen, C.; Bozsak, R.; Schöniger, E.; Ehehalt, F.; Distler, M.; et al. Dysfunction of Persisting β Cells Is a Key Feature of Early Type 2 Diabetes Pathogenesis. Cell Rep. 2020, 31, 107469. [Google Scholar] [CrossRef]


Disclaimer/Publisher’s Note: The statements, opinions and data contained in all publications are solely those of the individual author(s) and contributor(s) and not of MDPI and/or the editor(s). MDPI and/or the editor(s) disclaim responsibility for any injury to people or property resulting from any ideas, methods, instructions or products referred to in the content. |
© 2023 by the authors. Licensee MDPI, Basel, Switzerland. This article is an open access article distributed under the terms and conditions of the Creative Commons Attribution (CC BY) license (https://creativecommons.org/licenses/by/4.0/).
Share and Cite
Lin, S.-C.; Tsou, S.-H.; Kuo, C.-Y.; Chen, W.-L.; Wu, K.-W.; Lin, C.-L.; Huang, C.-N. Denosumab Attenuates Glucolipotoxicity-Induced β-Cell Dysfunction and Apoptosis by Attenuating RANK/RANKL Signals. Int. J. Mol. Sci. 2023, 24, 10289. https://doi.org/10.3390/ijms241210289
Lin S-C, Tsou S-H, Kuo C-Y, Chen W-L, Wu K-W, Lin C-L, Huang C-N. Denosumab Attenuates Glucolipotoxicity-Induced β-Cell Dysfunction and Apoptosis by Attenuating RANK/RANKL Signals. International Journal of Molecular Sciences. 2023; 24(12):10289. https://doi.org/10.3390/ijms241210289
Chicago/Turabian StyleLin, Sheng-Chieh, Sing-Hua Tsou, Chien-Yin Kuo, Wei-Liang Chen, Kuan-Wen Wu, Chih-Li Lin, and Chien-Ning Huang. 2023. "Denosumab Attenuates Glucolipotoxicity-Induced β-Cell Dysfunction and Apoptosis by Attenuating RANK/RANKL Signals" International Journal of Molecular Sciences 24, no. 12: 10289. https://doi.org/10.3390/ijms241210289
APA StyleLin, S.-C., Tsou, S.-H., Kuo, C.-Y., Chen, W.-L., Wu, K.-W., Lin, C.-L., & Huang, C.-N. (2023). Denosumab Attenuates Glucolipotoxicity-Induced β-Cell Dysfunction and Apoptosis by Attenuating RANK/RANKL Signals. International Journal of Molecular Sciences, 24(12), 10289. https://doi.org/10.3390/ijms241210289