Article

α-Tocotrienol and Redox-Silent Analogs of Vitamin E Enhances Bortezomib Sensitivity in Solid Cancer Cells through Modulation of NFE2L1

1
Laboratory of Molecular Bromacology, Graduate School of Sports Health, Toyo University, Akabane City 115-8650, Japan
2
Department of Food and Nutritional Sciences, Faculty of Food and Nutritional Sciences, Toyo University, Itakura 374-0193, Japan
3
Research Institute of Life Innovation, Toyo University, Akabane City 115-8650, Japan
*
Author to whom correspondence should be addressed.
Int. J. Mol. Sci. 2023, 24(11), 9382; https://doi.org/10.3390/ijms24119382
Submission received: 2 May 2023 / Revised: 23 May 2023 / Accepted: 24 May 2023 / Published: 27 May 2023

Abstract

:
Proteasome inhibitors (PIs) have emerged as an attractive novel cancer therapy. However, most solid cancers are seemingly resistant to PIs. The activation of transcription factor Nuclear factor erythroid 2 related factor-1 (NFE2L1) has been characterized as a potential resistance response to protect and restore proteasome activity in cancer cells. In this study, we demonstrated that α-Tocotrienol (T3) and redox-silent analogs of vitamin E (TOS, T3E) enhanced the sensitivity of bortezomib (BTZ), a proteasome inhibitor, in solid cancers through modulation of NFE2L1. In BTZ treatment, all of T3, TOS, and T3E inhibited an increase in the protein levels of NFE2L1, the expression levels of proteasome-related proteins, as well as the recovery of proteasome activity. Moreover, the combination of one of T3, TOS, or T3E and BTZ induced a significant decrease in cell viability in solid cancer cell lines. These findings suggested that the inactivation of NFE2L1 by T3, TOS, and T3E is essential to potentiate the cytotoxic effect of the proteasome inhibitor, BTZ, in solid cancers.

1. Introduction

A proteasome is an enzyme complex that plays a role in degrading specific proteins and unnecessary proteins in the cells [1]. Since cancer cells have high expression of proteasome component proteins and higher proteasome activity than normal cells, proteasome may be important for cancer survival and proliferation [2,3,4,5,6]. In accordance with this, proteasome inhibitors (PIs) are known to induce effective cell death and anti-proliferation effect in some cancer cells, with some PIs in use as anticancer drugs for blood cancers like multiple myeloma [7]. Furthermore, PIs are also expected to have therapeutic effects against solid cancers, and the efficacy of PIs in several solid cancers has been investigated. However, some clinical studies have concluded that PIs are ineffectual in the treatment of solid cancers, and it is regarded that solid cancers have PI resistance [8,9,10,11,12,13].
Recently, Nuclear factor erythroid 2-related factor-1 (NFE2L1) has been identified as a protein involved in PI resistance in cancer cells [14,15,16,17]. NFE2L1 is initially present on the endoplasmic reticulum membrane (~120 kDa), and it is released from the endoplasmic reticulum to the cytoplasm by NGLY1, p97 and Hrd1 [18,19,20]. When proteasome activity is sufficient, cytoplasmic NFE2L1 is generally degraded by the proteasome. However, when the functions of proteasomes are impaired, cytoplasmic NFE2L1 is stabilized and processed into a mature form (~110 kDa) by DDI2 [15,16]. Mature NFE2L1 translocates to the nucleus and induces the expression of proteasome-related genes [21]. They then ultimately recover proteasome activity. Given these facts, the finding of inhibitors of NFE2L1 may lead to improved sensitivity to PI in solid tumors. However, the screening for inhibitors of NFE2L1 has not progressed well.
Vitamin E is a kind of phytochemical that has a long-term historical relationship to cancer. While vitamin E is well regarded as useful for cancer prevention due to its antioxidant effect, tocotrienols, a member of the vitamin E family, and redox-silent analogs of vitamin E such as α-tocopheryl succinate (TOS) and 6-O-Carboxypropyl-alpha-tocotrienol (T3E) are also known to exhibit anticancer effects via inhibition of specific cancer-related molecules such as HIF, Src, and STAT3 [22,23,24,25,26,27]. Furthermore, previous studies have reported that γ-tocotrienol and T3E modulate the expression levels of some proteasome-component proteins regulated by NFE2L1 [28,29]. Therefore, vitamin E and its redox-silent analogs may affect NFE2L1.
In this study, we demonstrate that α-tocotrienol (T3), TOS, and T3E enhance sensitivity to bortezomib, a proteasome inhibitor, in solid cancer cells through modulating protein levels of NFE2L1.

2. Results

2.1. T3, TOS, and T3E Suppressed the Increase in Protein Levels of NFE2L1 Induced by Bortezomib Treatment

NFE2L1 is known to stabilize and translocate from cytoplasm to nucleus under proteasome inhibition [30]. First, we confirmed the protein levels of NFE2L1 in the cytoplasm and nucleus by immunoblotting. For solid cancer, we used the malignant pleural mesothelioma, H2452, due to its reported resistance to bortezomib [13,31]. As shown in Figure 1a, two bands were identified in the cytoplasmic fraction under bortezomib treatment, and the lower band was clearly identified in the nuclear fraction. Therefore, we assumed that the upper band is unprocessed NFE2L1 without transcriptional activity and the lower band is processed NFE2L1 with transcriptional activity.
Next, we used an immunoblot to evaluate the effect of TP (α-tocopherol), T3, TOS, and T3E on the protein levels of NFE2L1 under bortezomib treatment. As shown in Figure 1b, bortezomib alone demonstrated a significant increase in protein levels of unprocessed and processed NFE2L1 compared to the control group, while the combination group with bortezomib and T3, TOS, and T3E did not show this increase. Also, TOS, and T3E alone groups showed a trend toward a decrease in NFE2L1 protein level. These results suggest that T3, TOS, and T3E modulate protein levels of NFE2L1 under proteasome inhibition.

2.2. T3, TOS, and T3E Suppressed the Increase in Expression Levels of Proteasome-Related Proteins Induced by Bortezomib Treatment

It is known that the expression levels of proteasome-related proteins are increased by NFE2L1 under proteasome inhibition [14,32]. We also speculated that T3, TOS, and T3E might also moderate expression levels of proteasome-related proteins under proteasome inhibition. Consequently, we next evaluated the effects of TP, T3, TOS, and T3E on the expression levels of the proteasome-component proteins, PSMA7, PSMB7, and PSMC4, as well as POMP, a proteasome maturing protein, under bortezomib treatment by RT-PCR assay. As demonstrated in Figure 2a, the bortezomib alone group showed a significant increase in the mRNA expression levels of each protein compared to the control group, while the combination groups of bortezomib with T3, TOS, and T3E did not show as significant an increase as that in the bortezomib alone group. These results suggest that T3, TOS, and T3E modulate the expression levels of proteasome-related proteins under proteasome inhibition.

2.3. T3, TOS, and T3E Suppressed the Recovery of Proteasome Activity under and after Bortezomib Treatment

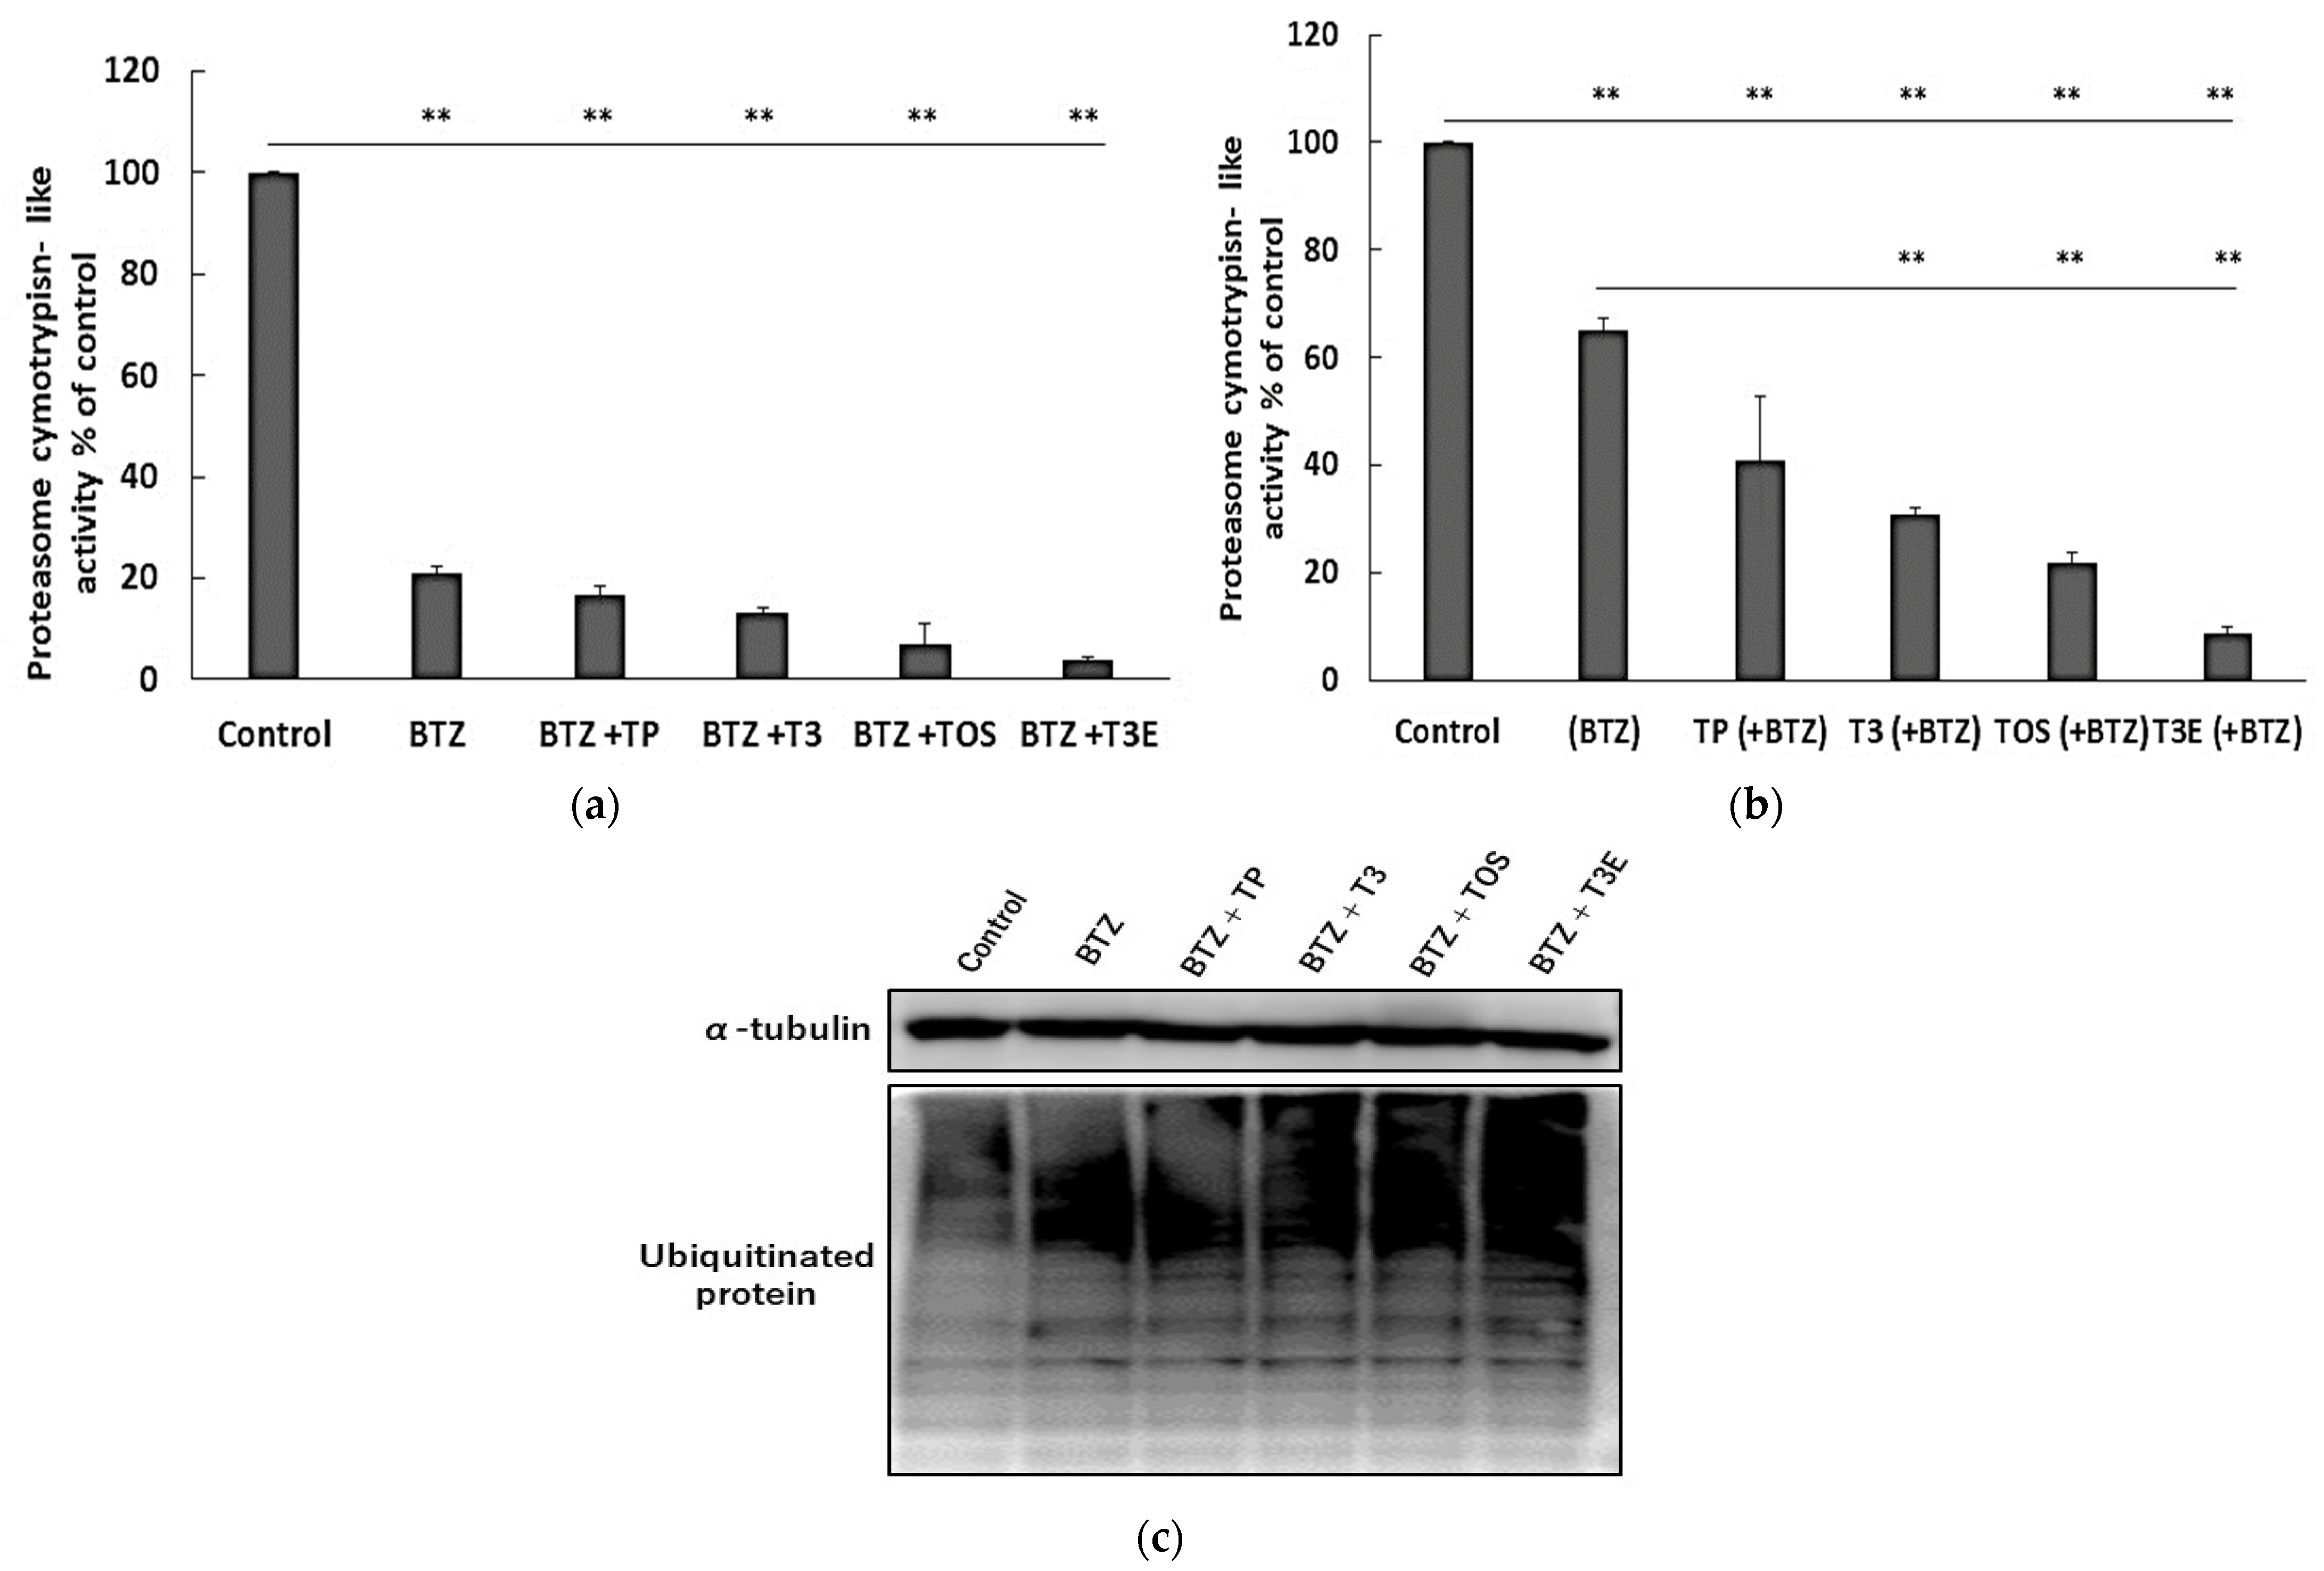
Under or following proteasome inhibition, NFE2L1 is known to recover proteasome activity [14]. We hypothesized that T3, TOS, and T3E might inhibit the recovery of proteasome activity under or after proteasome inhibition. Subsequently, we next evaluated the effects of TP, T3, TOS, and T3E on the recovery of proteasomal chymotrypsin-like activity undergoing and following bortezomib treatment. Proteasome activity was significantly reduced in all treatment groups compared to the control group (Figure 3a). After removing bortezomib from each treatment group, proteasome activity recovered to approximately 60% in the bortezomib alone group, whereas it was less than 40% in the combination groups with bortezomib and T3, TOS, T3E (Figure 3b).
Since ubiquitinated proteins are well known to accumulate under proteasome inhibition, T3, TOS, and T3E may enhance the accumulation of ubiquitinated proteins induced by PIs via inhibition of the recovery in proteasome activity. For this reason, we next evaluated the effect of the combination of bortezomib with TP, T3, TOS, and T3E on the accumulation of ubiquitinated protein by an immunoblot. As seen in Figure 3c, the combination groups with bortezomib and T3, TOS, and T3E showed a more remarkable accumulation of ubiquitinated protein compared to the bortezomib alone group. These results suggest that T3, TOS, and T3E inhibit the recovery of proteasome activity under and after proteasome inhibition.

2.4. T3, TOS, and T3E Enhanced Sensitivity to Bortezomib in H2452

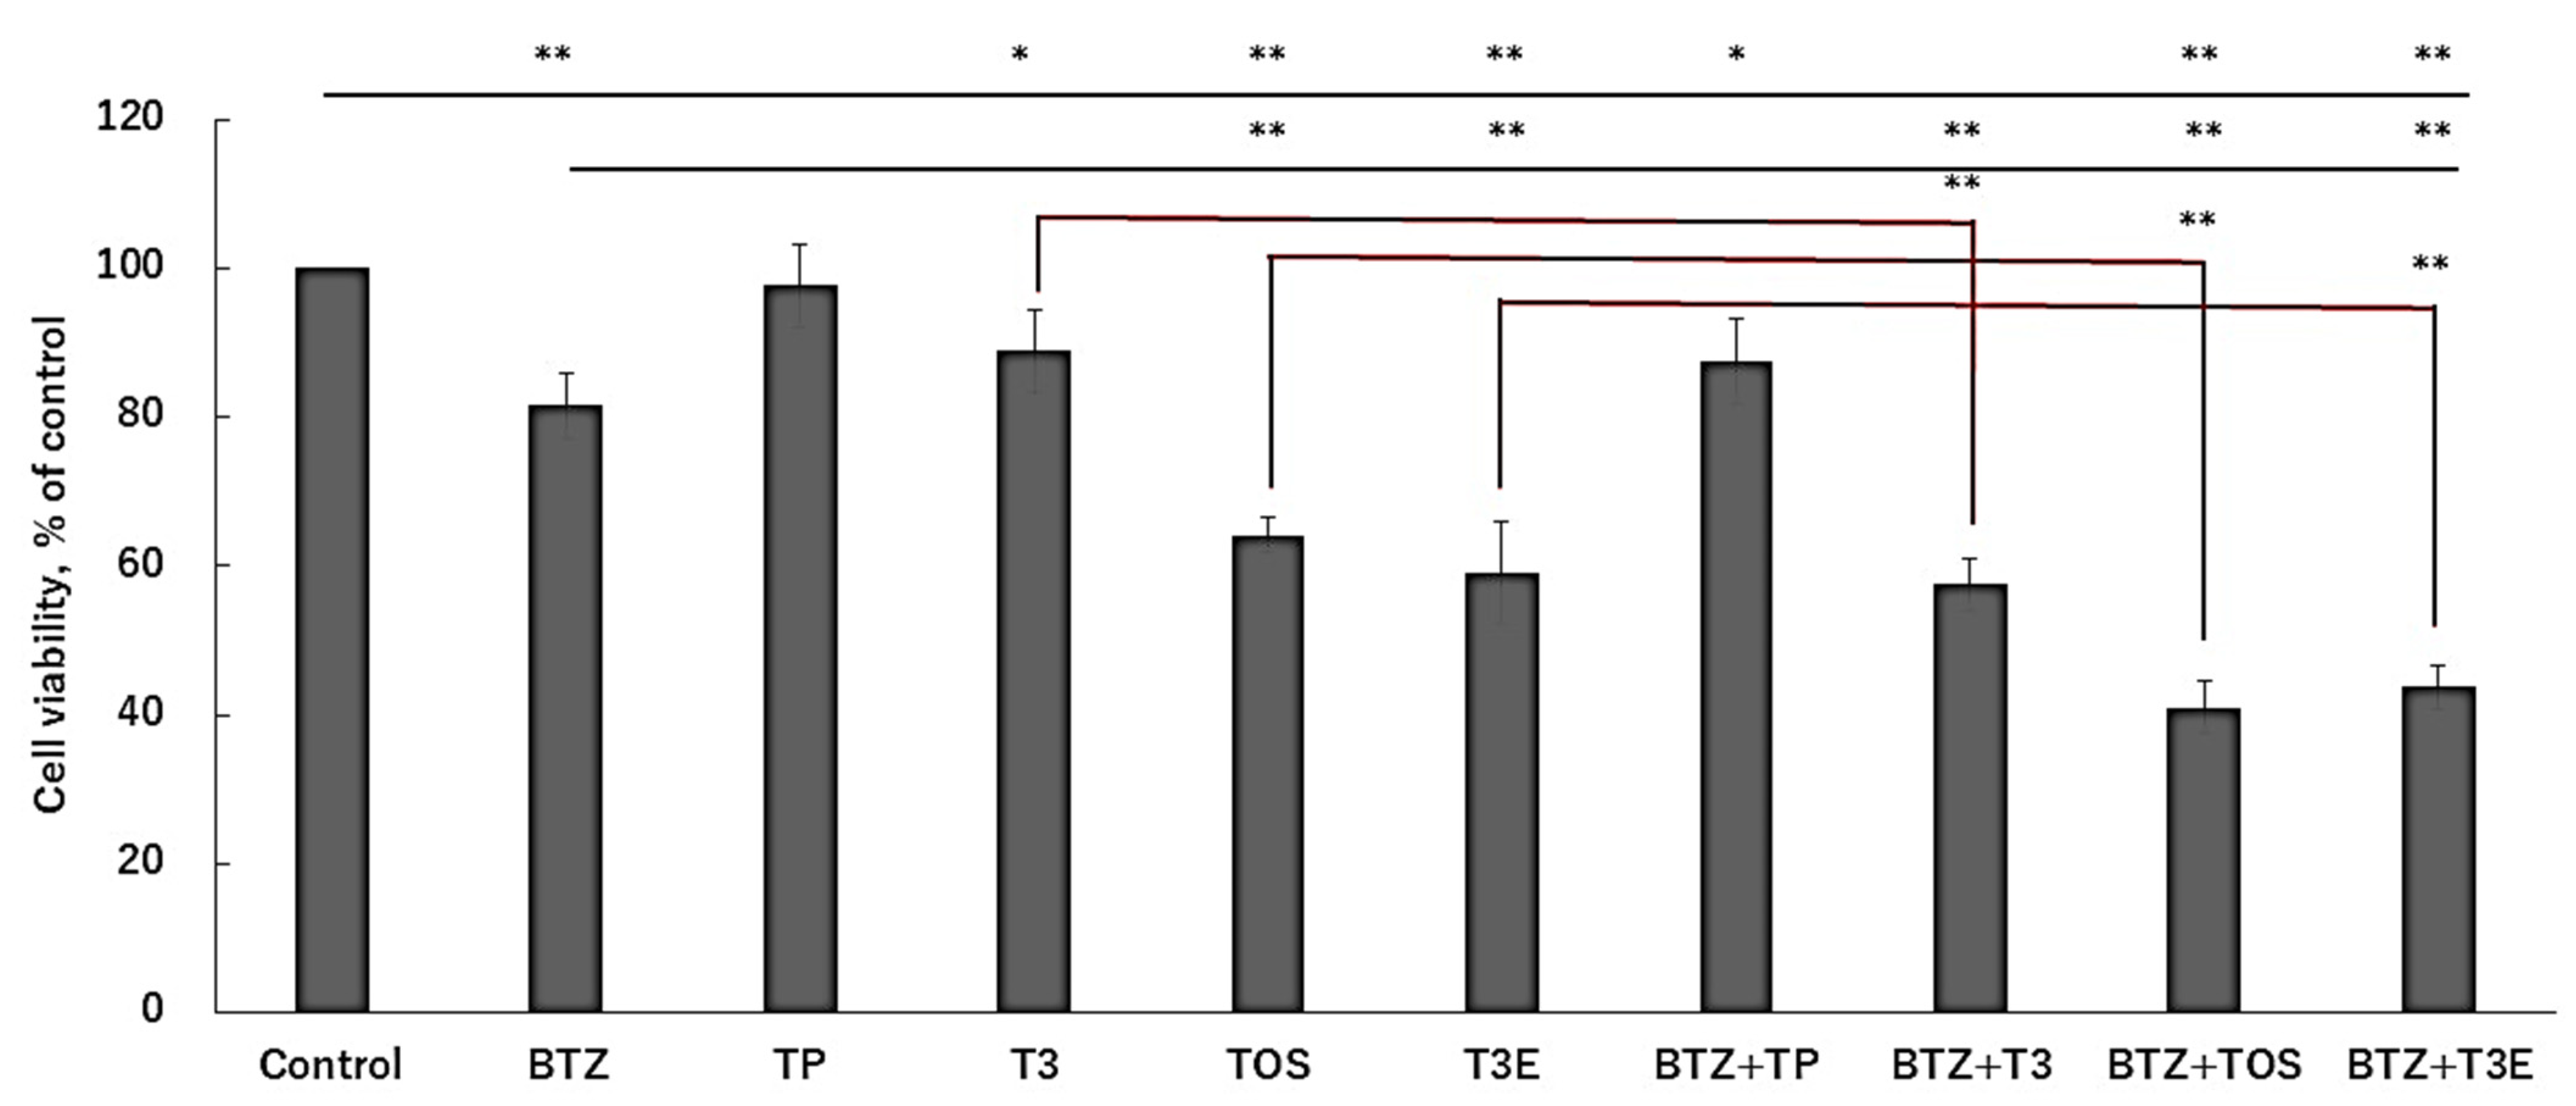
We next evaluated the effect of bortezomib in combination with TP, T3, TOS, and T3E on cell viability using a WST-8 assay. As shown in Figure 4, the combination groups with bortezomib and T3, TOS, and T3E showed a significant decrease in cell viability compared to the control group, bortezomib alone group, and respective alone groups, suggesting that T3, TOS, and T3E may enhance bortezomib sensitivity.

2.5. T3, TOS, and T3E Also Enhanced the Sensitivity to Bortezomib through Protein Levels of NFE2L1 and NRF3 in Other Solid Cancer Cell Lines

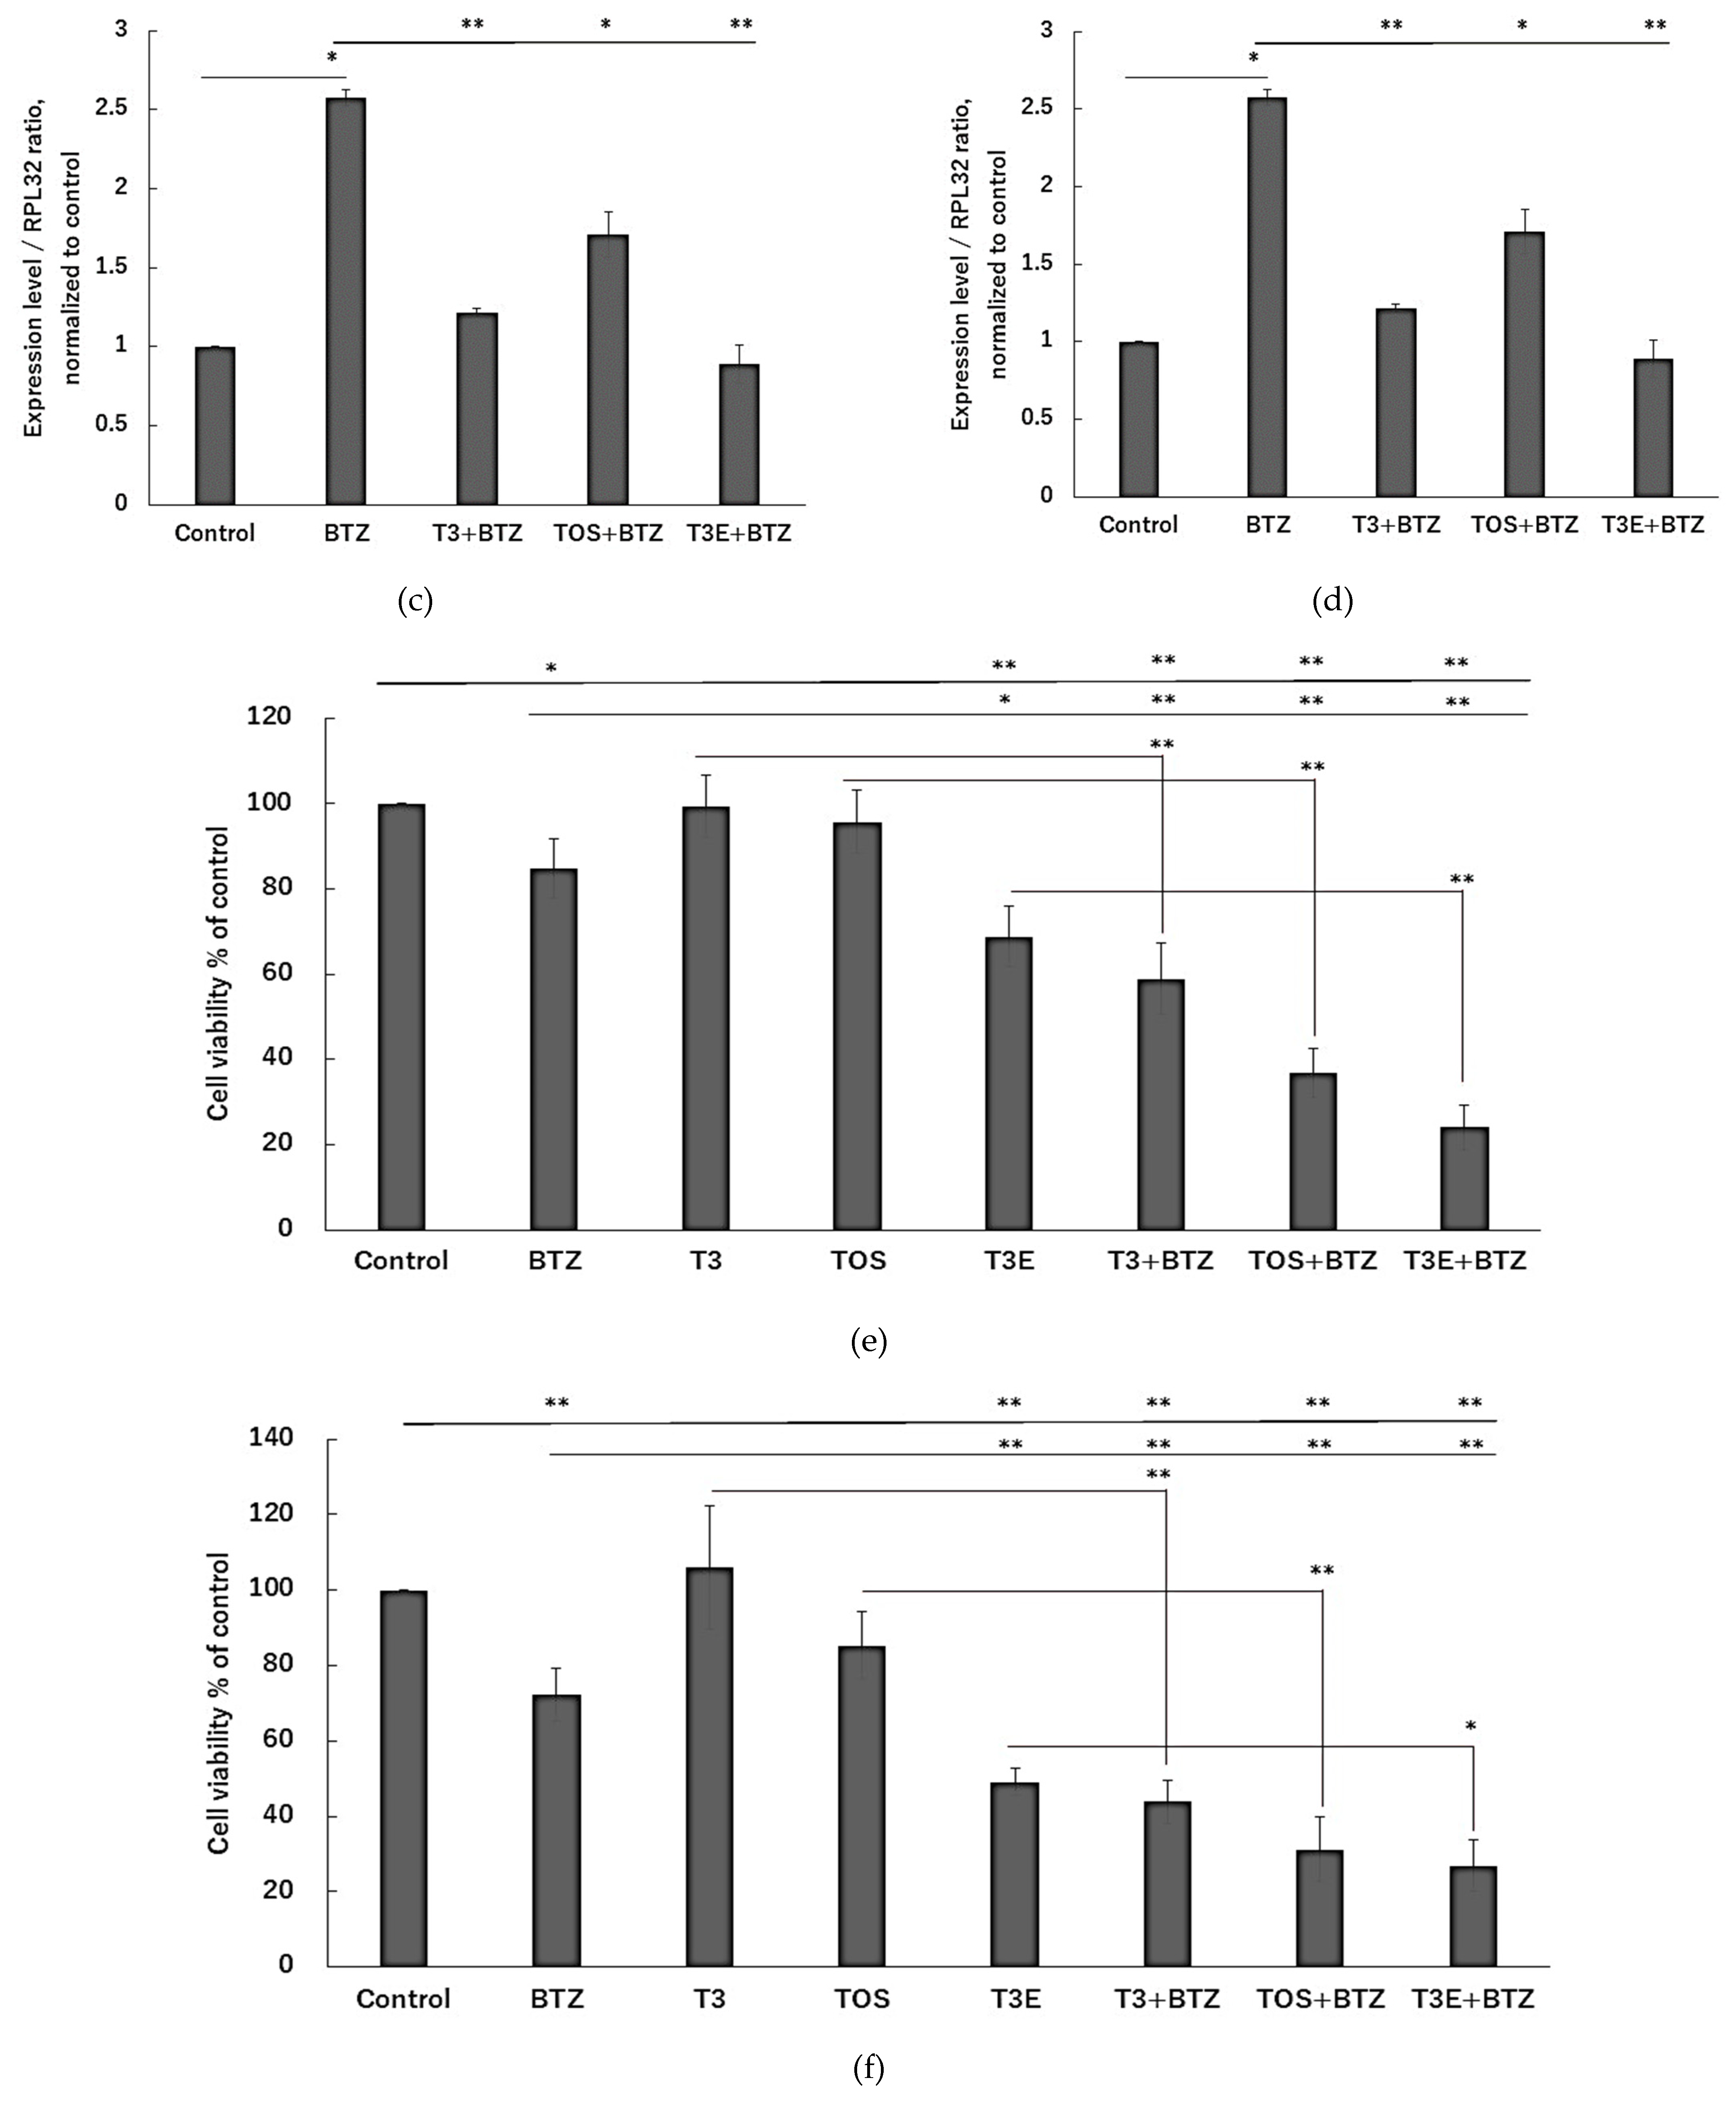
Based on our results, T3, TOS, and T3E may enhance the sensitivity to bortezomib in the H2452 cell line by modulating protein levels of NFE2L1. However, it is unclear whether the same effect can be achieved in other solid cancer cell lines. Therefore, we performed an evaluation of the effects of T3, TOS, and T3E on NFE2L1 and sensitivity to bortezomib in the lung adenocarcinoma cell line, A549, and the pancreatic cancer cell line, PANC1. As a result, the bortezomib alone group showed an increase in protein levels of unprocessed and processed NFE2L1 and mRNA expression levels of proteasome-related proteins compared to the control group, while the combination groups with bortezomib and T3, TOS, and T3E did not show a similar increasing tendency as bortezomib alone group in PANC1 and A549 (Figure 5a–d). In addition, the combination groups with bortezomib and T3, TOS, and T3E demonstrated a significant decrease in cell viability compared to the control group, bortezomib alone group, and the respective alone groups in PANC1 and A549 (Figure 5e,f). These results suggest that T3, TOS, and T3E may enhance the sensitivity to bortezomib in different types of solid cancers by modulating protein levels of NFE2L1.

2.6. Atorvastatin Did Not Affect NFE2L1 and NRF3 under Bortezomib Treatment

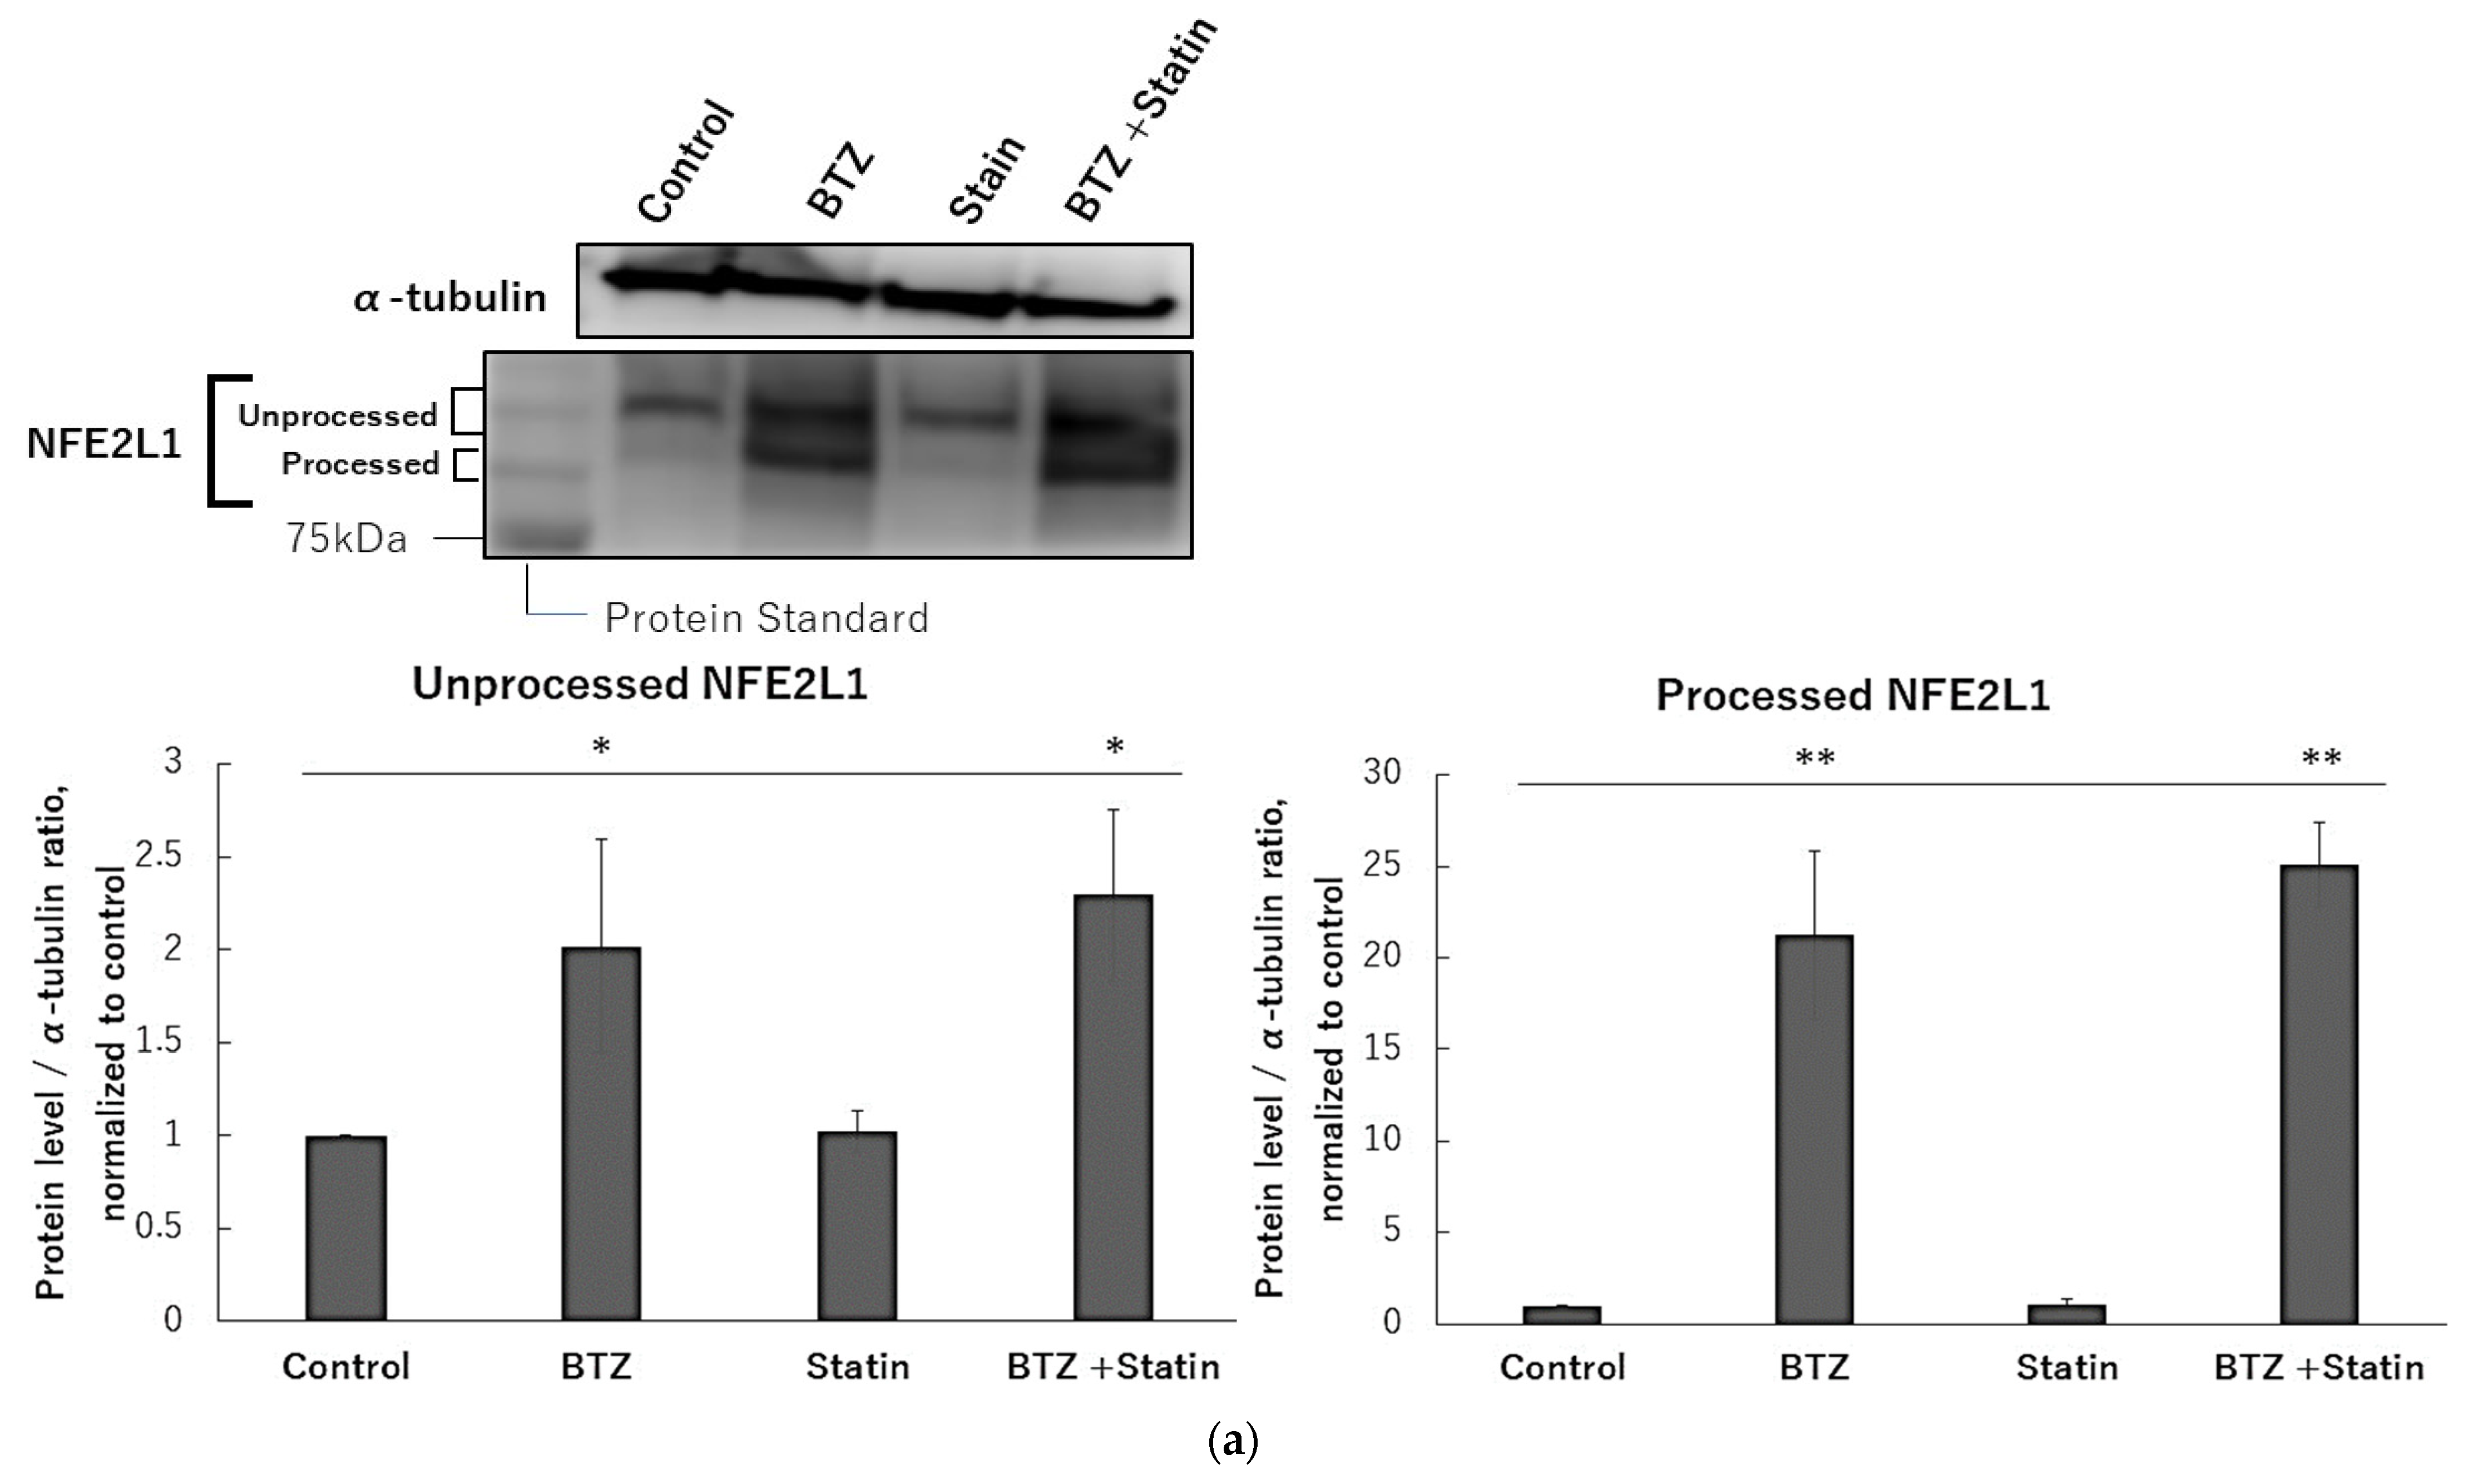
Vitamin E and its derivatives are well known to have a cholesterol-lowering effect. It also has been reported that NFE2L1 is involved in the regulation of cholesterol [33]. Based on these findings, we speculated that the cholesterol-lowering effect of T3, TOS, and T3E could moderate the protein levels of NFE2L1. Therefore, finally, we evaluated the effect of atorvastatin, a cholesterol-depleting agent, on NFE2L1 under bortezomib treatment. We observed no significant differences between the bortezomib alone group and the combination group with bortezomib and atorvastatin in protein levels of unprocessed and processed NFE2L1 (Figure 6a), mRNA expression levels of PSMB7 (Figure 6b) and the accumulation of ubiquitinated proteins (Figure 6c). These results suggest that the cholesterol-lowering effect does not affect NFE2L1 under proteasome inhibition.

3. Discussion

In this study, we initially examined the effects of TP, T3, TOS, and T3E on NFE2L1 and proteasome homeostasis under bortezomib treatment. We observed that T3, TOS, and T3E (but not TP) suppressed the increase in protein levels of NFE2L1, as well as the expression levels of transcriptional target genes such as proteasome-component proteins (PSMA7, PSMB7, and PSMC4) and proteasome maturation proteins (POMP). Furthermore, it was observed that T3, TOS, and T3E inhibited the recovery of proteasome activity under and after bortezomib treatment and that the combination with bortezomib and T3, TOS, and T3E significantly reduced cell viability compared to them alone.
Under proteasome inhibition, NFE2L1 is known to synthesize new proteasomes by promoting the transcription of proteasome-related genes to maintain proteasome homeostasis. It has been reported that their inhibition prevented recovery of proteasome activity during proteasome inhibition and greatly enhanced the sensitivity to proteasome inhibitors in solid tumor cells such as breast cancer [14]. Since similar events to these reports were observed in the present study, T3, TOS, and T3E may also enhance sensitivity to bortezomib in solid cancer cells by targeting NFE2L1 under proteasome inhibition. This suggests that T3, TOS, and T3E may be candidate adjunctive agents for solid cancer treatment with bortezomib. On the other hand, NFE2L2 and NFE2L3, which is a transcription factor belonging to the leucine zipper family like NFE2L1, has also been reported to be involved in the recovery of proteasome activity under proteasome inhibition [5,14,34,35]. Since T3, TOS, and T3E strongly inhibited the recovery of proteasome activity, they may also affect NFE2L2 and NFE2L3. However, further studies are needed to clarify the effects of T3, TOS, and T3E on NFE2L2 and NFE2L3. We also observed the NFE2L1 inhibitory effects in T3, TOS, and T3E but not in TP. When comparing TP and T3, it is known that T3 is more readily taken up in cells than TP due to the presence of a double bond in the side chain [36,37]. Therefore, T3 may have a more immediate and full effect on NFE2L1 in comparison to TP. Additionally, TOS and T3E are derivatives that block the antioxidant group in vitamin E and are not consumed as antioxidants like TP and T3. Therefore, TOS and T3E may show stronger inhibitory effects on NFE2L1 than TP.
This study revealed that TOS and T3E, which are vitamin E derivatives with blocked antioxidant groups, also exerted inhibitory effects on NFE2L1, while atorvastatin, a cholesterol-lowering agent, did not exert inhibitory effects on NFE2L1. This suggests that T3, TOS, and T3E may exert inhibitory effects on NFE2L1 without implicating the antioxidant and cholesterol-lowering effects that have been identified in vitamin E. However, in this study, we did not confirm the effects of T3, TOS, and T3E on proteins such as NGLY, p97 and Hrd1, which are involved in the release of NFE2L1 from the endoplasmic reticulum into the cytoplasm, and additional investigations are needed to elucidate the mechanism of NFE2L1 inhibition by T3, TOS, and T3E.
DDI2 is a molecule which involve in the maturation of NFE2L1, and its inhibition suppress the function of NFE2L1 [15,16,38]. In the present study, we found that T3, TOS, and T3E suppressed the increase in protein levels of NFE2L1 under proteasome inhibition without affecting the protein level of DDI2 (Figure S1), suggesting that they are a new type of NFE2L1 inhibitor. Additionally, T3, TOS, and T3E may also affect molecules involved in NFE2L1 protein regulation, which suggests that T3, TOS, and T3E may be good tools for investigating NFE2L1 regulation.

4. Materials and Methods

4.1. Reagents

All cultures and chemicals were purchased from Nacalai Tesque (Kyoto, Japan) unless otherwise indicated. Fetal bovine serum (FBS) was purchased from Bio West (Nuaillé, France). Bortezomib (a protease inhibitor) was obtained from Wako Chemicals (Osaka, Japan). TP and TOS were purchased from Sigma Aldrich (St. Louis, MO, USA), and T3 was purchased from Tama Biochemicals (Tokyo, Japan). Antibodies for NFE2L1 (#8052), ubiquitin (#3936) and Lamin B1 (#13435) were purchased from Cell Signaling Technology (Beverly, MA, USA). DDI2 antibody (sc-514004) is purchased from Santa Cruz Biotechnology (Dallas, TX, USA).

4.2. α-T3E Synthesis

α-T3E was synthesized from T3 according to a previously reported procedure [39]. The purity of α-T3E was confirmed by GC–MS, 1H NMR, 13C NMR, and IR. NMR and IR spectra were consistent with the structure of α-T3E. 1H NMR (CDCl3) spectrum: 1.27 (3H, s), 1.59 (9H, s), 1.67 (3H, s), 2.00 (3H, s), 2.09 (3H, s), 2.12 (3H, s), 1.70–2.15 (16H, m), 2.57 (2H, t, J = 7.8 Hz), 2.65 (2H, t, J = 6.5 Hz), 3.68 (2H, t, J = 7.7 Hz), 4.95–5.25 (3H, m), 8.5 (1H, broad). IR (KBr) spectrum: 3200–3400 cm−1 (carboxylic OH) and 1710 cm−1 (C6=O).

4.3. Cell Culture

H2452, PANC1, and A549 cells were purchased for ATCC (Manassas, VA, USA). PANC1 and A549 were routinely grown in RPMI1640 supplemented with 10% FBS, 50 IU/mL penicillin, and 50 μg/mL streptomycin, and H2452 cells were routinely grown in RPMI1640 supplemented with 10% FBS, 6.5 mg/mL glucose, 1 mM sodium pyruvate, 10 mM HEPES, 50 IU/mL penicillin, and 50 μg/mL streptomycin at 37 °C in a humidified atmosphere with 5% CO2. Exponentially growing cells were used in experiments. Cells were plated on culture plates and cultured for 24 h to permit adherence. Cells were then cultured in RPMI1640 supplemented with 2% FBS for the indicated period, and each parameter was then examined.

4.4. Reagent Dissolution

TP, T3, TOS, and T3E were dissolved using ethanol. Bortezomib was dissolved with ethanol and sonication. Also, ethanol was added to the control group in each assay.

4.5. Cellular Fractionation

H2452 cells were cultured at a density of 1 × 10⁶ cells in a 10 cm dish for 24 h and were then treated with each agent for 12 h. After the treatment, cells were collected and fractionated into cytoplasm and nucleus fractions using NE-PER™ nuclear and cytoplasmic extract reagent kit (Thermo Fisher Scientific, Waltham, MA, USA).

4.6. Cell Viability

The WST-8 assay was performed to evaluate the effects of each reagent on the viability of H2452, PANC1, and A549. Cells were seeded on a 96-well plate (5 × 10³ cells/well), cultured for 24 h, and subsequently treated with each reagent for the indicated period as described in each figure legend. After each treatment, 10 μL of WST-8 solution was applied to each well containing 100 μL of the cell suspension and incubated at 37 °C for a further 30 min in 5% CO2. Color development was monitored at 450 nm using a multi-well plate reader (SUNRISE Rainbow RC-R, Tecan Japan, Kanagawa, Japan).

4.7. Proteasome Activity

H2452 cells were seeded on a 96-well white plate (5 × 10³ cells/100 μL/well), cultured for 24 h, and subsequently treated with bortezomib 50 nM or bortezomib 50 nM +TP 20 µM, T3 20 µM, TOS 20 µM, T3E 20 µM for 6 h, and another 6 h except for bortezomib. After the treatment, to assess chymotrypsin-like activity in cells, 50 µL of Proteasome-Glo™ Chymotrypsin-Like Cell-Based Assay Reagent (Promega Japan, Tokyo, Japan) was added to each well, and the plate was then incubated at room temperature for 20 min. The chymotrypsin-like activity was assessed based on estimated chemiluminescence intensity using a luminometer (Infinite M1000 PRO, TECAN Japan).

4.8. Isolation of mRNA and Real-Time Quantitative PCR

H2452, PANC1, and A549 cells were cultured at a density of 5 × 10⁵ cells in a 60-mm dish for 24 h and were then treated with each agent for 12 to 24 h. After the treatment, cells were collected, and total RNA was isolated using the Tissue Total RNA Extraction Mini Kit (Favorgen Biotech Corp., Ping-Tung, Taiwan). Total RNA (300 ng for each sample) was used for cDNA synthesis with the ReverTra Ace qPCR RT Kit (Toyobo, Osaka, Japan). cDNA templates were analyzed by real-time PCR using Thermal Cycler Dice Real Time System Lite (TAKARA BIO INC., Shiga, Japan) and THUNDER-BIRD™ SYBR qPCR Mix (Toyobo, Osaka, Japan), with the following program: at 95°C for 10 s followed by 40 cycles at 95 °C for 15 s and at 60 °C for 1 min. Primer sets are shown in Table 1. Gene expression data were normalized to the expression of the reference gene ribosomal protein L32.

4.9. Immunoblotting

H2452, PANC1, and A549 cells were cultured at a density of 5 × 10⁵ cells in a 60-mm dish for 24 h and then treated with each agent for 12 to 24 h. After the treatment, cells were harvested and lysed in ice-cold Laemmli sample buffer (Bio-Rad, Berkeley, CA, USA) containing a protease inhibitor cocktail (Nakadai Tesque) and phosphatase inhibitor (Nacalai Tesque). Cells were incubated on ice for 20 min following centrifugation at 12,000 rpm at 4 °C for 10 min. Samples were electrophoresed through a 10% or 15% SDS–polyacrylamide gel and transferred to a polyvinylidene difluoride membrane using the iBlot 2 Dry Blotting System (Thermo Fisher Scientific, Waltham, MA, USA). Membranes were blocked with Blocking One P (Nacalai Tesque) for 1 h, incubated with primary antibodies for 1 h, and then incubated with the secondary antibody for 1 h. Detection was accomplished using Chemi-Lumi One Super (Nacalai Tesque) and C-DiGit (LI-COR, Lincoln, NE, USA). A densitometric analysis of each immune band was performed using Image Studio for C-DiGit (LI-COR). Molecular sizing was conducted using Protein Ladder One Plus, Triple-color for SDS-PAGE (Nacalai Tesque). Protein concentrations were assessed using the DC Protein Assay System (Bio-Rad).

4.10. Statistical Analysis

Differences among groups were analyzed by a one-way ANOVA followed by the Tukey test. All statistical analyses were performed using Ekuseru Toukei software ver 8.0 (Social Survey Research Information Co., Ltd., Tokyo, Japan). Differences with p-values of 0.05 or less were considered to be significant. All experiments were conducted with a minimum of three samples from three independent experiments, and data were expressed as means ± SD. The number of samples in each experiment is shown in the respective figure legends.

Supplementary Materials

The following supporting information can be downloaded at: https://www.mdpi.com/article/10.3390/ijms24119382/s1

Author Contributions

The contributions of individual authors to this manuscript are as follows: Conceptualization, T.Y.; performance of experiments, K.I., M.H. and M.S.; data analysis, K.I.; writing-draft, K.I., writing, K.I. and N.V.; supervision, T.Y. All authors have read and agreed to the published version of the manuscript.

Funding

Funding for this study was supported by the Inoue Enryou Memorial Foundation of Toyo University.

Institutional Review Board Statement

Not applicable.

Informed Consent Statement

Not applicable.

Data Availability Statement

All relevant data are within the manuscript.

Conflicts of Interest

The authors declare no conflict of interest.

References

  1. Shen, M.; Schmitt, S.; Buac, N.; Dou, P. Targeting the ubiquitin-proteasome system for cancer therapy. Expert Opin. Ther. Targets 2013, 17, 1091–1108. [Google Scholar] [CrossRef]
  2. Arlt, A.; Bauer, I.; Schafmayer, C.; Tepel, J.; Sebens, M.S.; Brosch, M.; Röder, C.; Kalthoff, H.; Hampe, J.; Moyer, M.P.; et al. Increased proteasome subunit protein expression and proteasome activity in colon cancer relate to an enhanced activation of nuclear factor E2-related factor 2 (NFE2L2). Oncogene 2009, 28, 3983–3996. [Google Scholar] [CrossRef]
  3. Chen, L.; Madura, K. Increased proteasome activity, ubiquitin-conjugating enzymes, and eEF1A translation factor detected in breast cancer tissue. Cancer Res. 2005, 65, 5599–5606. [Google Scholar] [CrossRef]
  4. Stoebner, P.-E.; Lavabre-Bertrand, T.; Henry, L.; Guiraud, I.; Carillo, S.; Dandurand, M.; Joujoux, J.-M.; Bureau, J.-P.; Meunier, L. High plasma proteasome levels are detected in patients with metastatic malignant melanoma. Br. J. Dermatol. 2005, 152, 948–953. [Google Scholar] [CrossRef] [PubMed]
  5. Walter, R.F.H.; Sydow, S.R.; Berg, E.; Kollmeier, J.; Christoph, D.C.; Christoph, S.; Eberhardt, W.E.E.; Mairinger, T.; Wohlschlaeger, J.; Schmid, K.W.; et al. Bortezomib sensitivity is tissue dependent and high expression of the 20S proteasome precludes good response in malignant pleural mesothelioma. Cancer Manag. Res. 2019, 11, 8711–8720. [Google Scholar] [CrossRef]
  6. Dutaud, D.; Aubry, L.; Henry, L.; Levieux, D.; Hendil, K.B.; Kuehn, L.; Bureau, J.P.; Ouali, A. Development and evaluation of a sandwich ELISA for quantification of the 20S proteasome in human plasma. J. Immunol. Methods 2002, 260, 183–193. [Google Scholar] [CrossRef]
  7. Fricker, D.L. Proteasome Inhibitor Drugs. Annu. Rev. Pharmacol. Toxicol. 2020, 60, 457–476. [Google Scholar] [CrossRef]
  8. Daniel, J.E. The ubiquitin-proteasome system: Opportunities for therapeutic intervention in solid tumors. Endocr. Relat. Cancer 2015, 22, T1. [Google Scholar]
  9. Roeten, M.S.F.; Cloos, J.; Jansen, G. Positioning of proteasome inhibitors in therapy of solid malignancies. Cancer Chemother. Pharmacol. 2018, 81, 227–243. [Google Scholar] [CrossRef] [PubMed]
  10. Hainsworth, J.D.; Meluch, A.A.; Spigel, D.R.; Barton, J.; Simons, L.; Meng, C.; Gould, B.; Greco, F.A. Weekly docetaxel and bortezomib as first-line treatment for patients with hormone-refractory prostate cancer: A Minnie Pearl Cancer Research Network phase II trial. Clin. Genitourin. Cancer 2007, 5, 278–283. [Google Scholar] [CrossRef] [PubMed]
  11. Wang, H.; Cao, Q.; Dudek, A.Z. Phase II study of panobinostat and bortezomib in patients with pancreatic cancer progressing on gemcitabine-based therapy. Anticancer. Res. 2012, 32, 1027–1031. [Google Scholar] [PubMed]
  12. Fanucchi, M.P.; Fossella, F.V.; Belt, R.; Natale, R.; Fidias, P.; Carbone, D.P.; Govindan, R.; Raez, L.E.; Robert, F.; Ribeiro, M.; et al. Randomized phase II study of bortezomib alone and bortezomib in combination with docetaxel in previously treated advanced non-small-cell lung cancer. J. Clin. Oncol. 2006, 24, 5025–5033. [Google Scholar] [CrossRef]
  13. Fennell, D.A.; McDowell, C.; Busacca, S.; Webb, G.; Moulton, B.; Cakana, A.; O’Byrne, K.J.; Meerbeeck, J.V.; Donnellan, P.; McCaffrey, J.; et al. Phase II clinical trial of first or second-line treatment with bortezomib in patients with malignant pleural mesothelioma. J. Thorac. Oncol. 2012, 7, 1466–1470. [Google Scholar] [CrossRef] [PubMed]
  14. Radhakrishnan, S.K.; Lee, C.S.; Young, P.; Beskow, A.; Chan, J.Y.; Deshaies, R.J. Transcription factor Nrf1 mediates the proteasome recovery pathway after proteasome inhibition in mammalian cells. Mol. Cell 2010, 38, 17–28. [Google Scholar] [CrossRef]
  15. Op, M.; Ribeiro, S.T.; Chavarria, C.; Gassart, A.D.; Zaffalon, L.; Martinon, F. The aspartyl protease DDI2 drives adaptation to proteasome inhibition in multiple myeloma. Cell Death Dis. 2022, 13, 475. [Google Scholar] [CrossRef]
  16. Chen, T.; Ho, M.; Briere, J.; Moscvin, M.; Czarnecki, P.G.; Anderson, K.C.; Blackwell, T.K.; Bianchi, G. Multiple myeloma cells depend on the DDI2/NRF1-mediated proteasome stress response for survival. Blood Adv. 2022, 6, 429–440. [Google Scholar] [CrossRef]
  17. Sekine, H.; Okazaki, K.; Kato, K.; Alam, M.M.; Shima, H.; Katsuoka, F.; Tsujita, T.; Suzuki, N.; Kobayashi, A.; Igarashi, K.; et al. O-GlcNAcylation Signal Mediates Proteasome Inhibitor Resistance in Cancer Cells by Stabilizing NRF1. Mol. Cell. Biol. 2018, 38, e00252-18. [Google Scholar] [CrossRef]
  18. Tomlin, F.M.; Gerling-Driessen, U.I.M.; Liu, Y.; Flynn, R.A.; Vangala, J.R.; Lentz, C.S.; Clauder-Muenster, S.; Jakob, P.; Mueller, W.F.; Ordoñez-Rueda, D.; et al. Inhibition of NGLY1 Inactivates the Transcription Factor Nrf1 and Potentiates Proteasome Inhibitor Cytotoxicity. ACS Cent. Sci. 2017, 3, 1143–1155. [Google Scholar] [CrossRef] [PubMed]
  19. Steffen, J.; Seeger, M.; Koch, A.; Krüger, E. Proteasomal degradation is transcriptionally controlled by TCF11 via an ERAD-dependent feedback loop. Mol. Cell 2010, 40, 147–158. [Google Scholar] [CrossRef]
  20. Radhakrishnan, S.K.; Besten, W.D.; Deshaies, R.J. p97-dependent retrotranslocation and proteolytic processing govern formation of active Nrf1 upon proteasome inhibition. elife 2014, 3, e01856. [Google Scholar] [CrossRef]
  21. Koizumi, S.; Hamazaki, J.; Murata, S. Transcriptional regulation of the 26S proteasome by Nrf1. Phys. Biol. Sci. 2018, 94, 325–336. [Google Scholar] [CrossRef]
  22. Abraham, A.; Kattoor, A.J.; Saldeen, T.; Mehta, J.L. Vitamin E and its anticancer effects. Crit. Rev. Food Sci. Nutr. 2019, 59, 2831–2838. [Google Scholar] [CrossRef]
  23. Kaneko, S.; Sato, C.; Shiozawa, N.; Sato, A.; Sato, H.; Virgona, N.; Yano, T. Suppressive Effect of Delta-Tocotrienol on Hypoxia Adaptation of Prostate Cancer Stem-like Cells. Anticancer. Res. 2018, 38, 1391–1399. [Google Scholar]
  24. Rajendran, P.; Li, F.; Manu, A.K.; Shanmugam, K.M.; Loo, Y.S.; Kumar, P.A.S. Gγ-Tocotrienol is a novel inhibitor of constitutive and inducible STAT3 signalling pathway in human hepatocellular carcinoma: Potential role as an antiproliferative, pro-apoptotic and chemosensitizing agent. Br. J. Pharmacol. 2011, 163, 283–298. [Google Scholar] [CrossRef]
  25. Savitskaya, M.A.; Onischenko, G.E. α-Tocopheryl Succinate Affects Malignant Cell Viability, Proliferation, and Differentiation. Biochemistry 2016, 81, 806–818. [Google Scholar] [CrossRef] [PubMed]
  26. Kashiwagi, K.; Virgona, N.; Harada, K.; Kido, W.; Yano, Y.; Ando, A.; Hagiwara, K.; Yano, T. A redox-silent analogue of tocotrienol acts as a potential cytotoxic agent against human mesothelioma cells. Life Sci. 2009, 84, 650–656. [Google Scholar] [CrossRef] [PubMed]
  27. Shiozawa, N.; Sugahara, R.; Namiki, K.; Sato, C.; Ando, A.; Sato, A.; Virgona, N.; Yano, T. Inhibitory effect of a redox-silent analogue of tocotrienol on hypoxia adaptation in prostate cancer cells. Anticancer. Drugs 2017, 28, 289–297. [Google Scholar] [CrossRef]
  28. Ramdas, P.; Radhakrishnan, A.K.; Sani, A.A.; Kumari, M.; Rao, J.S.; Rahman, P.S. Advancing the Role of Gamma-Tocotrienol as Proteasomes Inhibitor: A Quantitative Proteomic Analysis of MDA-MB-231 Human Breast Cancer Cells. Biomolecules 2019, 10, 19. [Google Scholar] [CrossRef]
  29. Ishii, K.; Fusegi, M.; Mori, T.; Teshima, K.; Ninomiya, N.; Kohno, K.; Sato, A.; Ishida, T.; Miyakoshi, Y.; Yano, T. A Redox-Silent Analogue of Tocotrienol May Break the Homeostasis of Proteasomes in Human Malignant Mesothelioma Cells by Inhibiting STAT3 and NRF1. Int. J. Mol. Sci. 2022, 23, 2655. [Google Scholar] [CrossRef] [PubMed]
  30. Nowak, K.; Taubert, R.M.; Haberecht, S.; Venz, S.; Krüger, E. Inhibition of calpain-1 stabilizes TCF11/Nrf1 but does not affect its activation in response to proteasome inhibition. Biosci. Rep. 2018, 38, BSR20180393. [Google Scholar] [CrossRef]
  31. Arlt, A.; Sebens, S.; Krebs, S.; Geismann, C.; Grossmann, M.; Kruse, M.L.; Schreiber, S.; Schäfer, H. Inhibition of the NRF2 transcription factor by the alkaloid trigonelline renders pancreatic cancer cells more susceptible to apoptosis through decreased proteasomal gene expression and proteasome activity. Oncogene 2013, 32, 4825–4835. [Google Scholar] [CrossRef]
  32. Waku, T.; Katayama, H.; Hiraoka, M.; Hatanaka, A.; Nakamura, N.; Tanaka, Y.; Tamura, N.; Watanabe, A.; Kobayashi, A. NFE2L1 and NFE2L3 Complementarily Maintain Basal Proteasome Activity in Cancer Cells through CPEB3-Mediated Translational Repression. Mol. Cell Biol. 2020, 40, e00010-20. [Google Scholar] [CrossRef]
  33. Widenmaier, B.S.; Snyder, A.N.; Nguyen, B.T.; Arduini, A.; Lee, Y.G.; Arruda, P.A.; Saksi, J.; Bartelt, A.; Hotamisligil, S.G. NRF1 Is an ER Membrane Sensor that Is Central to Cholesterol Homeostasis. Cell. 2017, 171, 1094–1109. [Google Scholar] [CrossRef] [PubMed]
  34. Chowdhury, A.M.; Katoh, H.; Hatanaka, A.; Iwanari, H.; Nakamura, N.; Hamakubo, T.; Natsume, T.; Waku, T.; Kobayashi, A. Multiple regulatory mechanisms of the biological function of NRF3 (NFE2L3) control cancer cell proliferation. Sci. Rep. 2017, 7, 12494. [Google Scholar] [CrossRef] [PubMed]
  35. Waku, T.; Nakamura, N.; Koji, M.; Watanabe, H.; Katoh, H.; Tatsumi, C.; Tamura, N.; Hatanaka, A.; Hirose, S.; Katayama, H.; et al. NRF3-POMP-20S Proteasome Assembly Axis Promotes Cancer Development via Ubiquitin-Independent Proteolysis of p53 and Retinoblastoma Protein. J. Mol. Cell Biol. 2020, 40, e00597-19. [Google Scholar] [CrossRef] [PubMed]
  36. Saito, Y.; Yoshida, Y.; Nishio, K.; Hayakawa, M.; Niki, E. Characterization of cellular uptake and distribution of vitamin E. Ann. N. Y. Acad. Sci. 2004, 1031, 368–375. [Google Scholar] [CrossRef]
  37. Irías-mata, A.; Sus, N.; Flory, S.; Stock, D.; Woerner, D.; Podszun, M.; Frank, J. α-tocopherol transfer protein does not regulate the cellular uptake and intracellular distribution of α- and γ-tocopherols and -tocotrienols in cultured liver cells. Redox Biol. 2018, 19, 28–36. [Google Scholar] [CrossRef]
  38. Fassmannová, D.; Sedlák, F.; Sedláček, J.; Špička, I.; Šašková, G.K. Nelfinavir Inhibits the TCF11/Nrf1-Mediated Proteasome Recovery Pathway in Multiple Myeloma. Cancers 2020, 12, 1065. [Google Scholar] [CrossRef]
  39. Yano, Y.; Satoh, H.; Fukumoto, K.; Kumadaki, I.; Ichikawa, T.; Yamada, K.; Hagiwara, K.; Yano, T. Induction of cytotoxicity in human lung adenocarcinoma cells by 6-O-carboxypropyl-alpha-tocotrienol, a redox-silent derivative of alpha-tocotrienol. Int. J. Cancer 2005, 115, 839–846. [Google Scholar] [CrossRef]
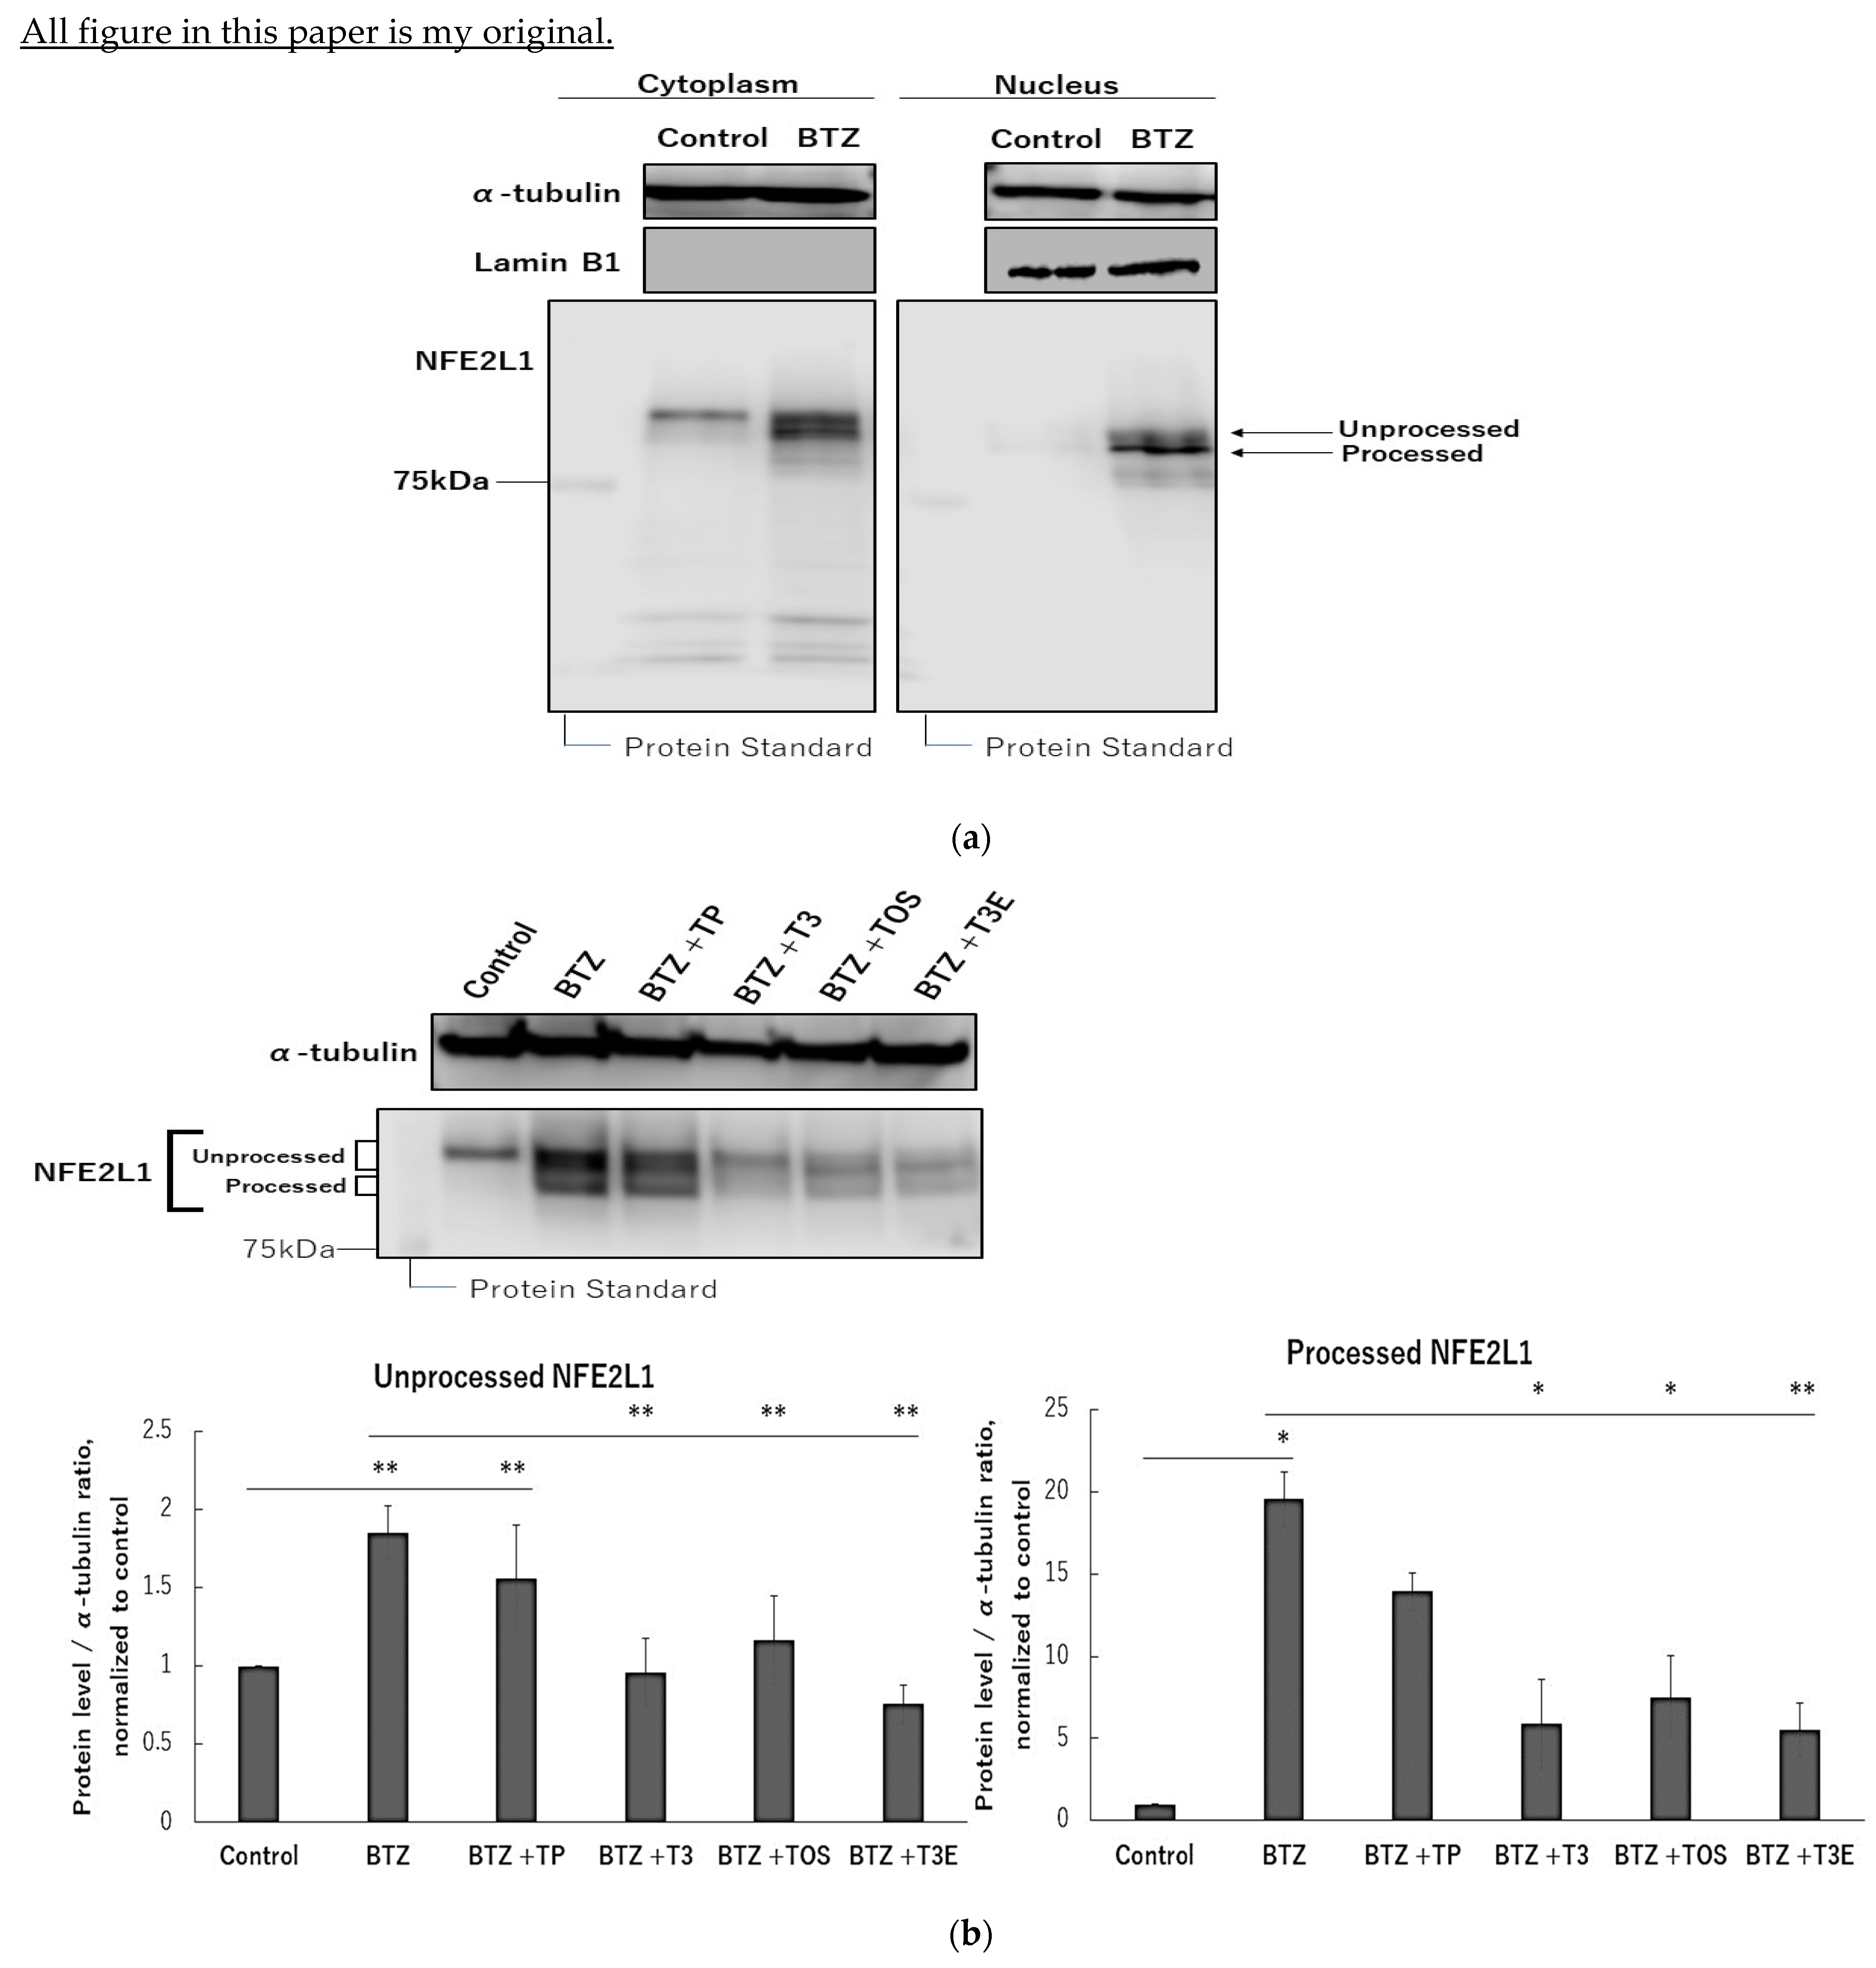
Figure 1. Effects of vitamin E on protein level of NFE2L1 in treatment of bortezomib. (a) H2452 cells were treated with bortezomib (50 nM) for 12 h and fractionated into cytoplasm and nucleus by NE-PER™ nuclear and cytoplasmic extract reagent kit. Protein levels in both fractions were assessed by immunoblotting. (b) H2452 cells were treated with bortezomib 50 nM or bortezomib 50 nM +TP 20 µM, T3 20 µM, TOS 20 µM, and T3E 20 µM for 12 h, and the protein levels were assessed of NFE2L1 by immunoblotting. α-Tubulin protein levels served as the loading control. A densitometric analysis was performed as described in the Materials and Methods section. Data are means ± SD, n = 3. * p < 0.05, ** p < 0.01 vs. as indicated. BTZ; bortezomib, TP; α-tocopherol, T3; α-tocotrienol, TOS; α-tocopheryl succinate, T3E; 6-O-Carboxypropyl-alpha-tocotrienol.
Ijms 24 09382 g001
Figure 2. Effects of vitamin E on mRNA level of proteasome related proteins in the treatment of bortezomib. H2452 cells were treated with bortezomib 50 nM or bortezomib 50 nM +TP 20 µM, T3 20 µM, TOS 20 µM, T3E 20 µM for 12 h, and the mRNA levels of PSMA7, PSMB7, PSMC4, and POMP were assessed by real-time quantitative PCR as described in the Materials and Methods section. RPL32 mRNA levels served as the loading control. Data are means ± SD, n = 3. ** p < 0.01 vs. as indicated. BTZ; bortezomib, TP; α-tocopherol, T3; α-tocotrienol, TOS; α-tocopheryl succinate, T3E; 6-O-Carboxypropyl-alpha-tocotrienol.
Ijms 24 09382 g002
Figure 3. Effects of vitamin E on proteasome activities in the treatment of bortezomib. H2452 cells were treated with bortezomib 50 NM or bortezomib 50 nM +TP 20 µM, T3 20 µM, TOS 20 µM, T3E 20 µM for 6 h (a), and another 6 h except for bortezomib (b). After the treatment, chymotrypsin-like activity was assessed by a chemiluminescent method, as described in the Materials and Methods section. Data are means ± SD, n = 3. ** p < 0.01 vs. as indicated. (c) H2452 cells were treated with bortezomib 50 nM or bortezomib 50 nM + TP 20 µM, T3 20 µM, TOS 20 µM, and T3E 20 µM for 12 h. After the treatment, ubiquitinated protein levels in each sample were assessed by immunoblotting. α-Tubulin protein levels served as the loading control. Results are representative of three independent experiments. BTZ; bortezomib, TP; α-tocopherol, T3; α-tocotrienol, TOS; α-tocopheryl succinate, T3E; 6-O-Carboxypropyl-alpha-tocotrienol.
Ijms 24 09382 g003
Figure 4. Effects of the combination of bortezomib and vitamin E on the viabilities. H2452 cells were treated with bortezomib 50 nM or bortezomib 50 nM +TP 20 µM, T3 20 µM, TOS 20 µM, T3E 20 µM for 24 h, and cell viability was evaluated by the WST-8 assay. Data are means ± SD, n = 5. * p < 0.05, ** p < 0.01 vs. as indicated. BTZ; bortezomib, TP; α-tocopherol, T3; α-tocotrienol, TOS; α-tocopheryl succinate, T3E; 6-O-Carboxypropyl-alpha-tocotrienol.
Ijms 24 09382 g004
Figure 5. Effects of vitamin E on NFE2L1 in another solid cancer cells. PANC1 (a) and A549 (b) cells were treated with bortezomib 50 nM or bortezomib 50 nM +TP 20 µM, T3 20 µM, TOS 20 µM, T3E 20 µM for 12 h, and NFE2L1 protein levels were assessed by immunoblotting. Results are representative of three independent experiments. After PANC1 (c) and A549 cells (d) were treated with bortezomib 50 nM or bortezomib 50 nM +TP 20 µM, T3 20 µM, TOS 20 µM, T3E 20 µM for 12 h, and the mRNA levels of PSMB7 were assessed by real-time quantitative PCR as described in the Materials and Methods section. RPL32 mRNA levels served as the loading control. Data are means ± SD, n = 3. * p <0.05 ** p < 0.01 vs. the control. PANC1 (e) and A549 cells (f) were treated with bortezomib 50 nM or bortezomib 50 nM +TP 20 µM, T3 20 µM, TOS 20 µM, T3E 20 µM for 24 h. After the treatment, cell viability was evaluated by the WST-8 assy. Data are means ± SD, n = 5. * p < 0.05, ** p < 0.01 vs. as indicated. TP; α-tocopherol, T3; α-tocotrienol, TOS; α-tocopheryl succinate, T3E; 6-O-Carboxypropyl-alpha-tocotrienol.
Ijms 24 09382 g005aIjms 24 09382 g005b
Figure 6. Effects of atorvastatin on NFE2L1 in treatment bortezomib. H2452 cells were treated with bortezomib 50 nM or bortezomib 50 nM +atorvastatin 10 µM for 24 h, and NFE2L1 (a) and ubiquitinated protein (c) levels were assessed by immunoblotting. α-Tubulin protein levels served as the loading control. A densitometric analysis was performed as described in the Materials and Methods section. (b) After H2452 cells were treated with bortezomib 50 nM or bortezomib 50 nM +atorvastatin 10 µM for 24 h, and the mRNA levels of PSMB7 were assessed by real-time quantitative PCR as described in the Materials and Methods section. RPL32 mRNA levels served as the loading control. Data are means ± SD, n = 3. * p < 0.05 ** p < 0.01 vs. the control. BTZ; bortezomib, statin; atorvastatin.
Ijms 24 09382 g006aIjms 24 09382 g006b
Table 1. List of PCR primers.
Gene NamePrimerSequence
60S ribosomal protein L32 (RPL32)ForwardAACCCTGTTGTCAATGCCTC
ReverseCATCTCCTTCTCGGCATCA
Proteasome 20S Subunit Alpha 7 (PSMA7)ForwardCTGTGCTTTGGATGACAACG
ReverseCGATGTAGCGGGTGATGTACT
Proteasome 20S Subunit Beta 4 (PSMB4)ForwardTCAGTCCTCGGCGTTAAGTT
ReverseGCTTAGCACTGGCTGCTTCT
Proteasome 20S Subunit Beta 7 (PSMB7)ForwardCGGCTGTGTCGGTGTATG
ReverseGCCAGTTTTCCGGACCTT
Proteasome 26S Subunit ATPase4 (PSMC4)ForwardGGAAGACCATGTTGGCAAAG
ReverseAAGATGATGGCAGGTGCATT
Proteasome maturation protein (POMP)ForwardAGGCAGTGCAGCAGGTTC
ReverseGGCTCTCCCATGACTTCG
Disclaimer/Publisher’s Note: The statements, opinions and data contained in all publications are solely those of the individual author(s) and contributor(s) and not of MDPI and/or the editor(s). MDPI and/or the editor(s) disclaim responsibility for any injury to people or property resulting from any ideas, methods, instructions or products referred to in the content.