Abstract
Nutrition and energy levels have an important impact on animal growth, production performance, disease occurrence and health recovery. Previous studies indicate that melanocortin 5 receptor (MC5R) is mainly involved in the regulations of exocrine gland function, lipid metabolism and immune response in animals. However, it is not clear how MC5R participates in the nutrition and energy metabolism of animals. To address this, the widely used animal models, including the overfeeding model and the fasting/refeeding model, could provide an effective tool. In this study, the expression of MC5R in goose liver was first determined in these models. Goose primary hepatocytes were then treated with nutrition/energy metabolism-related factors (glucose, oleic acid and thyroxine), which is followed by determination of MC5R gene expression. Moreover, MC5R was overexpressed in goose primary hepatocytes, followed by identification of differentially expressed genes (DEGs) and pathways subjected to MC5R regulation by transcriptome analysis. At last, some of the genes potentially regulated by MC5R were also identified in the in vivo and in vitro models, and were used to predict possible regulatory networks with PPI (protein–protein interaction networks) program. The data showed that both overfeeding and refeeding inhibited the expression of MC5R in goose liver, while fasting induced the expression of MC5R. Glucose and oleic acid could induce the expression of MC5R in goose primary hepatocytes, whereas thyroxine could inhibit it. The overexpression of MC5R significantly affected the expression of 1381 genes, and the pathways enriched with the DEGs mainly include oxidative phosphorylation, focal adhesion, ECM–receptor interaction, glutathione metabolism and MAPK signaling pathway. Interestingly, some pathways are related to glycolipid metabolism, including oxidative phosphorylation, pyruvate metabolism, citrate cycle, etc. Using the in vivo and in vitro models, it was demonstrated that the expression of some DEGs, including ACSL1, PSPH, HMGCS1, CPT1A, PACSIN2, IGFBP3, NMRK1, GYS2, ECI2, NDRG1, CDK9, FBXO25, SLC25A25, USP25 and AHCY, was associated with the expression of MC5R, suggesting these genes may mediate the biological role of MC5R in these models. In addition, PPI analysis suggests that the selected downstream genes, including GYS2, ECI2, PSPH, CPT1A, ACSL1, HMGCS1, USP25 and NDRG1, participate in the protein–protein interaction network regulated by MC5R. In conclusion, MC5R may mediate the biological effects caused by changes in nutrition and energy levels in goose hepatocytes through multiple pathways, including glycolipid-metabolism-related pathways.
1. Introduction
The liver is an important organ for nutrition and energy metabolism in animals [1]. When nutrition and energy are excessive, glucose is not only converted into glycogen and stored in the liver, but also converted into fat. The latter is then transported via blood to adipose tissue for storage. In contrast, when nutrition and energy cannot meet the needs for normal physiological function and production, the liver will break down glycogen into glucose or increase gluconeogenesis to maintain blood glucose levels [2,3,4]. Therefore, the liver plays a pivotal role in nutrition and energy metabolism.
Appropriate nutrition and energy levels are necessary for animals to maintain various physiological functions. Changes in nutrition and energy levels may cause a large effect on animals. For example, in the rearing process of Peking ducks, raising the levels of metabolizable energy and crude protein can significantly increase the body weight of ducks, whereas feed intake and the ratio of feed to weight are decreased [5,6]. It is also reported that increasing protein and energy levels can improve chicken antibody titers to pathogens [7]. However, excessive intake of an energy-rich diet can lead to some metabolic diseases. For example, some studies show that high-energy and low-protein diets can induce excessive abdominal fat, an obvious reduction in egg production and the occurrence of fatty liver hemorrhagic syndrome in laying hens [8,9]. In conclusion, changes in nutrition and energy levels have a great influence on the growth and development, disease occurrence, and production performance of animals.
The overfeeding model, the fasting/refeeding model and the high sugar/fat diet model are widely used in nutrition or energy metabolism-related studies in animals. Using these models, a number of studies have revealed that many genes and pathways are influenced by changes in nutrition and energy levels. For example, using the fasting/refeeding model, Xu et al. [10] demonstrated that fasting decreased the expression of fat synthesis genes (Stearoyl-CoA Desaturase (SCD), glucocorticoid receptor (GR) and fatty acid synthase (FAS)) in the liver and increased the expression of lipolytic genes (AMP-activated protein kinase alpha subunit (AMPKα), AMPKβ and AMPKγ) in the hypothalamus. Liver transcriptome analysis indicates that fasting affects the nutrition metabolism in goose liver, especially the signaling pathways related to lipid metabolism. Refeeding not only affects lipid metabolism pathways, but also affects glucose and amino acid metabolism pathways. Among these pathways, the peroxisome proliferator-activated receptor (PPAR) signaling pathway may play an important role in lipid metabolism [11]. Furthermore, using the overfeeding study model, liver transcriptome analysis indicates that liver transcriptome is characterized by metabolic pathways at the early stage of overfeeding, while the cell growth and death pathway and the immune diseases pathway are also significantly enriched with differentially expressed genes at the later stage of overfeeding [12]. Overall, using these models may help to reveal the molecular mechanisms by which the changes in nutrition and energy metabolism affect animal physiology and health, and thus provide a theoretical reference for animal production.
Studies have shown that changes in the levels of nutrition and energy metabolism can affect the expression of the genes involved in the melanocortin/melanocortin receptor (MC/MCR) system. For example, fasting can induce mRNA expression of Agouti-related protein (AgRP), melanocortin 4 receptor (MC4R) and neuropeptide Y (NPY) genes in the hypothalamus of quail and chicken [13,14]. This suggests that the MC/MCR system may be involved in the regulation of nutrition and energy metabolism in animals. Indeed, melanocortins (including adrenocorticotropic hormone (ACTH), alpha, beta, gamma-melanocyte-stimulating hormone (α, β, γ-MSH), etc.) are known to play an important role in food intake, blood pressure regulation, hormone secretion regulation, blood glucose regulation and energy expenditure [15,16]. Moreover, the expression of melanocortin receptors, including melanocortin 1 receptor (MC1R), melanocortin 2 receptor (MC2R), melanocortin 3 receptor (MC3R), MC4R and melanocortin 5 receptor (MC5R), in different tissues is related to cell type, and these receptors play a key role in mediating the biological effects of melanocortins [17,18,19]. Different receptors have different affinities for a variety of melanocortins and have different biological functions. For example, MC1R is mainly involved in inflammatory response and pigmentation, and also plays an important role in skin tone control and in the repair of ultra violet (UV) induced DNA damage [20]. MC2R mainly participates in the synthesis of a variety of steroids. MC3R is associated with feeding behavior and metabolic homeostasis. MC4R is involved in the formation of satiety, and point mutations in MC4R can induce obesity in animals [21].
Compared to other MCRs, there are relatively few studies on MC5R. It is known that MC5R has a broad expression profile, it is not only expressed in the central nervous system, but also in the skin, skeletal muscle, fat, lymph nodes, duodenum, liver, kidney, testis, ovary, uterus and many exocrine glands [22,23,24]. Despite the wide tissue expression spectrum and the diversity of hormones it binds, the function of MC5R is not well addressed. So far, the known functions of MC5R are mainly involved in the regulations of exocrine gland function, energy, lipid metabolism and immune response [25,26,27]. A recent study shows that chicken MC5R has a higher affinity to ACTH/α-MSH, and is coupled to the cAMP/ protein kinase A (PKA) signaling pathway. As ACTH can promote gluconeogenesis and reduce triglyceride content in primary hepatocytes, it suggests that ACTH/MC5R may have an important role in regulating glucose and lipid metabolism in chicken liver [28].
Nonetheless, there are few studies on the role of MC5R in poultry nutrition and energy metabolism and the related mechanisms. The purpose of this study was to address the role and mechanisms of MC5R in the nutrition and energy metabolism of goose liver using the overfeeding model and the fasting/refeeding model, which may provide a theoretical reference for improving goose production performance by adjusting nutrition or energy levels.
2. Results
2.1. MC5R Expression in Different Tissues of Goose Embryos
The mRNA expression level of MC5R was determined in different tissues of Landes goose embryos (after 23 days of incubation) by quantitative real-time polymerase chain reaction (qPCR) analysis. The results showed that MC5R expression was the highest in fat tissue, followed by skin, liver and muscle tissues (pectoralis and leg muscles at a relatively higher level, while the intestine and heart had the lowest expression level) (Figure 1).
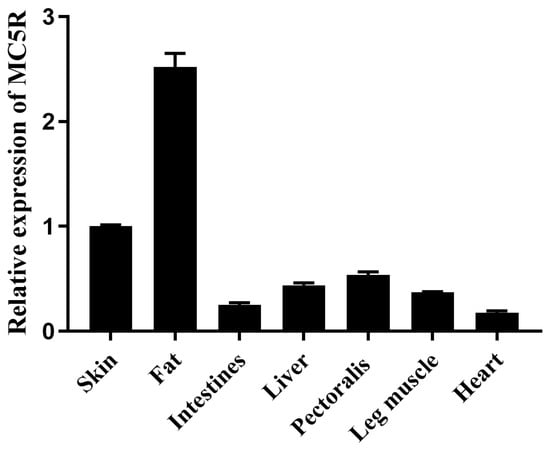
Figure 1.
The mRNA expression level of MC5R gene in different embryonic tissues of Landes geese. Note: The mRNA expression level was determined by RT-qPCR and presented as fold change over skin tissue. The internal reference gene was glyceraldehyde-3-phosphate dehydrogenase (GAPDH). The embryos were from the fertilized eggs cultured for 23 days. n = 3.
2.2. MC5R Expression of Goose Liver in the Overfeeding Model
To investigate the role of MC5R in hepatic nutrition and energy metabolism, the expression of MC5R in the liver was determined in the Landes geese overfed for 12 and 24 days versus the normally fed geese (control). Quantitative PCR analysis indicated that the mRNA expression level of MC5R was significantly decreased in the overfed-induced fatty liver compared to normal liver (Figure 2A). Consistently, immunoblotting analysis showed that the protein expression level of MC5R was also significantly decreased in fatty liver vs. normal liver on the 24th day of overfeeding (Figure 2B).
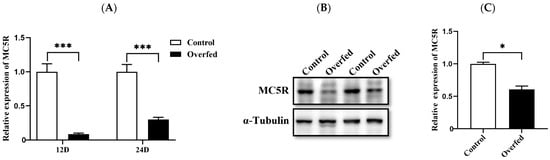
Figure 2.
The mRNA and protein expression levels of MC5R in the livers of the overfed versus normally fed Landes geese on the 12th (12D) and 24th days (24D) of overfeeding. Note: (A) The mRNA expression level was determined by RT-qPCR and presented as fold change over the control group (the normally fed geese). The internal reference gene was GAPDH. n = 6. (B) The protein expression level was determined by immunoblot assay. The internal reference gene was α-tubulin. The protein samples were from the livers of geese on the 24th day of overfeeding. (C) Quantification of the immunoblots. *, *** indicate p < 0.05 and 0.001, respectively.
2.3. MC5R Expression of Goose Liver in the Fasting/Refeeding Model
Quantitative PCR analysis showed that the mRNA expression level of MC5R in goose liver after 24 h of fasting was significantly higher than that in goose liver of the control group (the normally fed geese), while this induction was significantly suppressed by 2 h of refeeding (Figure 3).
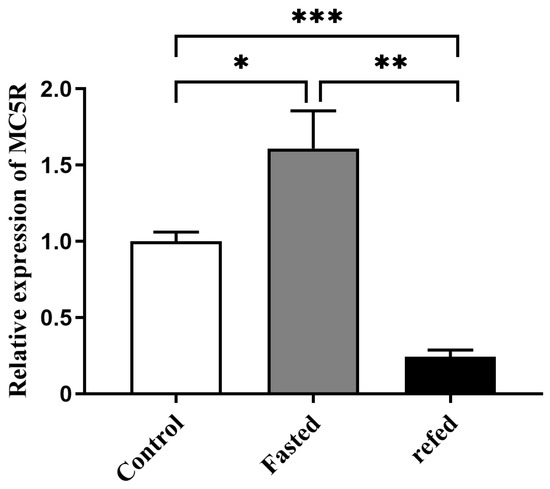
Figure 3.
The mRNA expression level of MC5R gene in the livers of the fasted and refed versus control Landes geese. Note: The mRNA expression level was determined by RT-qPCR and presented as fold change over the control group. The internal reference gene was GAPDH. n = 8. *, **, *** indicate p < 0.05, 0.01 and 0.001, respectively.
2.4. Effect of Nutrition or Energy Metabolism-Related Factors on MC5R Expression in Goose Hepatocytes
After goose primary hepatocytes were treated with different concentrations of glucose, sodium oleate and sodium thyroxine for 14 h, the cells were harvested and used for determining the mRNA expression level of MC5R by qPCR analysis. The data showed that glucose at 50 mM and 100 mM and sodium oleate at 0.25 mM significantly induced MC5R expression compared with the control group (Figure 4A,B), while sodium thyroxine at 0.1 μM and 0.3 μM significantly inhibited MC5R expression (Figure 4C).
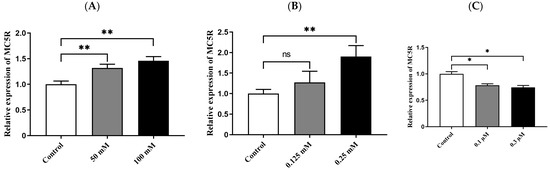
Figure 4.
The mRNA expression level of MC5R in the treated versus control primary hepatocytes of goose. Note: The factors that are related to nutrition or energy metabolism include (A) glucose, (B) sodium oleate and (C) sodium thyroxine. The mRNA expression level was determined by RT-qPCR and presented as fold change over the control group. The internal reference gene was GAPDH. n = 6. *, ** indicate p < 0.05 and 0.01, respectively. ‘ns’ denotes p > 0.05.
2.5. Effect of MC5R Overexpression on Downstream Gene Expression and Pathways in Goose Hepatocytes
To identify the genes and pathways affected by MC5R in goose hepatocytes, MC5R was overexpressed in goose primary hepatocytes (Figure 5A,B), and transcriptome analysis was then performed. The data showed that MC5R overexpression significantly affected the expression of 1381 genes, of which the expression of 838 genes was induced by MC5R overexpression while that of 543 genes was suppressed (Supplementary Figure S1). According to the statistical significance (p-value), the top 10 up- and downregulated differentially expressed genes (DEGs) are listed in Table 1. Gene Ontology (GO) enrichment analysis showed that the upregulated DEGs were enriched in 604 GO terms, of which 322 terms belong to biological processes, 81 terms belong to cellular composition and 201 terms belong to molecular functions (Supplementary Figure S2A). In contrast, the downregulated DEGs were enriched in 381 GO terms, of which 150 terms belong to biological processes, 46 terms belong to cellular components and 185 terms belong to molecular functions (Supplementary Figure S2B). The Kyoto Encyclopedia of Genes and Genomes (KEGG) pathway analysis showed that the upregulated DEGs were mainly enriched in the ribosome, endocytosis, RNA transport, oxidative phosphorylation, ribosome biogenesis in eukaryotes, glutathione metabolism, spliceosome, metabolism of xenobiotics by cytochrome P450, cysteine and methionine metabolism, citrate cycle (TCA cycle) pathways, etc. (Figure 6A). In contrast, the downregulated DEGs were mainly enriched in the focal adhesion, MAPK signaling pathway, ECM–receptor interaction, regulation of actin cytoskeleton, protein processing in endoplasmic reticulum, AGE-RAGE signaling pathway in diabetic complications, FoxO signaling pathway, insulin signaling pathway, apoptosis, lysine degradation pathways, etc. (Figure 6B). To validate the results of the DEGs identified by transcriptome sequencing analysis, qPCR was used to determine the expression of 12 randomly selected DEGs. The results showed that among the 12 genes, only the lactate dehydrogenase B (LDHB) gene was not fully consistent with the RNA-seq data, which indicates the reliability of the RNA-seq analysis (Supplementary Figure S3).
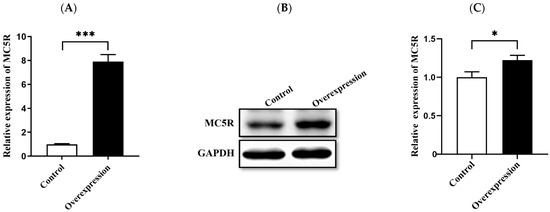
Figure 5.
Overexpression of MC5R gene in goose primary hepatocytes. Note: The (A) mRNA and (B) protein expression levels of MC5R in goose primary hepatocytes treated with MC5R overexpression vector vs. empty vector (the control group). (C) Quantification of the immunoblots. The mRNA expression level was determined by RT-qPCR and presented as fold change over the control group. The internal reference gene was ubiquitin C (UBC). n = 6. The protein expression level was determined by immunoblot assay. The internal reference gene was GAPDH. *, *** indicate p < 0.05 and 0.001, respectively.

Table 1.
Top 10 up- and downregulated differentially expressed genes with the lowest p values.
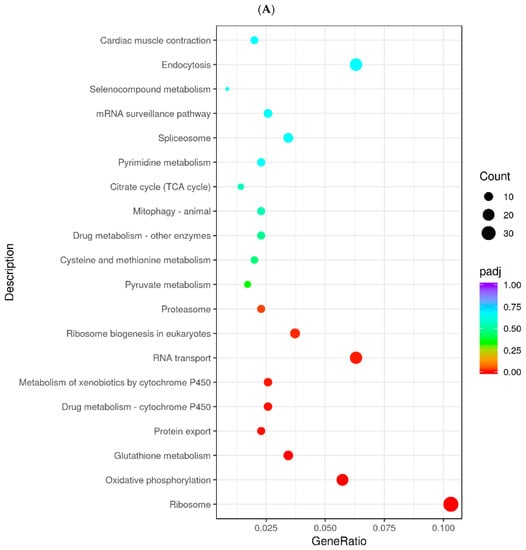
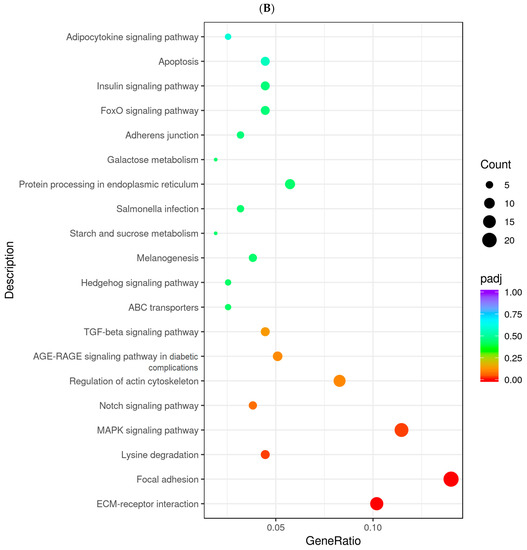
Figure 6.
The dot chart shows the results from KEGG enrichment analysis. Note: (A) The results of KEGG enrichment analysis with the upregulated DEGs. (B) The results of KEGG enrichment analysis with the downregulated DEGs. The abscissa indicates the ratio of the number of the annotated DEGs in a specified KEGG pathway to the total number of annotated DEGs, and the ordinate indicates the KEGG pathways. The colors denote the adjusted p-value (p-adj), and the sizes of the dots denote the number of DEGs. The DEGs were identified in goose primary hepatocytes transfected with MC5R overexpression vectors vs. empty vectors (n = 4).
2.6. Effect of MC5R Overexpression on the Expression of Some Specifically Selected Genes
Some downstream DEGs related to glycolipid metabolism (acyl-CoA synthetase long chain family member 1 (ACSL1), glycogen synthase 2 (GYS2), 3-hydroxy-3-methylglutaryl-CoA synthase 1 (HMGCS1), carnitine palmitoyltransferase 1A (CPT1A), enoyl-CoA delta isomerase 2 (ECI2), nicotinamide riboside kinase 1 (NMRK1)), cell growth and death (insulin like growth factor binding protein 3 (IGFBP3), N-myc downstream regulated 1 (NDRG1), cyclin dependent kinase 9 (CDK9)) and other biological processes (phosphoserine phosphatase (PSPH), protein kinase C and casein kinase substrate in neurons 2 (PACSIN2), F-box protein 25 (FBXO25), solute carrier family 25 member 25 (SLC25A25), ubiquitin specific peptidase 25 (USP25) and adenosylhomocysteinase (AHCY)) are specifically selected. The expression of these genes in goose primary hepatocytes transfected with MC5R overexpression vectors vs. empty vectors was determined by qPCR. The data showed that MC5R overexpression significantly induced the expression of these genes in goose hepatocytes (Figure 7).
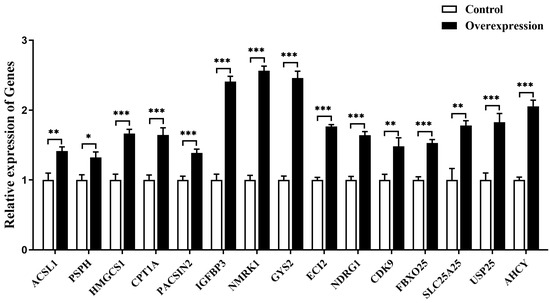
Figure 7.
The mRNA expression level of some specifically selected DEGs in goose primary hepatocytes transfected with MC5R overexpression vector vs. empty vector. Note: The mRNA expression level was determined by RT-qPCR and presented as fold change over the control group. The internal reference gene was UBC. n = 6. *,**, *** indicate p < 0.05, 0.01 and 0.001, respectively.
2.7. Effects of MC5R Knockdown on the Expression of Some Specifically Selected Genes
To validate these downstream genes of MC5R, goose primary hepatocytes were transfected with siRNAs targeting MC5R (siMC5R) or negative control siRNAs. The expression of the downstream genes in these hepatocytes was then determined by qPCR analysis. The data showed that the expression of MC5R was successfully knocked down by MC5R siRNAs (Figure 8A), and the mRNA expression of the downstream genes except for the USP25 gene was significantly suppressed by MC5R knockdown (Figure 8B).
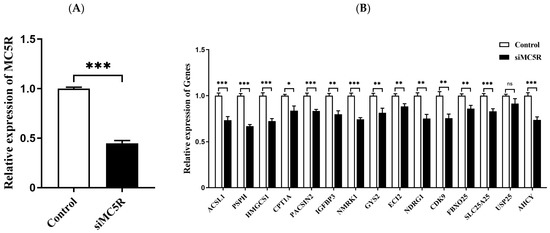
Figure 8.
The mRNA expression level of MC5R (A) and some specifically selected DEGs (B) in goose primary hepatocytes transfected with siRNA targeting MC5R (siMC5R) versus the control negative siRNA (control). Note: The mRNA expression level was determined by RT-qPCR and presented as fold change over the control group. The internal reference gene was UBC. n = 6. *,**, *** indicate p < 0.05, 0.01 and 0.001, respectively. ‘ns’ denotes p > 0.05.
2.8. Effect of Glucose on the Expression of Some Specifically Selected Genes in Goose Hepatocytes
As glucose at the concentration of 100 mmol/L could induce the expression of MC5R in goose primary hepatocytes, the expression of the specifically selected genes was determined in the glucose-treated cells versus the untreated control cells by qPCR analysis. The results showed that the mRNA expression of ACSL1, PSPH, HMGCS1, CPT1A, PACSIN2, IGFBP3, NMRK1, GYS2, ECI2, NDRG1, CDK9, FBXO25, SLC25A25 and USP25 genes was significantly induced by glucose treatment, except for AHCY gene (Figure 9).
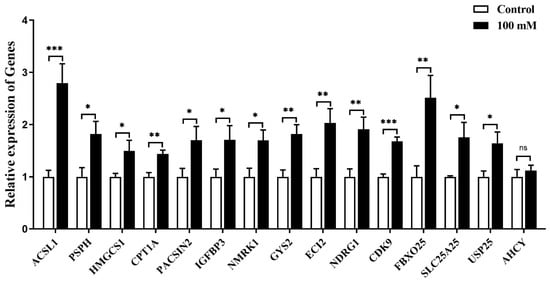
Figure 9.
The mRNA expression level of some specifically selected DEGs in goose primary hepatocytes treated with 100 mM/L glucose versus the control group (0 mM/L glucose). Note: The mRNA expression level was determined by RT-qPCR and presented as fold change over the control group. The internal reference gene was GAPDH. n = 6. *,**, *** indicate p < 0.05, 0.01 and 0.001, respectively. ‘ns’ denotes p > 0.05.
2.9. Effect of Overfeeding on the Expression of Some Specifically Selected Genes in Goose Liver
Quantitative PCR analysis showed that the expression of the downstream genes was significantly suppressed in goose liver by overfeeding, except for SLC25A25 and AHCY genes (Figure 10).
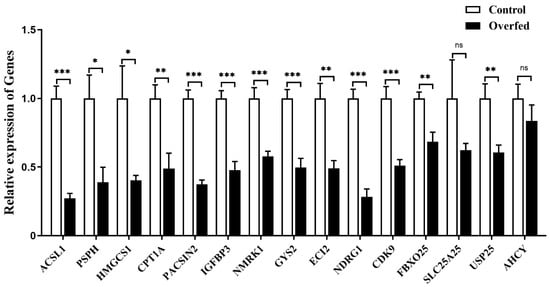
Figure 10.
The mRNA expression level of some specifically selected DEGs in the livers of the overfed versus normally fed geese on the 24th day of overfeeding. Note: The mRNA expression level was determined by RT-qPCR and presented as fold change over the control group (the normally fed geese). The internal reference gene was GAPDH. n = 6. *,**, *** indicate p < 0.05, 0.01 and 0.001, respectively. ‘ns’ denotes p > 0.05.
2.10. Effects of Refeeding on the Expression of Some Specifically Selected Genes in Goose Liver
Quantitative PCR analysis showed that the expression of all the selected downstream genes in goose liver was significantly suppressed by refeeding compared with the fasting group (Figure 11).
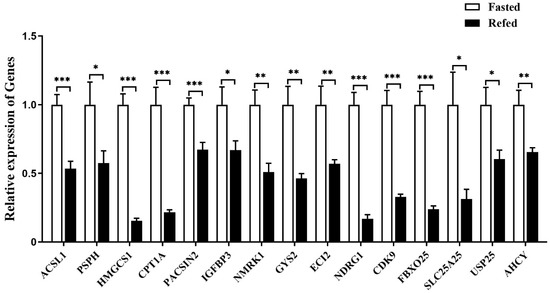
Figure 11.
The mRNA expression level of some specifically selected DEGs in the livers of the refed versus fasted geese. Note: The mRNA expression level was determined by RT-qPCR and presented as fold change over the fasted group. The internal reference gene was GAPDH. n = 8. *,**, *** indicate p < 0.05, 0.01 and 0.001, respectively.
2.11. PPI Analysis of Selected Downstream Genes
As it is known that MC5R can exert a variety of biological functions through the PKA signaling pathway, PKA, MC5R and its downstream genes, including ACSL1, PSPH, HMGCS1, CPT1A, PACSIN2, IGFBP3, NMRK1, GYS2, ECI2, NDRG1, CDK9, FBXO25, SLC25A25 and USP25, were input into the STRING database for protein–protein interaction network prediction. The result showed that PKA, GYS2, ECI2, PSPH, CPT1A, ACSL1, HMGCS1, USP25 and NDRG1 participated in the network regulated by MC5R (Figure 12). It is worth mentioning that GYS2 had the highest degree of connectivity to other genes, suggesting that this gene was the key gene mediating the role of MC5R in the regulation of energy metabolism of goose liver.
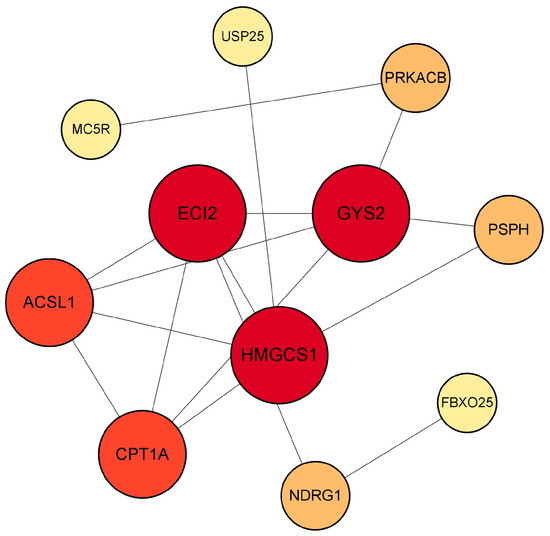
Figure 12.
The chart shows the protein–protein interaction network regulated by MC5R based on PPI analysis. Note: Colors ranging from yellow to red indicate an increase in degree of connectivity, and a larger degree indicates a greater connectivity to other genes.
3. Discussion
The level of nutrition or energy metabolism has a great impact on the growth, health and production performance of animals, and the liver plays an important role in nutrition or energy metabolism. In this study, the data from the in vivo experiments showed that increasing the level of nutrition or energy (refeeding or overfeeding) could inhibit the expression of MC5R in goose liver and vice versa. Refeeding or overfeeding usually elevates the levels of glucose, insulin, thyroxine and other molecules in the blood, which may inhibit the expression of MC5R and its downstream genes involved in fatty acid oxidation and lipolysis, thus promoting fat deposition in the liver. On the other hand, fasting usually lowers the levels of glucose, insulin and thyroxine in the blood and elevates the levels of glucagon and other molecules in the blood, which may induce the expression of MC5R and its downstream genes, thus promoting gluconeogenesis and fat mobilization in the liver. In a word, changes in nutrition and energy levels can alter the expression levels of MC5R and its downstream genes, through which the energy fuel in animals switches from fat to sugar during feed intake and from sugar to fat during fasting.
Different from the in vivo experiments, the expression of MC5R in goose primary hepatocytes was induced by increased nutrition or energy levels, such as the elevated concentrations of glucose or oleic acid. This inconsistency indicates that in addition to the direct effect on the expression of MC5R in goose liver, the level of nutrition or energy in vivo may also indirectly affect the expression of MC5R by other factors. For example, short-term fasting can significantly reduce the level of thyroid hormone in chicken blood [29,30]. In this study, thyroxine treatment inhibited the expression of MC5R in goose primary hepatocytes, suggesting that changes in the nutrition and energy levels may indirectly regulate the expression of MC5R in goose liver by influencing the level of thyroid hormone in the blood. In addition, there are a lot of interactions in vivo among different types of cells and multiple systems, which is much more complicated than the in vitro situation of the cultured cells. This may provide another explanation for the inconsistency mentioned above.
There are a number of previous studies that report the close relationship of MC5R with the nutrition or energy metabolism of animals. Firstly, in mammals, MC5R is not only expressed in the skin, adrenal gland, testis and heart, but also highly expressed in the tissues closely related to nutrition and energy metabolism, i.e., fat, liver, brain and muscle [31,32]. Similar to mammals, MC5R is expressed in diverse tissues of chickens, such as the liver, adrenal gland, ovary and adipose tissue [33]. In this study, MC5R was expressed in skin, fat, small intestine, liver, pectoralis, leg muscle and heart tissue of 23-day-old Landes goose embryos, and its expression was relatively higher in skin, fat, liver and skeletal muscle. Secondly, the expression of MC5R is significantly correlated with body mass index, subcutaneous fat, adiposity and resting metabolic rate [23]. In addition, MC5R knockdown leads to decreased fat amount in the sebum of mice [34]. Therefore, it is believed that MC5R is involved in nutrition and energy metabolism, especially lipid metabolism. Considering the results from transcriptome analysis on goose liver in the fasting and refeeding experiment, that is, fasting mainly affected lipid metabolism in goose liver while refeeding affected both lipid metabolism and glucose and amino acid metabolism [11], we speculate that MC5R may play a role in regulating lipid metabolism in the process of nutrition and energy metabolism.
Moreover, activated MC5R can stimulate lipid mobilization in adipocytes and glucose uptake in skeletal muscle [35]. It has been shown that the binding of α-MSH to MC5R activates the PKA and ERK1/2 (MAPK) signaling pathways, and the activation of MC5R in skeletal muscle regulates fatty acids oxidation in muscle cells through PKA and MAPK signaling pathways [36]. It has also been shown that in HEK293 cells, MC5R activates the ERK1/2 signaling pathway via phosphatidylinositol 3-kinase (PI3K), and this activation is not dependent on adenylate cyclase, PKA, protein kinase C (PKC) and akt kinase (Akt) / protein kinase B (PKB) pathways [37]. Consistently, transcriptome analysis of goose primary hepatocytes overexpressing MC5R in this study showed that some of the DEGs were enriched in the signaling pathways related to glucolipid metabolism, including oxidative phosphorylation, citrate cycle, MAPK signaling pathway, adipocytokine signaling pathway, insulin signaling pathway, pyruvate metabolism, FoxO signaling pathway, starch and sucrose metabolism, arachidonic acid metabolism and galactose metabolism. Additionally, in this study, some downstream genes involved in the regulation of goose liver energy metabolism were identified using fasting/refeeding model, overfeeding model and glucose-treated goose hepatocytes, and using these genes, PPI analysis suggested that MC5R could regulate the protein–protein interaction network consisting of the downstream genes, including GYS2, ECI2, PSPH, CPT1A, ACSL1, HMGCS1, USP25 and NDRG1, through PKA, and GYS2 might be a key gene mediating the role of MC5R in the regulation of energy metabolism of goose liver. The genes associated with glycolipid metabolism, including ACSL1, CPT1A, GYS2, HMGCS1 and ECI2, were affected by changes in nutrition or energy level in the fasting/refeeding model, the overfeeding model and glucose-treated goose hepatocytes. Interestingly, the correlation between the expressions of these genes and MC5R is in line with the notion that the expression of these genes is regulated by MC5R. This provides more solid evidence supporting the conclusion that MC5R mediates the biological effects of nutrition and energy metabolism mainly by influencing glycolipid metabolism.
It is noteworthy that the expression of ACSL1, CPT1A, GYS2, HMGCS1 and ECI2 genes in goose fatty liver was inhibited by overfeeding, and this inhibition by high levels of nutrition and energy has also been reported in previous studies. For example, in an animal model of high-fat-induced obesity, the expression of ACSL1 and HMGCS1 was inhibited in both hamster and zebrafish livers, and steatosis also occurred in the livers of these animals [38,39]. It has also been reported that inhibition of ECI2 expression results in decreased glucose utilization and increased fat deposition [40].
In addition to being engaged in the regulation of glycolipid metabolism, the transcriptome analysis in this study also revealed that MC5R was involved in amino acid metabolism (cysteine and methionine metabolism, lysine degradation), ECM–receptor interaction, the AGE-RAGE signaling pathway, the notch signaling pathway and the glutathione metabolism pathway. The expression level of some DEGs involved in these pathways, such as PSPH, PACSIN2, IGFBP3, NMRK1, NDRG1, CDK9, FBXO25, SLC25A25, USP25 and AHCY genes, is correlated with the expression level of MC5R in the fasting/refeeding model, the overfeeding model and the glucose-treated goose hepatocytes. This to a large extent agrees with the speculation that these genes are regulated by MC5R. Among these genes, it is known that IGFBP3, NDRG1 and CDK9 genes can regulate cytokine expression, cell growth and apoptosis [41,42,43].
In summary, the expression of MC5R in goose hepatocytes is influenced by changes in the level of nutrition or energy metabolism, and glucose, oleic acid and thyroxine, may be involved in the regulation of MC5R expression in goose hepatocytes. MC5R can mediate the biological effects caused by changes in the level of nutrition or energy metabolism in goose hepatocytes through multiple pathways, especially glycolipid-metabolism-related pathways.
4. Materials and Methods
4.1. Animal Welfare Statement
The animal protocols in this study were approved by the Institutional Animal Care and Use Committee (IACUC) of Yangzhou University, and all animal experiments were performed according to the approved protocols so that animal pain and suffering were minimized as much as possible. The certificate number assigned by IACUC is SYXK(Su)2016-0020.
4.2. Experimental Animals and Sample Collection
To determine the expression profile of MC5R in different goose tissues, 10 fertilized goose eggs were incubated at 37.8 °C. After 23 days of incubation, the embryos were sacrificed, and the tissues, including pectoralis, leg muscles, heart, liver, small intestine, fat and skin tissues, were collected and stored at −70 °C.
For the animal fasting and refeeding experiment, 24 10-day-old Landes goslings with similar body weight were randomly divided into three groups (n = 8), including the control group, the fasting group and the refeeding group. The geese in the control group had free access to feed and water, those in the fasting group were fasted for 24 h with free access to water, and those in the refeeding group were fasted for 24 h with free access to water, followed by refeeding for 2 h with free access to feed and water. After that, the goslings were sacrificed, and the liver was collected and stored at −70 °C.
For the animal overfeeding experiment, 24 65-day-old male Landes geese with similar body weight raised in Licheng Livestock & Poultry Co., Ltd., Huai’an, China were randomly assigned into two groups (n = 12), i.e., the control group and the overfeeding group. The geese in the control group were fed ad libitum, and those in the overfeeding group were artificially overfed for 24 days. The overfeeding protocol has been described previously [44]. The two groups were fed the same diet. On the 12th and 24th days of overfeeding, 6 geese from each group were sacrificed, and the liver tissues were collected and stored at −70 °C.
4.3. Isolation, Culture and Treatment of Goose Primary Hepatocytes
After the fertilized goose eggs were incubated for 23 days, the embryos were sacrificed for liver tissue collection. According to the protocol described previously [45], primary hepatocytes were prepared and plated at a density of 5 × 10⁶ cells per well. The cells were incubated overnight in a complete culture medium containing high-glucose DMEM culture medium (Gibco, New York, NY, USA), 10% fetal bovine serum (Gibco, New York, NY, USA), 1% penicillin–streptomycin (Solarbio, Beijing, China) and 0.1% EGF (Solarbio, Beijing, China). For glucose treatment, the cells in complete culture medium were treated with 0 mmol/L (the control group), 50 mmol/L and 100 mmol/L glucose, respectively. For oleate treatment, the cells in complete culture medium were treated with 0 mmol/L (the control group), 0.125 mmol/L and 0.25 mmol/L sodium oleate, respectively. For thyroxine treatment, the cells in complete culture medium were treated with 0 µmol/L (the control group), 0.1 µmol/L and 0.3 µmol/L sodium thyroxine, respectively. After 14 h of treatment, the cells were collected for later analysis.
4.4. MC5R Overexpression and Knockdown in Goose Primary Hepatocytes
For MC5R overexpression, pcDNA3.1 was used as the overexpression vector. For MC5R knockdown, and siRNA (siMC5R) targeting MC5R (sense: 5′-GGCUCCAUUCUUUCCUCCAUTT-3′, antisense: 5′-AUGGAGGAAGAAUGGAGCCTT-3′) and the negative control (sense: 5′-UUCUCCGAACGUGUCACGUTT-3′, antisense: 5′-ACGUGACACGUUCGGAGAATT-3′) were purchased from Suzhou Jima Biotechnology Co. (Suzhou, China). For transcription, MC5R overexpression vector, empty vector (pcDNA3.1), siMC5R, and negative siRNA were separately transfected into goose primary hepatocytes using jetPRIME® transfection reagent (Polyplus, Illkirch, France) according to the manufacturer’s instructions. The cells were harvested after 36 h of transfection.
4.5. Quantitative PCR Analysis
Total RNA was extracted from tissue samples or cells using RNA-easy Isolation Reagent (Vazyme, Nanjing, China) according to the manufacturer’s instructions. The complementary DNA (cDNA) was synthesized using a HiScript III RT SuperMix for qPCR (+gDNA wiper) Reverse Transcription Kit (Vazyme, Nanjing, China). Quantitative PCR was performed using the AceQ qPCR SYBR Green Master Mix kit (Vazyme, Nanjing, China) according to the procedures previously described [46]. Glyceraldehyde-3-phosphate dehydrogenase (GAPDH) and ubiquitin C (UBC) were used as the internal reference genes. The relative expression of the gene of interest was calculated using the 2−ΔΔCt method [47]. The primers used in qPCR analysis were designed with Primer 5.0 software using the reference sequence of each deposited in the National Center of Biotechnology Information (NCBI) database (Table S1) and synthesized by Azenta Life Science and Technology Co. (Nanjing, China).
4.6. Immunoblot Analysis
The collected tissue and cell samples were lysed using RIPA lysis solution (Solarbio, Beijing, China), and protein concentration of each sample was determined using a BCA Protein Assay Kit (Beyotime, Shanghai, China). The samples were then mixed with 5× SDS–PAGE loading buffer (NCM Biotech, Suzhou, China) and heated at 100 °C for 5 min. After sample preparation, 20 μg protein sample per well was loaded and separated on a 12% BeyoGel SDS–PAGE Precast Gel (Beyotime, Shanghai, China) by electrophoresis, which was followed by transferring to 0.45 µm PVDF membrane (Millipore, Burlington, MA, USA). After blocking with a commercial Fast Blocking Solution (NCM Biotech, Suzhou, China) for 20 min, the membrane was incubated with the primary antibody (1:1000) overnight at 4 °C, followed by incubating the membrane with the secondary antibody (polyclonal sheep anti-mouse or sheep anti-rabbit 1:10,000) for 1 h at room temperature. The immunoblots were visualized using a Tanon development instrument (Tanon, Shanghai, China). The primary antibodies include MC5R antibody (Cat No.: MAB8205, R&D Systems, Minneapolis, MN, USA), α-Tubulin (Cat No.: 2144; Cell Signaling Technology, Danvers, CO, USA) and GAPDH (Cat No.: bsm-33033M; Bioss, Beijing, China).
4.7. Transcriptome Sequencing Analysis
Total RNA was extracted from cell samples using TRIzol reagent according to the manufacturer’s instructions, then mRNA was purified from total RNA using poly-T oligo-attached magnetic beads. The purified mRNA was fragmented and used for cDNA synthesis. The quality and quantity of the synthesized cDNA were determined, followed by construction of the cDNA library. The cDNA library was sequenced on the Illumina platform using the PE150 sequencing strategy. Junctions and low-quality reads were removed from the raw data. Q20 and Q30 were calculated and applied to the clean data for checking the sequencing error rate. The clean reads were de novo assembled using HISAT2 (v2.0.5) software, and the expression level of genes was calculated using the fragments per kilobase per million fragments (FPKM) method. Differential expression analysis between groups was performed by the DESeq2 method, and then adjusted p-value (p-adj) was calculated using Benjamini and Hochberg methods. The criteria for differentially expressed genes (DEGs) is p-adj < 0.05. At last, the DEGs were functionally annotated, followed by Gene Ontology (GO) enrichment analysis and Kyoto Encyclopedia of Genes and Genomes (KEGG) pathway enrichment analysis using the ClusterProfiler R package. The high-throughput transcriptome sequencing analysis and data analysis were performed by Beijing Novogene Technology Co., Ltd. (Beijing, China).
4.8. PPI Analysis
The protein–protein interaction network regulated by MC5R was constructed by inputting a list of known (PKA) and selected downstream genes of MC5R into a STRING database (https://cn.string-db.org/ (accessed on 23 March 2023)).
4.9. Statistical Analysis
Data are expressed as the mean ± standard error. The statistical significance of the difference between the two groups was determined using the t test (two-tailed), and that of the difference among the groups more than two was determined using one-way ANOVA. Statistical significance was established a priori as p < 0.05.
Supplementary Materials
The following supporting information can be downloaded at: https://www.mdpi.com/article/10.3390/ijms24108648/s1.
Author Contributions
Conceptualization, D.G. and T.G.; Formal analysis, J.Z.; Project administration, T.G. and D.G.; Resources, Y.X., F.L. and T.L.; Supervision, L.L., M.Z. and T.G.; Validation, J.Z.; Visualization, Y.X. and J.M.; Writing—original draft, J.Z.; Writing—review and editing, J.G., Y.X., F.L. and T.G. All authors have read and agreed to the published version of the manuscript.
Funding
This work was supported by the National Natural Science Foundation of China (32172717, 32172756, 31972546), the Joint International Research Laboratory of Agriculture and Agri-Product Safety of the Ministry of Education of China, and the Priority Academic Program Development of Jiangsu Higher Education Institutions.
Institutional Review Board Statement
The animal protocols in this study were approved by the Institutional Animal Care and Use Committee (IACUC) of Yangzhou University. The certificate number assigned by IACUC is SYXK(Su)2016-0020.
Data Availability Statement
The raw sequence data reported in this paper have been deposited in the Genome Sequence Archive (Genomics, Proteomics & Bioinformatics 2021) in National Genomics Data Center (Nucleic Acids Res 2022), China National Center for Bioinformation/Beijing Institute of Genomics, Chinese Academy of Sciences (GSA: CRA009202) that are publicly accessible at https://ngdc.cncb.ac.cn/gsa (accessed on 21 December 2022).
Conflicts of Interest
The authors declare that this study was carried out without any commercial or financial relationships that could be construed as a potential conflict of interest.
References
- Trefts, E.; Gannon, M.; Wasserman, D.H. The liver. Curr. Biol. 2017, 27, R1147–R1151. [Google Scholar] [CrossRef] [PubMed]
- Jones, J.G. Hepatic glucose and lipid metabolism. Diabetologia 2016, 59, 1098–1103. [Google Scholar] [CrossRef] [PubMed]
- Adeva-Andany, M.M.; Pérez-Felpete, N.; Fernández-Fernández, C.; Donapetry-García, C.; Pazos-García, C. Liver glucose metabolism in humans. Biosci. Rep. 2016, 36, e00416. [Google Scholar] [CrossRef] [PubMed]
- Han, H.S.; Kang, G.; Kim, J.S.; Choi, B.H.; Koo, S.H. Regulation of glucose metabolism from a liver-centric perspective. Exp. Mol. Med. 2016, 48, e218. [Google Scholar] [CrossRef]
- Zeng, Q.F.; Cherry, P.; Doster, A.; Murdoch, R.; Adeola, O.; Applegate, T.J. Effect of dietary energy and protein content on growth and carcass traits of Pekin ducks. Poult. Sci. 2015, 94, 384–394. [Google Scholar] [CrossRef]
- Liu, J.B.; Yan, H.L.; Zhang, Y.; Hu, Y.D.; Zhang, H.F. Effects of dietary energy and protein content and lipid source on growth performance and carcass traits in Pekin ducks. Poult. Sci. 2019, 98, 4829–4837. [Google Scholar] [CrossRef]
- Perween, S.; Kumar, K.; Chandramoni; Kumar, S.; Singh, P.K.; Kumar, M.; Dey, A. Effect of feeding different dietary levels of energy and protein on growth performance and immune status of Vanaraja chicken in the tropic. Vet. World 2016, 9, 893–899. [Google Scholar] [CrossRef]
- Yeh, E.; Wood, R.D.; Leeson, S.; Squires, E.J. Effect of dietary omega-3 and omega-6 fatty acids on clotting activities of Factor V, VII and X in fatty liver haemorrhagic syndrome-susceptible laying hens. Br. Poult. Sci. 2009, 50, 382–392. [Google Scholar] [CrossRef]
- Peng, G.; Huang, E.; Ruan, J.; Huang, L.; Liang, H.; Wei, Q.; Xie, X.; Zeng, Q.; Huang, J. Effects of a high energy and low protein diet on hepatic and plasma characteristics and Cidea and Cidec mRNA expression in liver and adipose tissue of laying hens with fatty liver hemorrhagic syndrome. Anim. Sci. J. 2019, 90, 247–254. [Google Scholar] [CrossRef]
- Xu, Z.; Yu, Y.; Zhao, H.; Zhang, Y.; Wang, L.; Ma, J. Expression patterns of AMPK and genes associated with lipid metabolism in newly hatched chicks during the metabolic perturbation of fasting and refeeding. Poult. Sci. 2022, 101, 102231. [Google Scholar] [CrossRef]
- Chen, Z.; Xing, Y.; Fan, X.; Liu, T.; Zhao, M.; Liu, L.; Hu, X.; Cui, H.; Geng, T.; Gong, D. Fasting and Refeeding Affect the Goose Liver Transcriptome Mainly Through the PPAR Signaling Pathway. J. Poult. Sci. 2021, 58, 245–257. [Google Scholar] [CrossRef] [PubMed]
- Liu, L.; Zhao, X.; Wang, Q.; Sun, X.; Xia, L.; Wang, Q.; Yang, B.; Zhang, Y.; Montgomery, S.; Meng, H.; et al. Prosteatotic and Protective Components in a Unique Model of Fatty Liver: Gut Microbiota and Suppressed Complement System. Sci. Rep. 2016, 6, 31763. [Google Scholar] [CrossRef] [PubMed]
- Song, Z.; Liu, L.; Yue, Y.; Jiao, H.; Lin, H.; Sheikhahmadi, A.; Everaert, N.; Decuypere, E.; Buyse, J. Fasting alters protein expression of AMP-activated protein kinase in the hypothalamus of broiler chicks (Gallus gallus domesticus). Gen. Comp. Endocrinol. 2012, 178, 546–555. [Google Scholar] [CrossRef] [PubMed]
- McConn, B.R.; Gilbert, E.R.; Cline, M.A. Fasting and refeeding induce differential changes in hypothalamic mRNA abundance of appetite-associated factors in 7 day-old Japanese quail, Coturnix japonica. Comp. Biochem. Physiol. A Mol. Integr. Physiol. 2019, 227, 60–67. [Google Scholar] [CrossRef]
- Levitskaia, N.G.; Kamenskiĭ, A.A. Melanocortin system. Usp. Fiziol. Nauk. 2009, 40, 44–65. [Google Scholar]
- Hill, J.W.; Faulkner, L.D. The Role of the Melanocortin System in Metabolic Disease: New Developments and Advances. Neuroendocrinology 2017, 104, 330–346. [Google Scholar] [CrossRef]
- Cone, R.D. Anatomy and regulation of the central melanocortin system. Nat. Neurosci. 2005, 8, 571–578. [Google Scholar] [CrossRef]
- Gantz, I.; Fong, T.M. The melanocortin system. Am. J. Physiol. Endocrinol. Metab. 2003, 284, E468–E474. [Google Scholar] [CrossRef]
- Dores, R.M.; Baron, A.J. Evolution of POMC: Origin, phylogeny, posttranslational processing, and the melanocortins. Ann. New York Acad. Sci. 2011, 1220, 34–48. [Google Scholar] [CrossRef]
- Guida, S.; Guida, G.; Goding, C.R. MC1R Functions, Expression, and Implications for Targeted Therapy. J. Investig. Dermatol. 2022, 142, 293–302. [Google Scholar] [CrossRef]
- Markison, S.; Foster, A.C. Targeting melanocortin receptors for the treatment of obesity. Drug Discov. Today: Ther. Strateg. 2006, 3, 569–576. [Google Scholar] [CrossRef]
- Thomas, A.L.; Maekawa, F.; Kawashima, T.; Sakamoto, H.; Sakamoto, T.; Davis, P.; Dores, R.M. Analyzing the effects of co-expression of chick (Gallus gallus) melanocortin receptors with either chick MRAP1 or MRAP2 in CHO cells on sensitivity to ACTH(1–24) or ACTH(1–13)NH(2): Implications for the avian HPA axis and avian melanocortin circuits in the hypothalamus. Gen. Comp. Endocrinol. 2018, 256, 50–56. [Google Scholar] [CrossRef] [PubMed]
- Chagnon, Y.C.; Chen, W.J.; Pérusse, L.; Chagnon, M.; Nadeau, A.; Wilkison, W.O.; Bouchard, C. Linkage and association studies between the melanocortin receptors 4 and 5 genes and obesity-related phenotypes in the Québec Family Study. Mol. Med. 1997, 3, 663–673. [Google Scholar] [CrossRef]
- Zhang, L.; Li, W.H.; Anthonavage, M.; Eisinger, M. Melanocortin-5 receptor: A marker of human sebocyte differentiation. Peptides 2006, 27, 413–420. [Google Scholar] [CrossRef] [PubMed]
- Buggy, J.J. Binding of alpha-melanocyte-stimulating hormone to its G-protein-coupled receptor on B-lymphocytes activates the Jak/STAT pathway. Biochem. J. 1998, 331, 211–216. [Google Scholar] [CrossRef]
- Eisinger, M.; Li, W.H.; Anthonavage, M.; Pappas, A.; Zhang, L.; Rossetti, D.; Huang, Q.; Seiberg, M. A melanocortin receptor 1 and 5 antagonist inhibits sebaceous gland differentiation and the production of sebum-specific lipids. J. Dermatol. Sci. 2011, 63, 23–32. [Google Scholar] [CrossRef]
- Jun, D.J.; Na, K.Y.; Kim, W.; Kwak, D.; Kwon, E.J.; Yoon, J.H.; Yea, K.; Lee, H.; Kim, J.; Suh, P.G.; et al. Melanocortins induce interleukin 6 gene expression and secretion through melanocortin receptors 2 and 5 in 3T3-L1 adipocytes. J. Mol. Endocrinol. 2010, 44, 225–236. [Google Scholar] [CrossRef]
- Zhang, X.; Su, J.; Huang, T.; Wang, X.; Wu, C.; Li, J.; Li, J.; Zhang, J.; Wang, Y. Characterization of the chicken melanocortin 5 receptor and its potential role in regulating hepatic glucolipid metabolism. Front. Physiol. 2022, 13, 917712. [Google Scholar] [CrossRef]
- Proszkowiec-Weglarz, M.; Richards, M.P.; Humphrey, B.D.; Rosebrough, R.W.; McMurtry, J.P. AMP-activated protein kinase and carbohydrate response element binding protein: A study of two potential regulatory factors in the hepatic lipogenic program of broiler chickens. Comp. Biochem. Physiol. B Biochem. Mol. Biol. 2009, 154, 68–79. [Google Scholar] [CrossRef]
- Hu, X.; Liu, L.; Song, Z.; Sheikhahmadi, A.; Wang, Y.; Buyse, J. Effects of feed deprivation on the AMPK signaling pathway in skeletal muscle of broiler chickens. Comp. Biochem. Physiol. B Biochem. Mol. Biol. 2016, 191, 146–154. [Google Scholar] [CrossRef]
- Labbé, O.; Desarnaud, F.; Eggerickx, D.; Vassart, G.; Parmentier, M. Molecular cloning of a mouse melanocortin 5 receptor gene widely expressed in peripheral tissues. Biochemistry 1994, 33, 4543–4549. [Google Scholar] [CrossRef] [PubMed]
- Nimura, M.; Udagawa, J.; Hatta, T.; Hashimoto, R.; Otani, H. Spatial and temporal patterns of expression of melanocortin type 2 and 5 receptors in the fetal mouse tissues and organs. Anat. Embryol. 2006, 211, 109–117. [Google Scholar] [CrossRef] [PubMed]
- Takeuchi, S.; Takahashi, S. Melanocortin receptor genes in the chicken--tissue distributions. Gen. Comp. Endocrinol. 1998, 112, 220–231. [Google Scholar] [CrossRef] [PubMed]
- Chen, W.; Kelly, M.A.; Opitz-Araya, X.; Thomas, R.E.; Low, M.J.; Cone, R.D. Exocrine gland dysfunction in MC5-R-deficient mice: Evidence for coordinated regulation of exocrine gland function by melanocortin peptides. Cell 1997, 91, 789–798. [Google Scholar] [CrossRef] [PubMed]
- Ji, L.Q.; Hong, Y.; Tao, Y.X. Melanocortin-5 Receptor: Pharmacology and Its Regulation of Energy Metabolism. Int. J. Mol. Sci. 2022, 23, 8727. [Google Scholar] [CrossRef]
- An, J.J.; Rhee, Y.; Kim, S.H.; Kim, D.M.; Han, D.H.; Hwang, J.H.; Jin, Y.J.; Cha, B.S.; Baik, J.H.; Lee, W.T.; et al. Peripheral effect of alpha-melanocyte-stimulating hormone on fatty acid oxidation in skeletal muscle. J. Biol. Chem. 2007, 282, 2862–2870. [Google Scholar] [CrossRef]
- Rodrigues, A.R.; Pignatelli, D.; Almeida, H.; Gouveia, A.M. Melanocortin 5 receptor activates ERK1/2 through a PI3K-regulated signaling mechanism. Mol. Cell Endocrinol. 2009, 303, 74–81. [Google Scholar] [CrossRef]
- Singh, A.B.; Kan, C.F.; Dong, B.; Liu, J. SREBP2 Activation Induces Hepatic Long-chain Acyl-CoA Synthetase 1 (ACSL1) Expression in Vivo and in Vitro through a Sterol Regulatory Element (SRE) Motif of the ACSL1 C-promoter. J. Biol. Chem. 2016, 291, 5373–5384. [Google Scholar] [CrossRef]
- Dai, W.; Wang, K.; Zheng, X.; Chen, X.; Zhang, W.; Zhang, Y.; Hou, J.; Liu, L. High fat plus high cholesterol diet lead to hepatic steatosis in zebrafish larvae: A novel model for screening anti-hepatic steatosis drugs. Nutr. Metab. 2015, 12, 42. [Google Scholar] [CrossRef]
- Itkonen, H.M.; Brown, M.; Urbanucci, A.; Tredwell, G.; Ho Lau, C.; Barfeld, S.; Hart, C.; Guldvik, I.J.; Takhar, M.; Heemers, H.V.; et al. Lipid degradation promotes prostate cancer cell survival. Oncotarget 2017, 8, 38264–38275. [Google Scholar] [CrossRef]
- Bacon, C.W.; D’Orso, I. CDK9: A signaling hub for transcriptional control. Transcription 2019, 10, 57–75. [Google Scholar] [CrossRef] [PubMed]
- Chekmarev, J.; Azad, M.G.; Richardson, D.R. The Oncogenic Signaling Disruptor, NDRG1: Molecular and Cellular Mechanisms of Activity. Cells 2021, 10, 2382. [Google Scholar] [CrossRef] [PubMed]
- Cai, Q.; Dozmorov, M.; Oh, Y. IGFBP-3/IGFBP-3 Receptor System as an Anti-Tumor and Anti-Metastatic Signaling in Cancer. Cells 2020, 9, 1261. [Google Scholar] [CrossRef] [PubMed]
- Osman, R.H.; Shao, D.; Liu, L.; Xia, L.; Sun, X.; Zheng, Y.; Wang, L.; Zhang, R.; Zhang, Y.; Zhang, J.; et al. Expression of mitochondria-related genes is elevated in overfeeding-induced goose fatty liver. Comp. Biochem. Physiol. B Biochem. Mol. Biol. 2016, 192, 30–37. [Google Scholar] [CrossRef] [PubMed]
- Liu, L.; Wang, Q.; Wang, Q.; Zhao, X.; Zhao, P.; Geng, T.; Gong, D. Role of miR29c in goose fatty liver is mediated by its target genes that are involved in energy homeostasis and cell growth. BMC Vet. Res. 2018, 14, 325. [Google Scholar] [CrossRef]
- Zhang, R.; Zhu, L.; Zhang, Y.; Shao, D.; Wang, L.; Gong, D. cDNA cloning and the response to overfeeding in the expression of stearoyl-CoA desaturase 1 gene in Landes goose. Gene 2013, 512, 464–469. [Google Scholar] [CrossRef]
- Livak, K.J.; Schmittgen, T.D. Analysis of relative gene expression data using real-time quantitative PCR and the 2(-Delta Delta C(T)) Method. Methods 2001, 25, 402–408. [Google Scholar] [CrossRef]
Disclaimer/Publisher’s Note: The statements, opinions and data contained in all publications are solely those of the individual author(s) and contributor(s) and not of MDPI and/or the editor(s). MDPI and/or the editor(s) disclaim responsibility for any injury to people or property resulting from any ideas, methods, instructions or products referred to in the content. |
© 2023 by the authors. Licensee MDPI, Basel, Switzerland. This article is an open access article distributed under the terms and conditions of the Creative Commons Attribution (CC BY) license (https://creativecommons.org/licenses/by/4.0/).