2.1. Monitoring the Evolution of Open Circuit Potential (OCP) during Immersion Time
The grade 5 titanium alloy, Ti6Al4V, is considered the best choice for permanent implants. This can be attributed to its biocompatibility, osseo-integrating property, high strength/weight ratio, higher corrosion resistance, non-magnetic properties, high hardness, good mechanical strength, etc. [
20,
21].
From the point of view of the test solution, Hank’s solution is chosen, simulating the human body’s blood [
19]. The initial interactions of blood with an endosseous implant can influence clot formation, eventual migration, and the differentiation of osteogenic cells in the healing compartment. As the migration of osteogenic cells is the hallmark of post-condition, both the formation of a fibrin scaffold and the activation of blood cells trapped at the implant interface could play a key role in this first stage of the peri-implant bone healing period. Thus, an understanding of the establishment of the blood/implant interface may be of considerable importance in understanding the early mechanisms of peri-implant healing [
22].
The open-circuit potential (OCP) method, or evolution of free potential vs. time, is the starting point for all types of electrochemical experiments to study the corrosion phenomenon [
20]. The open-circuit potential method is a more qualitative than quantitative method for determining the behavior of a material in the corrosion process in a certain environment and shows its tendency to oxidation or passivation in an electrochemical environment [
20]. OCP is a mixed potential determined by the oxidation and reduction reactions that take place at the surface of a metal electrode [
20,
23].
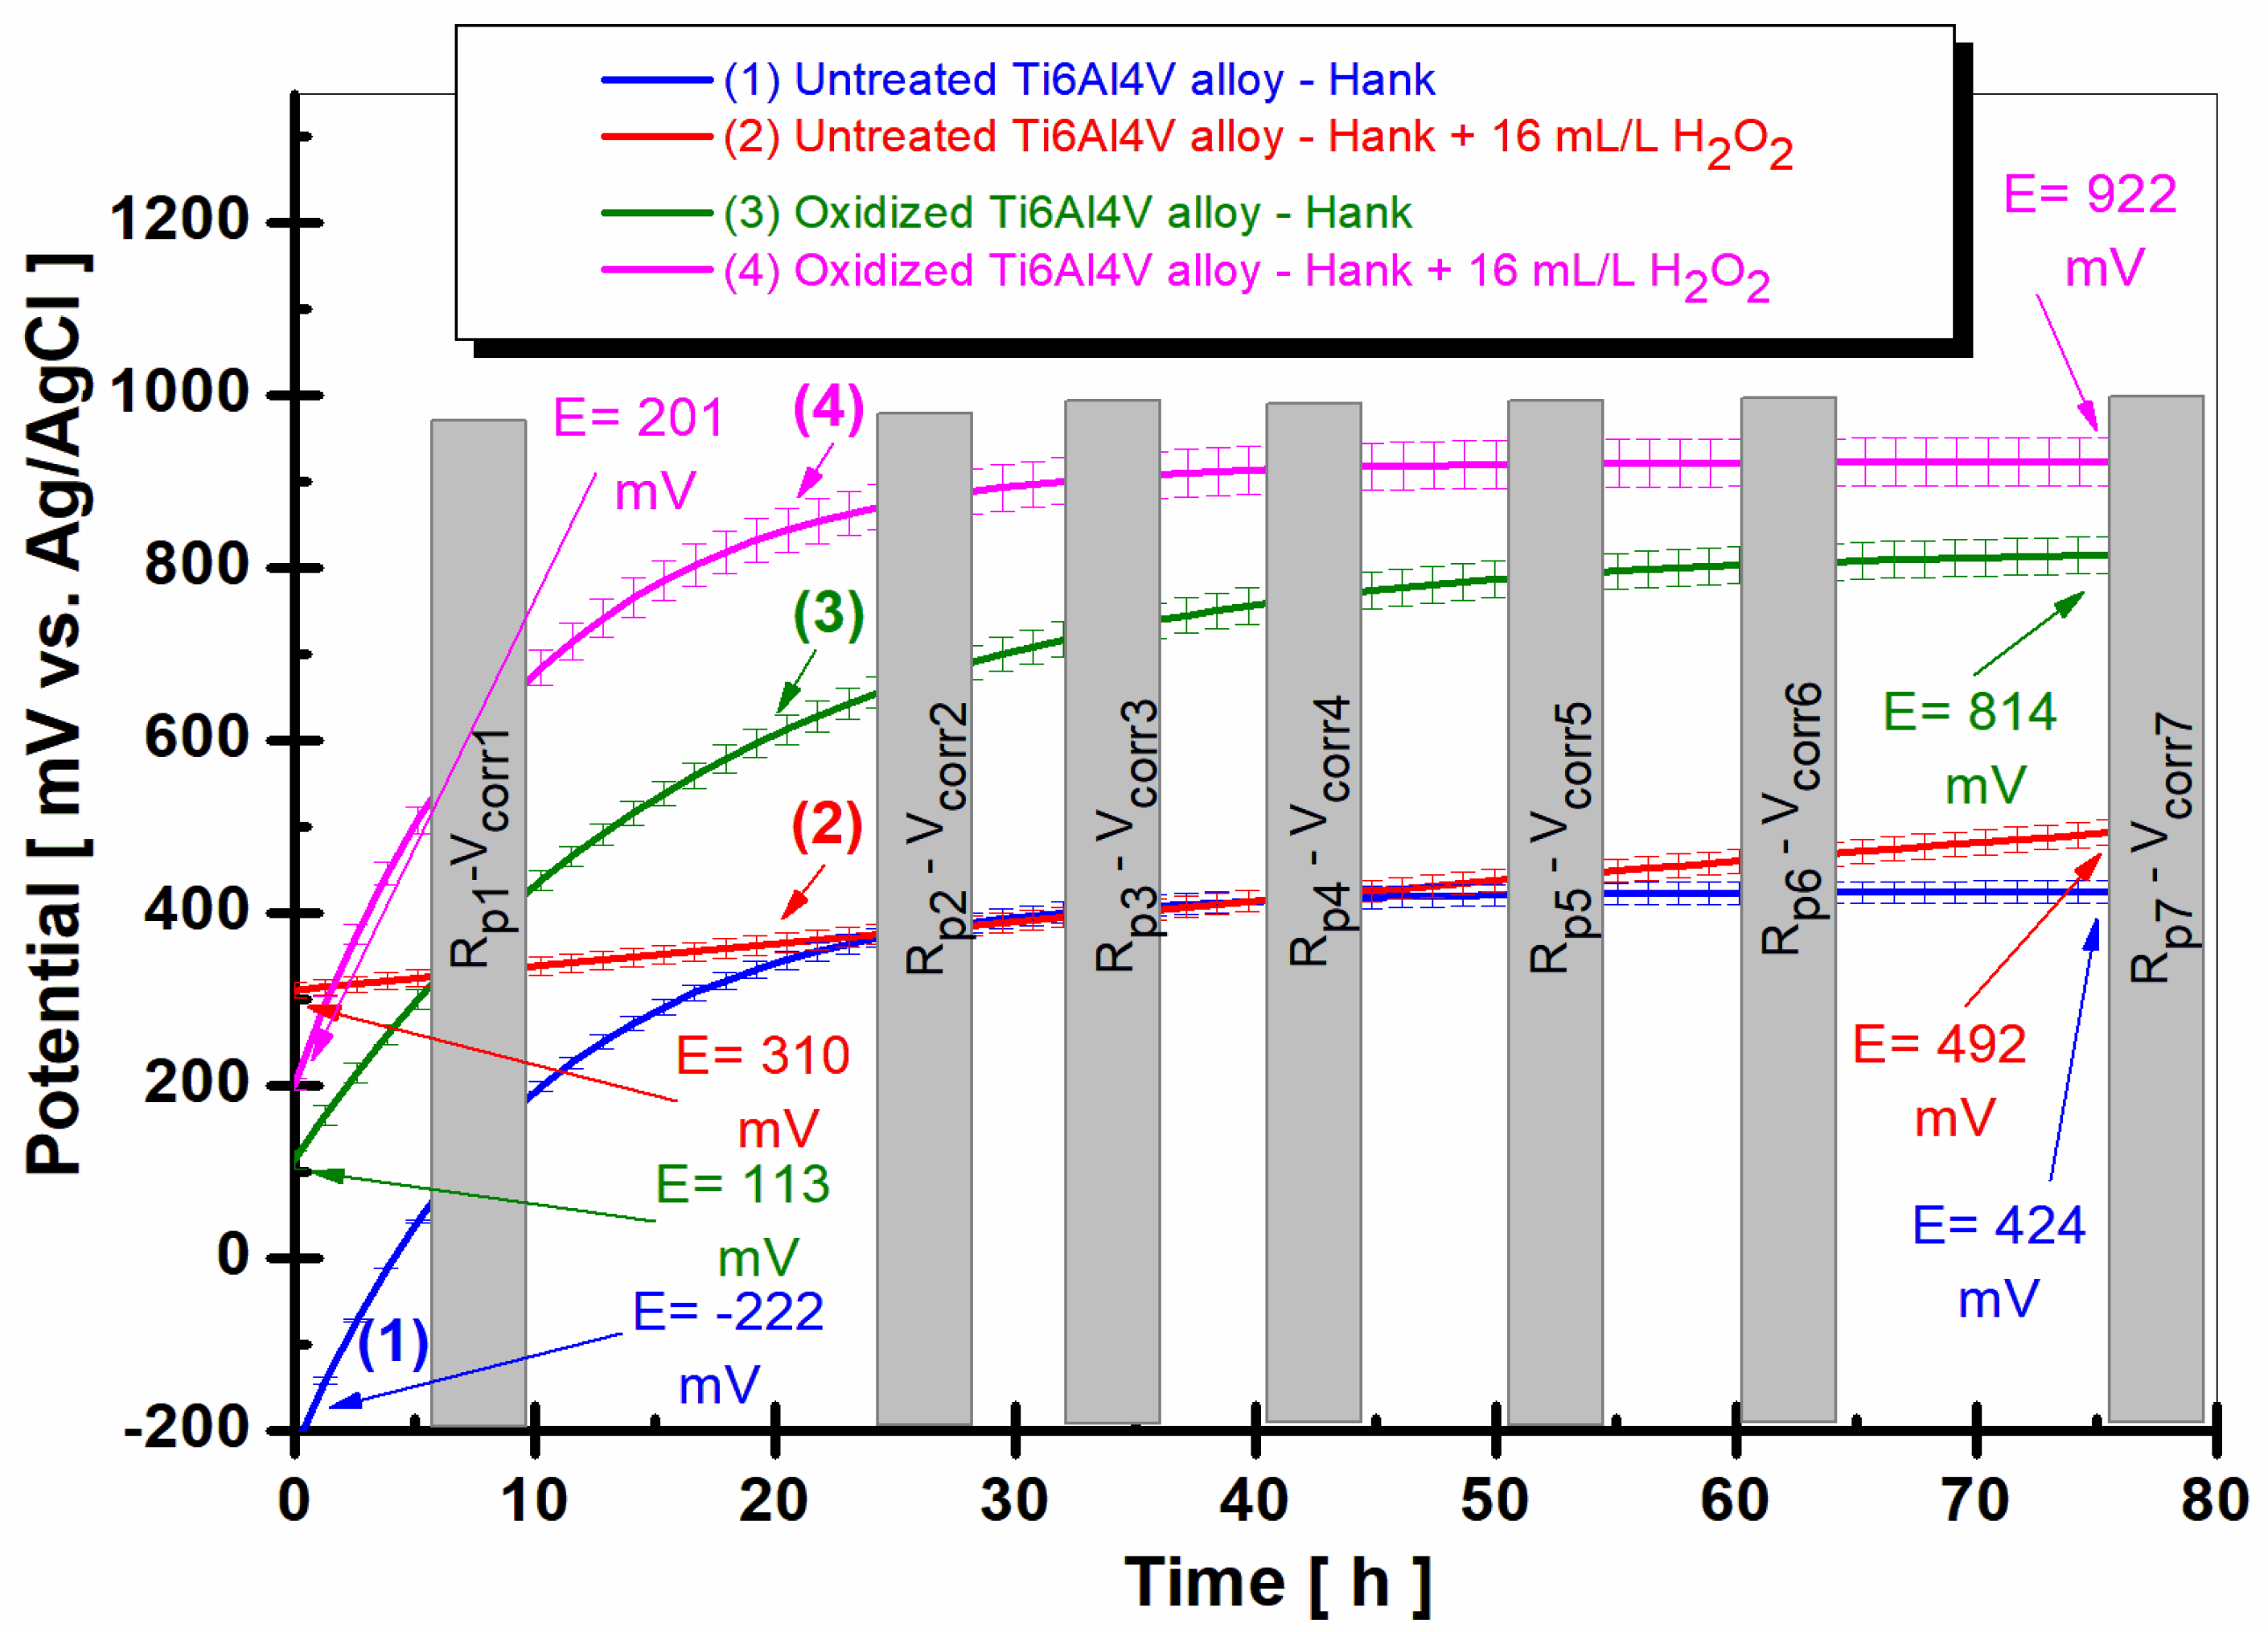
Figure 1 shows the evolution of the free potential of the untreated and electrochemically oxidized grade 5 Ti6Al4V alloy immersed for a period of 75.5 h in Hank’s solution and Hank’s solution doped with hydrogen peroxide. To provide a better understanding of the relationship between free potential and corrosion behavior at the molecular level, we will discuss the underlying molecular processes corresponding to the observed changes in free potential.
The free potential (OCP) observed in
Figure 1 is the result of the balance of oxidation and reduction reactions occurring on the titanium alloy surface. These reactions involve electron transfer between the metal surface and the surrounding environment, and their rates determine the overall free potential of the system.
For the untreated titanium alloy immersed in Hank’s solution, the initially negative potential suggests a higher rate of oxidation reactions (corrosion) at the metal surface. These reactions involve the transfer of electrons from the metal surface to the surrounding solution, leading to the dissolution of the metal ions [
20]. As the potential shifts to more positive values, the rate of reduction reactions (passivation) increases. This increase indicates the formation of a protective oxide layer, such as TiO
2, on the alloy surface [
24]. This layer reduces the corrosion rate by acting as a barrier between the metal and the corrosive environment, leading to a more stable potential over time.
In the case of the untreated titanium alloy in Hank’s solution doped with hydrogen peroxide, the initially higher potential indicates a lower corrosion rate due to the passivating effect of the H
2O
2 [
24]. Hydrogen peroxide can react with the titanium surface to promote the growth of a TiO
2 layer, which contributes to the passivation of the surface [
24,
25,
26,
27,
28]. The gradual shift to even more positive values suggests further passivation of the alloy surface, which could be attributed to the competing processes of TiO
2 growth and dissolution in the presence of hydrogen peroxide [
24,
25,
26,
27,
28]. As hydrogen peroxide can also dissolve the oxide layer, the dynamic equilibrium between TiO
2 growth and dissolution may result in the observed free potential changes [
24,
25,
26,
27,
28].
Elemental analysis of oral mucosa around Ti and Ti alloy dental implants has demonstrated increased release of Ti from implant surfaces in inflamed sites compared to healthy tissues, although the exact mechanisms underlying the observation have not been determined [
23]. During inflammation, H
2O
2 levels can become elevated because they are produced directly by bacteria (at levels that can exceed 5 mM) or by immune cells that have migrated to the inflamed site [
29,
30]. The corrosion resistance of both untreated and oxidized surfaces in Hank’s solution doped with hydrogen peroxide is also studied to study the influence of hydrogen peroxide as an inflammatory compound.
The oxidized titanium alloy immersed in Hank’s solution as well as in Hank’s doped with hydrogen peroxide solution starts from the beginning of immersion time with more positive values of open-circuit potential, 113 mV vs. Ag/AgCl (curve 3) and 201 mV vs. Ag/AgCl, respectively, in curve (4). The open-circuit potential of oxidized titanium alloy increases slowly with immersion time until around 60 h, after being constant and revealing at the end of monitoring a positive value of 814 mV vs. Ag/AgCl. The potential difference between the oxidized and untreated alloys after 75.5 h of immersion in Hank’s solution is ∆E = 390 mV.
The most positive (noble) potential is recorded for the oxidized titanium alloy immersed in Hank’s solution doped with hydrogen peroxide, having a value of 201 mV vs. Ag/AgCl, which moves towards even more positive (noble) values after immersion up to about 30 h, after which the value of the free potential remains approximately constant at 922 mV vs. Ag/AgCl, curve (4). Thus, the potential difference between the untreated and oxidized alloy immersed in Hank’s solution doped with hydrogen peroxide becomes even greater, having a value of ∆E = 430 mV. This behavior could be explained by the dual role of hydrogen peroxide in promoting the growth and dissolution of TiO
2 on the surface of the titanium alloy [
24,
25,
26,
27,
28].
For the untreated alloy in the presence of hydrogen peroxide (curve 2), the initially more positive potential indicates a lower corrosion rate, which could be attributed to the passivating effect of H
2O
2-promoted TiO
2 growth [
24]. However, the simultaneous dissolution of the oxide layer by hydrogen peroxide creates a dynamic equilibrium between the oxide layer growth and dissolution processes [
24,
25,
26,
27,
28], leading to the observed gradual shift of the potential to more positive values. Similarly, for the oxidized alloy in the presence of hydrogen peroxide (curve 4), the initially higher potential indicates better corrosion resistance due to the pre-existing oxide layer, with the continuous shift to more positive values suggesting further passivation of the alloy surface because of the competing processes of TiO
2 growth and dissolution in the presence of hydrogen peroxide [
24,
25,
26,
27,
28]:
Titanium present in a titanium alloy can react with hydrogen peroxide, resulting in the formation of a titanium oxide film, as shown in Equation (1). Moreover, some of the TiO
2 could be hydrolyzed (see Equations (2) and (3)). A hydration reaction, Equation (4), occurs simultaneously with the formation of Ti-OH functional groups, Equation (5). Hydrated and hydrolyzed titanium oxide (TiO
2) can cause the formation of negatively charged surfaces (Equations (5) and (6)), which could be involved in the increase in the free potential to a more negative value during the immersion time, followed by the transition to a more positive value, as explained by Equation (1) [
24].
2.2. Evaluation of Polarization Resistance (Rp) of the Untreated Grade 5 Ti6Al4V Alloy and the Electrochemically Oxidized Alloy under the Influence of Hydrogen Peroxide in Biological Solution
Another direct current electrochemical method is the evaluation of polarization resistance (R
p) and corrosion rate (V
corr) from linear polarization (PL) curves. Linear polarization can be used to characterize the electrolyte-material pair by scanning the potential-current (i-E) domain over a narrow (linear) potential domain, where Tafel slopes can be plotted. On this narrow range in the vicinity of the corrosion potential, the obtained current response is linear [
20,
21].
The polarization resistance method involves obtaining multiple linear polarization curves and calculating the polarization resistance and corrosion rate using the Stern–Geary equation.
In the case of this research work, it is considered that the measurement of one hundred polarization curves is necessary to have 100 value points for the polarization resistance and 100 value points for the corrosion rate, respectively. Hence, each polarization resistance measurement sequence in the experimental protocol has 100 value points.
The polarization resistance (R
p) is defined as the variation of the potential relative to the variation of the current in the considered linear range, as follows:
The Stern–Geary equation was used to calculate corrosion current density as follows:
where:
icorr is the corrosion current density.
B—specific constant for each system: material/environment.
ba anodic Tafel slope.
bc the cathodic Tafel slope.
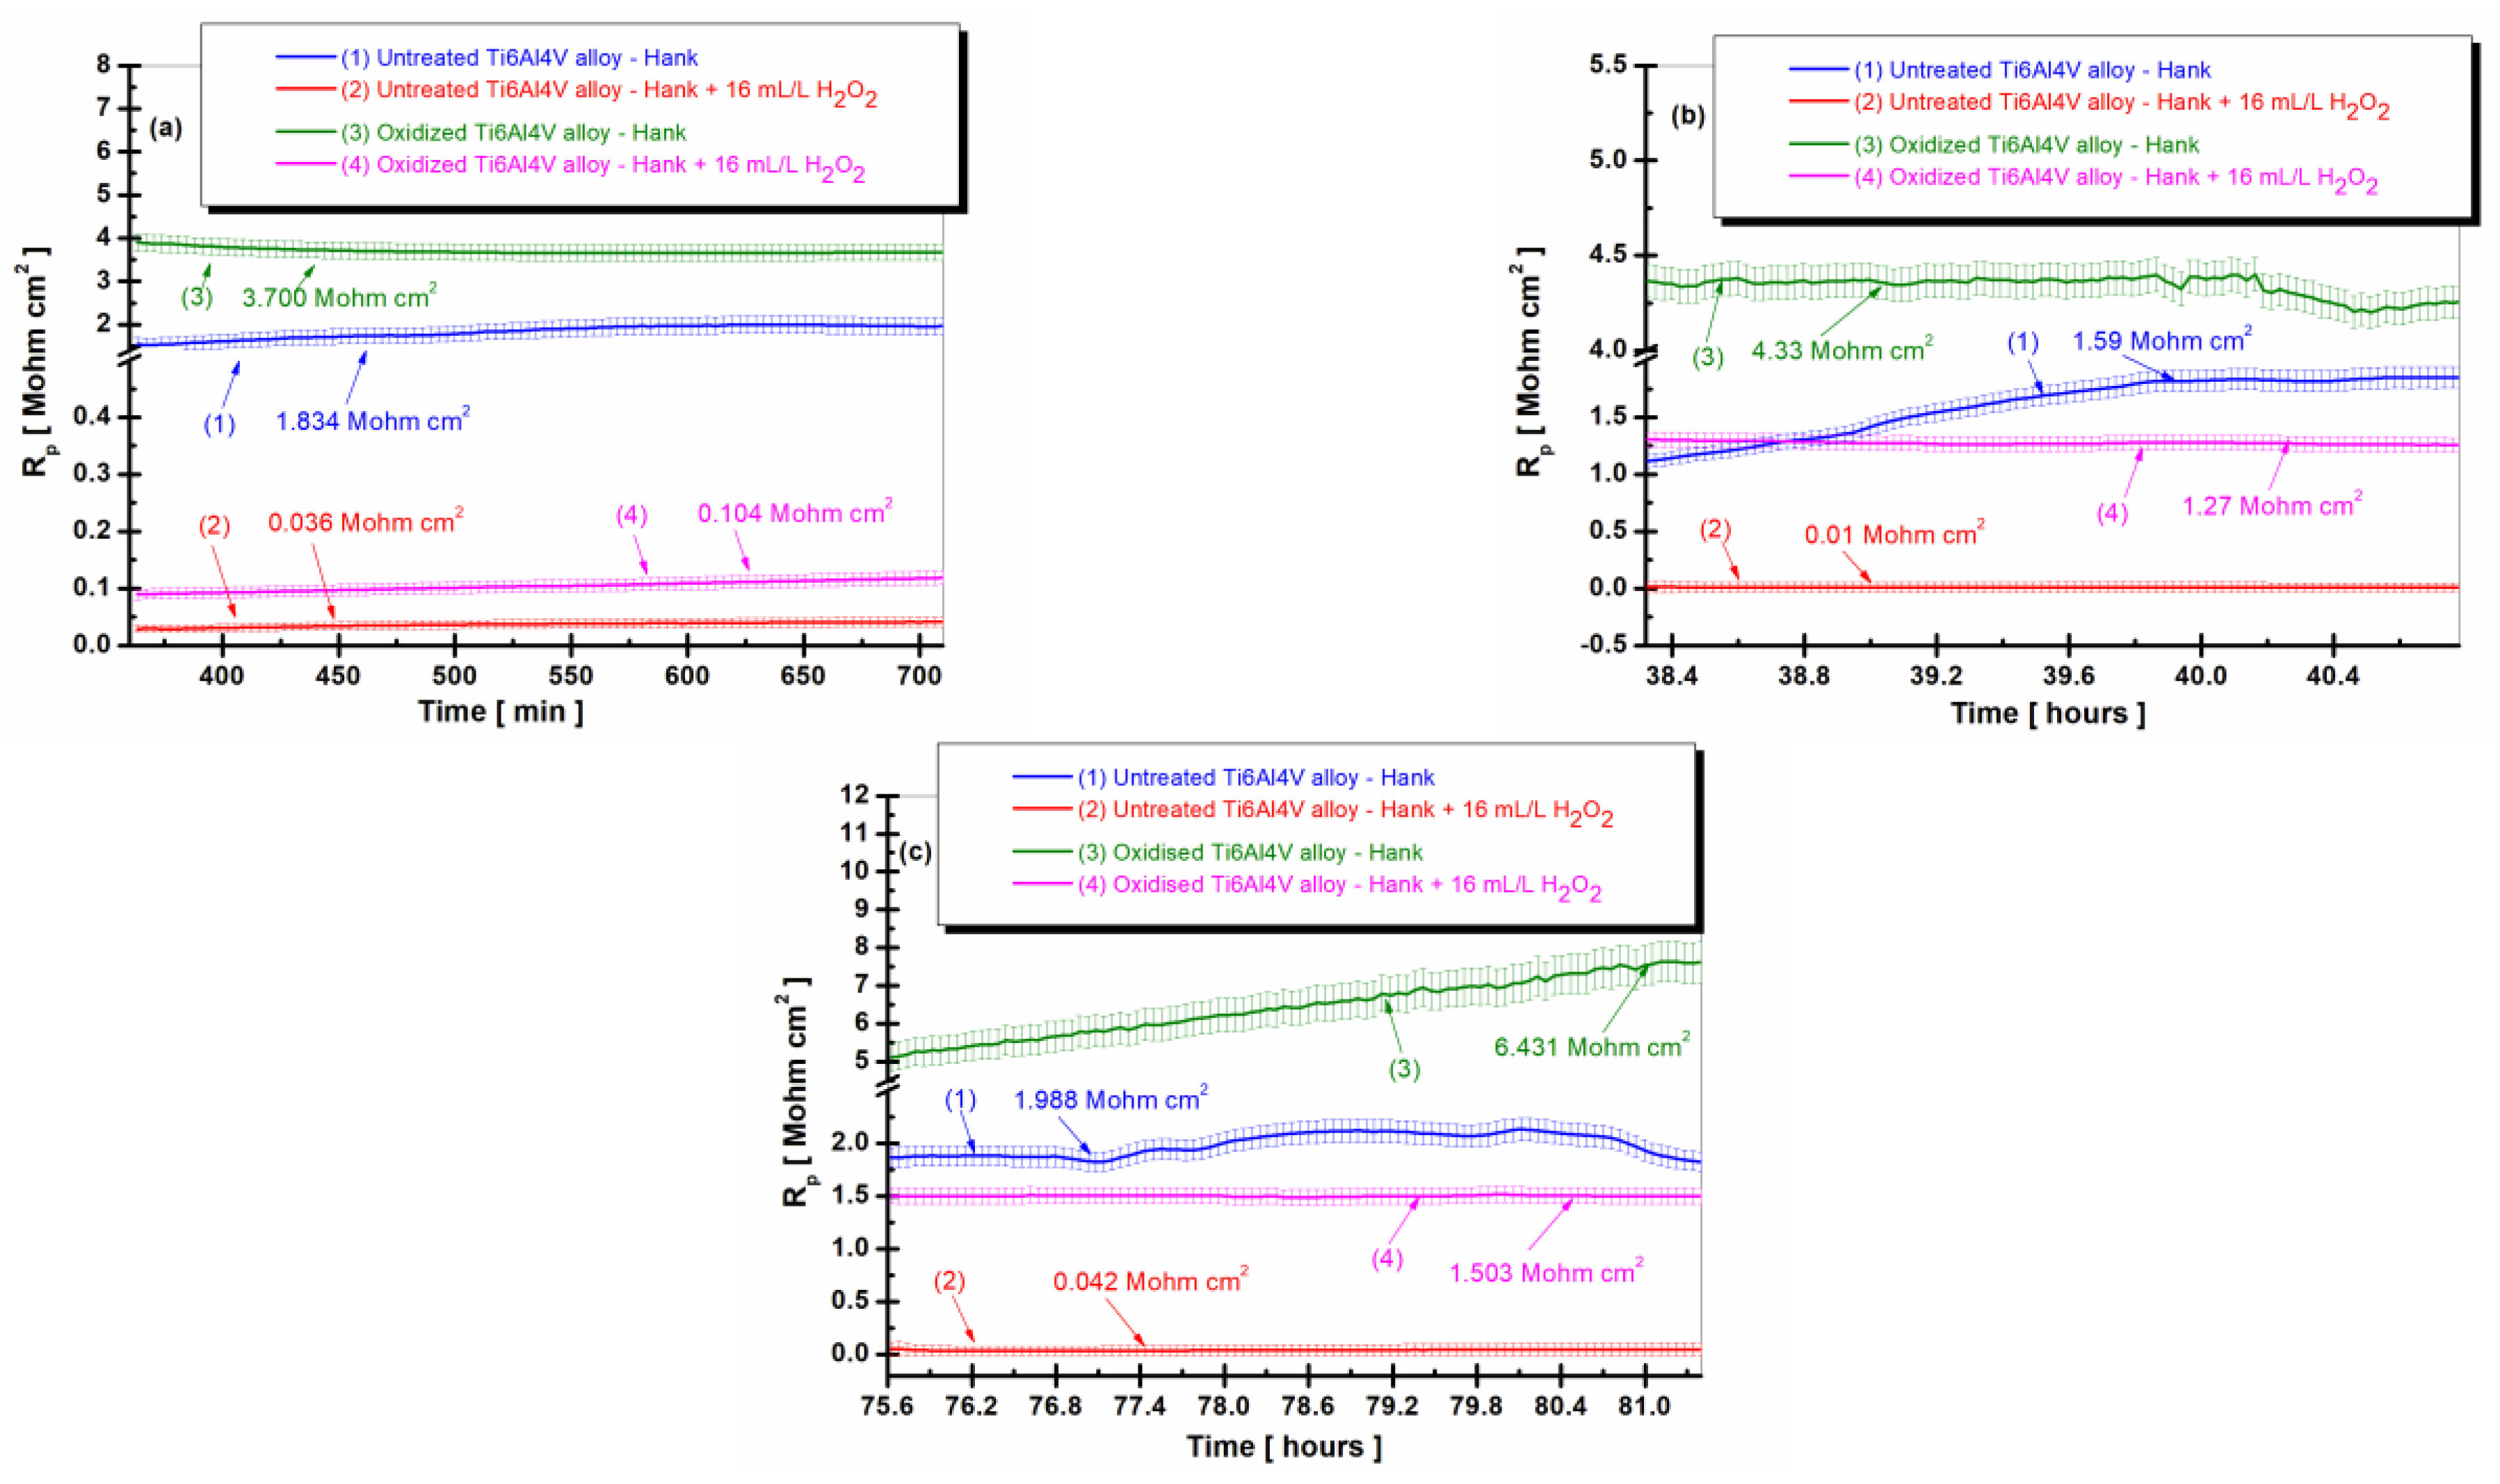
The comparative evolution of the polarization resistance for the untreated alloy and for the oxidized alloy with a titanium oxide film (TiO
2) is presented in
Figure 2a–c at three times the total immersion period of the samples in Hank’s biological solution and Hank’s doped with 16 mL/L H
2O
2.
Thus, after 6 h of immersion, in
Figure 2a, the polarization resistance (R
p) of the untreated titanium alloy in the Hank’s solution has a value of 1.834 Mohm·cm
2, curve (1), while the polarization resistance of the electrochemically oxidized titanium alloy presents constant values with stabilization at a value of 3700 Mohm·cm
2 at the end of the first measurement period, curve (3), being thus higher than the polarization resistance for the untreated alloy.
In the case of Hank’s biological solution doped with hydrogen peroxide, the polarization resistance of the untreated titanium alloy drops drastically to the value of 0.036 Mohm·cm2, being approximately fifty times lower as compared with the value from Hank’s solution, curve (2). For the electrochemically oxidized alloy, there is also a decrease in the polarization resistance after 6 h, Rp = 0.104 Mohm·cm2, with curve (4) being approximately 10 times higher than that of the untreated titanium alloy in the presence of the inflammatory compound, curve (2), where Rp = 0.036 Mohm·cm2.
After 38 h of immersion, as shown in
Figure 2b, the polarization resistance value of the untreated grade 5 Ti6Al4V alloy in Hank’s solution at the end of the measurement period is 1.59 Mohm·cm
2, lower than in the first measurement period, as shown in curve (1).
The values of the polarization resistance of the electrochemically oxidized Ti6Al4V alloy after 38 h in Hank’s solution are slightly higher than in the first measurement period, with Rp having a value of 4.33 Mohm·cm2 towards the end of the measurement period. Thus, even after 38 h, the Rp value for the electrochemically oxidized titanium alloy is approximately three times higher than the Rp value of the untreated titanium alloy, which confirms the effectiveness of the electrochemical oxidation process of the titanium alloy for improving the implant’s resistance to the aggressive action of biological fluids in the human body.
Furthermore, after 38 h of immersion (
Figure 2b), the value of the polarization resistance of the untreated grade 5 Ti6Al4V alloy immersed in Hank’s biological solution doped with H
2O
2 at the end of the measurement period is 0.010 Mohm·cm
2, curve (2), lower than in the first measurement period. The polarization resistance values of the electrochemically oxidized Ti6Al4V alloy after 38 h in Hank’s biological solution doped with H
2O
2 are slightly higher than in the first measurement period, with R
p having a value of 1.275 Mohm·cm
2 towards the end of the measurement period, curve (4). Thus, even after 38 h, the R
p value for the electrochemically oxidized titanium alloy is approximately 127 times higher than the R
p value of the untreated titanium alloy, which confirms the effectiveness of the electrochemical oxidation process of the titanium alloy for improving the implant’s resistance to the aggressive action of the inflammatory compound in the biological fluid.
After 75.5 h of immersion, as shown in
Figure 2c, in Hank’s and Hank’s biological solutions doped with H
2O
2, the same trend of the polarization resistance values is preserved for the two surfaces, the untreated immersed Ti6Al4V alloy and the electrochemically oxidized Ti6Al4V alloy. The value of the polarization resistance (R
p) of the untreated alloy in Hank’s solution increases slightly to R
p = 1.988 Mohm·cm
2, as shown in curve (1), and in Hank’s solution doped with H
2O
2 to R
p = 0.042 Mohm·cm
2. The values of the polarization resistance of the electrochemically oxidized alloy remain higher compared to those of the untreated alloy during this measurement period as well, with R
p being R
p = 6.431 Mohm·cm
2 in Hank’s solution and R
p = 1.503 Mohm·cm
2 in Hank’s solution doped with H
2O
2.
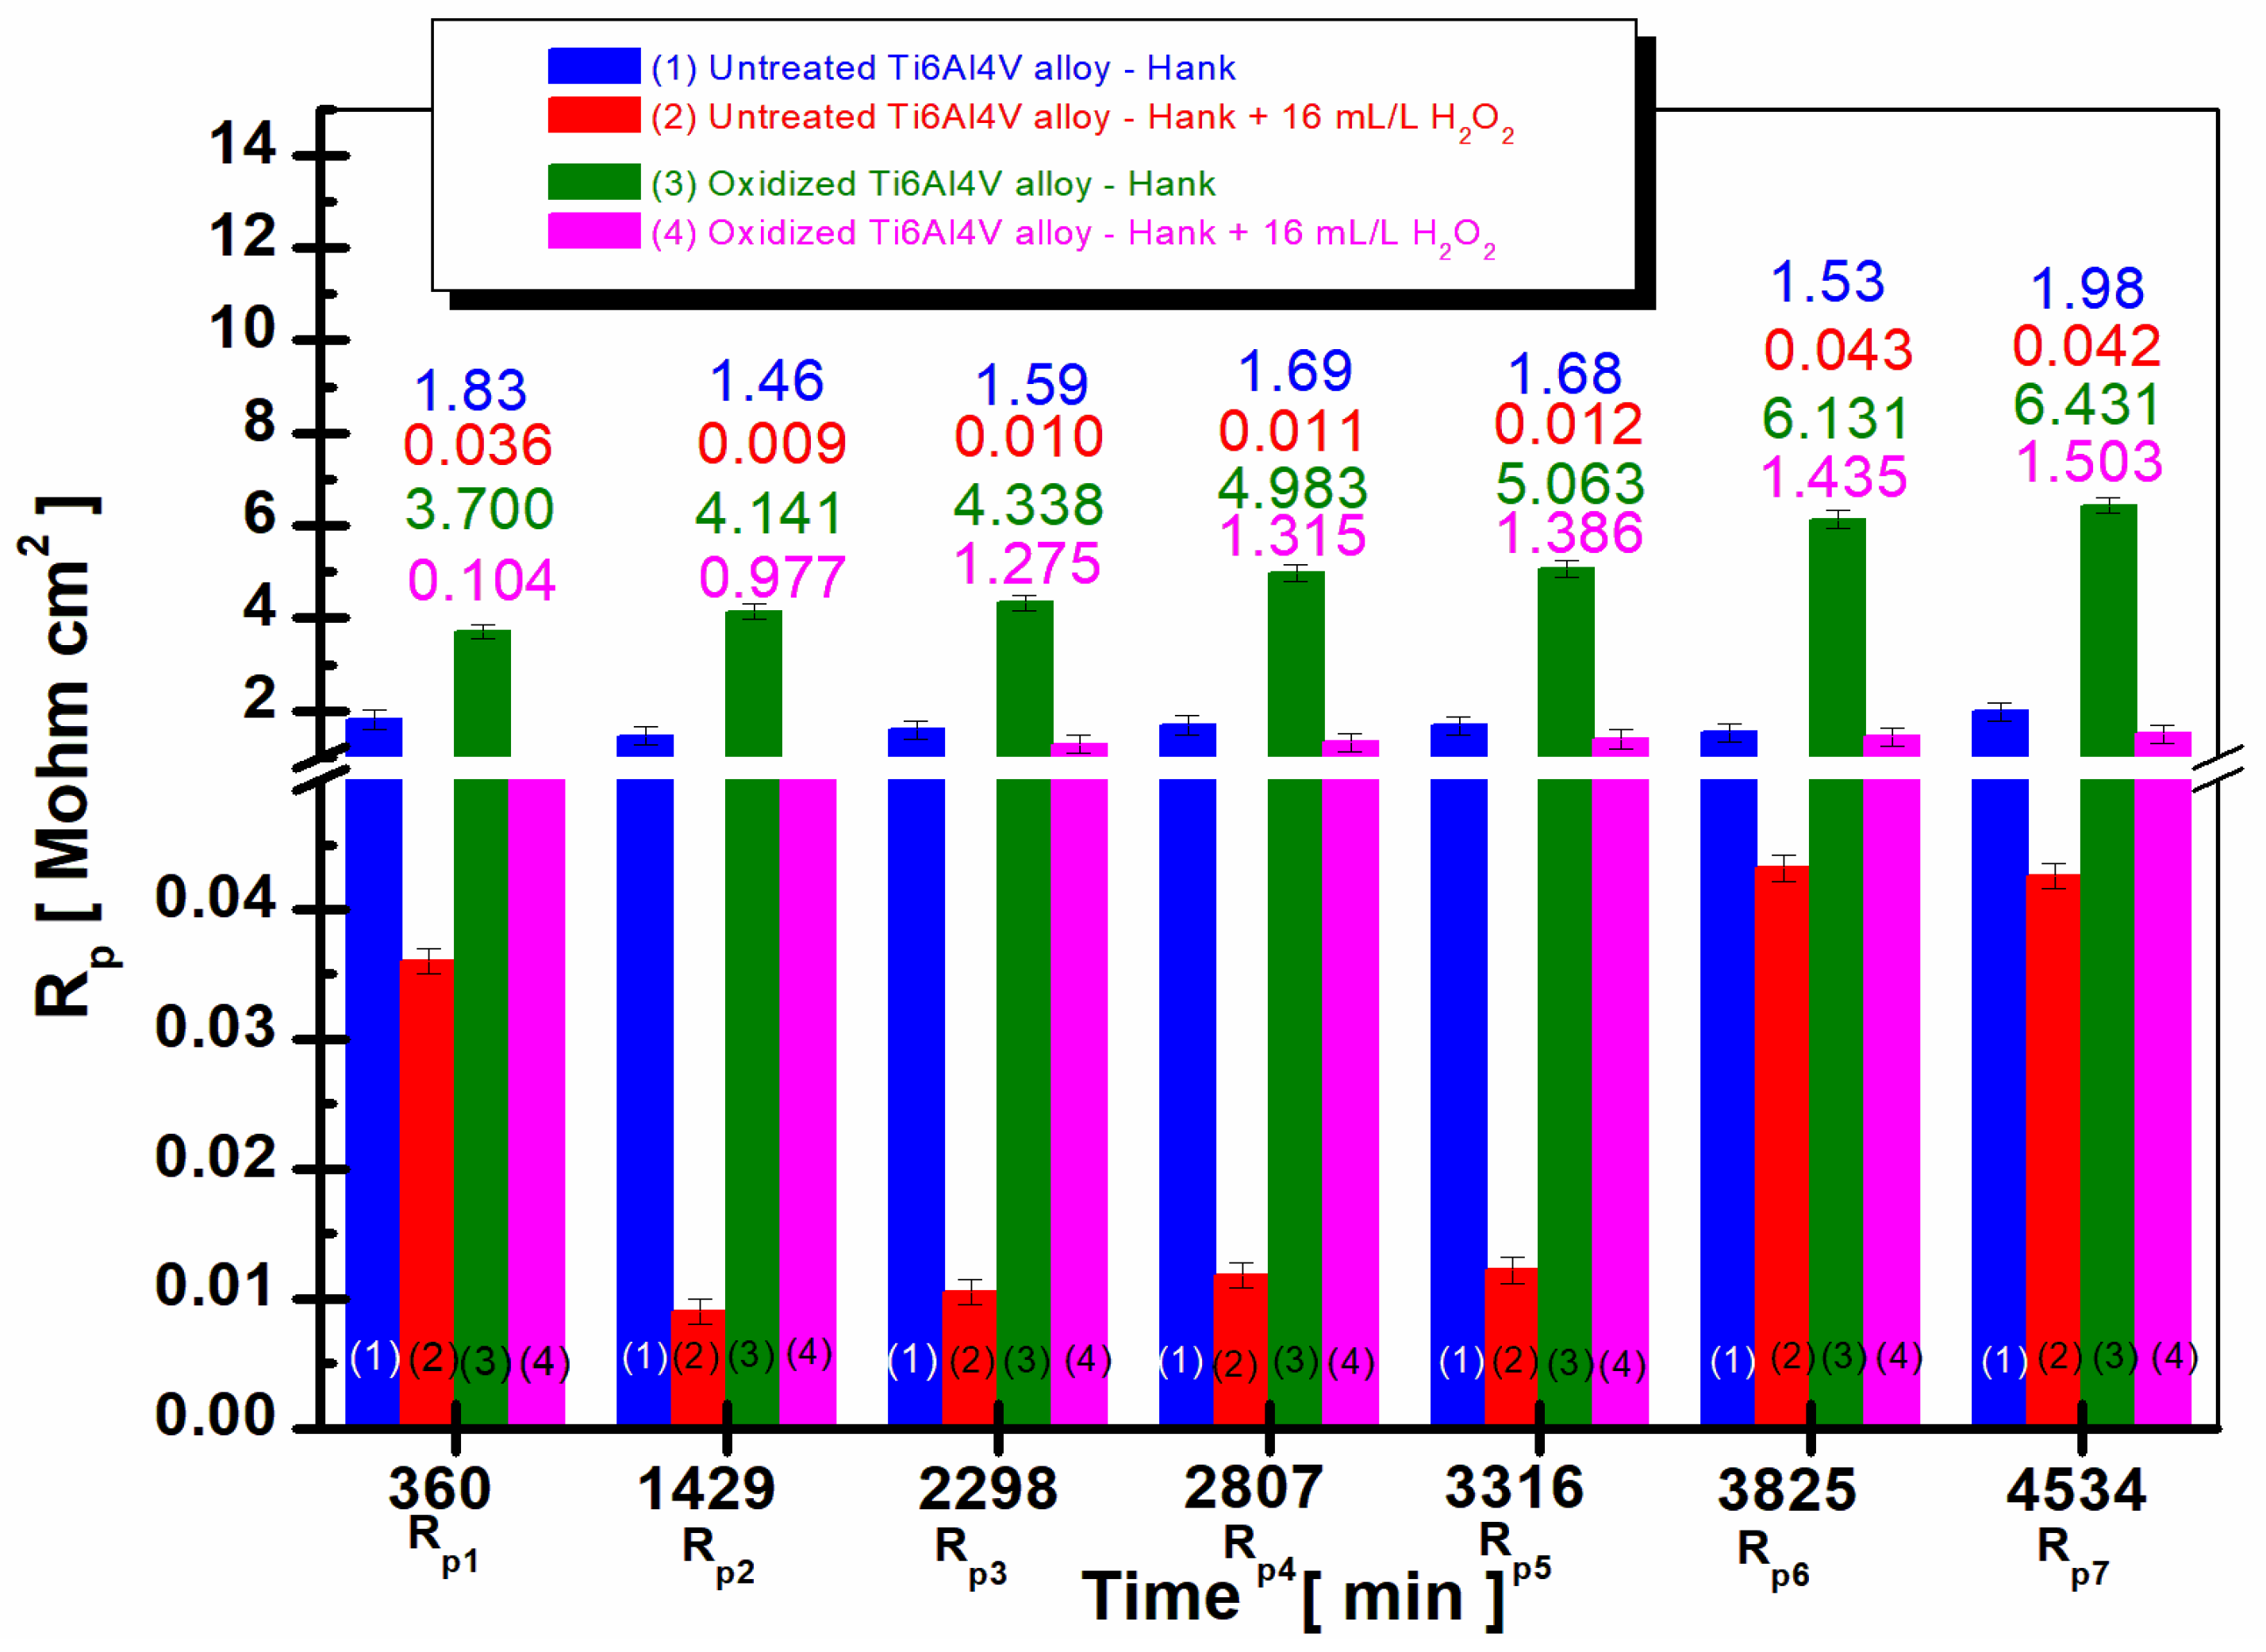
For a better highlighting of the results obtained regarding the evaluation of the polarization resistance throughout the immersion period in the two solutions,
Figure 3 presents the average values (the mean values) of all the polarization resistance values recorded at different immersion periods for the untreated Ti6Al4V alloy compared to the Ti6Al4V alloy electrochemically oxidized.
Figure 3 shows that in the case of electrochemically oxidized grade 5 Ti6Al4V alloy immersed in Hank’s solution, columns (3), and in the Hank’s solution doped with H
2O
2, columns (4), the polarization resistance values are higher compared to the values recorded for the untreated Ti6Al4V alloy, columns (1) and (2), at all times studied during the entire immersion period.
At the molecular level, the observed trends in polarization resistance can be understood by considering the surface reactions and oxide layer formation on the titanium alloy. For the untreated alloy immersed in Hank’s solution (1), the lower polarization resistance values can be attributed to the native oxide layer present on the alloy surface, which offers limited protection against corrosion. However, when the untreated alloy is immersed in Hank’s solution doped with H2O2 (2), the addition of hydrogen peroxide promotes the growth of a TiO2 layer while also causing its dissolution. This dynamic equilibrium between the oxide layer growth and dissolution processes leads to lower polarization resistance values, indicating a higher corrosion rate for the untreated alloy in the presence of H2O2.
On the other hand, for the electrochemically oxidized Ti6Al4V alloy, the presence of a thicker TiO2 layer offers improved protection against corrosion, as evidenced by the higher polarization resistance values observed in both Hank’s solution (3) and Hank’s solution doped with H2O2 (4). The continuous increase in polarization resistance values with immersion time for the oxidized alloy can be attributed to the further growth and passivation of the TiO2 layer on the alloy surface, which enhances the alloy’s resistance to the aggressive action of biological fluids and the inflammatory compounds present in the solutions.
In addition, in the case of the electrochemically oxidized Ti6Al4V alloy, an increase in the values of the polarization resistance is observed with the increase in immersion time. If, at the first measurement, the electrochemically oxidized alloy has a value of Rp1 = 0.104 Mohm·cm2, at the end of the 80 h monitoring, it reaches a value of Rp7 = 1.503 Mohm·cm2, a behavior that demonstrates the effectiveness of the electrochemical oxidation process of the titanium alloy for improving the resistance of the implant to the aggressive action of biological fluids.
The same trend is observed in Hank’s solution doped with H2O2 for the electrochemically oxidized titanium alloy, increasing the polarization resistance with the immersion time. At the first measurement, column (3), Rp1 = 3.700 Mohm·cm2 at the end of 80 h immersion, the polarization resistance value increases to Rp7 = 6.431 Mohm·cm2. The increase in the polarization resistance values in the case of the electrochemically oxidized titanium alloy is due to the presence of the TiO2 layer, which has superior insulating properties than that of native titanium oxide formed on the untreated alloy.
If for the electrochemically oxidized Ti6Al4V alloy, an increase in the polarization resistance values is observed with increasing immersion time, for the untreated Ti6Al4V alloy, it is observed that the polarization resistance values are lower and show a slight decrease after 38 h of immersion compared to the value obtained after 360 min and a very slight increase at the end of the immersion period for both Hank’s biological solution and Hank’s doped with H2O2, columns (1) and (2). The observed behavior results from the non-uniform native titanium oxide film on the untreated alloy surface, which accelerates degradation compared to electrochemically oxidized titanium alloy counterparts.
2.3. Evaluation of the Corrosion Rate (Vcorr) of the Untreated Ti6Al4V Alloy and the Electrochemically Oxidized Alloy
The corrosion rate calculated according to Equation (10) is expressed as corrosion current density (with units of measurement, for example, mA/cm
2) and can be converted into penetration index (with units of measurement, for example, mm/an) with the help of Faraday’s laws, considering the oxidation reaction, the equivalent weight (electrochemical equivalent, μ
eq) and the valence of the respective metal, n. The electrochemical equivalent for pure elements is the ratio between the atomic weight (u.a.m) and the number of electrons transferred in the oxidation reaction:
where:
The electrochemical equivalent of a substance denotes the mass of that substance accumulated on one of the electrodes as a 1 ampere current flows through it for a 1 s duration. In this case, the formula for finding electrochemical equivalents is as follows:
where M is the mass of the substance and q is the charge passed. q = I t, where I is the applied current and t is the time.
The electrochemical equivalent of titanium is about sixteen for the reduction reaction in an acidic medium and about 12 for the oxidation reaction.
For alloys, the electrochemical equivalent is obtained by adding the electrochemical equivalent of each element in the alloy.
The charge transferred during an electrochemical process is related to the amount of material passing through the corrosion half-reaction of R species (a metallic material under the corrosion process) by the following equation:
The change in reactant mass, R, is related to the current flow in Equation (12). The relationship is given by Faraday’s Law, where Q is the charge (in units of C-coulombs) resulting from the electrolytic reaction in Equation (12), z is the number of electrons transferred per reaction, F is Faraday’s constant (96.485 C/mol) and N is the number of moles of R that have gone through the reaction in Equation (13). Faraday’s law is the basis for converting corrosion current density to penetration index and corrosion rate to mass loss.
The charge, Q, can be defined in terms of electric current, where i is the current (in units of A) and t is the duration (in units of s) of the electrolysis of the specie(s) R, as in Equation (14).
By combining Equations (13) and (14) and rearranging, one can determine the number of moles of material, N, that react (corrode) each time (Equation (15)).
By using Faraday’s Law in this form, the basic equation for determining corrosion rates is obtained. To calculate the corrosion rate from the point of view of the penetration rate (penetration index), V
corr(ip), the definitions of i
corr and Faraday’s Law are shown in Equations (8)–(15), respectively, and the density of the metal (in units of g/cm
3) and a proportionality constant, K
p, are shown in Equation (16). The penetration rate can be calculated in several useful units, given the correct proportionality constant.
where μ
eq—electrochemical equivalent; ρ—metal density in g/cm
3.
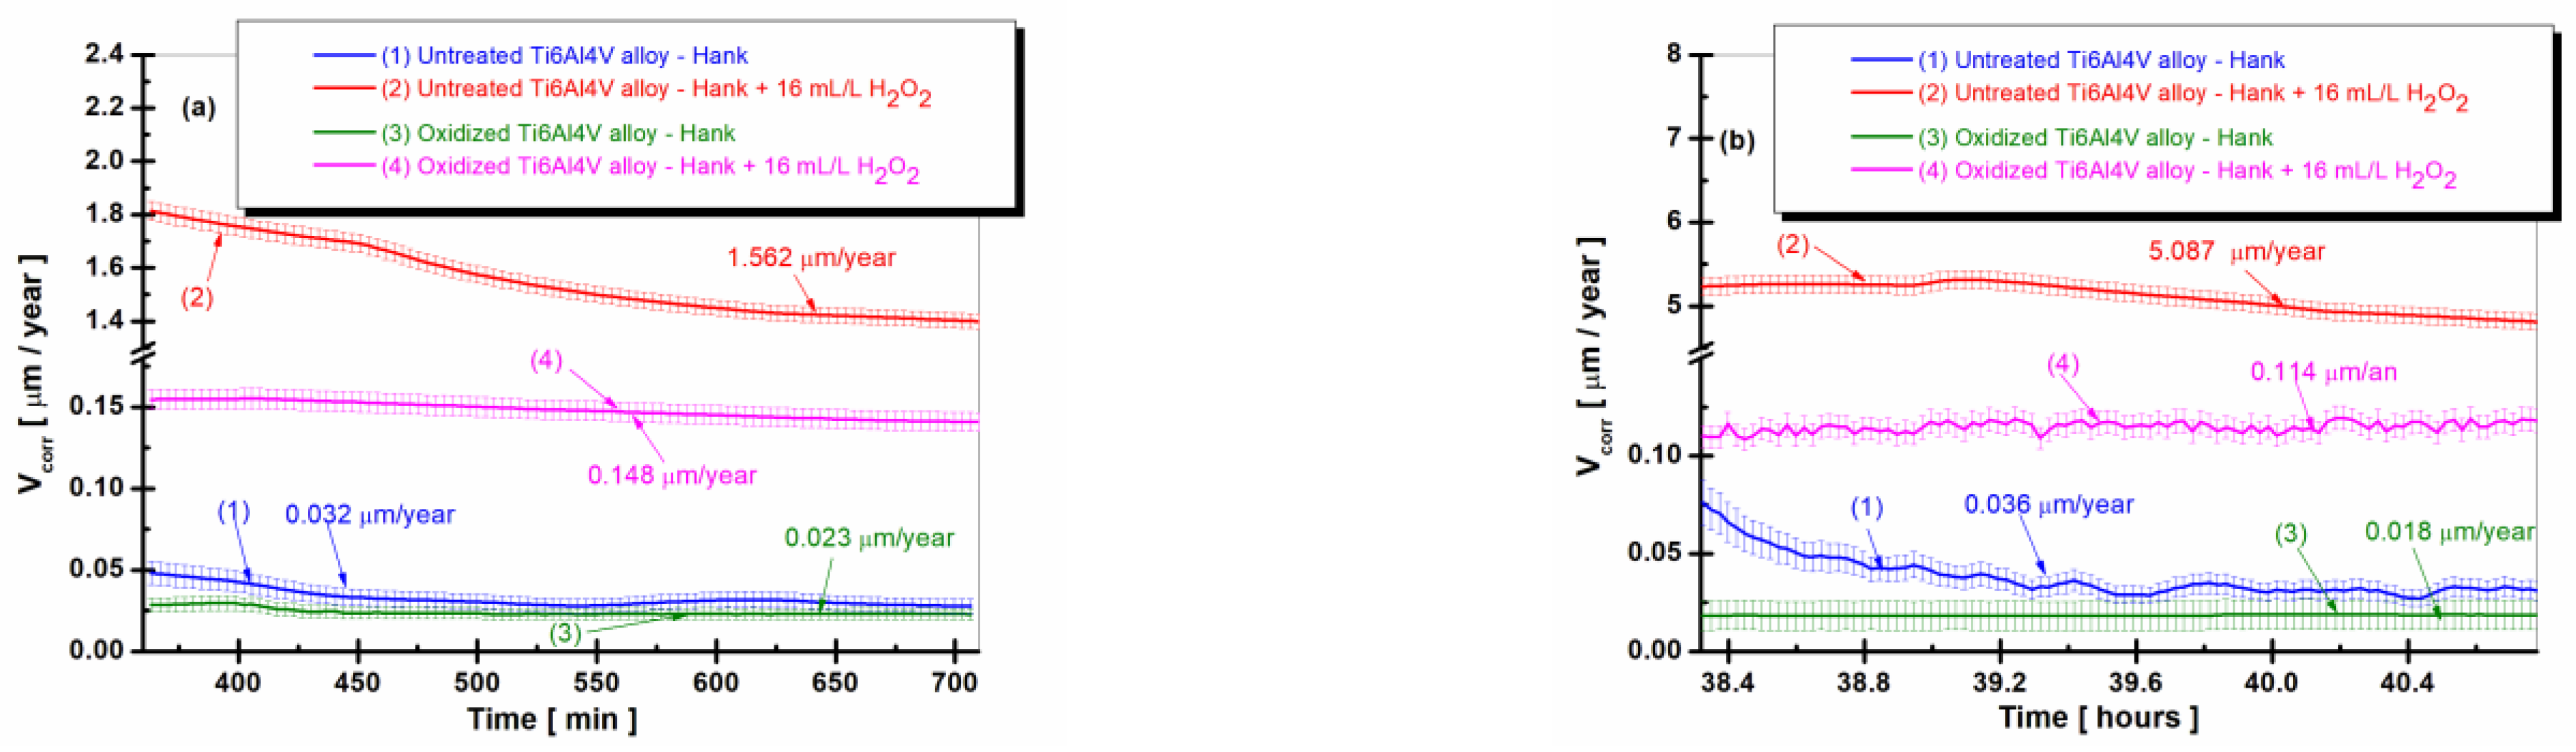
The variation of the corrosion rate expressed as a penetration index for the untreated alloy and for the oxidized alloy having the titanium oxide (TiO
2) film on its surface is shown in
Figure 4a–c at three times the total immersion period of the samples immersed in Hank’s biological solution and Hank’s doped with H
2O
2, and in
Figure 5 as an average value at all times studied during the entire immersion period.
From
Figure 4a–c, it can be seen that the values of the corrosion rate (V
corr) for the untreated Ti6Al4V alloy immersed in Hank’s biological solution and Hank’s solution doped with H
2O
2, curves (1) and (2), are higher than the corrosion rate values recorded for the electrochemically controlled oxidized Ti6Al4V alloy having the titanium oxide (TiO
2) film formed on its surface for all measurement periods during immersion. Thus, after 6 h of immersion (
Figure 4a), the corrosion rate (V
corr) of the untreated titanium alloy immersed in Hank’s solution doped with H
2O
2 has a slight decrease from immersion, with stabilization at a value of 1.562 µm/year (curve (2)) having the highest corrosion rate. The value of the corrosion rate of the electrochemically oxidized titanium alloy shows constant values with stabilization at a value of 0.148 µm/year at the end of the first measurement period (curves (4)), having a ten times lower value than that of the untreated alloy. After 38 h of immersion, in
Figure 4b, the corrosion rate values of the untreated Ti6Al4V alloy show a slight increase and oscillations, so that at the end of this measurement period, the value of V
corr is 5.087 µm/year, higher than in the first measurement period.
The corrosion rate values of the electrochemically oxidized Ti6Al4V alloy after 38 h are slightly lower than in the first measurement period, with Vcorr having a value of 0.114 µm/year towards the end of the measurement period. Consequently, even after 38 h, the corrosion rate (Vcorr) for the electrochemically oxidized titanium alloy is 44 times lower than that of the untreated titanium alloy. This result underscores the effectiveness of the electrochemical oxidation process in enhancing the implant’s resistance to the aggressive action of biological fluids within the human body.
Thus, even after 38 h, the Vcorr for the electrochemically oxidized titanium alloy is 44 times lower than the Vcorr for the untreated titanium alloy, which confirms the effectiveness of the electrochemical oxidation process of the titanium alloy for improving the resistance of the implant to the aggressive action of biological fluids in the human body.
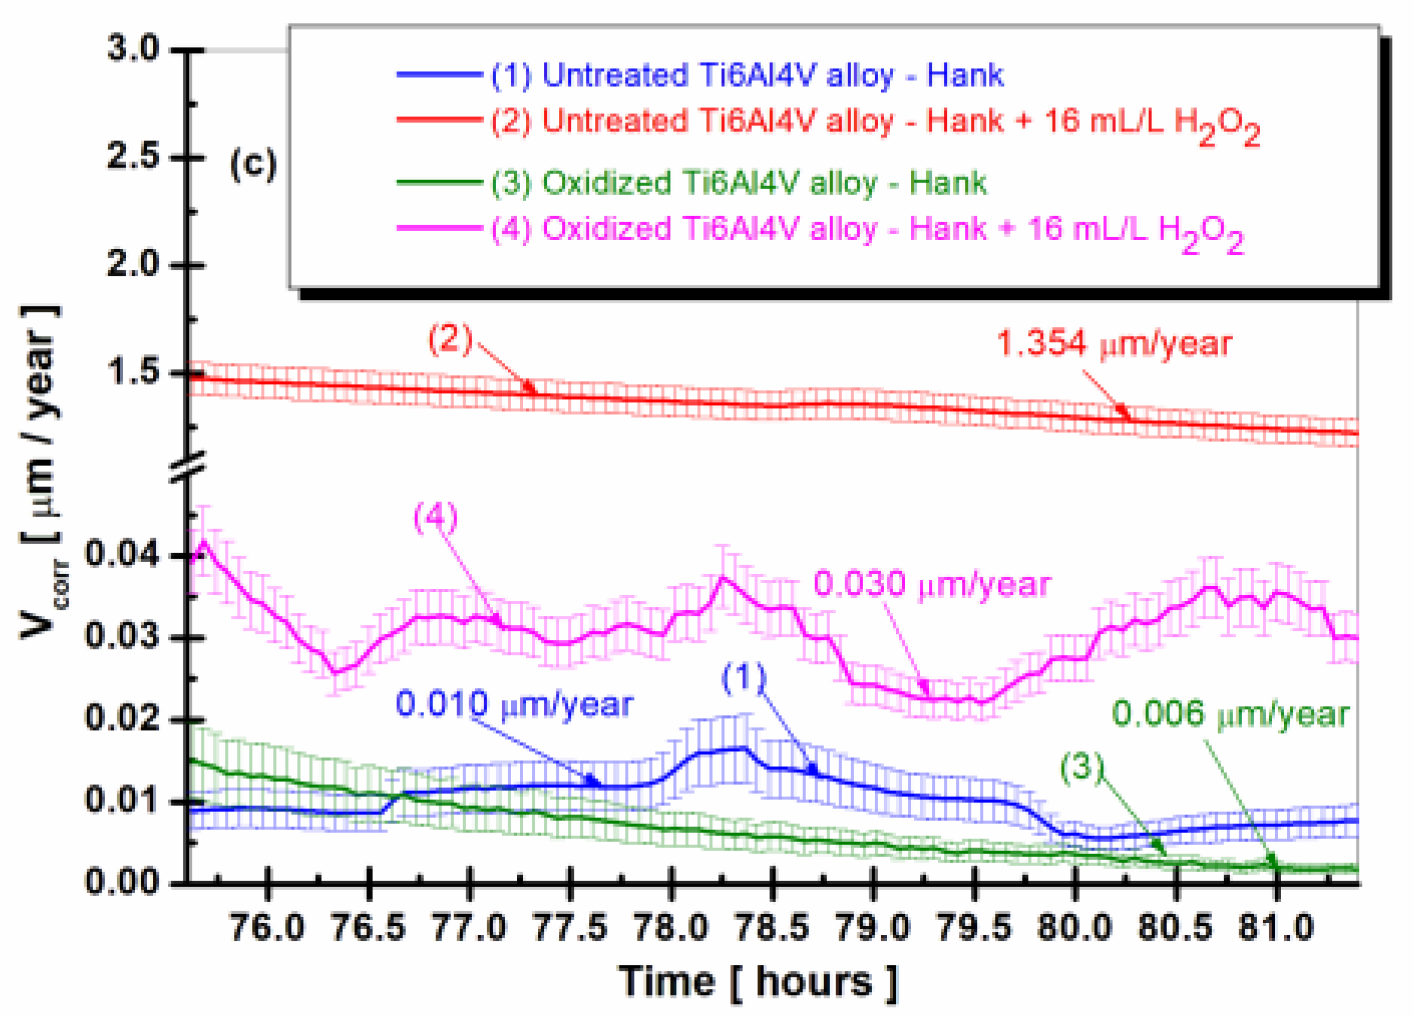
After 75.5 h of immersion in both Hank’s biological solution and Hank’s solution containing H
2O
2,
Figure 4c shows that the corrosion rate values for both the untreated Ti6Al4V alloy and the electrochemically oxidized Ti6Al4V alloy follow a similar trend in the two solutions. The corrosion rate (V
corr) of the untreated alloy immersed in Hank’s solution with H
2O
2 experiences a slight decrease towards the end of the immersion period, reaching V
corr = 1.354 µm/year, as shown in curve (2). Meanwhile, the corrosion rate of the electrochemically oxidized Ti6Al4V alloy also decreases, reaching V
corr = 0.030 µm/year by the end of the immersion period, as depicted in the curve (4), which is approximately 45 times lower.
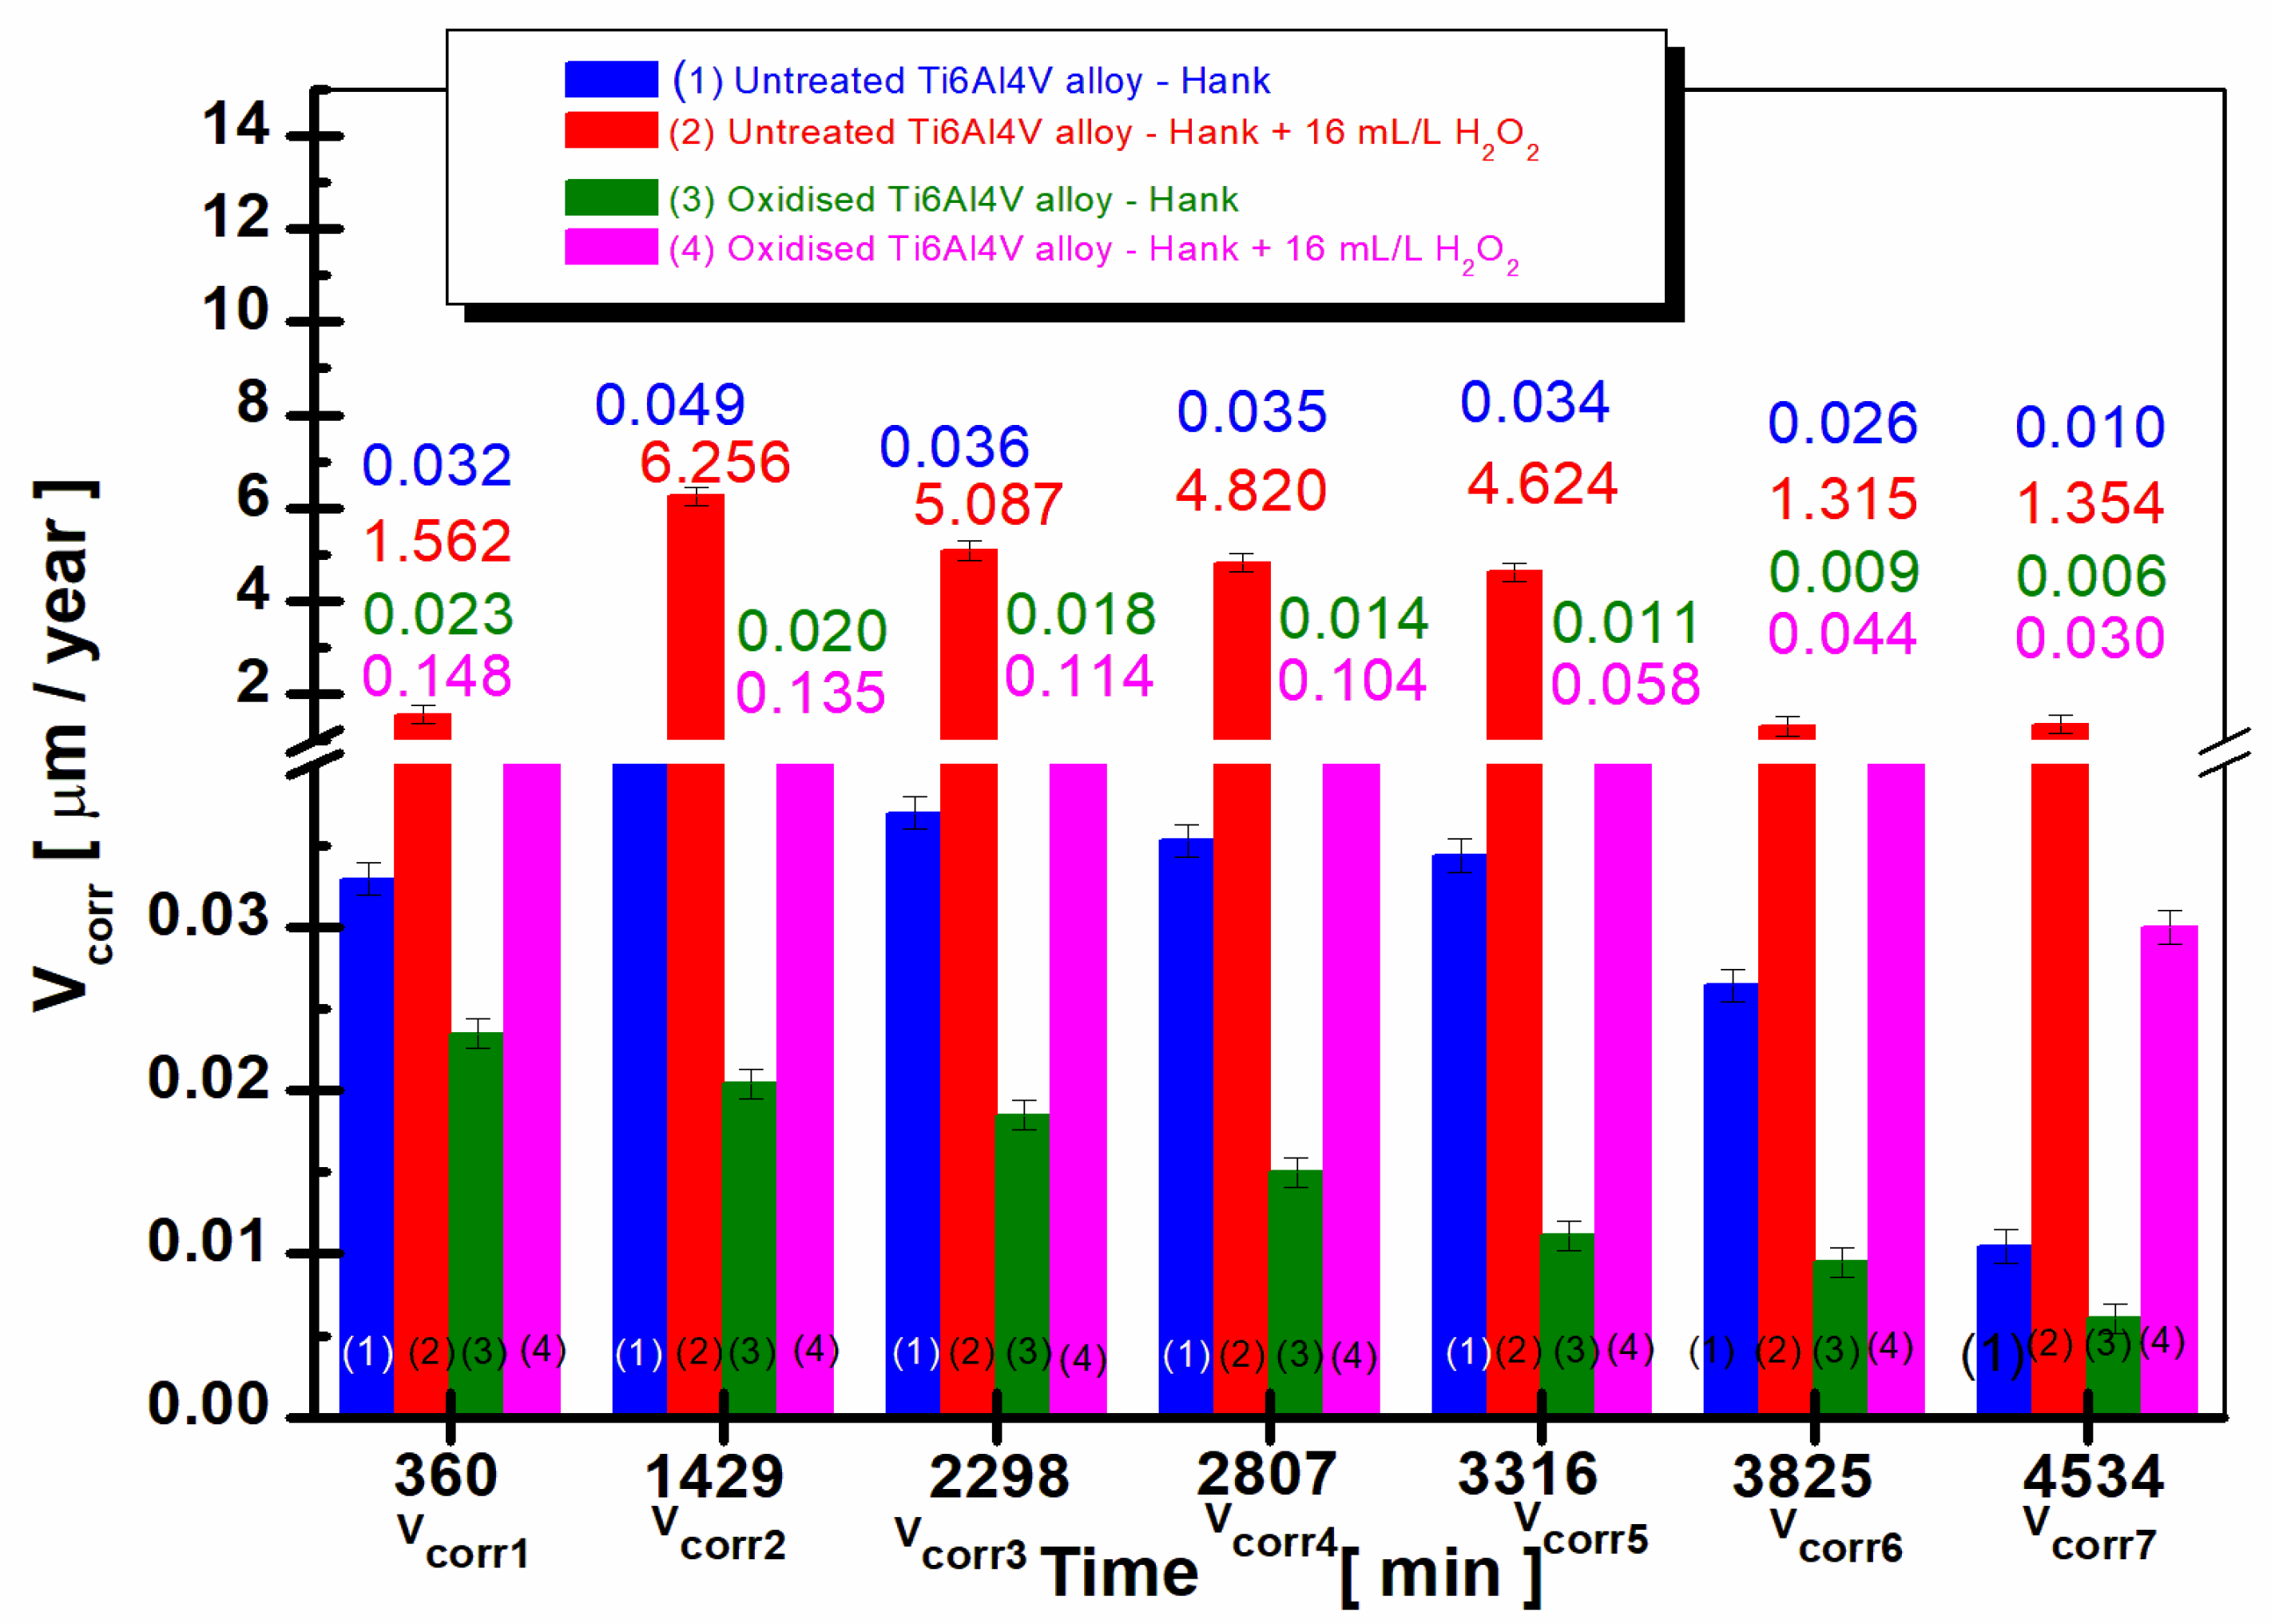
From the comparative analysis of the average values of the corrosion rate (
Figure 5) it is observed that in the case of the electrochemically oxidized grade 5 Ti6Al4V alloy immersed in Hank’s solution and in Hank’s solution doped with H
2O
2, the corrosion rate values are lower compared to the untreated grade 5 Ti6Al4V alloy at all the times studied. Moreover, in the case of the electrochemically oxidized Ti6Al4V alloy, a decrease in the corrosion rate values is observed with increase in immersion time (columns (3) and (4) from
Figure 5).
If, at the first measurement, the electrochemically oxidized alloy immersed in Hank’s solution doped with H2O2 has a value of Vcorr1 = 0.148 µm/year, at the end of the 80 h monitoring, it reaches a value of Vcorr7 = 0.030 µm/year, a behavior that demonstrates the effectiveness of the electrochemical oxidation process on the titanium alloy to improve the corrosion resistance of the implant to the aggressive action of the biological fluids in the human body and the presence of the inflammatory compound.
In the case of the untreated Ti6Al4V alloy, it is observed that the corrosion rate values show the highest values both in the Hank’s solution and the Hank’s solution doped with H2O2, columns (1) and (2). Further, in the case of untreated alloys, the corrosion rate values tend to increase slightly.
Figure 5.
The comparative evolution of the mean values of corrosion rate during the immersion period in Hank’s biological solution and Hank’s doped with 16 mL/L H2O2: (1) untreated Ti6Al4V alloy in Hank’s biological solution; (2) untreated Ti6Al4V alloy in Hank’s doped with hydrogen peroxide; (3) oxidized titanium alloy in Hank’s biological solution; and (4) oxidized titanium alloy in Hank’s doped with hydrogen peroxide.
After 38 h of immersion, Vcorr2 for the untreated alloy in Hank’s solution increases to Vcorr2 = 0.049 µm/year compared to the value obtained after 360 min, Vcorr1 = 0.032 µm/year. The corrosion rate values for the untreated alloy immersed in Hank’s solution doped with H2O2 increase much more over time. Thus, after 38 h, Vcorr2 is 6256 µm/year compared to the average value recorded after 360 min of Vcorr1 = 1562 µm/year.
At the molecular level, the corrosion velocity profiles for each group can be explained by considering the interactions between the titanium alloy surface and the immersion solutions. In the case of untreated Ti6Al4V alloy immersed in Hank’s solution doped with H2O2 (2), the increase in corrosion velocity can be attributed to the dynamic equilibrium between the growth and dissolution of the TiO2 layer on the alloy surface, promoted by the presence of hydrogen peroxide. This dynamic equilibrium implicates a higher corrosion rate, as the oxide layer does not provide complete protection against corrosion. However, as the immersion time progresses, the dissolution rate of the TiO2 layer may slow down due to saturation effects in the solution, leading to a gradual increase in the protective oxide layer thickness. This increase in thickness results in a decrease in corrosion velocity after reaching the maximum value. It is important to note that even with the observed decrease, the corrosion rate for the untreated alloy in the H2O2-doped solution remains significantly higher than the other groups, indicating an increased susceptibility to corrosion in the presence of inflammatory compounds.
2.4. Morphological, Compositional, and Structural Investigation
The morphological, compositional (SEM-EDX), and structural (XRD) analyses were carried out with the help of the pieces of equipment described in
Section 3.
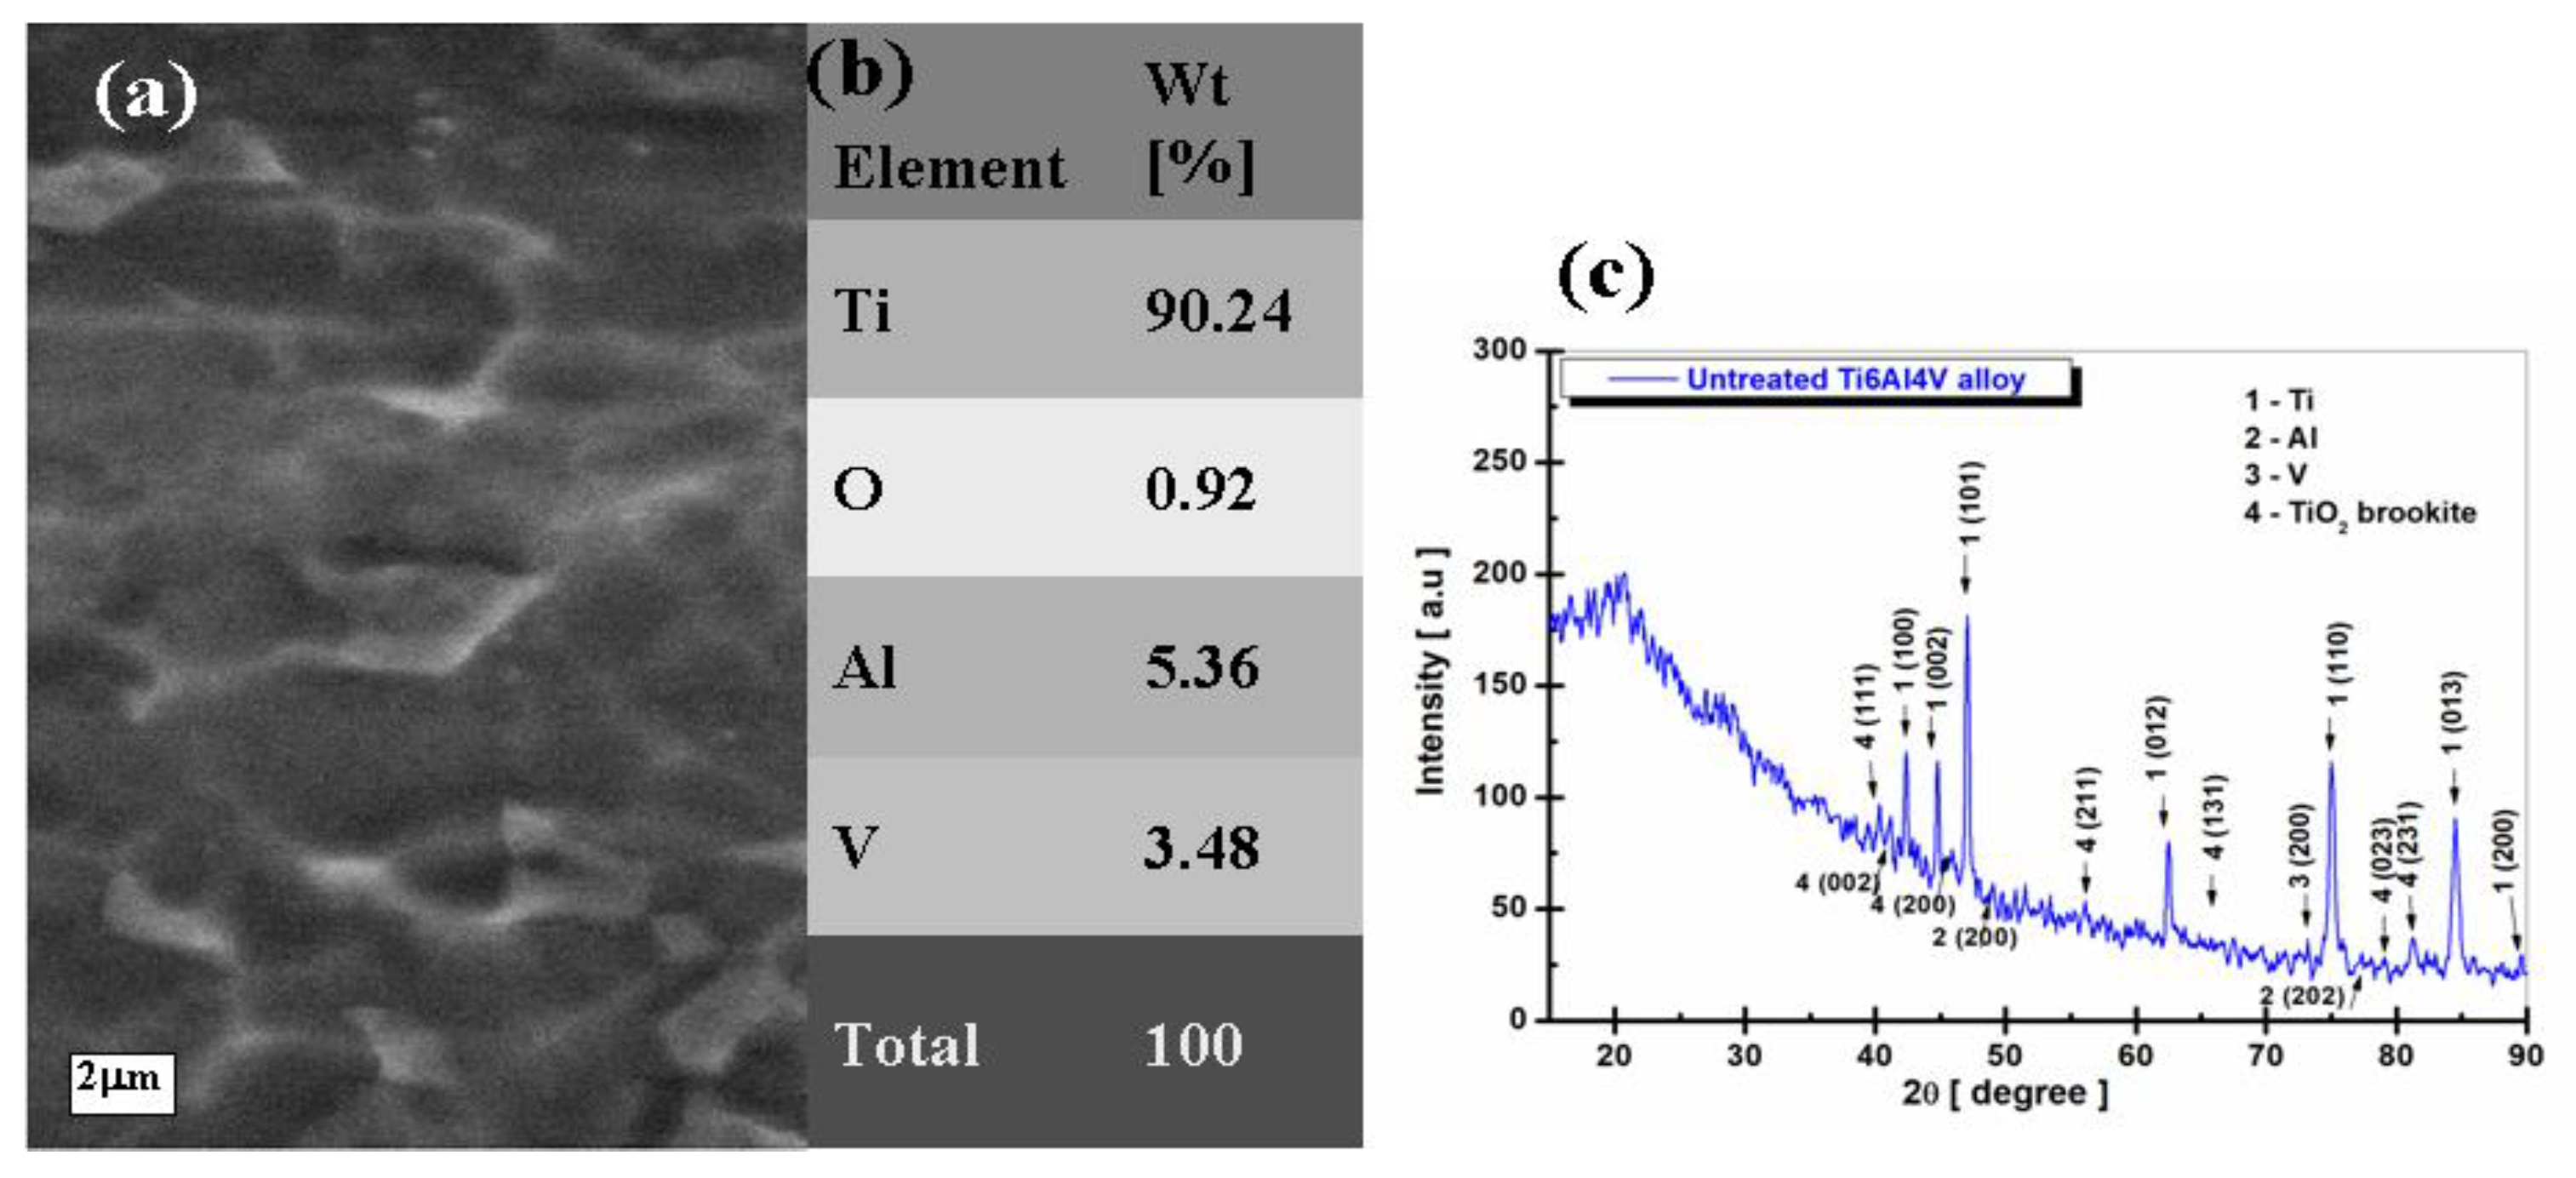
Figure 6a–c shows the following: (a) SEM surface morphology of the untreated grade 5 Ti6Al4V implant alloy, (b) EDX elemental analysis, and (c) X-ray diffraction pattern.
The SEM-EDX analysis of the untreated Ti6Al4V implant alloy,
Figure 6a,b, shows a typical uniform morphology of the titanium alloy surface and indicates the presence of the main elements in the studied alloy, respectively: Ti, Al, and V, with their respective percentage values of Ti = 90.24%, Al = 5.36%, and V = 3.48%. Oxygen is present because a thin layer of titanium oxide with a percentage of 2.29% TiO
2 is natively formed on the surface of the untreated alloy.
The percentage of TiO2 formed on the surface of the Ti6Al4V alloy is determined from the transformation of the mass percentage of oxygen (0.92%) from the general analysis with the help of the molecular mass of TiO2 (79.866 g/mol).
From the surface morphology of the untreated Ti6Al4V alloy (
Figure 6), the surface is smooth and has no surface defects.
From the analysis of the XRD spectrum before the electrochemical oxidation process (
Figure 6c), the following crystalline phases are identified using the software Match! 3, version 2022, (1) titanium (Ti) with crystallographic planes: (100), (002), (101), (012), (110), (013), and (200), corresponding to 2θ angles = 42.33°, 44.68°, 47.17°, 62.61°, 74.90°, 84.49°, and 89.20°. This detected phase is registered in the database of the program used, Crystallography Open Database (COD) 96-901-6191, and belongs to the hexagonal crystallization system, space group P63/mmc. It was also identified as (2) aluminum (Al) with the crystallographic planes: (200) and (202), corresponding to the angles 2θ = 49.00° and 76.86°, identified with the database of the program COD 96-431-3211, as belonging to the cubic crystallization system, space group F m − 3 m.
Another phase identified is (3) vanadium (V) with the crystallographic plane (200), corresponding to the angles 2θ = 74.12° recorded in the database of the Crystallography Open Database (COD) program 96-410-5684 as belonging to the cubic crystallization system, space group I m − 3 m.
The last phase identified is (4) titanium dioxide (TiO2) brookite with crystallographic planes: (111), (002), (211), (131), (231), (023), and (200), corresponding to the angles 2θ = 40.24°, 41.03°, 55.93°, 67.44°, 81.30°, 78.82°, and 45.87°, which belong to the orthorhombic crystallization system, space group (P b c n) registered in the COD 96 database-153-0027.
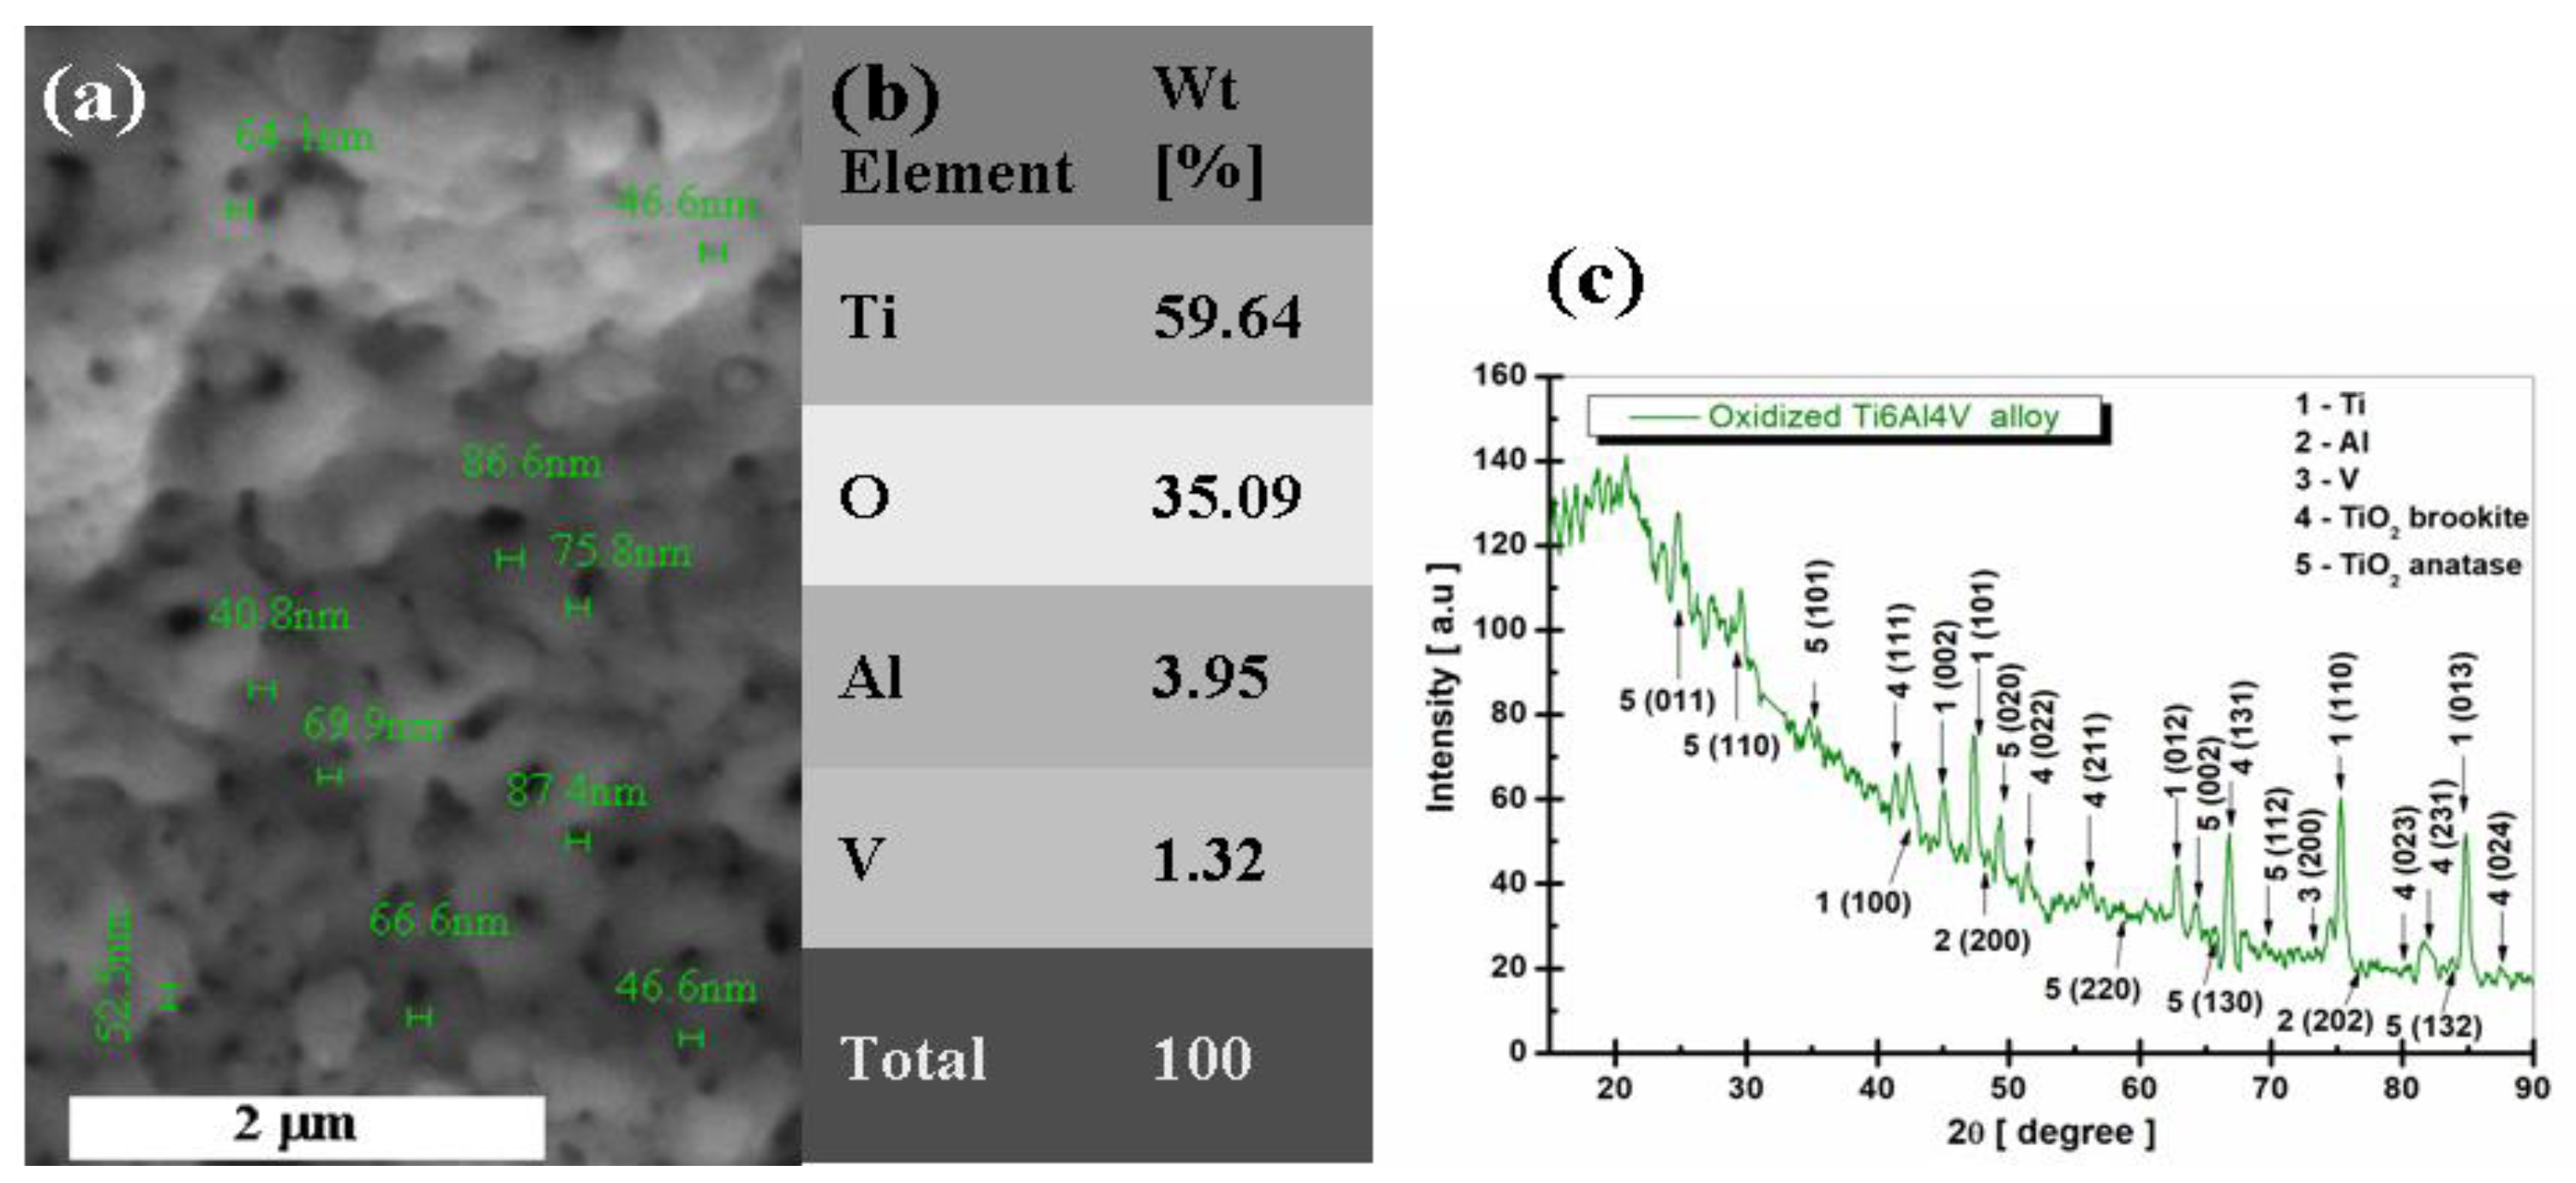
Figure 7 shows the morphological, compositional (SEM-EDX), and structural (XRD) analysis of the electrochemically oxidized Ti6Al4V alloy.
From the analysis of
Figure 7, the surface of the electrochemically oxidized grade 5 titanium alloy shows a layer of nanoporous, dense TiO
2, in some places with agglomerations of formed oxide, but without interruptions or surface defects, thus confirming that the voltage and time imposed on the oxidation process are optimal. To highlight the growth of nanopores of TiO
2 on the surface of the titanium alloy,
Figure 7a shows a series of measurements of the diameter of the nanopores, which is located between 40.2 nm and 87.4 nm. The average size of the nanopores obtained at these electrochemical oxidation parameters would be 64 nm.
From the analysis of
Figure 7b, the presence of the main elements in the studied biomaterial can be observed, respectively: Ti, Al, and V, with their weight percentage values (wt %), respectively, Ti = 66.18%, Al = 6.01%, and V = 3.23%. At the same time, it is observed that there is an increase in the percentage of oxygen, O = 35.09%, compared to the untreated Ti6Al4V alloy, which confirms the increase of the TiO
2 layer in a proportion of 87.57% on the surface of the electrochemically oxidized sample.
From
Figure 7c, it is observed that the diffraction angles and phases identified for Ti, Al, V, and TiO
2 are preserved, as in the case of the untreated titanium alloy. In addition to these phases identified in the structural analysis of the untreated titanium alloy, it was noted that in the samples anodically oxidized at 200 V, the crystalline phase of TiO
2 anatase appeared, identified with the database COD 96-900-8215, which belongs to the tetragonal crystallization system, space group I 41/a m d (141), with the crystallographic planes (011), (110), (101), (020), (220), (002), (130), (112), and (132) corresponding to the diffraction angles 2θ = 24.73°, 29.60°, 34.86°, 49.41°, 58.73°, 64.24°, 65.55°, 69.48 s and 83.76°.
As can be seen from
Figure 7c, on the analyzed electrochemically oxidized Ti6Al4V samples, titanium dioxide (TiO
2 anatase) appeared with significant diffraction peaks on the XRD pattern. This proves that the surface of the titanium alloy oxidizes and forms a passive TiO
2 anatase film.
From the XRD diagrams in
Figure 6c and
Figure 7c, it is observed that TiO
2 anatase electro-crystallizes preferentially according to the planes (011), (110), (020), and (002), which have the highest intensity. It is also observed that at the used oxidation time of 3 min, the peak of TiO
2 anatase with the crystallization plane (011) appears, a peak that does not appear in the untreated alloy, which proves that more titanium oxide (TiO
2) is formed on the surface. These data agree with results obtained by other authors on titanium or other titanium alloys [
31,
32,
33,
34,
35,
36,
37,
38,
39,
40,
41].
It should be noted that studies have been reported in the specialized literature stating that at voltages between 1–130 V applied to the anodic oxidation process, the titanium dioxide formed on the surface of titanium or titanium alloys is amorphous. From 130 V to 250 V, the crystalline phase called anatase is formed [
31,
32,
33,
34,
35,
36,
37,
38,
39,
40]. Additionally, Diamnati and his research team [
31] state that sulfuric acid is an optimal electrolyte when the final goal of anodization is to obtain anatase.


