
Proteomics in Multiple Sclerosis: The Perspective of the Clinician

 ,
,  and
and 
Abstract
1. Introduction
2. Multiple Sclerosis
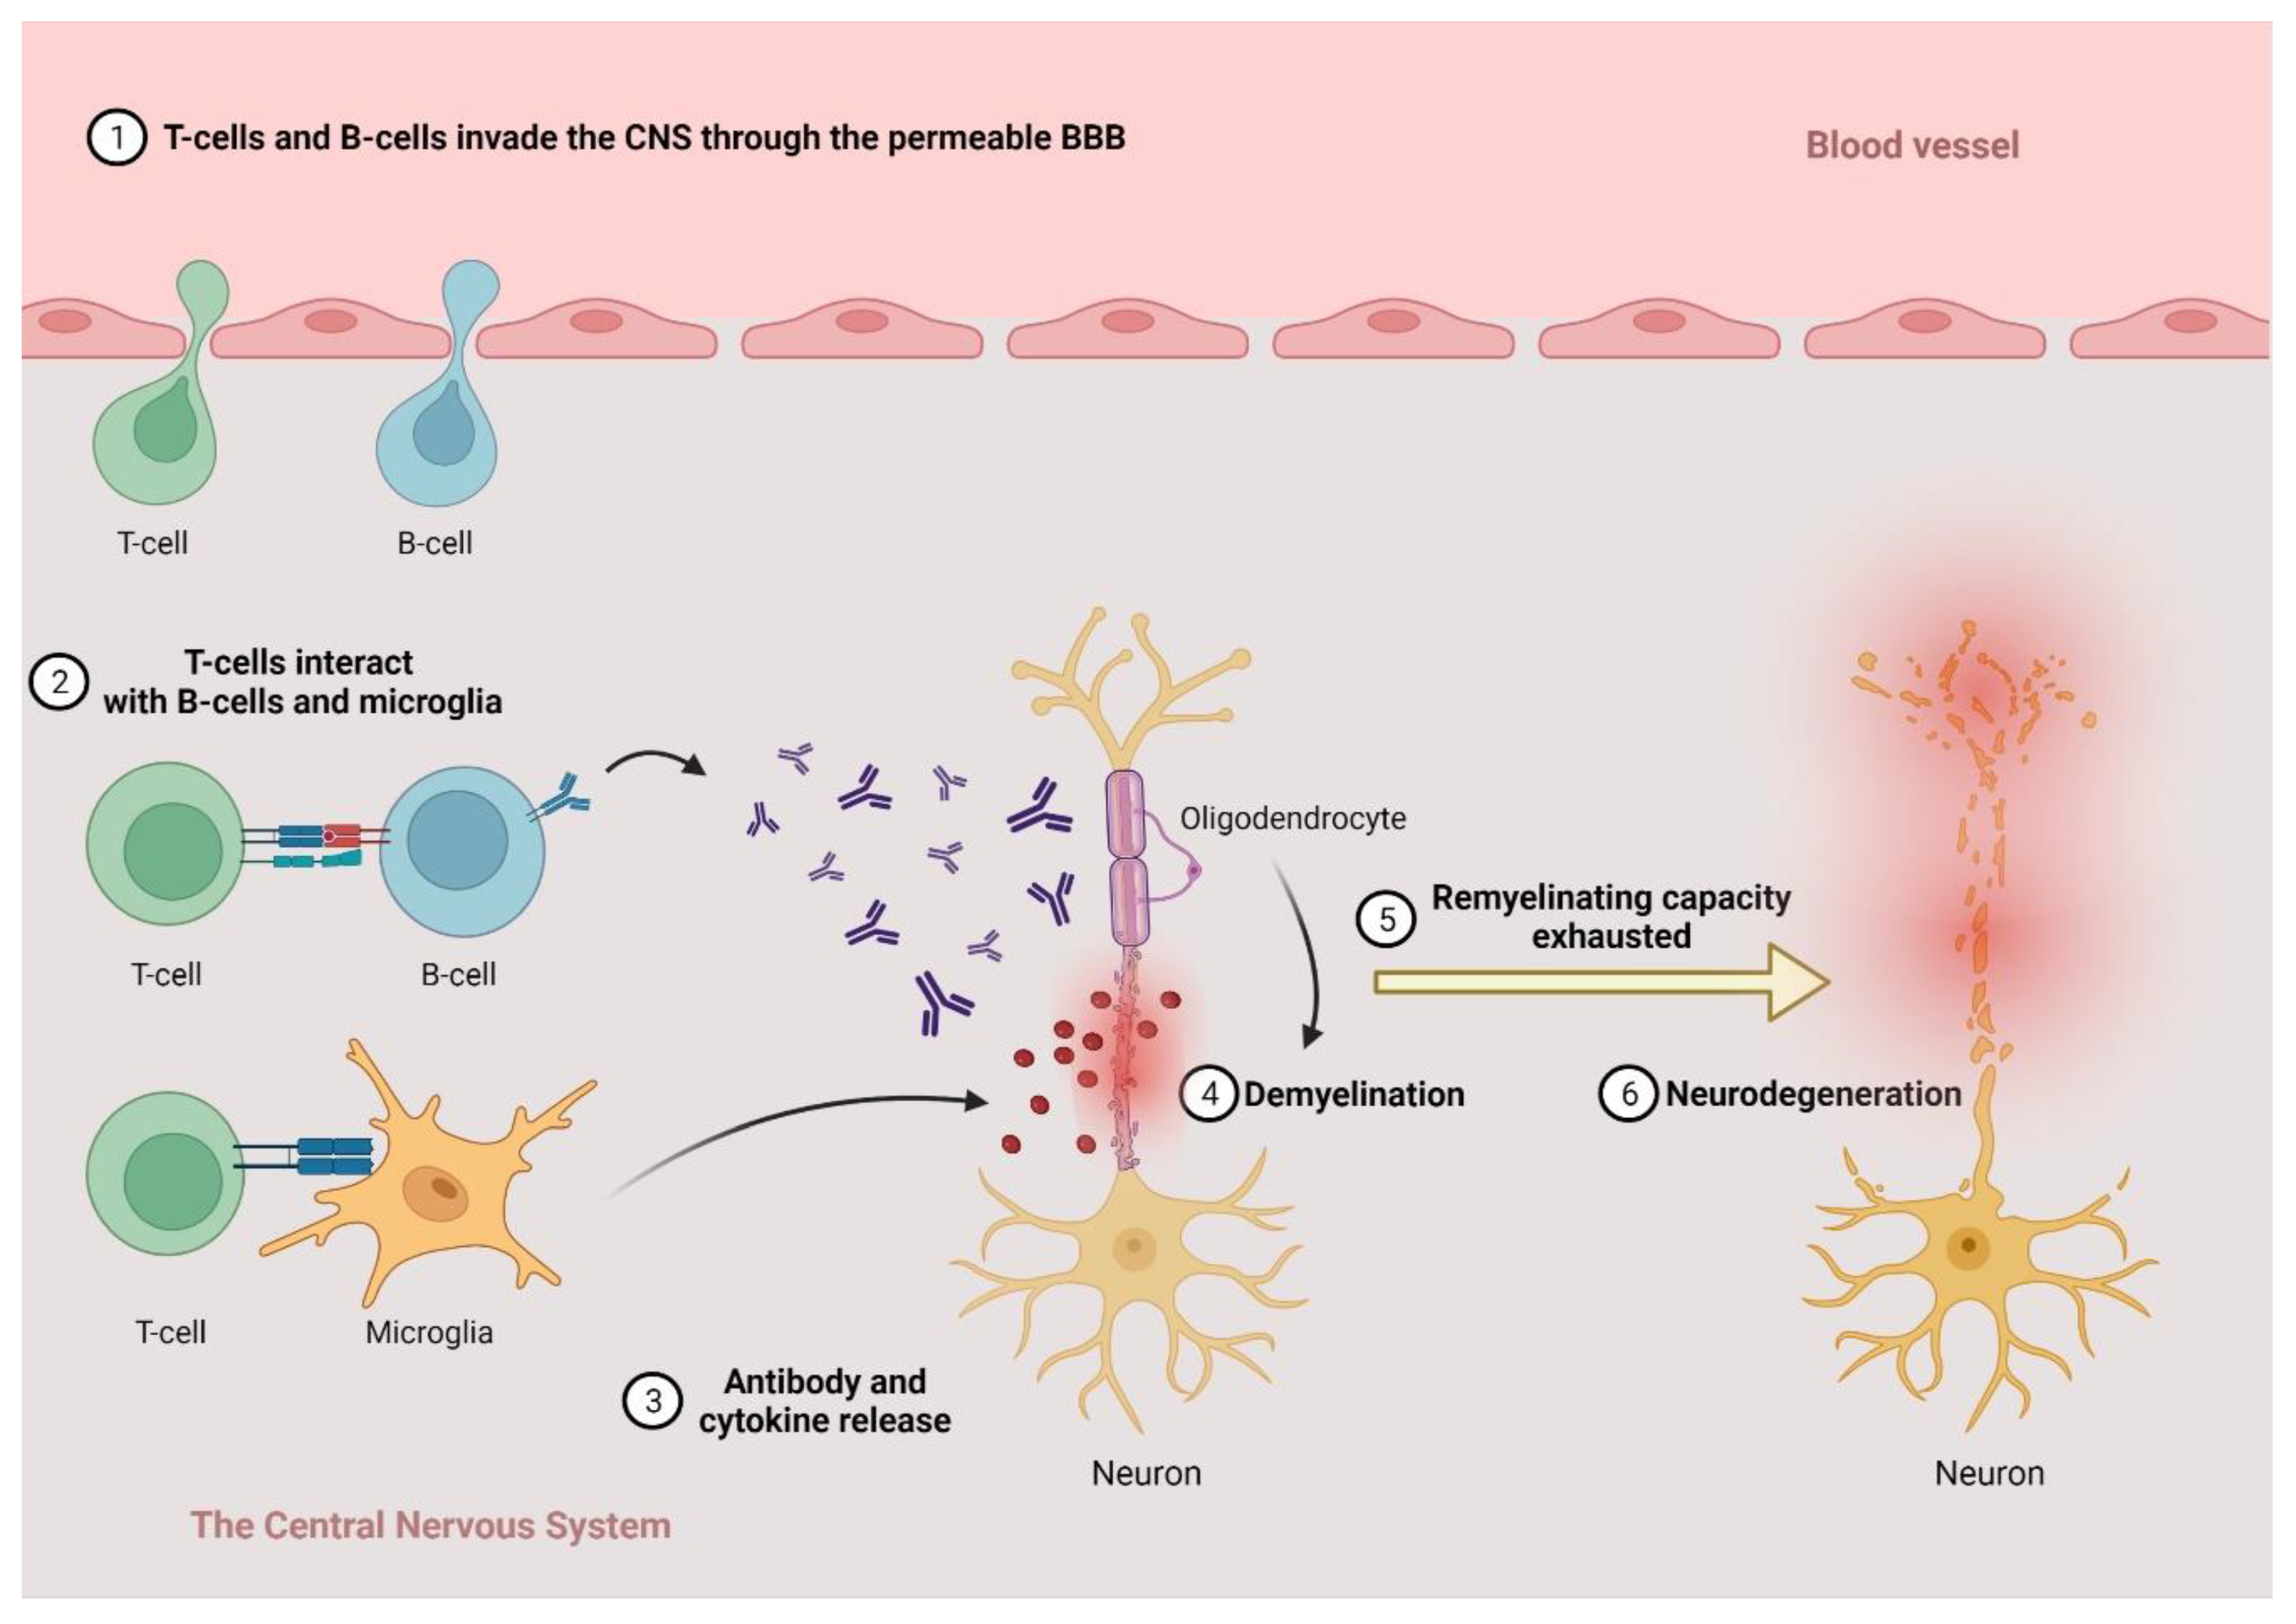
2.1. The Pathogenesis of MS
2.2. Clinical Phenotypes, Diagnosis and Therapy
- At least one T2 hyperintense lesion in 2 ≤ predilecting (periventricular, juxtacortical or cortical or infratentorial) regions;
- Two or more T2-hyperintense lesions in the spinal cord;
- OGP in the CSF.
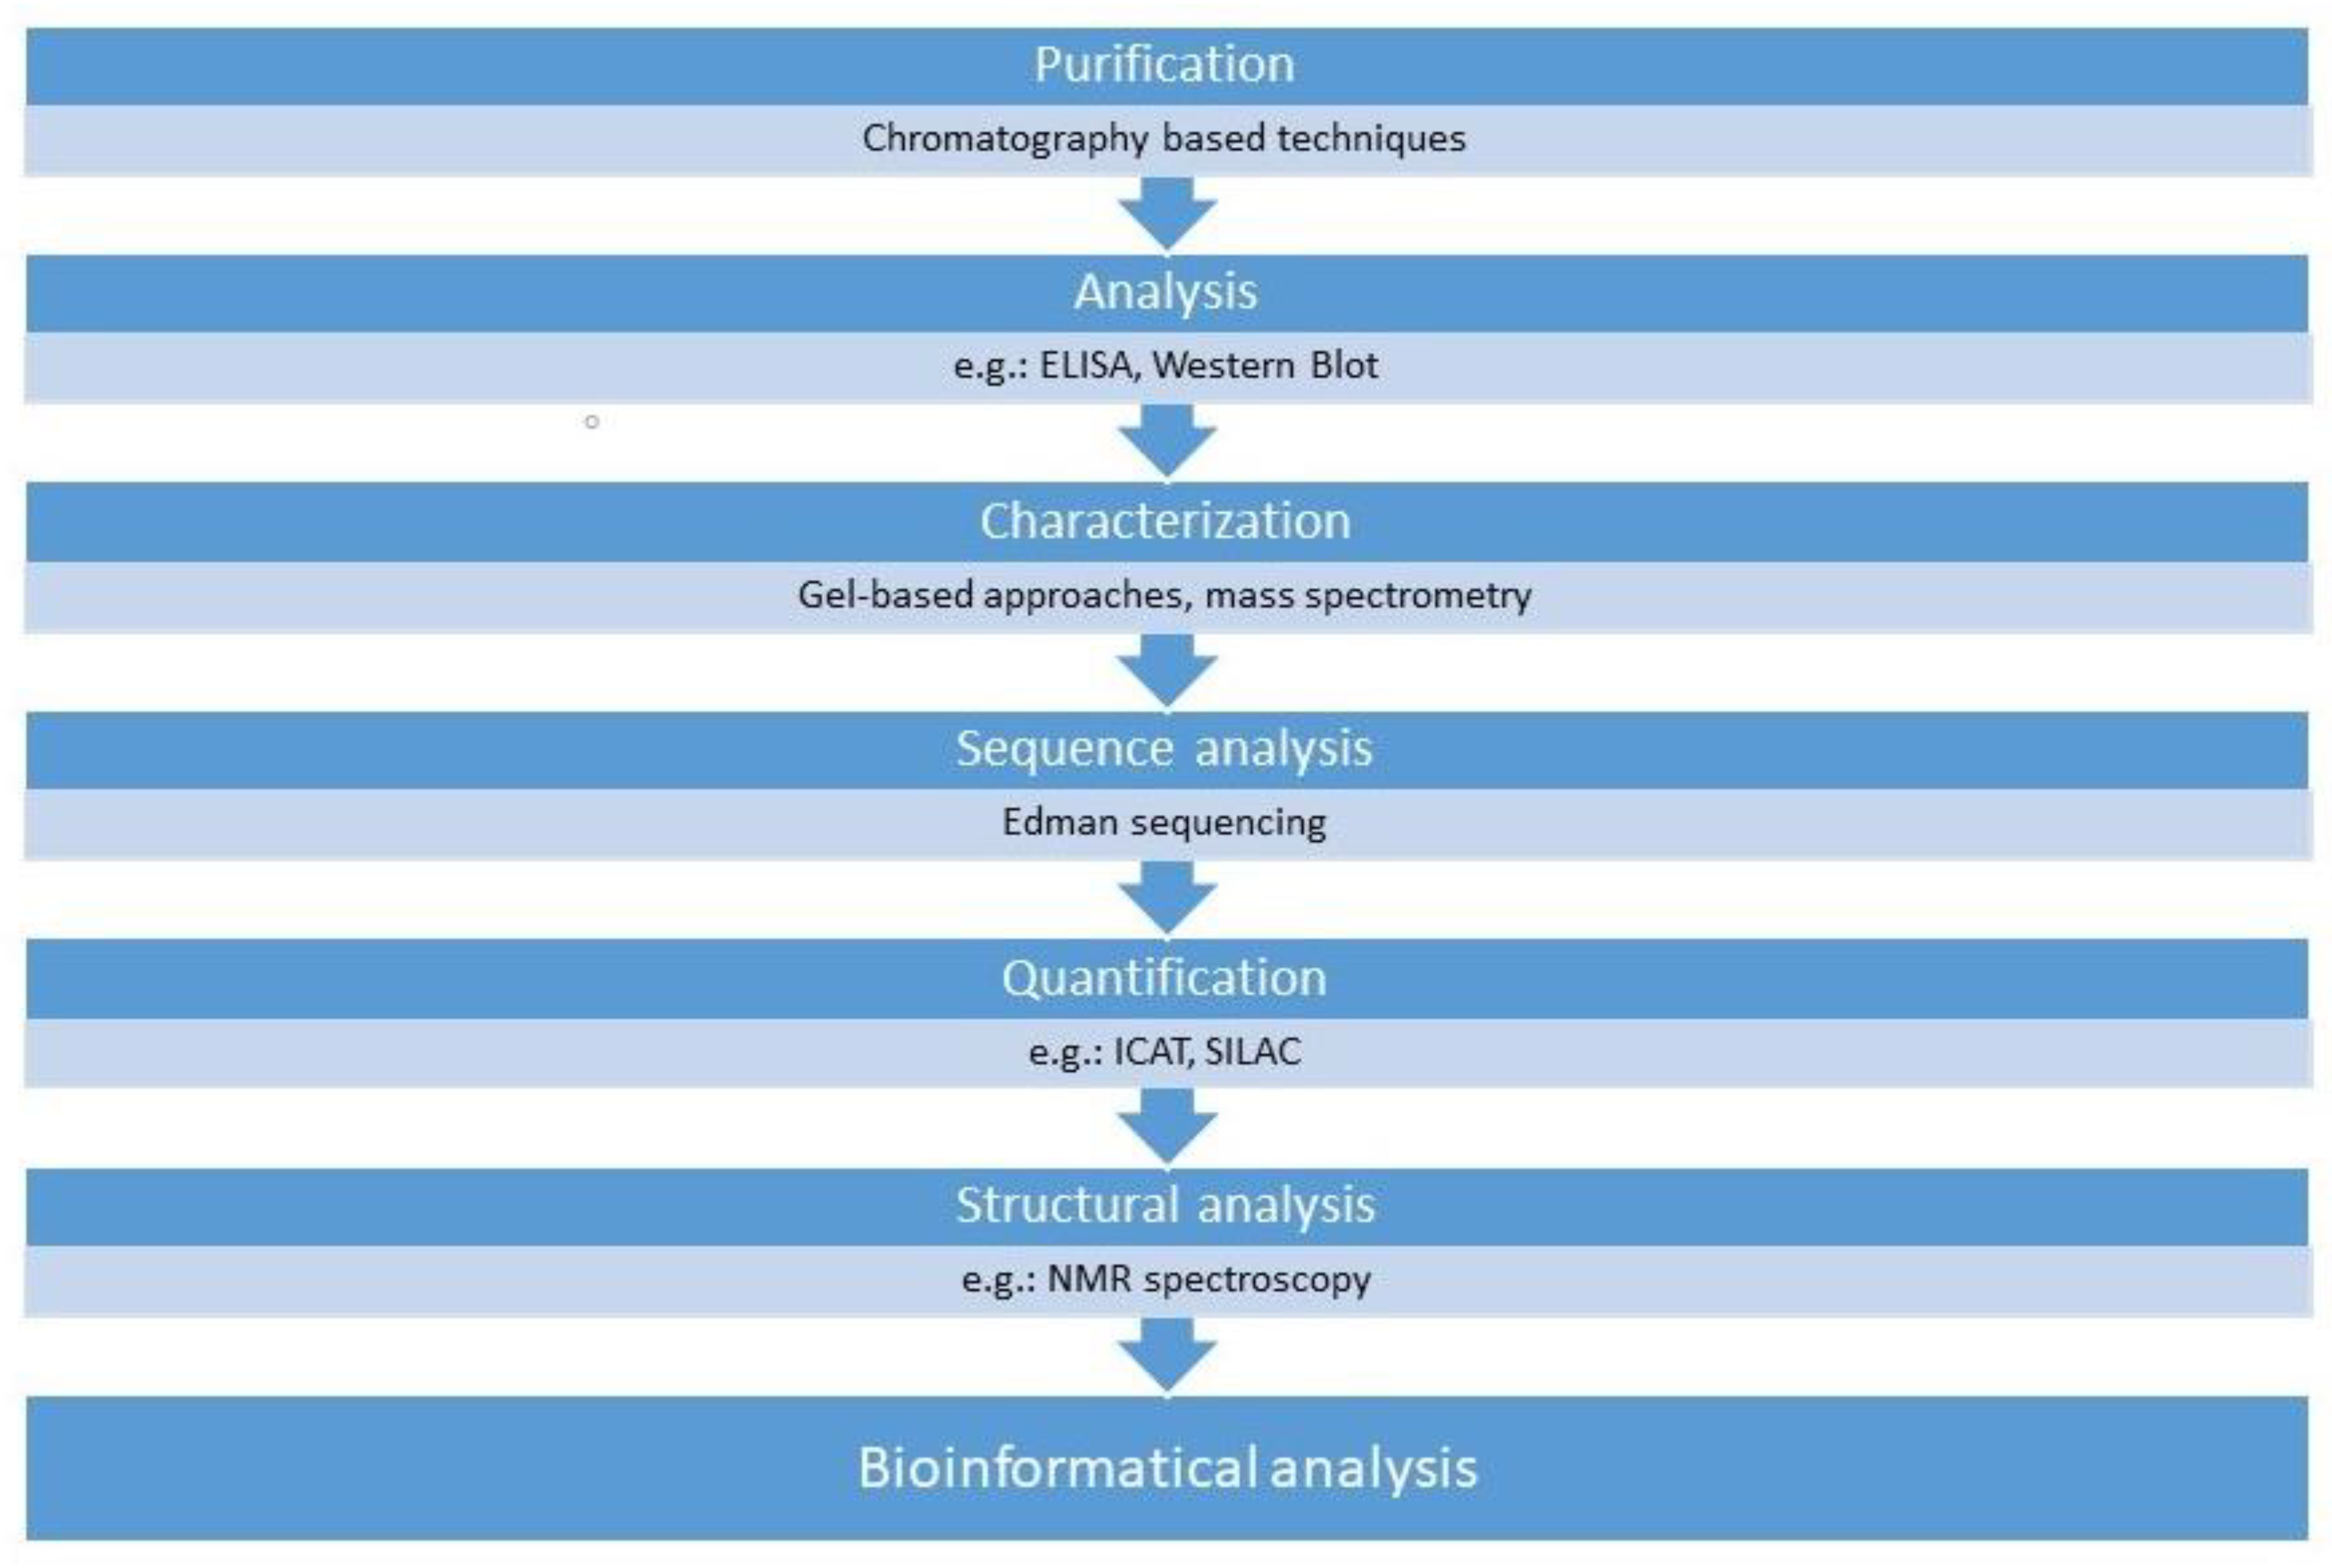
3. Proteomics
- Clinical proteomics: The discipline that analyzes the role of proteins as potential biomarkers in a given disease.
- Structural proteomics: This discipline aims to evaluate the three-dimensional structure of a protein in connection with its function in the cell.
- Functional proteomics: The main goal of this discipline is to analyze the interactions of a given protein with other proteins or other types of molecules in connection with its role in the complex (patho)physiological processes.
3.1. The Role of Proteomics in Biomarker Research for Neurological Conditions
3.2. Biological Samples in Neurological Conditions
3.2.1. Blood
3.2.2. CSF
3.2.3. Saliva
3.2.4. Tear
3.2.5. Urine
3.2.6. CNS Tissue Sample
3.3. Why Proteomics?
4. Results of Proteomic Studies in the Research of Multiple Sclerosis
4.1. Results in the Pathogenesis of MS
4.1.1. Animal Models
4.1.2. Human Tissue Samples
4.2. Results in Biomarker Studies
4.2.1. Diagnosis and Differential Diagnosis
4.2.2. Conversion from CIS to RRMS and from RRMS to SPMS
4.2.3. Disease Activity
4.2.4. Disease Progression
4.2.5. Monitoring Therapeutic Effectiveness
4.3. Therapy
5. Conclusions
Author Contributions
Funding
Data Availability Statement
Conflicts of Interest
List of Abbreviations
| 2D-DIGE | two-dimensional differential gel electrophoresis |
| 2-DE | two-dimensional gel electrophoresis |
| A1AG | α-1-acid-glycoprotein |
| A1BG | α-1-B-glycoprotein |
| ACE | angiotensin-converting enzyme |
| ADEM | acute disseminated encephalomyelitis |
| ALS | amyotrophic lateral sclerosis |
| ANO2 | anoctamine-2 |
| BBB | blood–brain barrier |
| BDNF | brain-derived neurotrophic factor |
| CCL11 | Eotaxin-1 |
| CCL20 | chemokine ligand 20 |
| CCN5 | connective tissue growth factor/cysteine-rich protein/nephroblastoma overexpressed-5 |
| CDMS | clinically definitive multiple sclerosis |
| CHI3L1 | Chitinase-3-like protein 1 |
| CHI3L2 | Chitinase-3-like protein 2 |
| CIDP | chronic inflammatory demyelinating polyneuropathy |
| CIS | clinically isolated syndrome |
| CNS | central nervous system |
| COX5b | cytochrome C oxidase subunit 5b |
| CSF | cerebrospinal fluid |
| DIS | dissemination in space |
| DIT | dissemination in time |
| DMF | dimethyl-fumarate |
| DMT | disease modifying therapy |
| EAE | experimental autoimmune encephalomyelitis |
| EAN | European Academy of Neurology |
| EBV | Epstein–Barr virus |
| ECTRIMS | European Committee for Treatment and Research in Multiple Sclerosis |
| EDSS | expanded disability status scale |
| ELISA | enzyme-linked immunosorbent assay |
| FNG | fingolimod |
| GA | glatiramer-acetate |
| Gd+ | gadolinium |
| GFAP | glial fibrillary acidic protein |
| GPI | glucose-6-phosphate isomerase |
| ICAT | Isotope-coded affinity tag labeling |
| IEC | ion exchange chromatography |
| IFN-β | interferon-β |
| IGF2 | insulin-like growth factor 2 |
| IGFBP7 | insulin-like growth factor-binding protein 7 |
| iTRAQ | isobaric tag for relative and absolute quantitation |
| LC-TMS | liquid chromatography–tandem mass spectrometry |
| LHON | Leber’s Hereditary Optic Neuropathy |
| MAPK | mitogen-activated protein kinase |
| MBP | myelin basic protein |
| MDR | multidrug response |
| MOG | myelin oligodendrocyte glycoprotein |
| MRI | magnetic resonance imaging |
| MS | multiple sclerosis |
| MSSS | multiple sclerosis severity score |
| NAT | natalizumab |
| NEDA | no evidence of disease activity |
| nFL | neurofilament light chain |
| NMOSD | neuromyelitis optica spectrum disorder |
| NMR spectroscopy | nuclear magnetic resonance spectroscopy |
| OGP | oligoclonal gammopathy |
| PEPB1 | phosphatidylethanolamine-binding protein 1 |
| PKCθ | protein kinase C θ |
| PKN | prior knowledge signaling network |
| PLP-1 | proteolipid protein |
| PPMS | primary progressive multiple sclerosis |
| PRDX6 | peroxiredoxin 6 |
| Prx1 | peroxiredoxin-1 |
| QoL | quality of life |
| RAAS | renin–angiotensin–aldosterone system |
| ROS | reactive oxygen species |
| RRMS | relapsing-remitting multiple sclerosis |
| RTN3 | reticulon 3 |
| SAP | serum amyloid P component |
| Scg1 | secretogranin-1 |
| SDS-PAGE | sodium dodecyl sulfate-polyacrylamide gel electrophoresis |
| SEC | size exclusion chromatography |
| SERPINA3 | α-1-antichymotrypsin |
| SILAC | stable isotope labeling with amino acids in cell culture |
| SIRTs | silent information regulator proteins |
| SLE | systemic lupus erythematosus |
| SPMS | secondary progressive multiple sclerosis |
| SST | somatostatin |
| STAT | signal transducer and activator of transcription |
| TAK1 | TGF-β-activated kinase 1 |
| TER | teriflunomide |
| TGF-β | transforming growth factor beta |
| TNF | tumor necrosis factor |
| VILIP-1 | visinin-like protein |
| vWF | von Willebrand factor |
References
- Noseworthy, J.H.; Lucchinetti, C.; Rodriguez, M.; Weinshenker, B.G. Multiple sclerosis. N. Engl. J. Med. 2000, 343, 938–952. [Google Scholar] [CrossRef] [PubMed]
- Koch-Henriksen, N.; Thygesen, L.C.; Stenager, E.; Laursen, B.; Magyari, M. Incidence of MS has increased markedly over six decades in Denmark particularly with late onset and in women. Neurology 2018, 90, e1954–e1963. [Google Scholar] [CrossRef] [PubMed]
- Benito-Leon, J. Multiple sclerosis: Is prevalence rising and if so why? Neuroepidemiology 2011, 37, 236–237. [Google Scholar] [CrossRef] [PubMed]
- Zsiros, V.; Fricska-Nagy, Z.; Füvesi, J.; Kincses, Z.T.; Langane, E.; Paulik, E.; Vécsei, L.; Bencsik, K. Prevalence of multiple sclerosis in Csongrad County, Hungary. Acta Neurol. Scand. 2014, 130, 277–282. [Google Scholar] [CrossRef]
- Biernacki, T.; Sandi, D.; Fricska-Nagy, Z.; Kincses, Z.T.; Füvesi, J.; Laczkó, R.; Kokas, Z.; Klivényi, P.; Vécsei, L.; Bencsik, K. Epidemiology of multiple sclerosis in Central Europe, update from Hungary. Brain Behav. 2020, 10, e01598. [Google Scholar] [CrossRef]
- Kingwell, E.; Marriott, J.J.; Jetté, N.; Pringsheim, T.; Makhani, N.; A Morrow, S.; Fisk, J.D.; Evans, C.; Béland, S.G.; Kulaga, S.; et al. Incidence and prevalence of multiple sclerosis in Europe: A systematic review. BMC Neurol. 2013, 13, 1–13. [Google Scholar] [CrossRef]
- Dobson, R.; Giovannoni, G. Multiple sclerosis—A review. Eur. J. Neurol. 2019, 26, 27–40. [Google Scholar] [CrossRef]
- Heydarpour, P.; Khoshkish, S.; Abtahi, S.; Moradi-Lakeh, M.; Sahraian, M.A. Multiple Sclerosis Epidemiology in Middle East and North Africa: A Systematic Review and Meta-Analysis. Neuroepidemiology 2015, 44, 232–244. [Google Scholar] [CrossRef]
- Simonsen, C.S.; Edland, A.; Berg-Hansen, P.; Celius, E.G. High prevalence and increasing incidence of multiple sclerosis in the Norwegian county of Buskerud. Acta Neurol. Scand. 2017, 135, 412–418. [Google Scholar] [CrossRef]
- Walton, C.; King, R.; Rechtman, L.; Kaye, W.; Leray, E.; Marrie, R.A.; Robertson, N.; La Rocca, N.; Uitdehaag, B.; Van Der Mei, I.; et al. Rising prevalence of multiple sclerosis worldwide: Insights from the Atlas of MS, third edition. Mult. Scler. J. 2020, 26, 1816–1821. [Google Scholar] [CrossRef]
- Vukusic, S.; Moreau, T.; Bouhour, F.; Adeleine, P.; Confavreux, C. Multiple sclerosis: Spontaneous course, natural history. Rev. Neurol. 2001, 157 Pt 1, 753–756. [Google Scholar] [PubMed]
- Pugliatti, M.; Rosati, G.; Carton, H.; Riise, T.; Drulovic, J.; Vécsei, L.; Milanov, I. The epidemiology of multiple sclerosis in Europe. Eur. J. Neurol. 2006, 13, 700–722. [Google Scholar] [CrossRef]
- Biernacki, T.; Sandi, D.; Kincses, Z.T.; Füvesi, J.; Rózsa, C.; Mátyás, K.; Vécsei, L.; Bencsik, K. Contributing factors to health-related quality of life in multiple sclerosis. Brain Behav. 2019, 9, e01466. [Google Scholar] [CrossRef] [PubMed]
- Sandi, D.; Zsiros, V.; Füvesi, J.; Kincses, Z.T.; Fricska-Nagy, Z.; Lencsés, G.; Vécsei, L.; Bencsik, K. Mortality in Hungarian patients with multiple sclerosis between 1993 and 2013. J. Neurol. Sci. 2016, 367, 329–332. [Google Scholar] [CrossRef][Green Version]
- Sumelahti, M.L.; Hakama, M.; Elovaara, I.; Pukkala, E. Causes of death among patients with multiple sclerosis. Mult. Scler. 2010, 16, 1437–1442. [Google Scholar] [CrossRef]
- Lassmann, H.; Bradl, M. Multiple sclerosis: Experimental models and reality. Acta Neuropathol. 2017, 133, 223–244. [Google Scholar] [CrossRef] [PubMed]
- Smolders, J.; Heutinck, K.M.; Fransen, N.L.; Remmerswaal, E.B.M.; Hombrink, P.; Berge, I.J.M.T.; Van Lier, R.A.W.; Huitinga, I.; Hamann, J. Tissue-resident memory T cells populate the human brain. Nat. Commun. 2018, 9, 1–14. [Google Scholar] [CrossRef]
- Machado-Santos, J.; Saji, E.; Tröscher, A.; Paunovic, M.; Liblau, R.; Gabriely, G.; Bien, C.G.; Bauer, J.; Lassmann, H. The compartmentalized inflammatory response in the multiple sclerosis brain is composed of tissue-resident CD8+ T lymphocytes and B cells. Brain 2018, 141, 2066–2082. [Google Scholar] [CrossRef]
- Li, R.; Patterson, K.R.; Bar-Or, A. Reassessing B cell contributions in multiple sclerosis. Nat. Immunol. 2018, 19, 696–707. [Google Scholar] [CrossRef]
- Calahorra, L.; Camacho-Toledano, C.; Serrano-Regal, M.P.; Ortega, M.C.; Clemente, D. Regulatory Cells in Multiple Sclerosis: From Blood to Brain. Biomedicines 2022, 10, 335. [Google Scholar] [CrossRef]
- Kuchroo, V.K.; Weiner, H.L. How does Epstein-Barr virus trigger MS? Immunity 2022, 55, 390–392. [Google Scholar] [CrossRef] [PubMed]
- Hacohen, Y.; Ciccarelli, O. New Evidence for EBV Infection as a Cause of Multiple Sclerosis. Neurology 2022, 98, 605–606. [Google Scholar] [CrossRef] [PubMed]
- Lucchinetti, C.; Brück, W.; Parisi, J.; Scheithauer, B.; Rodriguez, M.; Lassmann, H. Heterogeneity of multiple sclerosis lesions: Implications for the pathogenesis of demyelination. Ann. Neurol. 2000, 47, 707–717. [Google Scholar] [CrossRef]
- Hemmer, B.; Kerschensteiner, M.; Korn, T. Role of the innate and adaptive immune responses in the course of multiple sclerosis. Lancet Neurol. 2015, 14, 406–419. [Google Scholar] [CrossRef]
- Henderson, A.P.; Barnett, M.H.; Parratt, J.D.; Prineas, J.W. Multiple sclerosis: Distribution of inflammatory cells in newly forming lesions. Ann. Neurol. 2009, 66, 739–753. [Google Scholar] [CrossRef]
- Voet, S.; Prinz, M.; van Loo, G. Microglia in Central Nervous System Inflammation and Multiple Sclerosis Pathology. Trends Mol. Med. 2019, 25, 112–123. [Google Scholar] [CrossRef]
- Pons, V.; Rivest, S. Beneficial Roles of Microglia and Growth Factors in MS, a Brief Review. Front. Cell Neurosci. 2020, 14, 284. [Google Scholar] [CrossRef]
- Aloisi, F.; Pujol-Borrell, R. Lymphoid neogenesis in chronic inflammatory diseases. Nat. Rev. Immunol. 2006, 6, 205–217. [Google Scholar] [CrossRef]
- Lassmann, H.; van Horssen, J.; Mahad, D. Progressive multiple sclerosis: Pathology and pathogenesis. Nat. Rev. Neurol. 2012, 8, 647–656. [Google Scholar] [CrossRef]
- Sandi, D.; Fricska-Nagy, Z.; Bencsik, K.; Vecsei, L. Neurodegeneration in Multiple Sclerosis: Symptoms of Silent Progression, Biomarkers and Neuroprotective Therapy-Kynurenines Are Important Players. Molecules 2021, 26, 3423. [Google Scholar] [CrossRef]
- Fischer, M.T.; Sharma, R.; Lim, J.L.; Haider, L.; Frischer, J.M.; Drexhage, J.; Mahad, D.; Bradl, M.; van Horssen, J.; Lassmann, H. NADPH oxidase expression in active multiple sclerosis lesions in relation to oxidative tissue damage and mitochondrial injury. Brain 2012, 135 Pt 3, 886–899. [Google Scholar] [CrossRef] [PubMed]
- Trapp, B.D.; Stys, P.K. Virtual hypoxia and chronic necrosis of demyelinated axons in multiple sclerosis. Lancet Neurol. 2009, 8, 280–291. [Google Scholar] [CrossRef]
- Tanaka, M.; Vecsei, L. Monitoring the Redox Status in Multiple Sclerosis. Biomedicines 2020, 8, 406. [Google Scholar] [CrossRef] [PubMed]
- Saxena, S.; Caroni, P. Selective neuronal vulnerability in neurodegenerative diseases: From stressor thresholds to degeneration. Neuron 2011, 71, 35–48. [Google Scholar] [CrossRef]
- Friese, M.A.; Schattling, B.; Fugger, L. Mechanisms of neurodegeneration and axonal dysfunction in multiple sclerosis. Nat. Rev. Neurol. 2014, 10, 225–238. [Google Scholar] [CrossRef] [PubMed]
- Scheld, M.; Rüther, B.J.; Grosse-Veldmann, R.; Ohl, K.; Tenbrock, K.; Dreymüller, D.; Fallier-Becker, P.; Zendedel, A.; Beyer, C.; Clarner, T.; et al. Neurodegeneration Triggers Peripheral Immune Cell Recruitment into the Forebrain. J. Neurosci. 2016, 36, 1410–1415. [Google Scholar] [CrossRef]
- Veto, S.; Acs, P.; Bauer, J.; Lassmann, H.; Berente, Z.; Setalo, G.; Borgulya, G.; Sumegi, B.; Komoly, S.; Gallyas, F.; et al. Inhibiting poly(ADP-ribose) polymerase: A potential therapy against oligodendrocyte death. Brain 2010, 133, 822–834. [Google Scholar] [CrossRef]
- Sharma, R.; Fischer, M.-T.; Bauer, J.; Felts, P.A.; Smith, K.J.; Misu, T.; Fujihara, K.; Bradl, M.; Lassmann, H. Inflammation induced by innate immunity in the central nervous system leads to primary astrocyte dysfunction followed by demyelination. Acta Neuropathol. 2010, 120, 223–236. [Google Scholar] [CrossRef]
- Mahad, D.J.; Ziabreva, I.; Campbell, G.; Lax, N.; White, K.; Hanson, P.S.; Lassmann, H.; Turnbull, D.M. Mitochondrial changes within axons in multiple sclerosis. Brain 2009, 132 Pt 5, 1161–1174. [Google Scholar] [CrossRef]
- Lublin, F.D.; Reingold, S.C.; Cohen, J.A.; Cutter, G.R.; Sørensen, P.S.; Thompson, A.J.; Wolinsky, J.S.; Balcer, L.J.; Banwell, B.; Barkhof, F.; et al. Defining the clinical course of multiple sclerosis: The 2013 revisions. Neurology 2014, 83, 278–286. [Google Scholar] [CrossRef]
- Klineova, S.; Lublin, F.D. Clinical Course of Multiple Sclerosis. Cold Spring Harb. Perspect. Med. 2018, 8, a028928. [Google Scholar] [CrossRef] [PubMed]
- Rovaris, M.; Confavreux, C.; Furlan, R.; Kappos, L.; Comi, G.; Filippi, M. Secondary progressive multiple sclerosis: Current knowledge and future challenges. Lancet Neurol. 2006, 5, 343–354. [Google Scholar] [CrossRef]
- Compston, A.; Coles, A. Multiple sclerosis. Lancet 2008, 372, 1502–1517. [Google Scholar] [CrossRef]
- Thompson, A.J.; Banwell, B.L.; Barkhof, F.; Carroll, W.M.; Coetzee, T.; Comi, G.; Correale, J.; Fazekas, F.; Filippi, M.; Freedman, M.S.; et al. Diagnosis of multiple sclerosis: 2017 revisions of the McDonald criteria. Lancet Neurol. 2018, 17, 162–173. [Google Scholar] [CrossRef]
- Montalban, X.; Gold, R.; Thompson, A.J.; Otero-Romero, S.; Amato, M.P.; Chandraratna, D.; Clanet, M.; Comi, G.; Derfuss, T.; Fazekas, F.; et al. ECTRIMS/EAN Guideline on the pharmacological treatment of people with multiple sclerosis. Mult. Scler. 2018, 24, 96–120. [Google Scholar] [CrossRef]
- Montalban, X.; Gold, R.; Thompson, A.J.; Otero-Romero, S.; Amato, M.P.; Chandraratna, D.; Clanet, M.; Comi, G.; Derfuss, T.; Fazekas, F.; et al. ECTRIMS/EAN guideline on the pharmacological treatment of people with multiple sclerosis. Eur. J. Neurol. 2018, 25, 215–237. [Google Scholar] [CrossRef]
- Tintore, M.; Rovira, À.; Río, J.; Otero-Romero, S.; Arrambide, G.; Tur, C.; Comabella, M.; Nos, C.; Arévalo, M.J.; Negrotto, L.; et al. Defining high, medium and low impact prognostic factors for developing multiple sclerosis. Brain 2015, 138 Pt 7, 1863–1874. [Google Scholar] [CrossRef]
- Comi, G.; Radaelli, M.; Sorensen, P.S. Evolving concepts in the treatment of relapsing multiple sclerosis. Lancet 2017, 389, 1347–1356. [Google Scholar] [CrossRef]
- Drabik, A.; Bierczynska-Krzysik, A.; Bodzon-Kulakowska, A.; Suder, P.; Kotlińska, J.; Silberring, J. Proteomics in neurosciences. Mass Spectrom. Rev. 2007, 26, 432–450. [Google Scholar] [CrossRef]
- Choe, L.H.; Dutt, M.J.; Relkin, N.; Lee, K.H. Studies of potential cerebrospinal fluid molecular markers for Alzheimer’s disease. Electrophoresis 2002, 23, 2247–2251. [Google Scholar] [CrossRef]
- Aslam, B.; Basit, M.; Nisar, M.A.; Khurshid, M.; Rasool, M.H. Proteomics: Technologies and Their Applications. J. Chromatogr. Sci. 2017, 55, 182–196. [Google Scholar] [CrossRef] [PubMed]
- Hage, D.S.; Anguizola, J.A.; Bi, C.; Li, R.; Matsuda, R.; Papastavros, E.; Pfaunmiller, E.; Vargas, J.; Zheng, X. Pharmaceutical and biomedical applications of affinity chromatography: Recent trends and developments. J. Pharm. Biomed. Anal. 2012, 69, 93–105. [Google Scholar] [CrossRef] [PubMed]
- Rissin, D.M.; Kan, C.W.; Campbell, T.G.; Howes, S.C.; Fournier, D.R.; Song, L.; Piech, T.; Patel, P.P.; Chang, L.; Rivnak, A.J.; et al. Single-molecule enzyme-linked immunosorbent assay detects serum proteins at subfemtomolar concentrations. Nat. Biotechnol. 2010, 28, 595–599. [Google Scholar] [CrossRef] [PubMed]
- Lequin, R.M. Enzyme immunoassay (EIA)/enzyme-linked immunosorbent assay (ELISA). Clin. Chem. 2005, 51, 2415–2418. [Google Scholar] [CrossRef]
- Kurien, B.T.; Scofield, R.H. Western blotting. Methods 2006, 38, 283–293. [Google Scholar] [CrossRef] [PubMed]
- Issaq, H.; Veenstra, T. Two-dimensional polyacrylamide gel electrophoresis (2D-PAGE): Advances and perspectives. Biotechniques 2008, 44, 697–698, 700. [Google Scholar] [CrossRef]
- Marouga, R.; David, S.; Hawkins, E. The development of the DIGE system: 2D fluorescence difference gel analysis technology. Anal. Bioanal. Chem. 2005, 382, 669–678. [Google Scholar] [CrossRef]
- Shiio, Y.; Aebersold, R. Quantitative proteome analysis using isotope-coded affinity tags and mass spectrometry. Nat. Protoc. 2006, 1, 139–145. [Google Scholar] [CrossRef]
- Wiese, S.; Reidegeld, K.A.; Meyer, H.E.; Warscheid, B. Protein labeling by iTRAQ: A new tool for quantitative mass spectrometry in proteome research. Proteomics 2007, 7, 340–350. [Google Scholar] [CrossRef]
- Smyth, M.S.; Martin, J.H. X ray crystallography. Mol. Pathol. 2000, 53, 8–14. [Google Scholar] [CrossRef]
- WHO International Programme on Chemical Safety. Biomarkers in Risk Assessment: Validity and Validation. Available online: http://www.inchem.org/documents/ehc/ehc/ehc222.htm (accessed on 22 March 2022).
- Sen, M.K.; Almuslehi, M.S.M.; Shortland, P.J.; Mahns, D.A.; Coorssen, J.R. Proteomics of Multiple Sclerosis: Inherent Issues in Defining the Pathoetiology and Identifying (Early) Biomarkers. Int. J. Mol. Sci. 2021, 22, 7377. [Google Scholar] [CrossRef] [PubMed]
- Coorssen, J.R.; Yergey, A.L. Proteomics is Analytical Chemistry: Fitness-for-Purpose in the Application of Top-Down and Bottom-Up Analyses. Proteomes 2015, 3, 440–453. [Google Scholar] [CrossRef] [PubMed]
- Skinner, O.S.; Do Vale, L.H.; Catherman, A.D.; Havugimana, P.C.; de Sousa, M.V.; Compton, P.D.; Kelleher, N.L. Native GELFrEE: A new separation technique for biomolecular assemblies. Anal. Chem. 2015, 87, 3032–3038. [Google Scholar] [CrossRef] [PubMed]
- Melani, R.D.; Seckler, H.S.; Skinner, O.S.; Do Vale, L.H.; Catherman, A.D.; Havugimana, P.C.; de Sousa, M.V.; Domont, G.B.; Kelleher, N.L.; Compton, P.D. CN-GELFrEE—Clear Native Gel-eluted Liquid Fraction Entrapment Electrophoresis. J. Vis. Exp. 2016, 2016, 53597. [Google Scholar] [CrossRef] [PubMed]
- Wright, E.P.; Partridge, M.A.; Padula, M.P.; Gauci, V.J.; Malladi, C.S.; Coorssen, J.R. Top-down proteomics: Enhancing 2D gel electrophoresis from tissue processing to high-sensitivity protein detection. Proteomics 2014, 14, 872–889. [Google Scholar] [PubMed]
- Wright, E.P.; Prasad, K.A.; Padula, M.P.; Coorssen, J.R. Deep imaging: How much of the proteome does current top-down technology already resolve? PLoS ONE 2014, 9, e86058. [Google Scholar] [CrossRef] [PubMed]
- Hiede, B.; Koehler, C.J.; Strozynski, M.; Treumann, A.; Stein, R.; Zimny-Arndt, U.; Schmid, M.; Jungblut, P.R. High resolution quantitative proteomics of HeLa cells protein species using stable isotope labeling with amino acids in cell culture (SILAC), two-dimensional gel electrophoresis (2DE) and nano-liquid chromatograpohy coupled to an LTQ-OrbitrapMass spectrometer. Mol. Cell Proteom. 2013, 12, 529–538. [Google Scholar]
- Zhang, Y.; Fonslow, B.R.; Shan, B.; Baek, M.C.; Yates, J.R., III. Protein analysis by shotgun/bottom-up proteomics. Chem. Rev. 2013, 113, 2343–2394. [Google Scholar] [CrossRef]
- Oliveira, B.M.; Coorssen, J.R.; Martins-de-Souza, D. 2DE: The phoenix of proteomics. J. Proteom. 2014, 104, 140–150. [Google Scholar] [CrossRef]
- Rogowska-Wrzesinska, A.; Le Bihan, M.C.; Thaysen-Andersen, M.; Roepstorff, P. 2D gels still have a niche in proteomics. J. Proteom. 2013, 88, 4–13. [Google Scholar] [CrossRef]
- Singh, V.; Hintzen, R.Q.; Luider, T.M.; Stoop, M.P. Proteomics technologies for biomarker discovery in multiple sclerosis. J. Neuroimmunol. 2012, 248, 40–47. [Google Scholar] [CrossRef] [PubMed]
- Schaarschmidt, H.; Prange, H.W.; Reiber, H. Neuron-specific enolase concentrations in blood as a prognostic parameter in cerebrovascular diseases. Stroke 1994, 25, 558–565. [Google Scholar] [CrossRef] [PubMed]
- Zolg, J.W.; Langen, H. How industry is approaching the search for new diagnostic markers and biomarkers. Mol. Cell Proteom. 2004, 3, 345–354. [Google Scholar] [CrossRef] [PubMed]
- Davidsson, P.; Sjogren, M. The use of proteomics in biomarker discovery in neurodegenerative diseases. Dis. Mark. 2005, 21, 81–92. [Google Scholar] [CrossRef]
- Wright, B.L.; Lai, J.T.; Sinclair, A.J. Cerebrospinal fluid and lumbar puncture: A practical review. J. Neurol. 2012, 259, 1530–1545. [Google Scholar] [CrossRef]
- Felgenhauer, K. Protein size and cerebrospinal fluid composition. Klin. Wochenschr. 1974, 52, 1158–1164. [Google Scholar] [CrossRef]
- Rahimi, J.; Woehrer, A. Overview of cerebrospinal fluid cytology. Handb. Clin. Neurol 2017, 145, 563–571. [Google Scholar]
- Hladky, S.B.; Barrand, M.A. Fluid and ion transfer across the blood-brain and blood-cerebrospinal fluid barriers; a comparative account of mechanisms and roles. Fluids Barriers CNS 2016, 13, 19. [Google Scholar] [CrossRef]
- Wormwood, K.L.; Aslebagh, R.; Channaveerappa, D.; DuPree, E.J.; Borland, M.M.; Ryan, J.P.; Darie, C.C.; Woods, A.G. Salivary proteomics and biomarkers in neurology and psychiatry. Proteom. Clin. Appl. 2015, 9, 899–906. [Google Scholar] [CrossRef]
- John, M.A.R.S.; Li, Y.; Zhou, X.; Denny, P.; Ho, C.-M.; Montemagno, C.; Shi, W.; Qi, F.; Wu, B.; Sinha, U.; et al. Interleukin 6 and interleukin 8 as potential biomarkers for oral cavity and oropharyngeal squamous cell carcinoma. Arch. Otolaryngol. Head Neck Surg. 2004, 130, 929–935. [Google Scholar] [CrossRef]
- Scarano, E.; Fiorita, A.; Picciotti, P.M.; Passali, G.C.; Calò, L.; Cabras, T.; Inzitari, R.; Fanali, C.; Messana, I.; Castagnola, M.; et al. Proteomics of saliva: Personal experience. Acta Otorhinolaryngol. Ital. 2010, 30, 125–130. [Google Scholar] [PubMed]
- Schulz, B.L.; Cooper-White, J.; Punyadeera, C.K. Saliva proteome research: Current status and future outlook. Crit. Rev. Biotechnol. 2013, 33, 246–259. [Google Scholar] [CrossRef] [PubMed]
- Yan, W.; Apweiler, R.; Balgley, B.; Boontheung, P.; Bundy, J.L.; Cargile, B.J.; Cole, S.; Fang, X.; Gonzalez-Begne, M.; Griffin, T.; et al. Systematic comparison of the human saliva and plasma proteomes. Proteom. Clin. Appl. 2009, 3, 116–134. [Google Scholar] [CrossRef] [PubMed]
- Pfaffe, T.; Cooper-White, J.; Beyerlein, P.; Kostner, K.; Punyadeera, C. Diagnostic potential of saliva: Current state and future applications. Clin. Chem. 2011, 57, 675–687. [Google Scholar] [CrossRef] [PubMed]
- Salvisberg, C.; Tajouri, N.; Hainard, A.; Burkhard, P.R.; Lalive, P.H.; Turck, N. Exploring the human tear fluid: Discovery of new biomarkers in multiple sclerosis. Proteom. Clin. Appl. 2014, 8, 185–194. [Google Scholar] [CrossRef] [PubMed]
- Choy, C.K.; Cho, P.; Chung, W.Y.; Benzie, I.F. Water-soluble antioxidants in human tears: Effect of the collection method. Investig. Ophthalmol. Vis. Sci. 2001, 42, 3130–3134. [Google Scholar]
- Ozdemir, M.; Temizdemir, H. Age- and gender-related tear function changes in normal population. Eye 2010, 24, 79–83. [Google Scholar] [CrossRef]
- Dumortier, G.; Chaumeil, J.C. Lachrymal determinations: Methods and updates on biopharmaceutical and clinical applications. Ophthalmic Res. 2004, 36, 183–194. [Google Scholar] [CrossRef]
- Green-Church, K.B.; Nichols, K.K.; Kleinholz, N.M.; Zhang, L.; Nichols, J.J. Investigation of the human tear film proteome using multiple proteomic approaches. Mol. Vis. 2008, 14, 456–470. [Google Scholar]
- Zhou, L.; Zhao, S.Z.; Koh, S.K.; Chen, L.; Vaz, C.; Tanavde, V.; Li, X.R.; Beuerman, R.W. In-depth analysis of the human tear proteome. J. Proteom. 2012, 75, 3877–3885. [Google Scholar] [CrossRef]
- Pisitkun, T.; Johnstone, R.; Knepper, M.A. Discovery of urinary biomarkers. Mol. Cell Proteom. 2006, 5, 1760–1771. [Google Scholar] [CrossRef] [PubMed]
- Gebregiworgis, T.; Nielsen, H.H.; Massilamany, C.; Gangaplara, A.; Reddy, J.; Illes, Z.; Powers, R.A. Urinary Metabolic Signature for Multiple Sclerosis and Neuromyelitis Optica. J. Proteome Res. 2016, 15, 659–666. [Google Scholar] [CrossRef] [PubMed]
- Parsons, C.L.; Proctor, J.; Teichman, J.S.; Nickel, J.C.; Davis, E.; Evans, R.; Zupkas, P.; Phillips, C.; Shaw, T.; Naidu, N.; et al. A multi-site study confirms abnormal glycosylation in the Tamm-Horsfall protein of patients with interstitial cystitis. J. Urol. 2011, 186, 112–116. [Google Scholar] [CrossRef] [PubMed]
- HUPO—The Human Proteome Organization. A gene-centric human proteome project. Mol. Cell Proteom. 2010, 9, 427–429. [Google Scholar] [CrossRef] [PubMed]
- Gygi, S.P.; Rochon, Y.; Franza, B.R.; Aebersold, R. Correlation between protein and mRNA abundance in yeast. Mol. Cell Biol. 1999, 19, 1720–1730. [Google Scholar] [CrossRef] [PubMed]
- Chen, J.Q.; Wakefield, L.M.; Goldstein, D.J. Capillary nano-immunoassays: Advancing quantitative proteomics analysis, biomarker assessment, and molecular diagnostics. J. Transl. Med. 2015, 13, 182. [Google Scholar] [CrossRef] [PubMed]
- Luchini, A.; Fredolini, C.; Espina, B.; Meani, F.; Reeder, A.; Rucker, S.; Petricoin, E.; Liotta, L. Nanoparticle technology: Addressing the fundamental roadblocks to protein biomarker discovery. Curr. Mol. Med. 2010, 10, 133–141. [Google Scholar] [CrossRef] [PubMed]
- Rivers, T.M.; Sprunt, D.H.; Berry, G.P. Observations on Attempts to Produce Acute Disseminated Encephalomyelitis in Monkeys. J. Exp. Med. 1933, 58, 39–53. [Google Scholar] [CrossRef]
- Blakemore, W.F. Demyelination of the superior cerebellar peduncle in the mouse induced by cuprizone. J. Neurol. Sci. 1973, 20, 63–72. [Google Scholar] [CrossRef]
- Lindner, M.; Heine, S.; Haastert-Talini, K.; Garde, N.; Fokuhl, J.; Linsmeier, F.; Grothe, C.; Baumgärtner, W.; Stangel, M. Sequential myelin protein expression during remyelination reveals fast and efficient repair after central nervous system demyelination. Neuropathol. Appl. Neurobiol. 2008, 34, 105–114. [Google Scholar] [CrossRef]
- Fazeli, A.S.; Nasrabadi, D.; Sanati, M.H.; Pouya, A.; Ibrahim, S.M.; Baharvand, H.; Salekdeh, G. Proteome analysis of brain in murine experimental autoimmune encephalomyelitis. Proteomics 2010, 10, 2822–2832. [Google Scholar] [CrossRef] [PubMed]
- Mahad, D.; Ziabreva, I.; Lassmann, H.; Turnbull, D. Mitochondrial defects in acute multiple sclerosis lesions. Brain 2008, 131, 1722–1735. [Google Scholar] [CrossRef] [PubMed]
- Jastorff, A.M.; Haegler, K.; Maccarrone, G.; Holsboer, F.; Weber, F.; Ziemssen, T.; Turck, C.W. Regulation of proteins mediating neurodegeneration in experimental autoimmune encephalomyelitis and multiple sclerosis. Proteom. Clin. Appl. 2009, 3, 1273–1287. [Google Scholar] [CrossRef] [PubMed]
- Jain, M.R.; Bian, S.; Liu, T.; Hu, J.; Elkabes, S.; Li, H. Altered proteolytic events in experimental autoimmune encephalomyelitis discovered by iTRAQ shotgun proteomics analysis of spinal cord. Proteome Sci. 2009, 7, 25. [Google Scholar] [CrossRef] [PubMed]
- Mikkat, S.; Lorenz, P.; Scharf, C.; Yu, X.; Glocker, M.O.; Ibrahim, S.M. MS characterization of qualitative protein polymorphisms in the spinal cords of inbred mouse strains. Proteomics 2010, 10, 1050–1062. [Google Scholar] [CrossRef] [PubMed]
- Hasan, M.; Min, H.; Rahaman, K.A.; Muresan, A.R.; Kim, H.; Han, D.; Kwon, O.S. Quantitative Proteome Analysis of Brain Subregions and Spinal Cord from Experimental Autoimmune Encephalomyelitis Mice by TMT-Based Mass Spectrometry. Proteomics 2019, 19, e1800355. [Google Scholar] [CrossRef]
- Rosenling, T.; Stoop, M.P.; Attali, A.; van Aken, H.; Suidgeest, E.; Christin, C.; Stingl, C.; Suits, F.; Horvatovich, P.; Hintzen, R.Q.; et al. Profiling and identification of cerebrospinal fluid proteins in a rat EAE model of multiple sclerosis. J. Proteome Res. 2012, 11, 2048–2060. [Google Scholar] [CrossRef]
- Oveland, E.; Ahmad, I.; Lereim, R.R.; Kroksveen, A.C.; Barsnes, H.; Guldbrandsen, A.; Myhr, K.-M.; Bø, L.; Berven, F.S.; Wergeland, S. Cuprizone and EAE mouse frontal cortex proteomics revealed proteins altered in multiple sclerosis. Sci. Rep. 2021, 11, 7174. [Google Scholar] [CrossRef]
- Partridge, M.A.; Gopinath, S.; Myers, S.J.; Coorssen, J.R. An initial top-down proteomic analysis of the standard cuprizone mouse model of multiple sclerosis. J. Chem. Biol. 2016, 9, 9–18. [Google Scholar] [CrossRef]
- Raphael, I.; Mahesula, S.; Kalsaria, K.; Kotagiri, V.; Purkar, A.B.; Anjanappa, M.; Shah, D.; Pericherla, V.; Jadhav, Y.L.A.; Raghunathan, R.; et al. Microwave and magnetic (M(2)) proteomics of the experimental autoimmune encephalomyelitis animal model of multiple sclerosis. Electrophoresis 2012, 33, 3810–3819. [Google Scholar] [CrossRef]
- Schreibelt, G.; van Horssen, J.; Haseloff, R.F.; Reijerkerk, A.; van der Pol, S.M.; Nieuwenhuizen, O.; Krause, E.; Blasig, I.E.; Dijkstra, C.D.; Ronken, E.; et al. Protective effects of peroxiredoxin-1 at the injured blood-brain barrier. Free Radic. Biol. Med. 2008, 45, 256–264. [Google Scholar] [CrossRef] [PubMed]
- Mahesula, S.; Raphael, I.; Raghunathan, R.; Kalsaria, K.; Kotagiri, V.; Purkar, A.B.; Anjanappa, M.; Shah, D.; Pericherla, V.; Jadhav, Y.L.A.; et al. Immunoenrichment microwave and magnetic proteomics for quantifying CD47 in the experimental autoimmune encephalomyelitis model of multiple sclerosis. Electrophoresis 2012, 33, 3820–3829. [Google Scholar] [CrossRef] [PubMed]
- Platten, M.; Youssef, S.; Hur, E.M.; Ho, P.P.; Han, M.H.; Lanz, T.V.; Phillips, L.K.; Goldstein, M.J.; Bhat, R.; Raine, C.S.; et al. Blocking angiotensin-converting enzyme induces potent regulatory T cells and modulates TH1- and TH17-mediated autoimmunity. Proc. Natl. Acad. Sci. USA 2009, 106, 14948–14953. [Google Scholar] [CrossRef] [PubMed]
- Willis, C.M.; Nicaise, A.M.; Menoret, A.; Ryu, J.K.; Mendiola, A.S.; Jellison, E.R.; Givogri, M.I.; Han, D.K.; Bongarzone, E.R.; Akassoglou, K.; et al. Extracellular vesicle fibrinogen induces encephalitogenic CD8+ T cells in a mouse model of multiple sclerosis. Proc. Natl. Acad. Sci. USA 2019, 116, 10488–10493. [Google Scholar] [CrossRef] [PubMed]
- Schulze-Topphoff, U.; Prat, A.; Prozorovski, T.; Siffrin, V.; Paterka, M.; Herz, J.; Bendix, I.; Ifergan, I.; Schadock, I.; Mori, M.; et al. Activation of kinin receptor B1 limits encephalitogenic T lymphocyte recruitment to the central nervous system. Nat. Med. 2009, 15, 788–793. [Google Scholar] [CrossRef]
- Oveland, E.; Nystad, A.; Berven, F.; Myhr, K.-M.; Torkildsen, Ø.; Wergeland, S. 1,25-Dihydroxyvitamin-D3 induces brain proteomic changes in cuprizone mice during remyelination involving calcium proteins. Neurochem. Int. 2018, 112, 267–277. [Google Scholar] [CrossRef]
- Ding, X.; Jo, J.; Wang, C.-Y.; Cristobal, C.D.; Zuo, Z.; Ye, Q.; Wirianto, M.; Lindeke-Myers, A.; Choi, J.M.; Mohila, C.A.; et al. The Daam2-VHL-Nedd4 axis governs developmental and regenerative oligodendrocyte differentiation. Genes Dev. 2020, 34, 1177–1189. [Google Scholar] [CrossRef]
- Montecchi, T.; Shaba, E.; De Tommaso, D.; Di Giuseppe, F.; Angelucci, S.; Bini, L.; Landi, C.; Baldari, C.T.; Ulivieri, C. Differential Proteomic Analysis of Astrocytes and Astrocytes-Derived Extracellular Vesicles from Control and Rai Knockout Mice: Insights into the Mechanisms of Neuroprotection. Int. J. Mol. Sci. 2021, 22, 7933. [Google Scholar] [CrossRef]
- Han, M.H.; Hwang, S.; Roy, D.B.; Lundgren, D.H.; Price, J.V.; Ousman, S.S.; Fernald, G.H.; Gerlitz, B.; Robinson, W.H.; Baranzini, S.E.; et al. Proteomic analysis of active multiple sclerosis lesions reveals therapeutic targets. Nature 2008, 451, 1076–1081. [Google Scholar] [CrossRef]
- Maccarrone, G.; Nischwitz, S.; Deininger, S.-O.; Hornung, J.; König, F.B.; Stadelmann, C.; Turck, C.W.; Weber, F. MALDI imaging mass spectrometry analysis—A new approach for protein mapping in multiple sclerosis brain lesions. J. Chromatogr. B 2017, 1047, 131–140. [Google Scholar] [CrossRef]
- Brown, N.; Alkhayer, K.; Clements, R.; Singhal, N.; Gregory, R.; Azzam, S.; Li, S.; Freeman, E.; McDonough, J. Neuronal Hemoglobin Expression and Its Relevance to Multiple Sclerosis Neuropathology. J. Mol. Neurosci. 2016, 59, 1–17. [Google Scholar] [CrossRef] [PubMed]
- Ifergan, I.; Kebir, H.; Terouz, S.; Alvarez, J.I.; Lécuyer, M.A.; Gendron, S.; Bourbonnière, L.; Dunay, I.R.; Bouthillier, A.; Moumdjian, R.; et al. Role of Ninjurin-1 in the migration of myeloid cells to central nervous system inflammatory lesions. Ann. Neurol. 2011, 70, 751–763. [Google Scholar] [CrossRef] [PubMed]
- Broadwater, L.; Pandit, A.; Clements, R.; Azzam, S.; Vadnal, J.; Sulak, M.; Yong, V.W.; Freeman, E.J.; Gregory, R.B.; McDonough, J. Analysis of the mitochondrial proteome in multiple sclerosis cortex. Biochim. Biophys. Acta 2011, 1812, 630–641. [Google Scholar] [CrossRef] [PubMed]
- Faigle, W.; Cruciani, C.; Wolski, W.; Roschitzki, B.; Puthenparampil, M.; Tomas-Ojer, P.; Sellés-Moreno, C.; Zeis, T.; Jelcic, I.; Schaeren-Wiemers, N.; et al. Brain Citrullination Patterns and T Cell Reactivity of Cerebrospinal Fluid-Derived CD4(+) T Cells in Multiple Sclerosis. Front. Immunol. 2019, 10, 540. [Google Scholar] [CrossRef]
- Starost, L.; Lindner, M.; Herold, M.; Xu, Y.K.T.; Drexler, H.C.A.; Heß, K.; Ehrlich, M.; Ottoboni, L.; Ruffini, F.; Stehling, M.; et al. Extrinsic immune cell-derived, but not intrinsic oligodendroglial factors contribute to oligodendroglial differentiation block in multiple sclerosis. Acta Neuropathol. 2020, 140, 715–736. [Google Scholar] [CrossRef] [PubMed]
- Kotelnikova, E.; Kiani, N.A.; Messinis, D.; Pertsovskaya, I.; Pliaka, V.; Bernardo-Faura, M.; Rinas, M.; Vila, G.; Zubizarreta, I.; Pulido-Valdeolivas, I.; et al. MAPK pathway and B cells overactivation in multiple sclerosis revealed by phosphoproteomics and genomic analysis. Proc. Natl. Acad. Sci. USA 2019, 116, 9671–9676. [Google Scholar] [CrossRef]
- Nicaise, A.M.; Wagstaff, L.J.; Willis, C.M.; Paisie, C.; Chandok, H.; Robson, P.; Fossati, V.; Williams, A.; Crocker, S.J. Cellular senescence in progenitor cells contributes to diminished remyelination potential in progressive multiple sclerosis. Proc. Natl. Acad. Sci. USA 2019, 116, 9030–9039. [Google Scholar] [CrossRef]
- Kroksveen, A.C.; Jaffe, J.D.; Aasebø, E.; Barsnes, H.; Bjørlykke, Y.; Franciotta, D.; Keshishian, H.; Myhr, K.-M.; Opsahl, J.A.; van Pesch, V.; et al. Quantitative proteomics suggests decrease in the secretogranin-1 cerebrospinal fluid levels during the disease course of multiple sclerosis. Proteomics 2015, 15, 3361–3369. [Google Scholar] [CrossRef]
- Pavelek, Z.; Vyšata, O.; Tambor, V.; Pimková, K.; Vu, D.L.; Kuča, K.; Stourac, P.; Vališ, M. Proteomic analysis of cerebrospinal fluid for relapsing-remitting multiple sclerosis and clinically isolated syndrome. Biomed. Rep. 2016, 5, 35–40. [Google Scholar] [CrossRef]
- Kroksveen, A.C.; Guldbrandsen, A.; Vaudel, M.; Lereim, R.R.; Barsnes, H.; Myhr, K.M.; Torkildsen, Ø.; Berven, F.S. In-Depth Cerebrospinal Fluid Quantitative Proteome and Deglycoproteome Analysis: Presenting a Comprehensive Picture of Pathways and Processes Affected by Multiple Sclerosis. J. Proteome Res. 2017, 16, 179–194. [Google Scholar] [CrossRef]
- Rai, N.K.; Singh, V.; Li, L.; Willard, B.; Tripathi, A.; Dutta, R. Comparative Proteomic Profiling Identifies Reciprocal Expression of Mitochondrial Proteins between White and Gray Matter Lesions from Multiple Sclerosis Brains. Front. Neurol. 2021, 12, 779003. [Google Scholar] [PubMed]
- Hecker, M.; Fitzner, B.; Wendt, M.; Lorenz, P.; Flechtner, K.; Steinbeck, F.; Schröder, I.; Thiesen, H.J.; Zettl, U.K. High-Density Peptide Microarray Analysis of IgG Autoantibody Reactivities in Serum and Cerebrospinal Fluid of Multiple Sclerosis Patients. Mol. Cell Proteom. 2016, 15, 1360–1380. [Google Scholar] [CrossRef] [PubMed]
- Mosleth, E.F.; Vedeler, C.A.; Liland, K.H.; McLeod, A.; Bringeland, G.H.; Kroondijk, L.; Berven, F.S.; Lysenko, A.; Rawlings, C.J.; Eid, K.E.-H.; et al. Cerebrospinal fluid proteome shows disrupted neuronal development in multiple sclerosis. Sci. Rep. 2021, 11, 4087. [Google Scholar] [CrossRef] [PubMed]
- Wallin, M.T.; Oh, U.; Nyalwidhe, J.; Semmes, J.; Kislinger, T.; Coffman, P.; Kurtzke, J.F.; Jacobson, S. Serum proteomic analysis of a pre-symptomatic multiple sclerosis cohort. Eur. J. Neurol. 2015, 22, 591–599. [Google Scholar] [CrossRef]
- Fiorini, A.; Koudriavtseva, T.; Bucaj, E.; Coccia, R.; Foppoli, C.; Giorgi, A.; Schininà, M.E.; Di Domenico, F.; De Marco, F.; Perluigi, M. Involvement of oxidative stress in occurrence of relapses in multiple sclerosis: The spectrum of oxidatively modified serum proteins detected by proteomics and redox proteomics analysis. PLoS ONE 2013, 8, e65184. [Google Scholar] [CrossRef]
- Ayoglu, B.; Mitsios, N.; Kockum, I.; Khademi, M.; Zandian, A.; Sjöberg, R.; Forsström, B.; Bredenberg, J.; Bomfim, I.L.; Holmgren, E.; et al. Anoctamin 2 identified as an autoimmune target in multiple sclerosis. Proc. Natl. Acad. Sci. USA 2016, 113, 2188–2193. [Google Scholar] [CrossRef]
- Ayoglu, B.; Häggmark, A.; Khademi, M.; Olsson, T.; Uhlen, M.; Schwenk, J.; Nilsson, P. Autoantibody profiling in multiple sclerosis using arrays of human protein fragments. Mol. Cell Proteom. 2013, 12, 2657–2672. [Google Scholar] [CrossRef]
- Cvetko, A.; Kifer, D.; Gornik, O.; Klarić, L.; Visser, E.; Lauc, G.; Wilson, J.F.; Štambuk, T. Glycosylation Alterations in Multiple Sclerosis Show Increased Proinflammatory Potential. Biomedicines 2020, 8, 410. [Google Scholar] [CrossRef]
- Manconi, B.; Liori, B.; Cabras, T.; Vincenzoni, F.; Iavarone, F.; Lorefice, L.; Cocco, E.; Castagnola, M.; Messana, I.; Olianas, A. Top-down proteomic profiling of human saliva in multiple sclerosis patients. J. Proteom. 2018, 187, 212–222. [Google Scholar] [CrossRef]
- Sandi, D.; Bereg, E.; Biernacki, T.; Vörös, E.; Klivényi, P.; Bereczki, C.; Vécsei, L.; Bencsik, K. Pediatric multiple sclerosis and fulminant disease course: Features and approaches to treatment—A case report and review of the literature. J. Clin. Neurosci. 2018, 53, 13–19. [Google Scholar] [CrossRef]
- Rithidech, K.N.; Honikel, L.; Milazzo, M.; Madigan, D.; Troxell, R.; Krupp, L.B. Protein expression profiles in pediatric multiple sclerosis: Potential biomarkers. Mult. Scler. 2009, 15, 455–464. [Google Scholar] [CrossRef] [PubMed]
- Agnello, D.; Carvelli, L.; Muzio, V.; Villa, P.; Bottazzi, B.; Polentarutti, N.; Mennini, T.; Mantovani, A.; Ghezzi, P. Increased peripheral benzodiazepine binding sites and pentraxin 3 expression in the spinal cord during EAE: Relation to inflammatory cytokines and modulation by dexamethasone and rolipram. J. Neuroimmunol. 2000, 109, 105–111. [Google Scholar] [CrossRef]
- Adam, P.; Sobek, O.; Táborský, L.; Hildebrand, T.; Tutterová, O.; Žáček, P. CSF and serum orosomucoid (alpha-1-acid glycoprotein) in patients with multiple sclerosis: A comparison among particular subgroups of MS patients. Clin. Chim. Acta 2003, 334, 107–110. [Google Scholar] [CrossRef]
- Solmaz, I.; Kocak, E.; Kaplan, O.; Celebier, M.; Anlar, B. Analysis of plasma protein biomarkers in childhood onset multiple sclerosis. J. Neuroimmunol. 2020, 348, 577359. [Google Scholar] [CrossRef] [PubMed]
- Hassan, D.; Provansal, M.; Lehmann, S.; Rizk, M.; Moez, P.; Vialaret, J.; Hirtz, C.; Essa, A.; Agamia, H. Proteomic profile of cerebrospinal fluid in patients with multiple sclerosis using two dimensional gel electrophoresis. Br. J. Biomed. Sci. 2016, 73, 143–146. [Google Scholar] [CrossRef] [PubMed]
- Kroksveen, A.C.; Guldbrandsen, A.; Vedeler, C.; Myhr, K.M.; Opsahl, J.A.; Berven, F.S. Cerebrospinal fluid proteome comparison between multiple sclerosis patients and controls. Acta Neurol. Scand. 2012, 196, 90–96. [Google Scholar] [CrossRef]
- Shi, Y.; Ding, Y.; Li, G.; Wang, L.; Osman, R.A.; Sun, J.; Qian, L.; Zheng, G.; Zhang, G. Discovery of Novel Biomarkers for Diagnosing and Predicting the Progression of Multiple Sclerosis Using TMT-Based Quantitative Proteomics. Front. Immunol. 2021, 12, 700031. [Google Scholar] [CrossRef]
- Elkjaer, M.L.; Nawrocki, A.; Kacprowski, T.; Lassen, P.; Simonsen, A.H.; Marignier, R.; Sejbaek, T.; Nielsen, H.H.; Wermuth, L.; Rashid, A.Y.; et al. CSF proteome in multiple sclerosis subtypes related to brain lesion transcriptomes. Sci. Rep. 2021, 11, 4132. [Google Scholar] [CrossRef]
- Fissolo, N.; Matute-Blanch, C.; Osman, M.; Costa, C.; Pinteac, R.; Miró, B.; Sanchez, A.; Brito, V.; Dujmovic, I.; Voortman, M.; et al. CSF SERPINA3 Levels Are Elevated in Patients with Progressive MS. Neurol. Neuroimmunol. Neuroinflamm. 2021, 8, e941. [Google Scholar] [CrossRef]
- Berge, T.; Eriksson, A.; Brorson, I.S.; Høgestøl, E.A.; Berg-Hansen, P.; Døskeland, A.; Mjaavatten, O.; Bos, S.D.; Harbo, H.F.; Berven, F. Quantitative proteomic analyses of CD4(+) and CD8(+) T cells reveal differentially expressed proteins in multiple sclerosis patients and healthy controls. Clin. Proteom. 2019, 16, 19. [Google Scholar] [CrossRef]
- Jankovska, E.; Lipcseyova, D.; Svrdlikova, M.; Pavelcova, M.; Havrdova, E.K.; Holada, K.; Petrak, J. Quantitative proteomic analysis of cerebrospinal fluid of women newly diagnosed with multiple sclerosis. Int. J. Neurosci. 2020, 1–11. [Google Scholar] [CrossRef] [PubMed]
- Singh, V.; Stingl, C.; Stoop, M.P.; Zeneyedpour, L.; Neuteboom, R.F.; Smitt, P.S.; Hintzen, R.Q.; Luider, T.M. Proteomics urine analysis of pregnant women suffering from multiple sclerosis. J. Proteome Res. 2015, 14, 2065–2073. [Google Scholar] [CrossRef] [PubMed]
- Probert, F.; Yeo, T.; Zhou, Y.; Sealey, M.; Arora, S.; Palace, J.; Claridge, T.D.W.; Hillenbrand, R.; Oechtering, J.; Kuhle, J.; et al. Determination of CSF GFAP, CCN5, and vWF Levels Enhances the Diagnostic Accuracy of Clinically Defined MS from Non-MS Patients with CSF Oligoclonal Bands. Front. Immunol. 2021, 12, 811351. [Google Scholar] [CrossRef] [PubMed]
- Linker, R.A.; Brechlin, P.; Jesse, S.; Steinacker, P.; Lee, D.H.; Asif, A.R.; Jahn, O.; Tumani, H.; Gold, R.; Otto, M. Proteome profiling in murine models of multiple sclerosis: Identification of stage specific markers and culprits for tissue damage. PLoS ONE 2009, 4, e7624. [Google Scholar] [CrossRef]
- Stoop, M.P.; Singh, V.; Dekker, L.J.; Titulaer, M.K.; Stingl, C.; Burgers, P.C.; Smitt, P.A.E.S.; Hintzen, R.Q.; Luider, T.M. Proteomics comparison of cerebrospinal fluid of relapsing remitting and primary progressive multiple sclerosis. PLoS ONE 2010, 5, e12442. [Google Scholar] [CrossRef]
- Ingram, G.; Hakobyan, S.; Loveless, S.; Robertson, N.; Morgan, B.P. Complement regulator factor H in multiple sclerosis. J. Cell Biochem. 2011, 112, 2653–2654. [Google Scholar] [CrossRef]
- Avşar, T.; Durası, I.M.; Uygunoğlu, U.; Tütüncü, M.; Demirci, N.O.; Saip, S.; Sezerman, O.U.; Siva, A.; Turanlı, E.T. CSF Proteomics Identifies Specific and Shared Pathways for Multiple Sclerosis Clinical Subtypes. PLoS ONE 2015, 10, e0122045. [Google Scholar] [CrossRef]
- Martin, N.A.; Nawrocki, A.; Molnar, V.; Elkjaer, M.L.; Thygesen, E.K.; Palkovits, M.; Acs, P.; Sejbaek, T.; Nielsen, H.H.; Hegedus, Z.; et al. Orthologous proteins of experimental de- and remyelination are differentially regulated in the CSF proteome of multiple sclerosis subtypes. PLoS ONE 2018, 13, e0202530. [Google Scholar] [CrossRef]
- Hinsinger, G.; Galéotti, N.; Nabholz, N.; Urbach, S.; Rigau, V.; Demattei, C.; Lehmann, S.; Camu, W.; Labauge, P.; Castelnovo, G.; et al. Chitinase 3-like proteins as diagnostic and prognostic biomarkers of multiple sclerosis. Mult. Scler. 2015, 21, 1251–1261. [Google Scholar] [CrossRef]
- Liguori, M.; Qualtieri, A.; Tortorella, C.; Direnzo, V.; Bagalà, A.; Mastrapasqua, M.; Spadafora, P.; Trojano, M. Proteomic profiling in multiple sclerosis clinical courses reveals potential biomarkers of neurodegeneration. PLoS ONE 2014, 9, e103984. [Google Scholar] [CrossRef]
- Komori, M.; Matsuyama, Y.; Nirasawa, T.; Thiele, H.; Becker, M.; Alexandrov, T.; Saida, T.; Tanaka, M.; Matsuo, H.; Tomimoto, H.; et al. Proteomic pattern analysis discriminates among multiple sclerosis-related disorders. Ann. Neurol. 2012, 71, 614–623. [Google Scholar] [CrossRef] [PubMed]
- Jiang, S.; Lu, Q.; Hu, S.; Chen, Y.; Liu, X.; Yang, Y.; Ding, M. Proteomics comparison of the sera from multiple sclerosis patients and neuromyelitis optica patients. Genet. Mol. Res. 2014, 13, 9292–9299. [Google Scholar] [CrossRef] [PubMed]
- Lee, J.; McKinney, K.Q.; Pavlopoulos, A.J.; Han, M.H.; Kim, S.-H.; Kim, H.J.; Hwang, S. Exosomal proteome analysis of cerebrospinal fluid detects biosignatures of neuromyelitis optica and multiple sclerosis. Clin. Chim. Acta 2016, 462, 118–126. [Google Scholar] [CrossRef] [PubMed]
- Nielsen, H.H.; Beck, H.C.; Kristensen, L.P.; Burton, M.; Csépány, T.; Simo, M.; Diószeghy, P.; Sejbaek, T.; Grebing, M.; Heegaard, N.H.H.; et al. The Urine Proteome Profile Is Different in Neuromyelitis Optica Compared to Multiple Sclerosis: A Clinical Proteome Study. PLoS ONE 2015, 10, e0139659. [Google Scholar] [CrossRef]
- D’Aguanno, S.; Barassi, A.; Lupisella, S.; D’Eril, G.M.; Del Boccio, P.; Pieragostino, D.; Pallotti, F.; Carelli, V.; Valentino, M.L.; Liguori, R.; et al. Differential cerebro spinal fluid proteome investigation of Leber hereditary optic neuropathy (LHON) and multiple sclerosis. J. Neuroimmunol. 2008, 193, 156–160. [Google Scholar] [CrossRef]
- Tumani, H.; Lehmensiek, V.; Rau, D.; Guttmann, I.; Tauscher, G.; Mogel, H.; Palm, C.; Hirt, V.; Suessmuth, S.; Sapunova-Meier, I.; et al. CSF proteome analysis in clinically isolated syndrome (CIS): Candidate markers for conversion to definite multiple sclerosis. Neurosci. Lett. 2009, 452, 214–217. [Google Scholar] [CrossRef]
- Polman, C.H.; Reingold, S.C.; Edan, G.; Filippi, M.; Hartung, H.P.; Kappos, L.; Lublin, F.D.; Metz, L.M.; McFarland, H.F.; O’Connor, P.W.; et al. Diagnostic criteria for multiple sclerosis: 2005 revisions to the “McDonald Criteria”. Ann. Neurol. 2005, 58, 840–846. [Google Scholar] [CrossRef]
- Comabella, M.; Fernández, M.; Martin, R.; Rivera-Vallvé, S.; Borràs, E.; Chiva, C.; Julià, E.; Rovira, A.; Cantó, E.; Alvarez-Cermeño, J.C.; et al. Cerebrospinal fluid chitinase 3-like 1 levels are associated with conversion to multiple sclerosis. Brain 2010, 133 Pt 4, 1082–1093. [Google Scholar] [CrossRef]
- Borras, E.; Canto, E.; Choi, M.; Villar, L.M.; Álvarez-Cermeño, J.C.; Chiva, C.; Montalban, X.; Vitek, O.; Comabella, M.; Sabidó, E. Protein-Based Classifier to Predict Conversion from Clinically Isolated Syndrome to Multiple Sclerosis. Mol. Cell Proteom. 2016, 15, 318–328. [Google Scholar] [CrossRef]
- Timirci-Kahraman, O.; Karaaslan, Z.; Tuzun, E.; Kurtuncu, M.; Baykal, A.T.; Gunduz, T.; Tuzuner, M.B.; Akgun, E.; Gurel, B.; Eraksoy, M.; et al. Identification of candidate biomarkers in converting and non-converting clinically isolated syndrome by proteomics analysis of cerebrospinal fluid. Acta Neurol. Belg. 2019, 119, 101–111. [Google Scholar] [CrossRef]
- Canto, E.; Tintore, M.; Villar, L.M.; Borrás, E.; Alvarez-Cermeño, J.C.; Chiva, C.; Sabidó, E.; Rovira, A.; Montalban, X.; Comabella, M. Validation of semaphorin 7A and ala-beta-his-dipeptidase as biomarkers associated with the conversion from clinically isolated syndrome to multiple sclerosis. J. Neuroinflamm. 2014, 11, 181. [Google Scholar] [CrossRef] [PubMed]
- Probert, F.; Yeo, T.; Zhou, Y.; Sealey, M.; Arora, S.; Palace, J.; Claridge, T.D.W.; Hillenbrand, R.; Oechtering, J.; Leppert, D.; et al. Integrative biochemical, proteomics and metabolomics cerebrospinal fluid biomarkers predict clinical conversion to multiple sclerosis. Brain Commun. 2021, 3, fcab084. [Google Scholar] [CrossRef] [PubMed]
- Stoop, M.P.; Runia, T.F.; Stingl, C.; van der Vuurst de Vries, R.M.; Luider, T.M.; Hintzen, R.Q. Decreased Neuro-Axonal Proteins in CSF at First Attack of Suspected Multiple Sclerosis. Proteom. Clin. Appl. 2017, 11, 1700005. [Google Scholar] [CrossRef] [PubMed]
- Huang, J.; Khademi, M.; Fugger, L.; Lindhe, Ö.; Novakova, L.; Axelsson, M.; Malmeström, C.; Constantinescu, C.; Lycke, J.; Piehl, F.; et al. Inflammation-related plasma and CSF biomarkers for multiple sclerosis. Proc. Natl. Acad. Sci. USA 2020, 117, 12952–12960. [Google Scholar] [CrossRef] [PubMed]
- Sawai, S.; Umemura, H.; Mori, M.; Satoh, M.; Hayakawa, S.; Kodera, Y.; Tomonaga, T.; Kuwabara, S.; Nomura, F. Serum levels of complement C4 fragments correlate with disease activity in multiple sclerosis: Proteomic analysis. J. Neuroimmunol. 2010, 218, 112–115. [Google Scholar] [CrossRef]
- Li, Y.; Qin, Z.; Yang, M.; Qin, Y.; Lin, C.; Liu, S. Differential expression of complement proteins in cerebrospinal fluid from active multiple sclerosis patients. J. Cell Biochem. 2011, 112, 1930–1937. [Google Scholar] [CrossRef]
- Füvesi, J.; Hanrieder, J.; Bencsik, K.; Rajda, C.; Kovacs, S.K.; Kaizer, L.; Beniczky, S.; Vecsei, L.; Bergquist, J. Proteomic analysis of cerebrospinal fluid in a fulminant case of multiple sclerosis. Int. J. Mol. Sci. 2012, 13, 7676–7693. [Google Scholar] [CrossRef]
- Mattsson, N.; Rüetschi, U.; Podust, V.N.; Stridsberg, M.; Li, S.; Andersen, O.; Haghighi, S.; Blennow, K.; Zetterberg, H. Cerebrospinal fluid concentrations of peptides derived from chromogranin B and secretogranin II are decreased in multiple sclerosis. J. Neurochem. 2007, 103, 1932–1939. [Google Scholar] [CrossRef]
- Tremlett, H.; Dai, D.L.; Hollander, Z.; Kapanen, A.; Aziz, T.; Wilson-McManus, J.E.; Tebbutt, S.J.; Borchers, C.H.; Oger, J.; Freue, G.V.C. Serum proteomics in multiple sclerosis disease progression. J. Proteom. 2015, 118, 2–11. [Google Scholar] [CrossRef]
- Iacobaeus, E.; Arrambide, G.; Amato, M.P.; Derfuss, T.; Vukusic, S.; Hemmer, B.; Tintoré, M.; Brundin, L. Aggressive multiple sclerosis (1): Towards a definition of the phenotype. Mult. Scler. 2020, 26, 1352458520925369. [Google Scholar] [CrossRef]
- Comabella, M.; Sastre-Garriga, J.; Borras, E.; Villar, L.M.; Saiz, A.; Martínez-Yélamos, S.; García-Merino, J.A.; Pinteac, R.; Fissolo, N.; López, A.J.S.; et al. CSF Chitinase 3-Like 2 Is Associated with Long-term Disability Progression in Patients with Progressive Multiple Sclerosis. Neurol. Neuroimmunol. Neuroinflamm. 2021, 8, e1082. [Google Scholar] [CrossRef] [PubMed]
- Malekzadeh, A.; Leurs, C.; van Wieringen, W.; Steenwijk, M.D.; Schoonheim, M.M.; Amann, M.; Naegelin, Y.; Kuhle, J.; Killestein, J.; Teunissen, C.E. Plasma proteome in multiple sclerosis disease progression. Ann. Clin. Transl. Neurol. 2019, 6, 1582–1594. [Google Scholar] [CrossRef] [PubMed]
- Lewin, A.; Hamilton, S.; Witkover, A.; Langford, P.; Nicholas, R.; Chataway, J.; Bangham, C. Free serum haemoglobin is associated with brain atrophy in secondary progressive multiple sclerosis. Wellcome Open Res. 2016, 1, 10. [Google Scholar] [CrossRef] [PubMed]
- Magliozzi, R.; Hametner, S.; Facchiano, F.; Marastoni, D.; Rossi, S.; Castellaro, M.; Poli, A.; Lattanzi, F.; Visconti, A.; Nicholas, R.; et al. Iron homeostasis, complement, and coagulation cascade as CSF signature of cortical lesions in early multiple sclerosis. Ann. Clin. Transl. Neurol. 2019, 6, 2150–2163. [Google Scholar] [CrossRef]
- Sarkar, P.; Redondo, J.; Hares, K.; Bailey, S.; Georgievskaya, A.; Heesom, K.; Kemp, K.C.; Scolding, N.J.; Rice, C.M. Reduced expression of mitochondrial fumarate hydratase in progressive multiple sclerosis contributes to impaired in vitro mesenchymal stromal cell-mediated neuroprotection. Mult. Scler. J. 2021, 13524585211060686. [Google Scholar] [CrossRef] [PubMed]
- Bridel, C.; Eijlers, A.J.C.; van Wieringen, W.; Koel-Simmelink, M.; Leurs, C.E.; Schoonheim, M.; Killestein, J.; Teunissen, C.E. No Plasmatic Proteomic Signature at Clinical Disease Onset Associated with 11 Year Clinical, Cognitive and MRI Outcomes in Relapsing-Remitting Multiple Sclerosis Patients. Front. Mol. Neurosci. 2018, 11, 371. [Google Scholar] [CrossRef]
- Christiansen, C.F.; Christensen, S.; Farkas, D.K.; Miret, M.; Sørensen, H.T.; Pedersen, L. Risk of arterial cardiovascular diseases in patients with multiple sclerosis: A population-based cohort study. Neuroepidemiology 2010, 35, 267–274. [Google Scholar] [CrossRef]
- Jadidi, E.; Mohammadi, M.; Moradi, T. High risk of cardiovascular diseases after diagnosis of multiple sclerosis. Mult. Scler. 2013, 19, 1336–1340. [Google Scholar] [CrossRef]
- Tseng, C.H.; Huang, W.S.; Lin, C.L.; Chang, Y.J. Increased risk of ischaemic stroke among patients with multiple sclerosis. Eur. J. Neurol. 2015, 22, 500–506. [Google Scholar] [CrossRef]
- Persson, R.; Lee, S.; Yood, M.U.; Wagner, M.; Minton, N.; Niemcryk, S.; Lindholm, A.; Evans, A.; Jick, S. Incident cardiovascular disease in patients diagnosed with multiple sclerosis: A multi-database study. Mult. Scler. Relat. Disord. 2020, 37, 101423. [Google Scholar] [CrossRef]
- Morel, A.; Bijak, M.; Miller, E.; Rywaniak, J.; Miller, S.; Saluk, J. Relationship between the Increased Haemostatic Properties of Blood Platelets and Oxidative Stress Level in Multiple Sclerosis Patients with the Secondary Progressive Stage. Oxid. Med. Cell Longev. 2015, 2015, 240918. [Google Scholar] [CrossRef] [PubMed]
- Bijak, M.; Olejnik, A.; Rokita, B.; Morel, A.; Dziedzic, A.; Miller, E.; Saluk-Bijak, J. Increased level of fibrinogen chains in the proteome of blood platelets in secondary progressive multiple sclerosis patients. J. Cell Mol. Med. 2019, 23, 3476–3482. [Google Scholar] [CrossRef] [PubMed]
- Dziedzic, A.; Miller, E.; Bijak, M.; Przyslo, L.; Saluk-Bijak, J. Increased Pro-Thrombotic Platelet Activity Associated with Thrombin/PAR1-Dependent Pathway Disorder in Patients with Secondary Progressive Multiple Sclerosis. Int. J. Mol. Sci. 2020, 21, 7722. [Google Scholar] [CrossRef] [PubMed]
- Alexander, J.S.; Minagar, A.; Harper, M.; Robinson-Jackson, S.; Jennings, M.; Smith, S.J. Proteomic analysis of human cerebral endothelial cells activated by multiple sclerosis serum and IFNbeta-1b. J. Mol. Neurosci. 2007, 32, 169–178. [Google Scholar] [CrossRef]
- Stoop, M.P.; Singh, V.; Stingl, C.; Martin, R.; Khademi, M.; Olsson, T.; Hintzen, R.Q.; Luider, T.M. Effects of natalizumab treatment on the cerebrospinal fluid proteome of multiple sclerosis patients. J. Proteome Res. 2013, 12, 1101–1107. [Google Scholar] [CrossRef]
- Bedri, S.K.; Nilsson, O.B.; Fink, K.; Månberg, A.; Hamsten, C.; Ayoglu, B.; Manouchehrinia, A.; Nilsson, P.; Olsson, T.; Hillert, J.; et al. Plasma protein profiling reveals candidate biomarkers for multiple sclerosis treatment. PLoS ONE 2019, 14, e0217208. [Google Scholar] [CrossRef]
- Blewett, M.M.; Xie, J.; Zaro, B.W.; Backus, K.M.; Altman, A.; Teijaro, J.R.; Cravatt, B.F. Chemical proteomic map of dimethyl fumarate-sensitive cysteines in primary human T cells. Sci. Signal. 2016, 9, rs10. [Google Scholar] [CrossRef]
- Lozinski, B.M.; de Almeida, L.G.N.; Silva, C.; Dong, Y.; Brown, D.; Chopra, S.; Yong, V.W.; Dufour, A. Exercise rapidly alters proteomes in mice following spinal cord demyelination. Sci. Rep. 2021, 11, 7239. [Google Scholar] [CrossRef]
- Yun, H.M.; Park, K.R.; Kim, E.C.; Hong, J.T. PRDX6 controls multiple sclerosis by suppressing inflammation and blood brain barrier disruption. Oncotarget 2015, 6, 20875–20884. [Google Scholar] [CrossRef]
- Bernardo-Faura, M.; Rinas, M.; Wirbel, J.; Pertsovskaya, I.; Pliaka, V.; Messinis, D.E.; Vila, G.; Sakellaropoulos, T.; Faigle, W.; Stridh, P.; et al. Prediction of combination therapies based on topological modeling of the immune signaling network in multiple sclerosis. Genome Med. 2021, 13, 117. [Google Scholar] [CrossRef]
- Sorensen, P.S.; Giovannoni, G.; Montalban, X.; Thalheim, C.; Zaratin, P.; Comi, G. The Multiple Sclerosis Care Unit. Mult. Scler. 2019, 25, 627–636. [Google Scholar] [CrossRef] [PubMed]
- Kokas, Z.; Sandi, D.; Fricska-Nagy, Z.; Füvesi, J.; Biernacki, T.; Köves, Á.; Fazekas, F.; Birkás, A.J.; Katona, G.; Kovács, K.; et al. Do Hungarian multiple sclerosis care units fulfil international criteria? PLoS ONE 2022, 17, e0264328. [Google Scholar] [CrossRef] [PubMed]
- Ziemssen, T.; Derfuss, T.; de Stefano, N.; Giovannoni, G.; Palavra, F.; Tomic, D.; Vollmer, T.; Schippling, S. Optimizing treatment success in multiple sclerosis. J. Neurol. 2016, 263, 1053–1065. [Google Scholar] [CrossRef] [PubMed]
- Giovannoni, G.; Turner, B.; Gnanapavan, S.; Offiah, C.; Schmierer, K.; Marta, M. Is it time to target no evident disease activity (NEDA) in multiple sclerosis? Mult. Scler. Relat. Disord. 2015, 4, 329–333. [Google Scholar] [CrossRef]
- Monschein, T.; Salhofer-Polanyi, S.; Altmann, P.; Zrzavy, T.; Dal-Bianco, A.; Bsteh, G.; Rommer, P.; Berger, T.; Leutmezer, F. Should I stop or should I go on? Disease modifying therapy after the first clinical episode of multiple sclerosis. J. Neurol. 2021, 268, 1247–1253. [Google Scholar] [CrossRef]
- Pandit, L. No Evidence of Disease Activity (NEDA) in Multiple Sclerosis—Shifting the Goal Posts. Ann. Indian Acad. Neurol. 2019, 22, 261–263. [Google Scholar] [CrossRef]
- Paz-Zulueta, M.; Paras-Bravo, P.; Cantarero-Prieto, D.; Blazquez-Fernandez, C.; Oterino-Duran, A. A literature review of cost-of-illness studies on the economic burden of multiple sclerosis. Mult. Scler. Relat. Disord. 2020, 43, 102162. [Google Scholar] [CrossRef]
- Pentek, M.; Kobelt, G.; Berg, J.; Capsa, D.; Dalén, J.; Bíró, Z.; Mátyás, K.; Komoly, S.; European Multiple Sclerosis Platform. New insights into the burden and costs of multiple sclerosis in Europe: Results for Hungary. Mult. Scler. 2017, 23 (Suppl. S2), 91–103. [Google Scholar] [CrossRef]
- Lad, S.P.; Chapman, C.H.; Vaninetti, M.; Steinman, L.; Green, A.; Boakye, M. Socioeconomic trends in hospitalization for multiple sclerosis. Neuroepidemiology 2010, 35, 93–99. [Google Scholar] [CrossRef]


| Candidate Protein | Pathogenesis—Animal Model | Pathogenesis—Human Tissue | Diagnosis | Differentiating between Clinical Courses | Differential Diagnosis | Conversion from CIS to RRMS | Disease Activity | Progression | Monitoring Therapy | Sample Type(s) |
|---|---|---|---|---|---|---|---|---|---|---|
| ala-β-his-dipeptidase [170,172] | - | - | - | - | - | 2 | - | - | - | CSF |
| Apo-A [149,166,167] | - | - | 1 | - | 1 | 1 | - | - | - | CSF |
| Apo-C [149,159] | - | - | 1 | 1 | - | - | - | - | - | CSF |
| Biotinidase [134,135] | - | 1 | - | - | - | 1 | - | - | - | CSF, serum |
| Ceruloplasmin [108,136,152,169] | 1 | 1 | 1 | - | - | 1 | - | - | - | EAE CSF, CSF, serum |
| CHI3L1 [131,160,169,170,196] | - | 1 | - | 1 | - | 2 | - | - | 1 | CSF |
| CHI3L2 [131,160,182] | - | 1 | - | 1 | - | - | - | 1 | - | CSF |
| Complement C3 [107,108,134,136,183] | 2 | 2 | - | - | - | - | - | 1 | - | EAE brain tissue, EAE CSF, CSF, serum |
| Complement C4 [107,108,134,176,177,178] | 2 | 1 | - | - | - | - | 3 | - | - | EAE brain tissue, EAE CSF, CSF, serum |
| Fibrinogen [108,115,161,178,185,193] | 2 | - | - | 1 | - | - | 1 | 2 | - | EAE immune cells, EAE CSF, CSF, human platelets |
| GFAP [154,155,164] | - | - | 1 | 1 | 2 | - | - | - | - | EAE spinal cord tissue, CSF |
| Haptoglobin [103,108,163,167,185,196] | 2 | - | - | - | 1 | 1 | - | 1 | 1 | EAE brain tissue, EAE CSF, CSF, serum |
| Plasminogen [108,145,195] | 1 | - | 1 | - | - | - | - | - | 1 | EAE CSF, serum, human endothelial cells |
| SAP [104,142,143,144] | 1 | - | 3 | - | - | - | - | - | - | EAE brain tissue, plasma |
| Secretogranin-I and II [129,161,179] | - | 1 | - | 1 | - | - | - | 1 | - | CSF |
| SERPINA3 [146,150] | - | - | 2 | 1 | - | - | - | - | - | CSF |
| Stathmin-1 [103,104] | 2 | - | - | - | - | - | - | - | - | EAE brain and spinal cord |
| Thymosin-β4 [121,122,161] | - | 2 | - | 1 | - | - | - | - | - | Human brain tissue, CSF |
| Transferrin [134,167] | - | - | 1 | - | - | 1 | - | - | - | CSF |
| VILIP-1 [102,110] | 2 | - | - | - | - | - | - | - | - | EAE and cuprizone brain tissue |
| Vitamin D-binding protein [142,147,156] | - | - | 1 | 1 | - | 1 | - | - | - | CSF, serum |
| α-2-macroglobulin [101,193] | 1 | - | - | - | - | - | - | 1 | - | EAE CSF, human platelets |
| α-glycoproteins [105,108,142,143,144,145,167] | 1 | - | 4 | - | - | 1 | - | - | - | EAE brain tissue, EAE CSF, CSF, serum |
Publisher’s Note: MDPI stays neutral with regard to jurisdictional claims in published maps and institutional affiliations. |
© 2022 by the authors. Licensee MDPI, Basel, Switzerland. This article is an open access article distributed under the terms and conditions of the Creative Commons Attribution (CC BY) license (https://creativecommons.org/licenses/by/4.0/).
Share and Cite
Sandi, D.; Kokas, Z.; Biernacki, T.; Bencsik, K.; Klivényi, P.; Vécsei, L. Proteomics in Multiple Sclerosis: The Perspective of the Clinician. Int. J. Mol. Sci. 2022, 23, 5162. https://doi.org/10.3390/ijms23095162
Sandi D, Kokas Z, Biernacki T, Bencsik K, Klivényi P, Vécsei L. Proteomics in Multiple Sclerosis: The Perspective of the Clinician. International Journal of Molecular Sciences. 2022; 23(9):5162. https://doi.org/10.3390/ijms23095162
Chicago/Turabian StyleSandi, Dániel, Zsófia Kokas, Tamás Biernacki, Krisztina Bencsik, Péter Klivényi, and László Vécsei. 2022. "Proteomics in Multiple Sclerosis: The Perspective of the Clinician" International Journal of Molecular Sciences 23, no. 9: 5162. https://doi.org/10.3390/ijms23095162
APA StyleSandi, D., Kokas, Z., Biernacki, T., Bencsik, K., Klivényi, P., & Vécsei, L. (2022). Proteomics in Multiple Sclerosis: The Perspective of the Clinician. International Journal of Molecular Sciences, 23(9), 5162. https://doi.org/10.3390/ijms23095162