Article

Tracking Changes in the Spring Barley Gene Pool in Poland during 120 Years of Breeding

1
Plant Breeding and Acclimatization Institute-National Research Institute, Radzików, 05-870 Błonie, Poland
2
Department of Genetics, Plant Breeding and Seed Production, Wrocław University of Environmental and Life Sciences, Grunwaldzki 24A, 53-363 Wrocław, Poland
3
Research Center for Cultivar Testing (COBORU), 63-022 Słupia Wielka, Poland
*
Author to whom correspondence should be addressed.
Int. J. Mol. Sci. 2022, 23(9), 4553; https://doi.org/10.3390/ijms23094553
Submission received: 19 March 2022 / Revised: 15 April 2022 / Accepted: 18 April 2022 / Published: 20 April 2022
(This article belongs to the Special Issue Genetics and Genomics-Based Crop Improvement and Breeding)

Abstract

:
This study was undertaken to investigate the diversity and population structure of 83 spring barley (Hordeum vulgare L.) cultivars, which corresponded to 120 years of this crop’s breeding in Poland. The analysis was based on 11,655 DArTseq-derived SNPs evenly distributed across seven barley chromosomes. Five groups were assigned in the studied cultivars according to the period of their breeding. A decrease in observed heterozygosity within the groups was noted along with the progress in breeding, with a simultaneous increase in the inbreeding coefficient value. As a result of breeding, some of the unique allelic variation present in old cultivars was lost, but crosses with foreign materials also provided new alleles to the barley gene pool. It is important to mention that the above changes affected different chromosomes to varying degrees. The internal variability of the cultivars ranged from 0.011 to 0.236. Internal uniformity was lowest among the oldest cultivars, although some highly homogeneous ones were found among them. This is probably an effect of genetic drift or selection during their multiplications and regenerations in the period from breeding to the time of analysis. The population genetic structure of the studied group of cultivars appears to be quite complex. It was shown that their genetic makeup consists of as many as eleven distinct gene pools. The analysis also showed traces of directed selection on chromosomes 3H and 5H. Detailed data analysis confirmed the presence of duplicates for 11 cultivars. The performed research will allow both improvement of the management of barley genetic resources in the gene bank and the reuse of this rich and forgotten variability in breeding programs and research.

1. Introduction

The International Treaty on Plant Genetic Resources for Food and Agriculture (ITPGRFA) in 2001 defined cultivar as “a plant grouping, within a single botanical taxon of the lowest known rank, defined by the reproducible expression of its distinguishing and other genetic characteristics” [1].
The advances in plant breeding achieved in the 20th century have had a tremendous impact on the agricultural landscape and have contributed to improving global food security through significant increases in crop productivity [2,3]. A milestone was the Green Revolution of the 1960s and 1970s [4]. However, it is believed that this was a major trigger for the genetic erosion of crop species, and constant selection based on crosses between genetically closely related cultivars has significantly narrowed the crops’ gene pools [5,6].
Barley breeding has focused on improving yield and biotic and abiotic stress tolerance. Malting quality is also important due to barley’s use in the brewing industry. Various traditional breeding methods have been employed, i.e., selection (mass, pure line, pedigree or bulk), haploid and doubled haploid production, mutation, single-seed descent (SSD), compound crosses, backcrossing, interspecific and intergeneric crosses. Male sterile-facilitated recurrent selection (MSFRS) and diallel selective mating system (DSMS) have also been used, which facilitate breakage of existing linkage blocks and expansion of the gene pool by providing large amounts of genetic diversity into barley cultivars [7]. Due to the increasing dynamics of changes in market demands and needs, due to climate change and the emergence of new pathogen races, the most traditional methods, requiring a long-term breeding program, have needed support. Molecular biology and genetic engineering tools have provided a significant shortening of the breeding process [8,9]. Molecular markers, Quantitative Trait Loci (QTL) mapping and finally whole-genome sequencing, as well as genetic modification and genome editing have facilitated early generation and targeted selection and thus overcome the disadvantages of traditional breeding [8].
Using molecular biology tools in breeding has significantly facilitated and accelerated the identification of genotypes that determine a specific and desired phenotype. The molecular characterization of preserved collections performed in gene banks helps in the preliminary identification of germplasm potentially applicable to current breeding programs. This is crucial, especially where there is a fragmented structure of the breeding companies producing cultivars for the local market, which usually do not have the financial resources and laboratory infrastructure to perform their own rapid screening of gene bank collections to identify components for crossbreeding. However, it is essential to provide open access to genetic data.
The beginning of spring barley breeding on Polish territory dates back to the end of the 19th century. Beginning in 1870, breeding stations and companies were established in the partitioned Polish territory. Initially, breeding was dominated by cultivars selected from elite materials imported from abroad, landraces and ecotypes. Barley breeding in Wielkopolska, which at that time was part of the Prussian partitioning, was carried out by Hildebrand, Kirhoff and Stiegler. Their cultivars were widely grown on Polish lands and used in further breeding work. At the beginning of the 20th century, Polish breeders started to work on components and cultivars from Moravia (now the Czech Republic) [10]. As early as in 1902, Antoni Sempołowski, who is considered the pioneer of Polish breeding, distinguished four ways of cereal improvement, i.e., improvement by selection, breeding of new cultivars by searching and consolidation of new types, breeding of new cultivars by crossing, and acclimatization [11]. In the interwar period, barley breeders began crossing indigenous landraces with German cultivars, including the most valued cultivar, ‘Isaria’ [12]. In later periods well yielding, popular in the cultivation of foreign cultivars and Polish parental components, was used for further crossbreeding [10]. Old cultivars can be a valuable source of variability that has been lost due to the focus on high yield [13]. They may contain genes determining resistance to biotic and abiotic stresses, as well as parameters determining, quality oriented towards health-promoting properties [14,15,16]. Therefore, old cultivars and landraces are a source of genetic information for direct use or as parental lines in breeding programs for better adaptation of new cultivars [17,18,19]. However, it should also be considered that the general profile of agrotechnical traits will be significantly worse in the case of old cultivars compared to modern ones [20].
Here, emphasis was placed on investigating changes in the gene pool of the Polish spring barley cultivars collection during 120 years of breeding based on the analysis of DArTseq-derived SNPs. For five breeding periods, both the size of gene pools, their structure and internal level of diversity were assessed. Traces of targeted breeding were examined along the chromosomes. The level of heterogeneity within the studied cultivars was also estimated. The analysis presented here also provided an opportunity to verify and identify duplicates in the germplasm collection. The DArTseq results also enabled the core collection to be selected. Therefore, the results will improve the efficiency of collection management and its use in research and breeding.

2. Results

2.1. Data Quality Analysis

Sequencing yielded over 75,000 SNP loci, from which loci with low reproducibility (RepAvg ≤ 0.95), low call rate (CallRate ≤ 0.95), and low minor allele frequency (MAF < 0.01) were removed. As a result, approximately 85% of the loci obtained were removed, and loci, 11,655 in number, that met all quality parameters were used for analysis. The distribution of loci on chromosomes before and after filtering was also checked. Filtering did not affect the uniform distribution on chromosomes, which ranged from 10 to 15%. However, the proportion of loci with unknown chromosomal location decreased by 2% compared to the raw data. The highest number of loci analyzed was located on chromosome 2H (1695) and the lowest on 1H (1150). On average, 1 bp per 470 Kbp in the genome was analyzed. Loci distribution along each chromosome showed a similar pattern, i.e., the number of studied loci was higher at the ends of chromosomes and decreased towards centromere (Table 1, Figure 1).
The frequencies of transitions (A > G, G > A, C > T, and T > C) and transversions (other variants) among SNPs were 60.2% and 39.8%, respectively. On chromosome 3H there were significantly less purine transitions and significantly more pyrimidine transitions compared to the other chromosomes. Among the transversions, their significantly decreased frequency was observed on 1H (A > C) and 3H (A < T), and a simultaneously increased frequency on 7H (C > A) (Table 2).
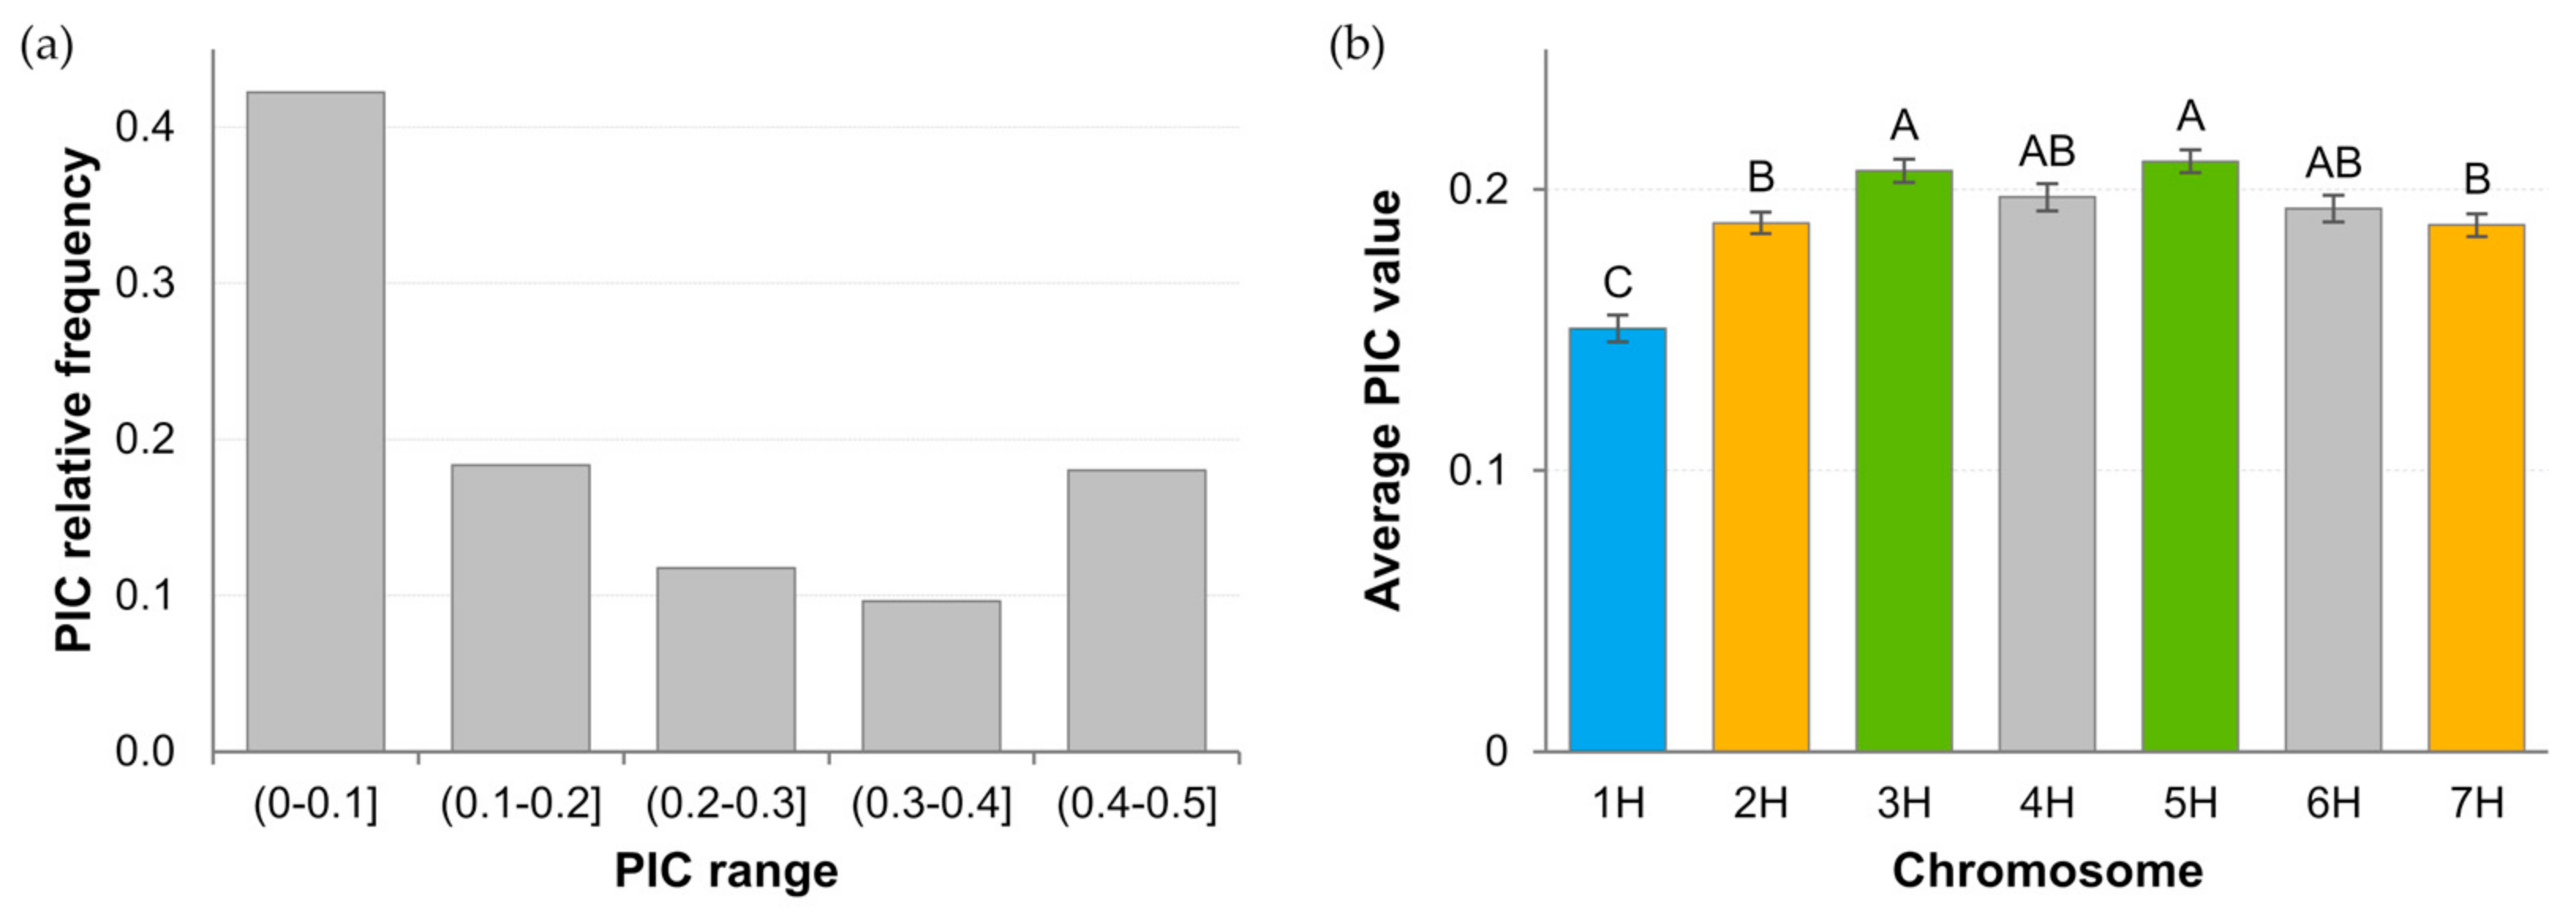
The polymorphism information content (PIC) ranged from 0.02 to 0.49 with mean 0.19 and median 0.13. Over 40% of loci had PIC below 0.1 (Figure 2b). Between 34% (5H) and 52% (1H) of low PIC loci were present on individual chromosomes. In total, about 18% of loci were highly informative, i.e., had a PIC above 0.4. Their proportion on chromosomes ranged from 0.12 (1H) to 0.22 (3H). The mean PIC value for each chromosome showed significant. differences. The lowest value was observed for 1H and the highest values for 3H and 5H (Figure 2b).

2.2. Genetic Diversity

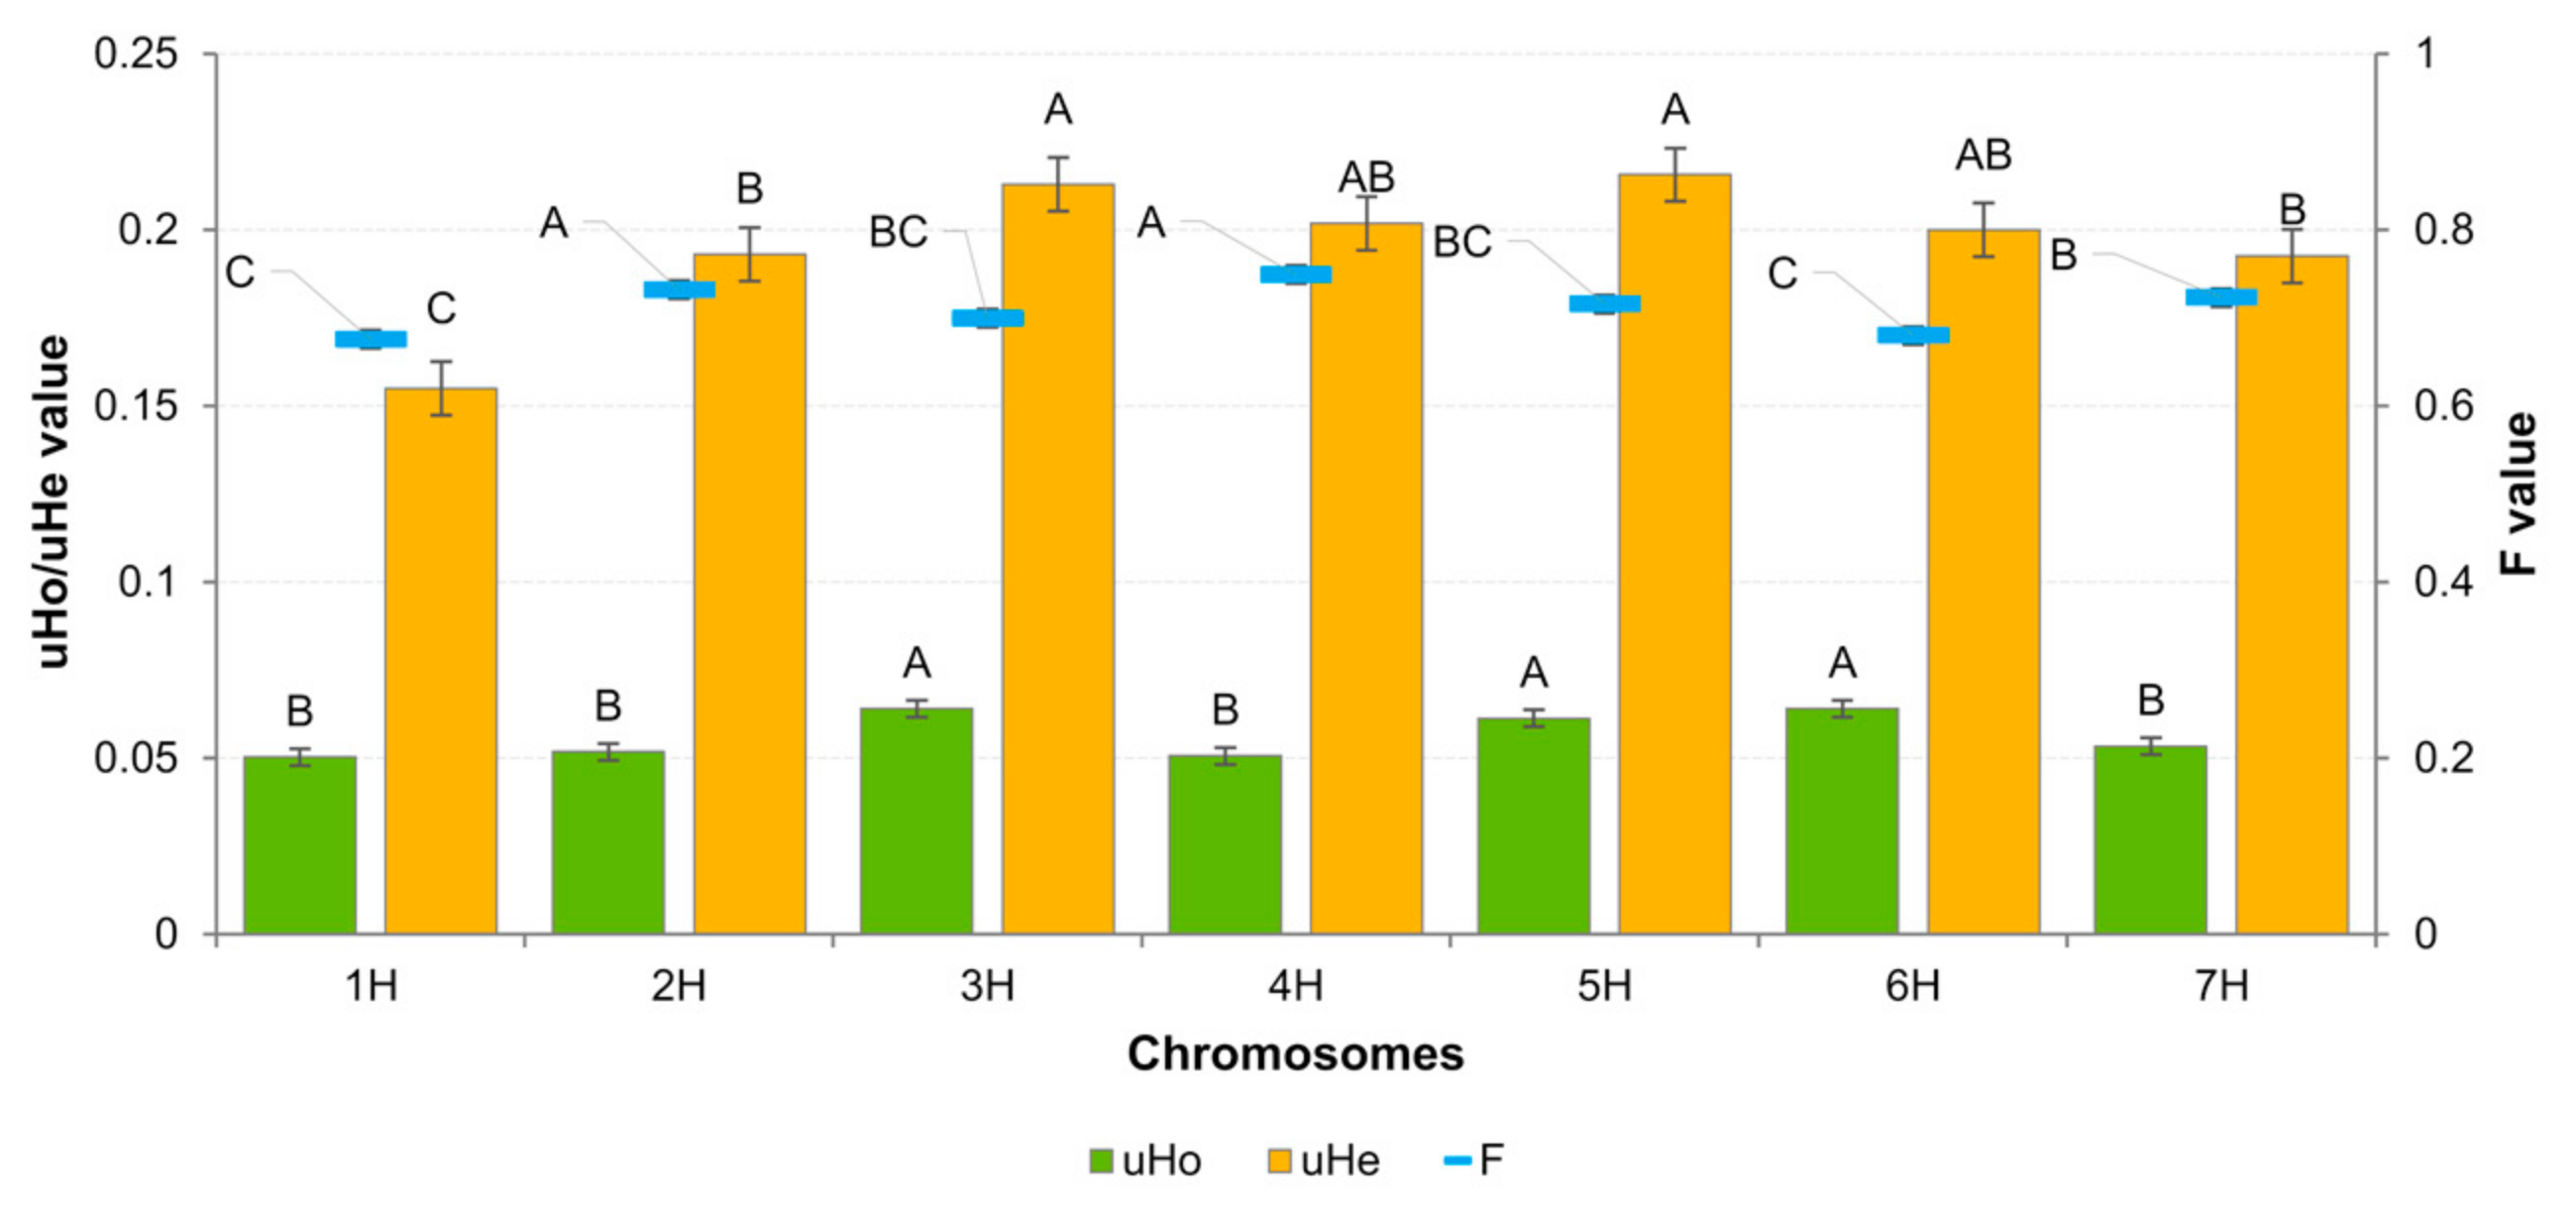
The coefficients of variation such as observed heterozygosity (uHo), expected heterozygosity (uHe) and fixation factor (F) were calculated for the studied material. The mean values of these were 0.058, 0.197 and 0.706, respectively. The mean uHo for 3H, 5H and 6H (~0.06) was significantly higher than for the other chromosomes (~0.05) (Figure 3). The mean uHe was 0.155–0.216 for 1H and 5H, respectively. F-values for individual chromosomes also showed significant differences. The lowest value was observed for 1H (0.671) and the highest for 4H (0.757). Heterozygous state was not observed in approximately 23% of loci. Chromosome 5H had the highest proportion of heterozygous loci, while 2H had the lowest (Table 2).
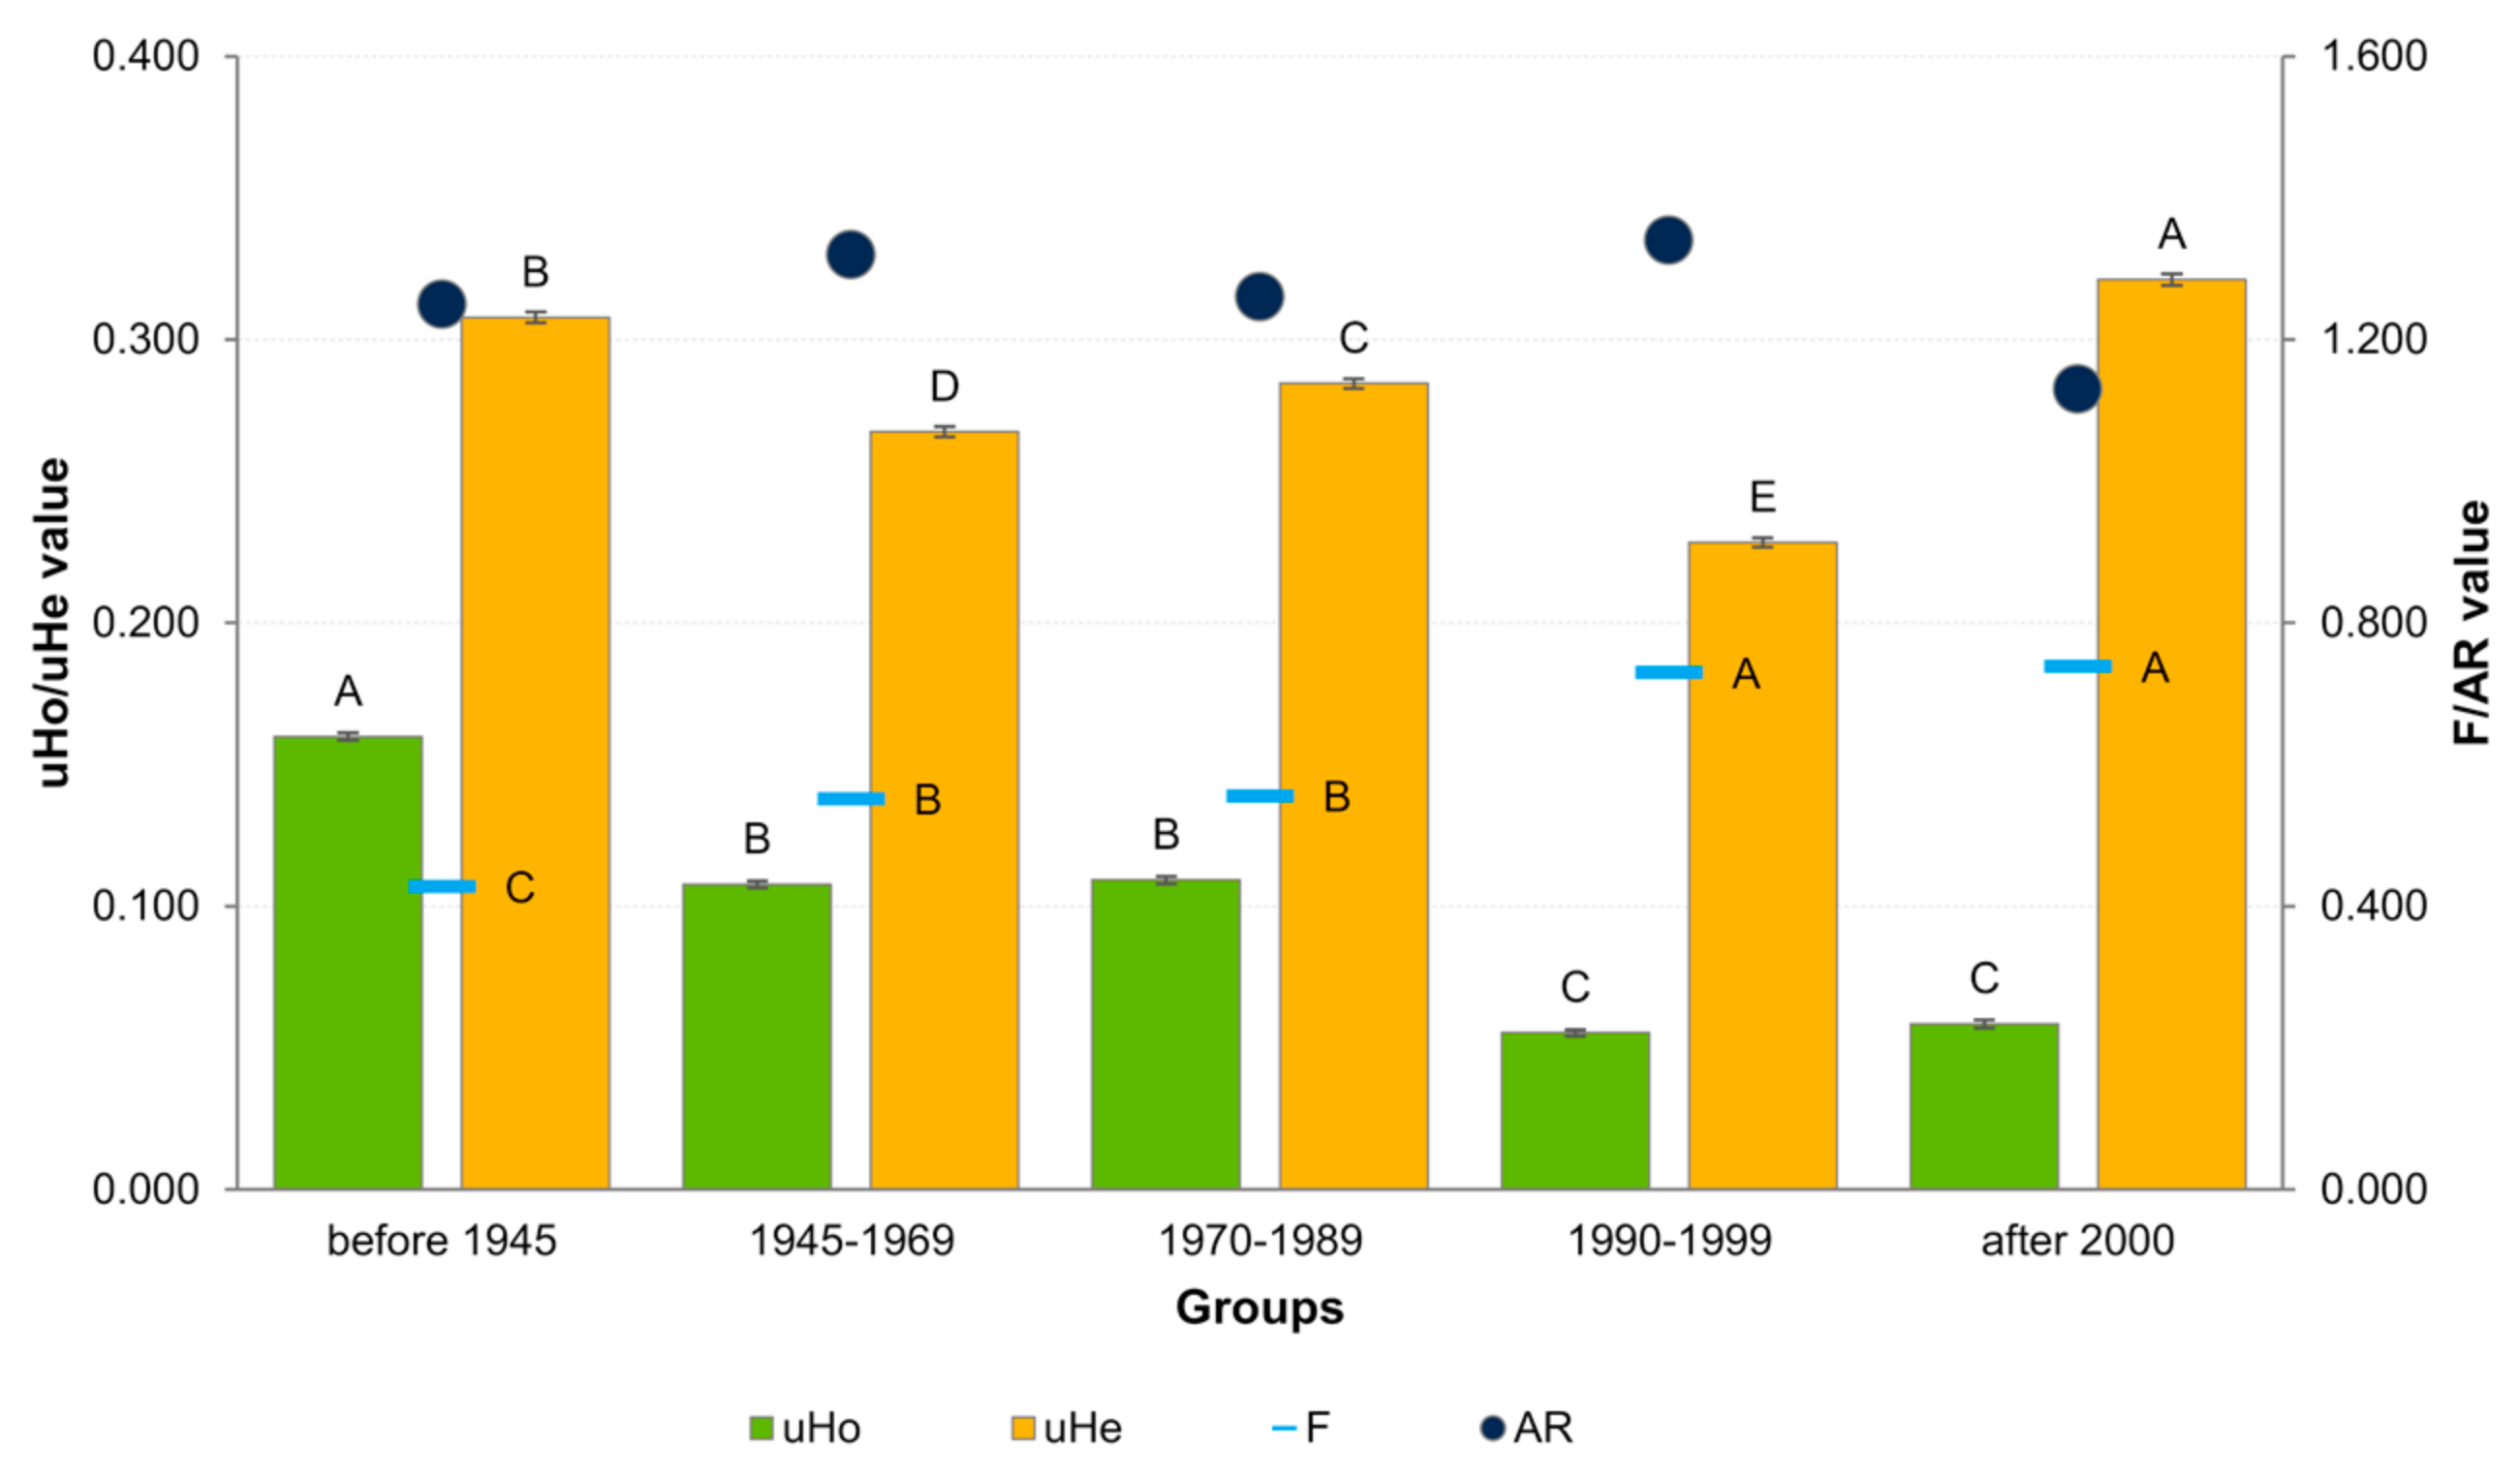
The analysis of diversity coefficients (uHo, uHe and F) in groups of cultivars, assigned based on the period of breeding, showed the presence of significant differences (Figure 4). Heterozygosity observed decreased progressively with time, while the level of inbreeding increased. The pattern of uHe values was a little more complicated, i.e., it tended to alternately decrease and increase in consecutive periods. Its values were highest in the group of the newest and the oldest cultivars and lowest in the group from the period 1990–1999. Allelic richness (AR) also showed fluctuations over time, being highest in the period 1990–1999 and lowest in cultivars bred after 2000.
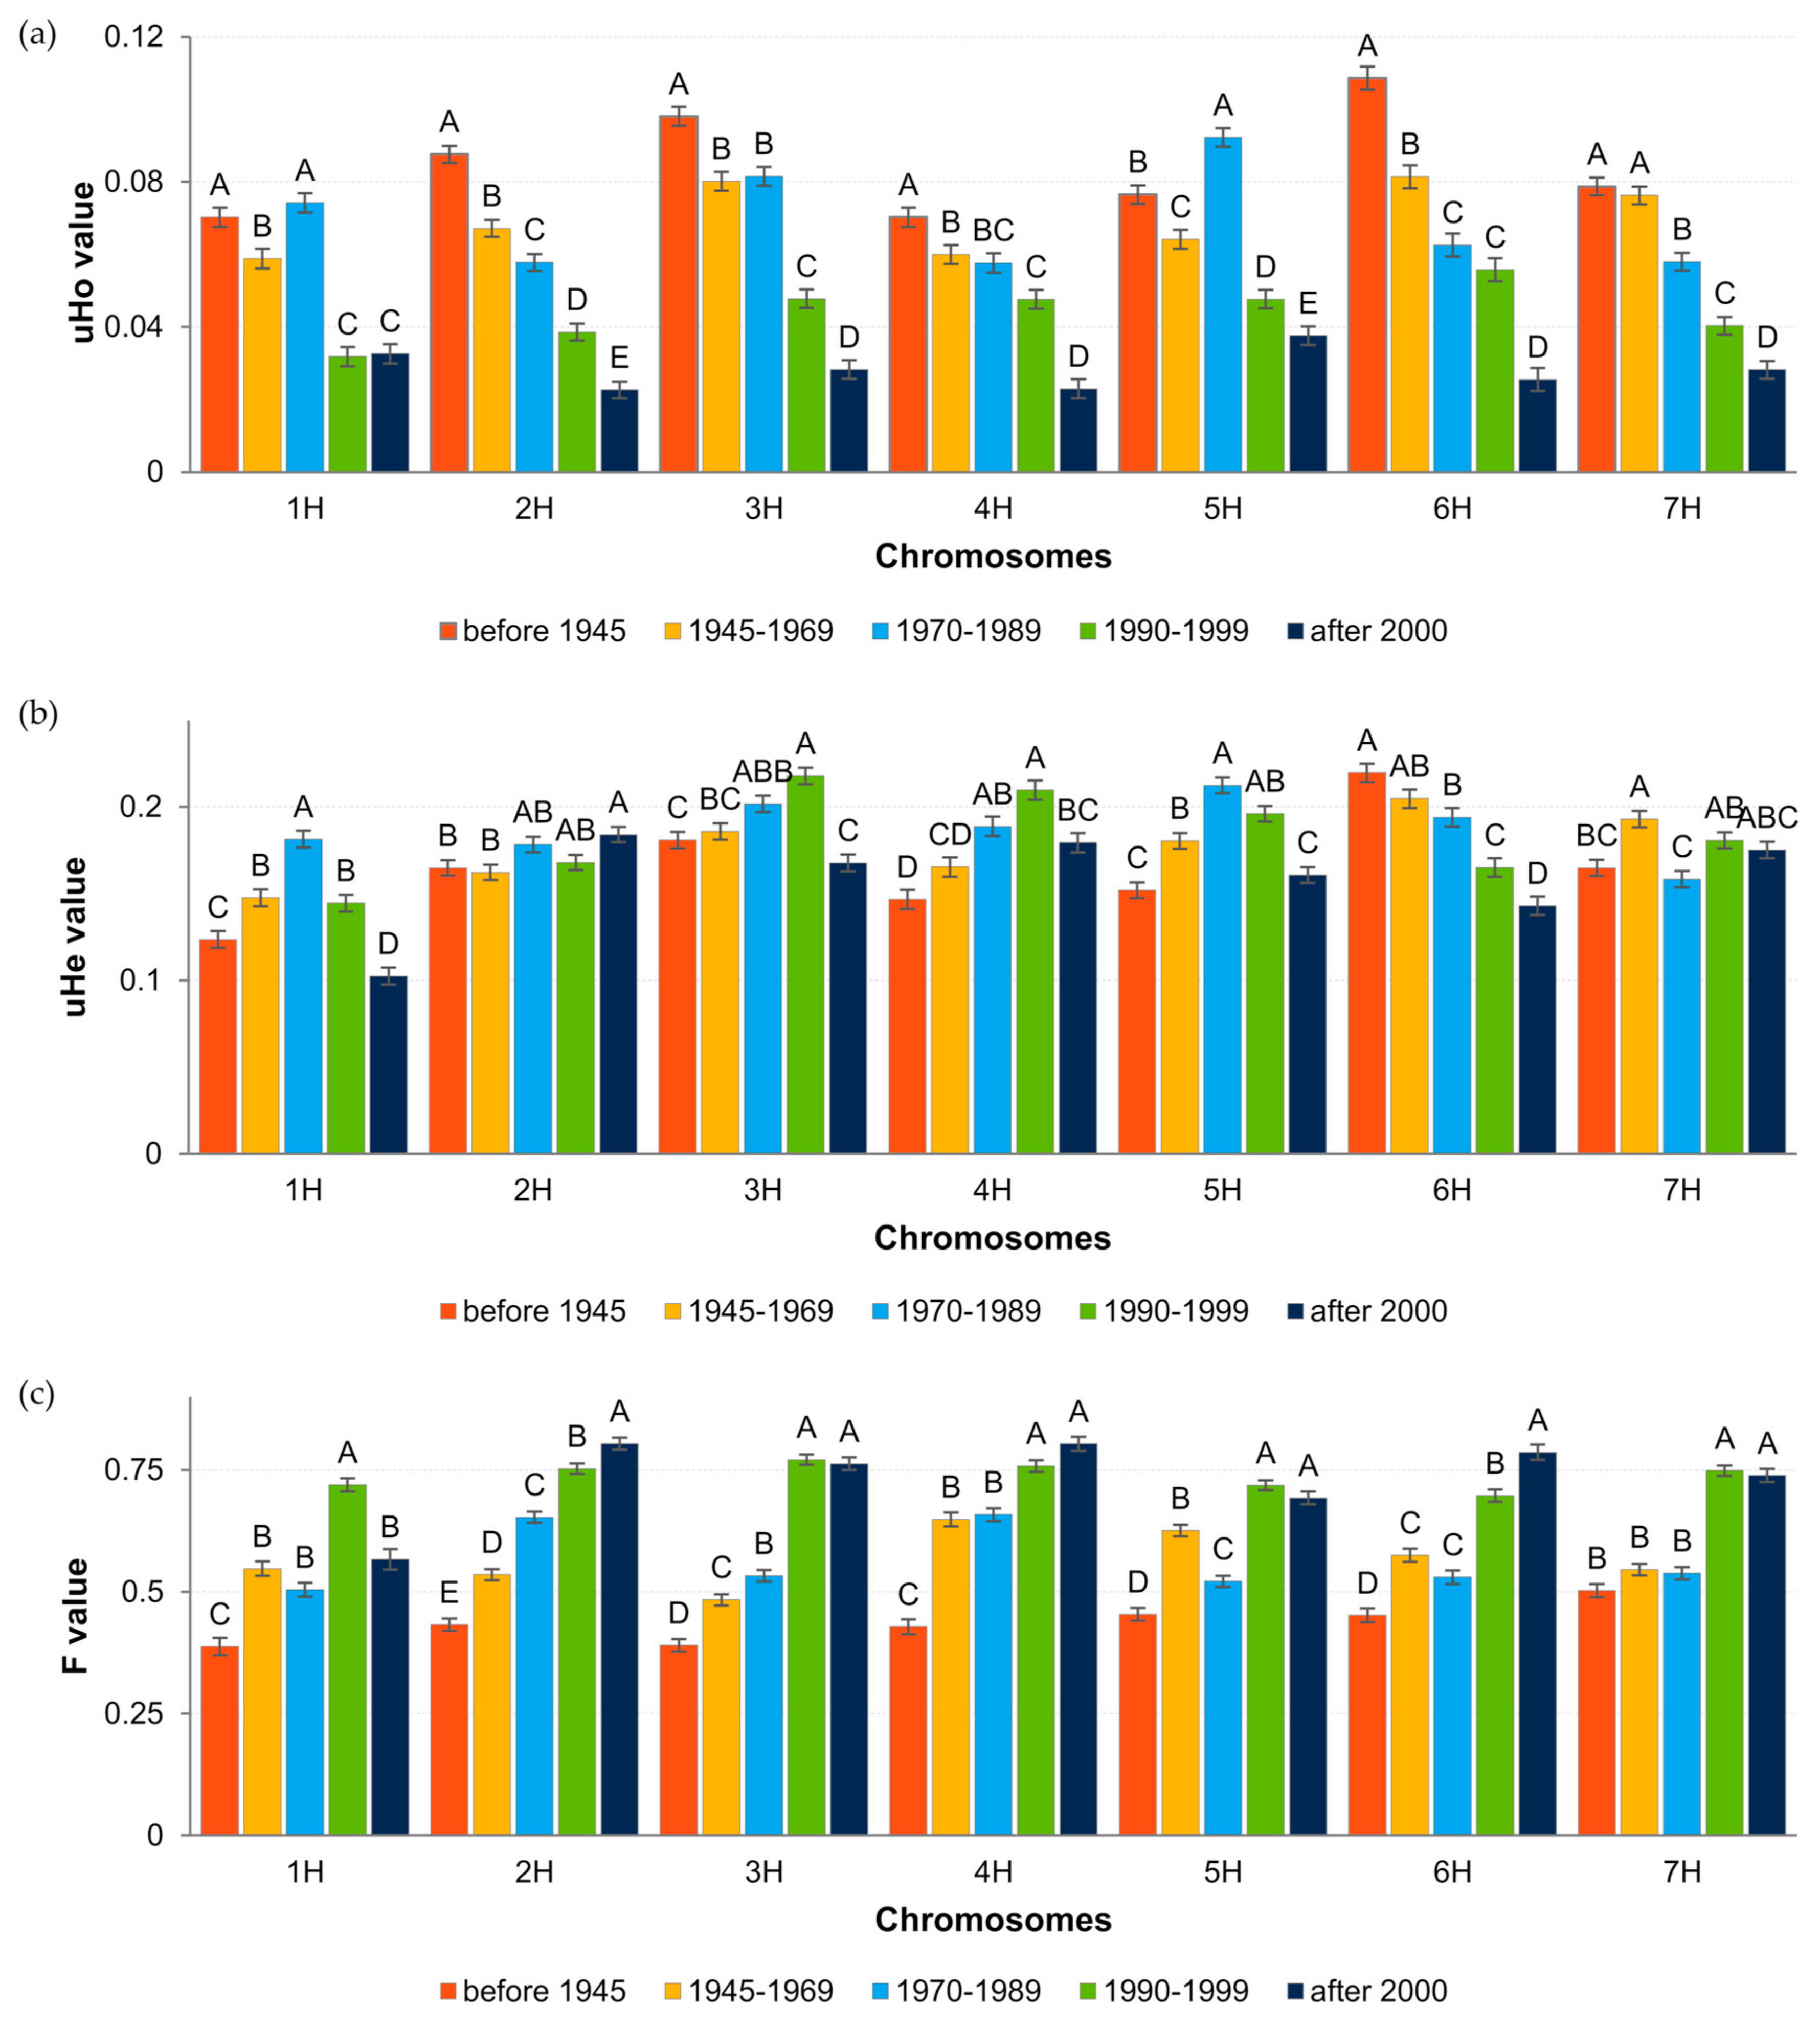
Analysis of the diversity coefficients in relation to the period of breeding and chromosome showed that the pattern of changes in the level of uHo was in most cases consistent with the main pattern (Figure 5). The divergence occurred on chromosomes 1H and 5H, where an increase in heterogeneity of cultivars bred in 1970–1989 was observed. uHo showed a variable behavior over time depending on the chromosome. For 1H, 3H, 4H and 5H uHe initially increased and then decreased, although the increasing trend interruption occurred either in the period 1970–1989 or in 1990–1999. For 6H uHe decreased with time and for 2H and 7H it fluctuated. The inbreeding level showed a similar change pattern as uHo, but in the opposite direction.
Because DArTseq analysis was conducted on pooled samples, where each cultivar was represented by eight seedlings, it was possible to estimate the level of intrinsic heterogeneity of the cultivars studied. Barley is a self-pollinating species; therefore, heterozygous loci are due to the presence of different genotypes in the sample. Thus, it can be assumed that the heterozygosity observed reflects the heterogeneity of the cultivar. Within 83 tested cultivars Ho ranged from 0.011 (‘Kazimierski’) to 0.236 (‘Cesarski Stieglera’) (Figure 6). In the group of the oldest cultivars, i.e., those bred before 1945, which included also cultivars bred at the end of the 19th century, the level of heterogeneity ranged from 0.012 (‘Przeworski’) to 0.236 (‘Cesarski Stieglera’). Eight cultivars showed a relatively high level of homogeneity, while the remaining five were significantly internally differentiated. In cultivars bred between 1945 and 1969, heterogeneity ranged from 0.011 (‘Kazimierski’) to 0.176 (‘Antoniński Browarny’). In cultivars bred between 1945 and 1969, heterogeneity ranged from 0.011 (‘Kazimierski’) to 0.176 (‘Antoniński Browarny’). This group included two pairs of accessions whose passport data indicate that they may be duplicates. According to the EGISET database, accessions numbered PL42124 and PL43614 are duplicates of ‘Damazy’ cultivar and PL40940 and PL42363 of ‘Jarek’ cultivar. These accessions are characterized by a high level of homogeneity, although in the case of ‘Damazy’, there is a difference between the two samples, i.e., 0.013 vs. 0.024. Among 18 accessions representing cultivars bred in the period 1970–1989, only four showed an increased level of heterogeneity (>0.1), i.e., ‘Lot’ (0.205), ‘Polon’ (0.190), ‘Lubuski’ (0.174) and ‘Dema’ (0.127). In this group, there were as many as six pairs of accessions that may represent duplicates (Table 1). For two pairs, i.e., PL43033 and PL43416 (‘Dema’) and PL43032 and PL43421 (‘Lot’), there were significant differences in the level of heterogeneity. In the fourth and most numerous group of cultivars, which were bred in the late 20th century, the level of heterogeneity was quite even and noticeably low (generally below 0.09). Accession number PL43812 is an exception; according to passport data, it is one of three accessions representing the ‘Bryl’ cultivar. However, the level of heterogeneity of this accession (0.189) is considerably higher than that of the other two accessions, for which Ho is about 0.035. A value above 0.1 in this group was also found in the sample representing the ‘Rataj’ cultivar. The fifth group consisted of modern cultivars, among which there were seven of Polish origin and five of foreign origin, i.e., from Germany and France. All cultivars were characterized by a very high level of homogeneity. The highest Ho value was found in the ‘Granal’ cultivar (0.083), the lowest in ‘Runner’ and ‘RGT Planet’ (0.013).

2.3. Unique Alleles

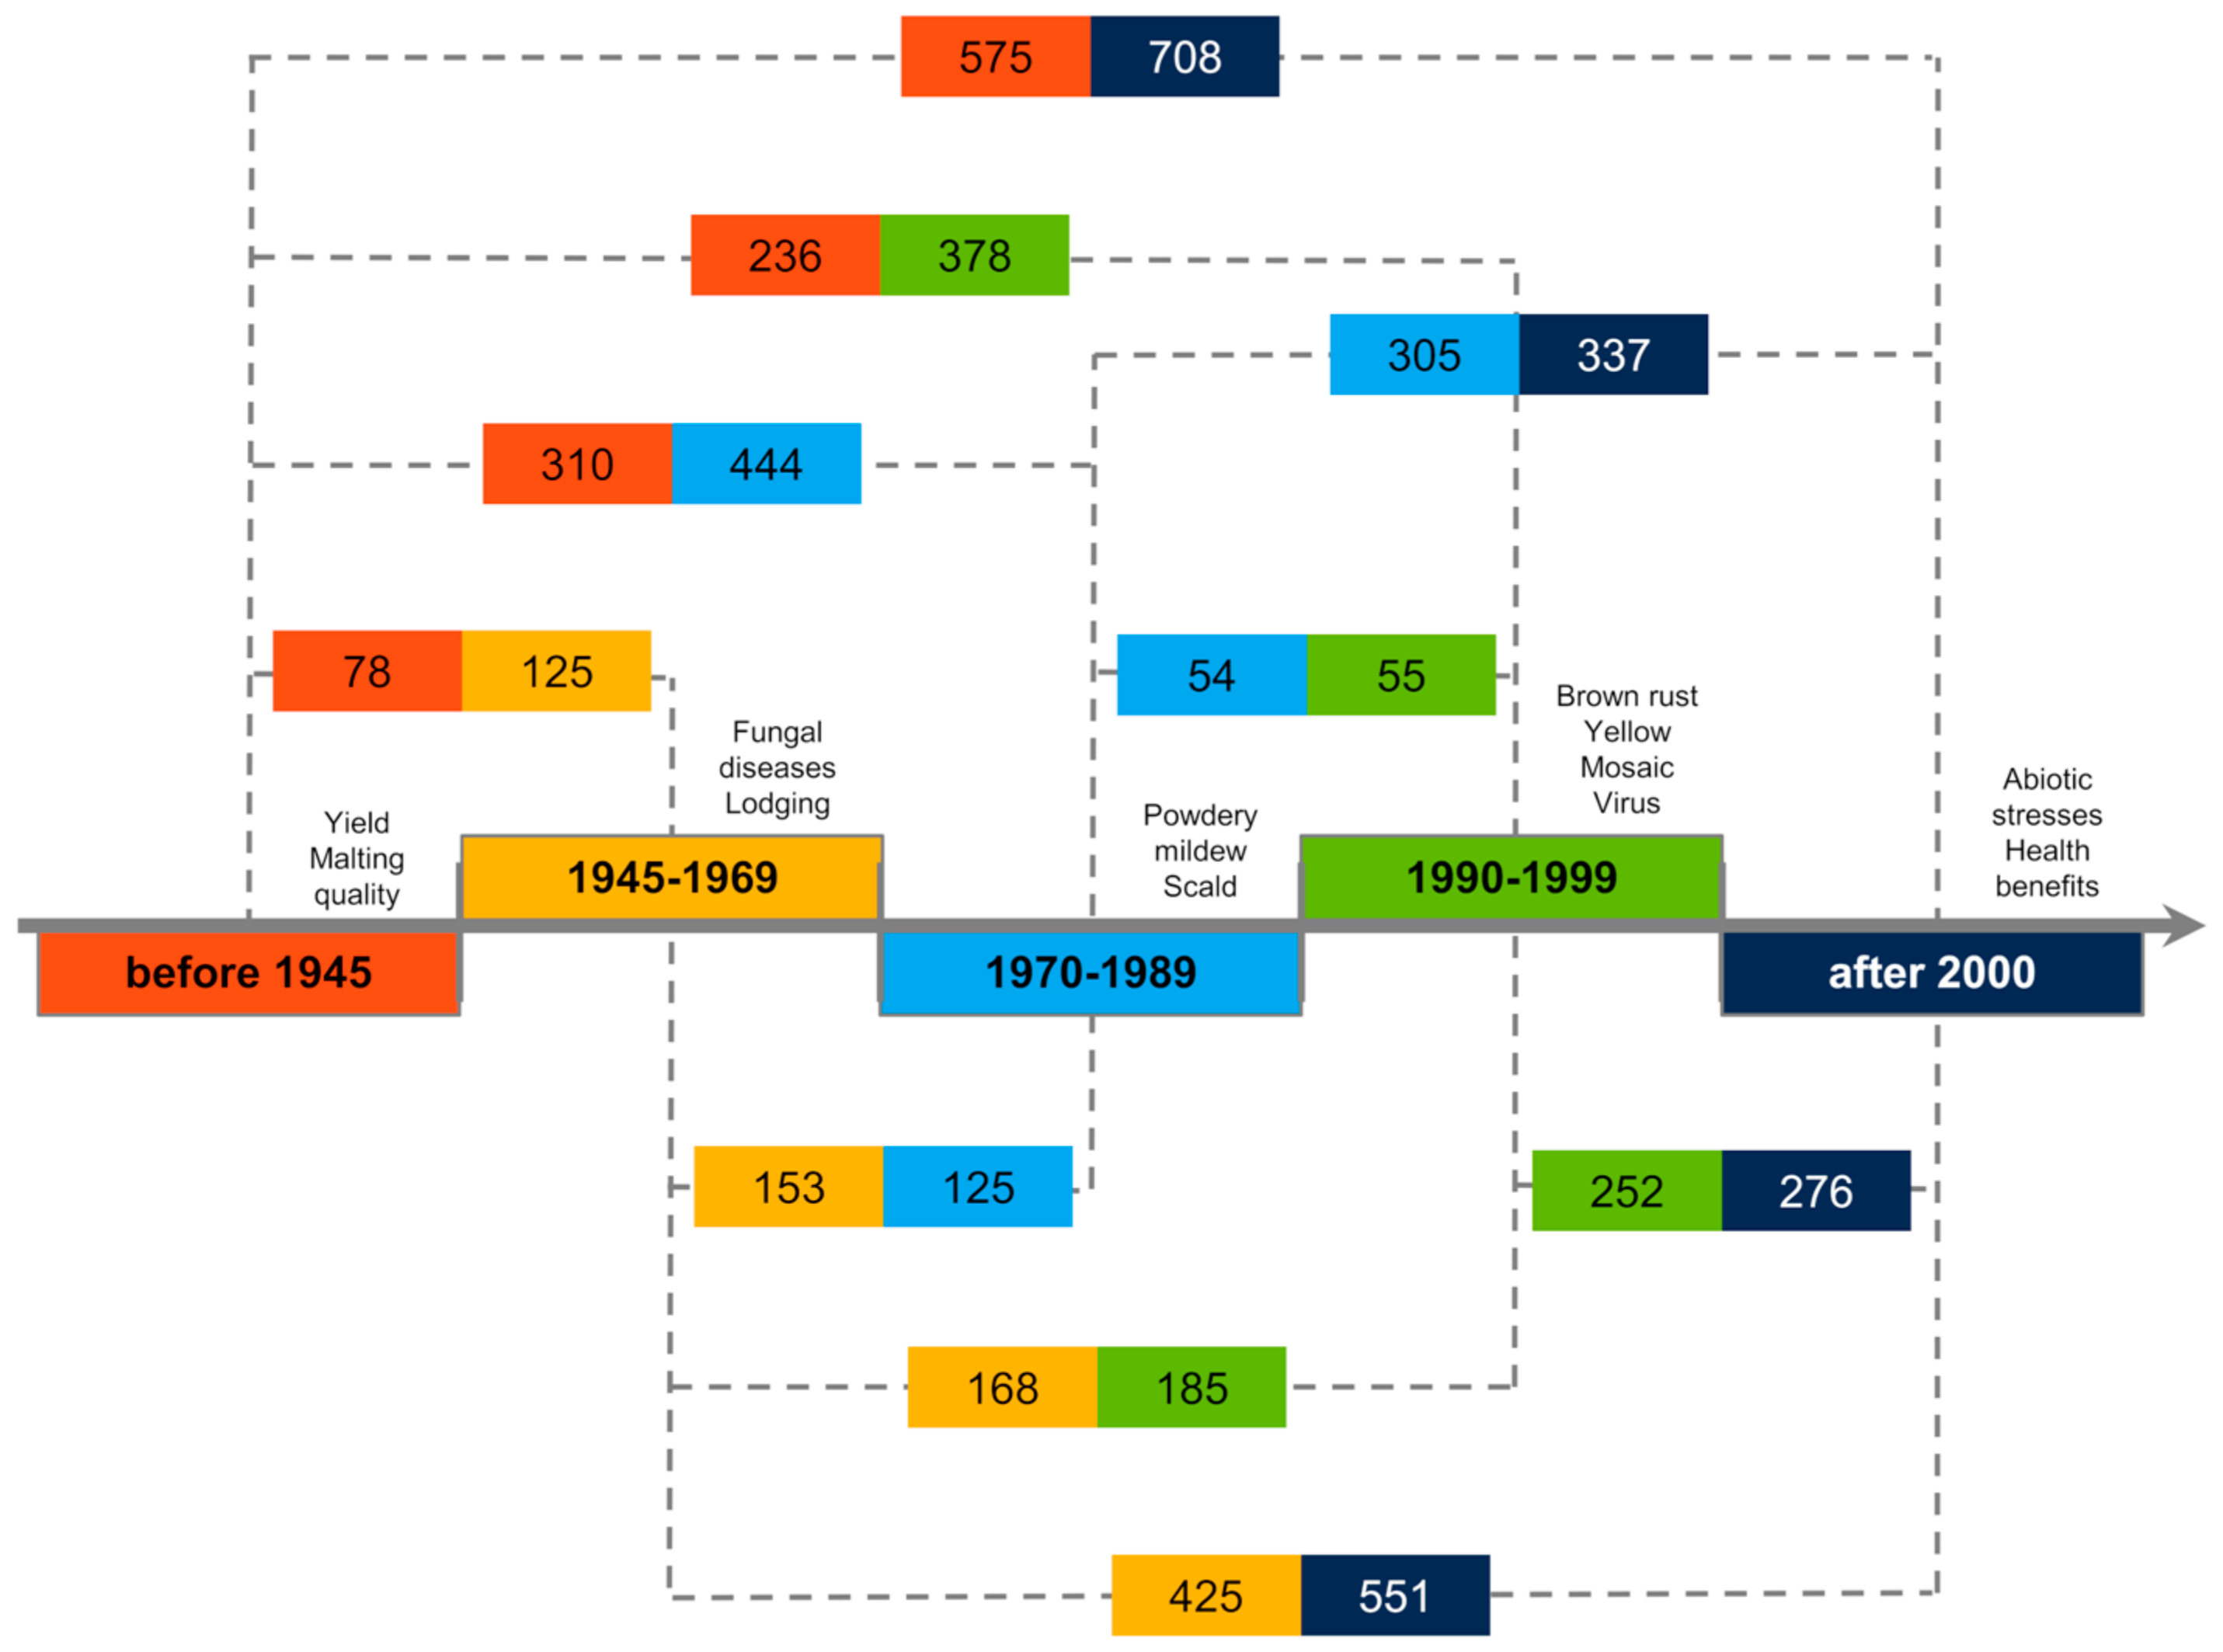
The number of unique alleles was also compared among the groups (Figure 7). As a threshold level, the frequency of a unique variant higher or equal to 0.25 in a given group of cultivars was assumed. In this way, the dynamics of changes in the genome of the presence of unique variants occurring quite commonly in the studied groups was observed. Data considering rare alleles, i.e., >0.05, are presented in Table S1. In the oldest cultivars, 78 loci contained variants that were not transferred to the group of cultivars bred in the subsequent period. However, in the group of cultivars bred between 1945 and 1969, there were 125 loci in which new variants were present. Thus, changes affected about 1.74% of all investigated loci. The highest proportion of changes of unique alleles was observed between the groups of cultivars bred in 1990–1999 and modern ones, and they were related to 4.53% of analyzed loci. On the other hand, the smallest changes were observed between the groups from the middle breeding period, i.e., between 1970–1989 and 1990–1999 (0.94% of loci). Changes in allele frequency, i.e., the disappearance of ‘old’ alleles and appearance of ‘new’ ones, are related to the constant evolution of the breeding direction and to the appearance of new objectives, apart from yield increase.
From the perspective of individual chromosomes, the greatest magnitude of change was in chromosome 5H (Table 3). During the surveyed breeding period, 125 unique allelic variants were lost while 138 new variants were introduced. The smallest changes affected 1H and 6H; however, on 1H almost twice as many new allelic variants appeared as were lost, while on 6H only the removal of variation associated with unique alleles took place. Comparing the different consecutive periods, it is clear that the dynamics of change varied at different times for different chromosomes. However, two points at which “old” variation was replaced by “new” variation can be clearly seen, i.e., 1970–1989 and recently.

2.4. Genetic Distance and Principal Coordinate Analysis

An analysis of genetic distance showed that the lowest distance occurred between the two accessions representing the “Klimek” cultivar, and the highest between ‘Mazowiecki’ and ‘Stratus’ (Table 4). Low distance values, i.e., below 0.05, were also observed for nine successive pairs of accessions. This similarity will be discussed in detail in the following section, dealing with duplicates. Maximal genetic distance between accessions in the five groups had the lowest value for modern cultivars, and the highest for cultivars bred in the period 1945–1969. Thus, it can be concluded that, among the studied groups of cultivars, those bred most recently have the narrowest gene pool, while the widest gene pool was recorded for cultivars bred after World War II.
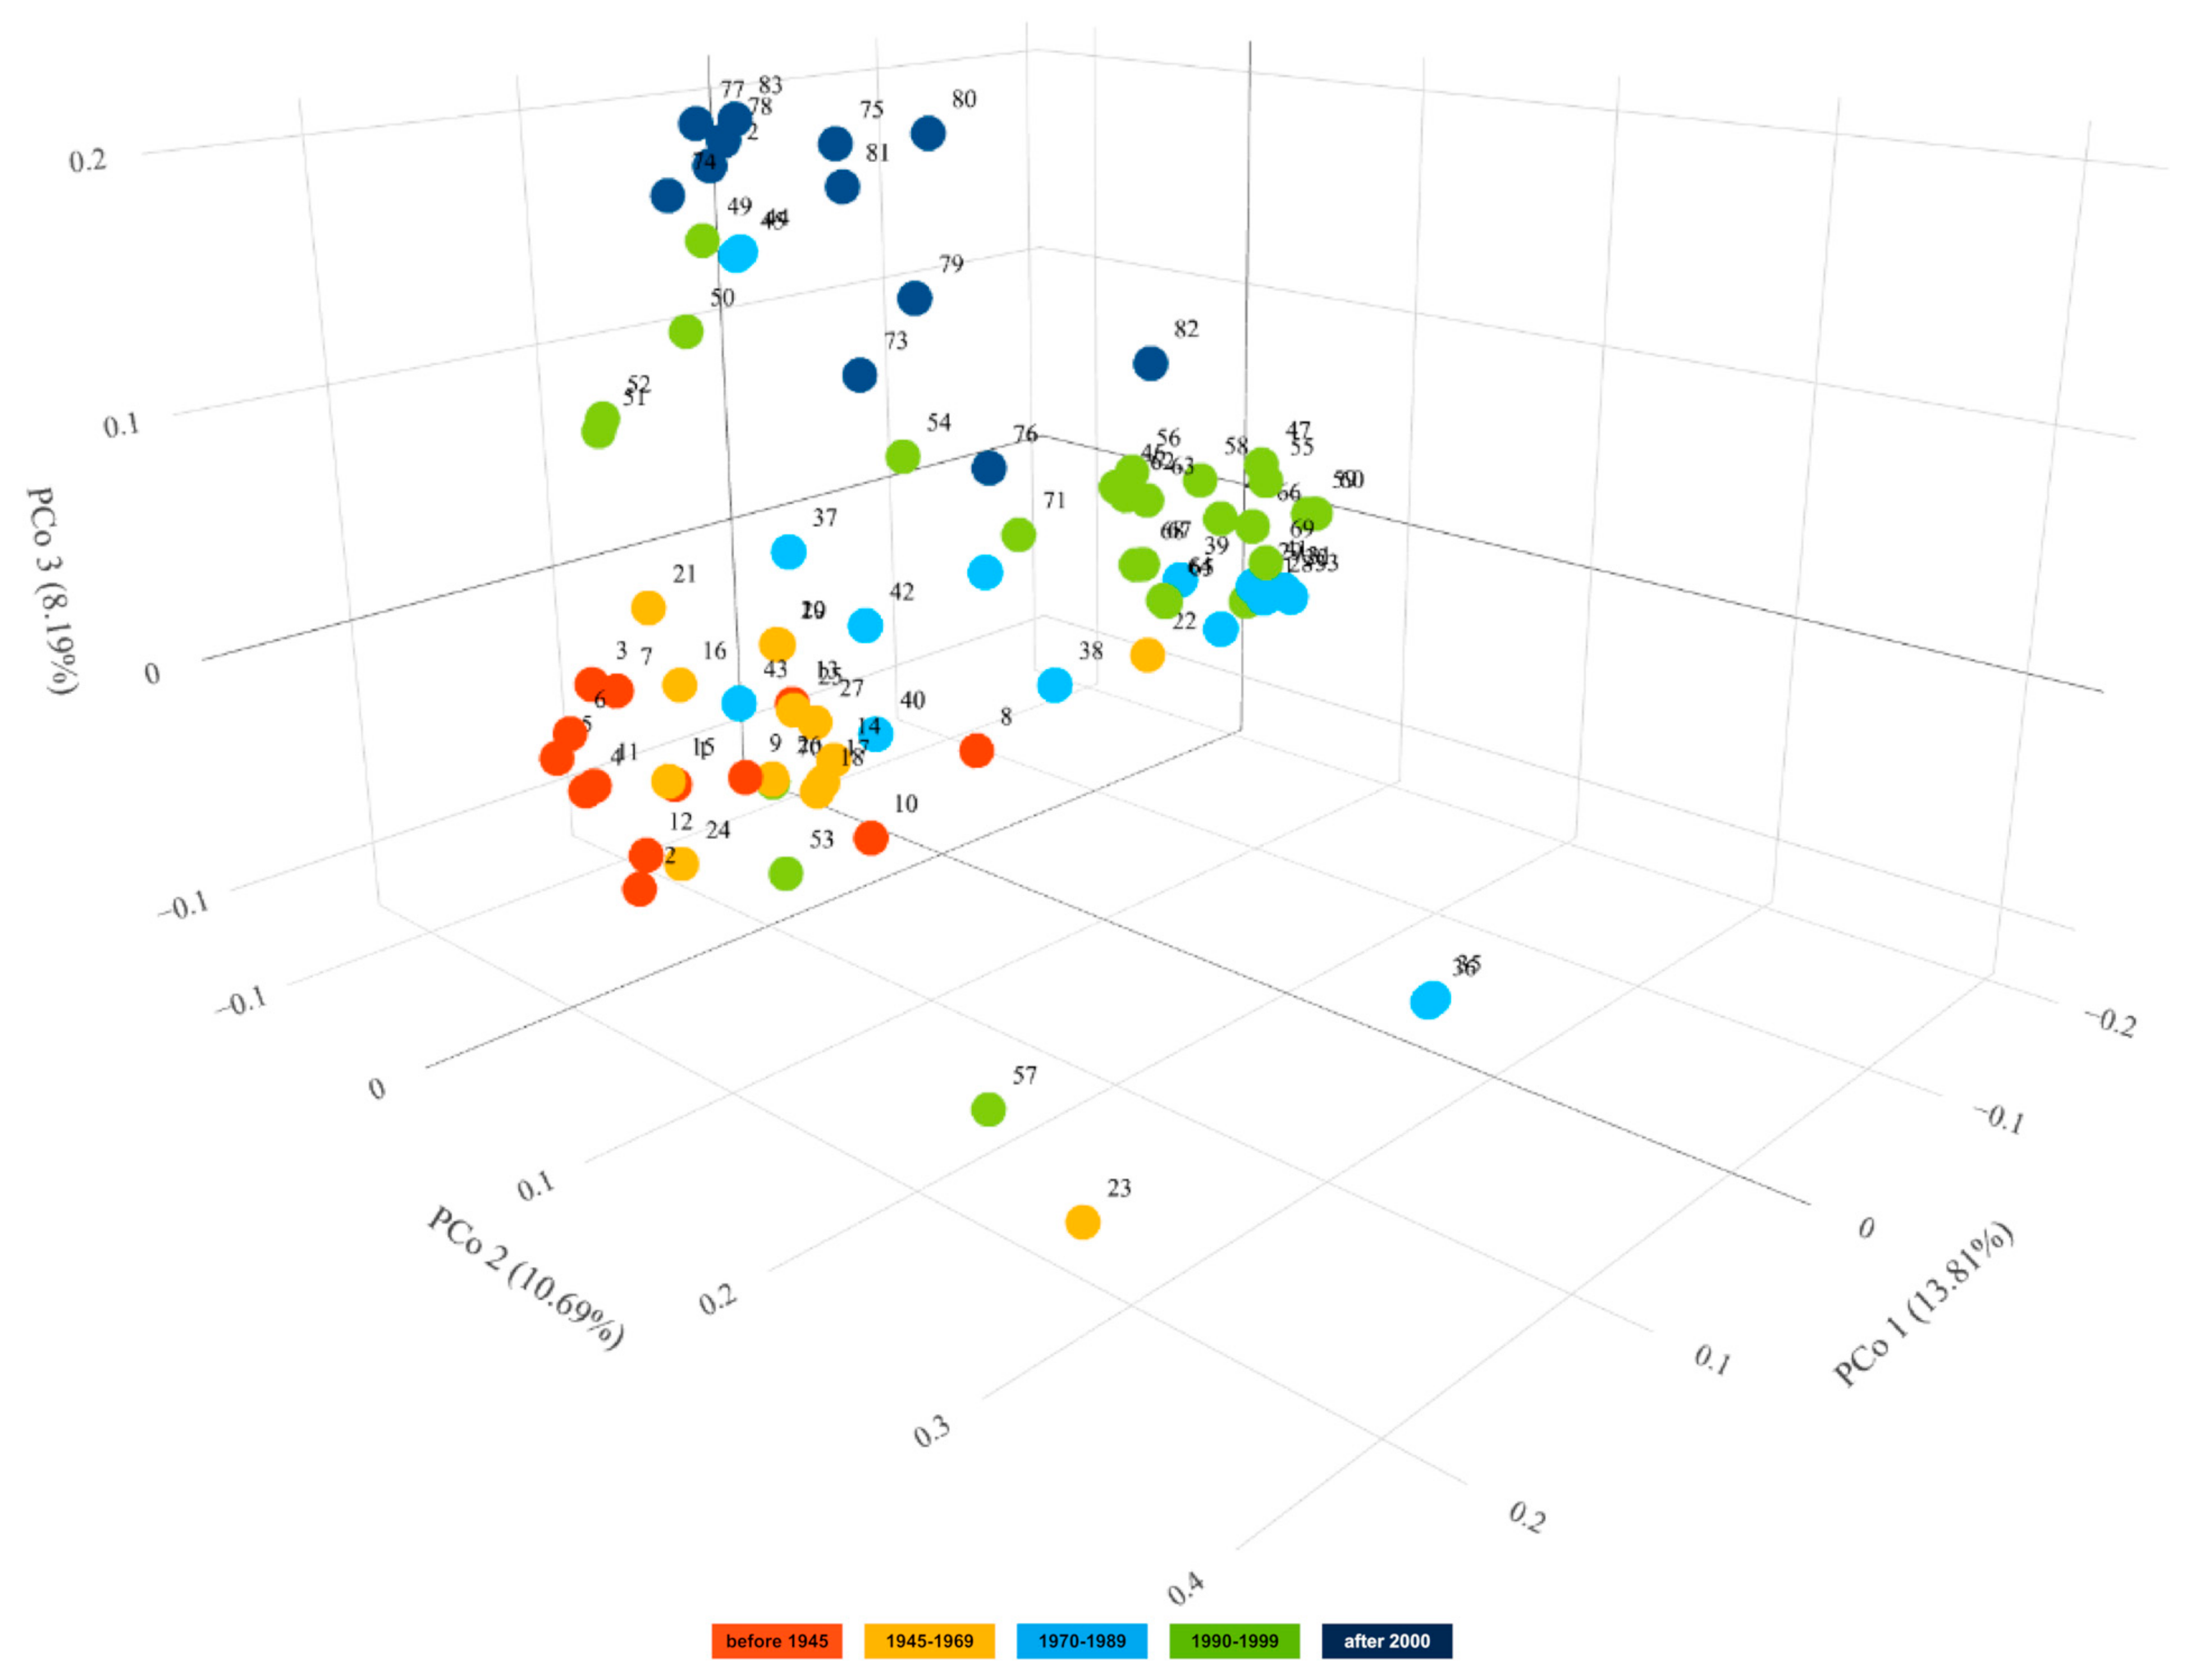
Principal coordinate analysis (PCoA) performed for 83 spring barley cultivars indicated that the first three axes account for 32.69%, i.e., 13.81%, 10.69% and 8.19% of the variation, respectively (Figure 8). Graphical visualization of the results in a 3D plot of the first three coordinates showed that cultivars bred in the first four periods were arranged sequentially along the PCo1 axis. There is no clear demarcation between the groups of cultivars, and the gene pools in the subsequent periods partly overlap and intermingle. The PCo3 axis allowed us to distinguish the group of the newest cultivars. Several cultivars bred in the period 1990–1999 (‘Orlik’(51,52), ‘Mobek’ and ‘Gwarek’) exhibit greater similarity to the group of recent cultivars than to cultivars bred in the same period. Among the most recent cultivars, those bred in Poland display a link to historical domestic materials. Foreign cultivars, on the other hand, show some distinctness. Polish cultivar ‘Podarek’ is the most genetically similar to foreign cultivars, especially to ‘Alianz’ and ‘RGT Planet’. The 3D plot also clearly shows the distinctiveness of the five accessions. Among them, the outermost, i.e., ‘Klimek’(35,36) and ‘Mazowiecki’, are multi-row. The other two are ‘Polo’ and ‘Start’. Both are two-row, like the rest of the tested cultivars, but they originated from crosses of foreign cultivars.

2.5. Population Structure

Analysis of Molecular Variance (AMOVA) performed for 83 spring barley cultivars assigned to five breeding periods showed that most of the variation occurred within the groups (91%), and only 9% was inter-group variation.
The admixture model in the STRUCTURE software [22] was implemented to investigate the population structure in the studied set of cultivars. Based on ad hoc statistic ΔK, the true number of clusters in the current study was identified at the level of 11 (Figure S2). Cultivars were assigned into clusters based on an 80% membership threshold. Only 28 cultivars were classified into nine clusters, i.e., gene pools, and the rest showed varying levels of admixture (Figure 9). Most cultivars were assigned to pools 11 (nine cultivars) and 9 (seven cultivars). None of the studied accessions were assigned to pools 1 and 4 (Figure 10). The group of cultivars bred before 1945 was dominated by pool 7, as in the following period (Figure 10). However, it should be noted that the percentage of this cluster decreased from 60.7% to 37.9% in the following periods. What is more, in the group of the oldest cultivars, five were considered pure, i.e., four were assigned to cluster 7 and one to cluster 8. The share of cluster 8 in the later periods of breeding is negligible and practically does not occur in cultivars bred after 1969. About 20% of this group was also represented by cluster 1. Its highest admixture was observed in the cultivar ‘Kujawski’. The participation of the remaining gene pools did not exceed several percent. In the group of cultivars bred in the period 1945–1969, only two cultivars were recognized as belonging to cluster 2. In both cases, this was ‘Damazy’. It is worth noticing that this cluster appears as an admixture in several more cultivars, but its contribution does not exceed 40%. In this group, the proportion of gene pool 1 increases slightly (21.4%). This pool constitutes about 57% of the genetic makeup in the cultivar ‘Jarek’, represented by two accessions. In the remaining cultivars, its content ranged from 0 to 37%. In the next two periods, in total, from 1970 to 1999, pool 11 was dominant and its participation increased with time from 37.3% to 43.7%. Among the cultivars bred in the initial period (1970–1989), only four were classified as pure. Two accessions representing ‘Klimek’ cultivar were assigned to gene pool 6, and two representing ‘Bielik’ cultivar to pool 11. Interestingly, gene pool 6 was practically absent in the remaining cultivars. In the group of cultivars from a later period (1990–1999), 10 cultivars were considered pure. They represent cluster 11 (6 accessions), 10 (two accessions) and 3 and 5 (one accession each). At the same time, the share of cluster 1 decreased with time in these two groups. The proportion of cluster 10 remained constant at about 15%, while an increase from 8.5% to 13.5% was observed for cluster 9 in these two groups. Whereas for the previous four periods of breeding, continuity of changes in population structure was observed, in the group of contemporary cultivars there was a rapid increase in the contribution of cluster 9, to 69.4%, and marginalization of other clusters. Seven cultivars from this period were assigned as pure to cluster 9, while in the rest its participation ranged from 23.8–69.4%. It should be noted that five cultivars with the highest proportion of cluster 9 were of foreign origin. An additional contribution of clusters 10 and 11 was observed in Polish cultivars. An exception was ‘Podarek’ cultivar, whose genetic makeup does not differ significantly from Western European cultivars.

2.6. Traces of Targeted Selection

Genomic regions involved in differentiation of cultivars bred before 1945 and after 2000 were revealed by plotting FST values for all loci with known locations in the genome (Figure 11). Regions with high FST values that indicate fixation of different alleles in both groups were observed on chromosomes 5H and 3H. The majority of regions with high FST were identified on 5H. It is noteworthy that these regions were found in both distal (especially in the short arm) and pericentromeric parts. On 3H, high FST was observed on the short arm and these loci were located in the middle part of the arm. For comparison, the analysis of PIC distribution in the two groups of cultivars was also performed. It showed that in the majority the PIC profile remained unchanged. Importantly, regions of low polymorphism were found in centromeric and pericentromeric regions in both groups at 1H, 2H, 4H and 7H. A remarkable change in the PIC profile was detected at 5H; in the region with high FST, the average PIC value increased in the group of the most recent cultivars. The alleles not present in the oldest cultivars also appeared there.

2.7. Identification and Verification of Duplicates

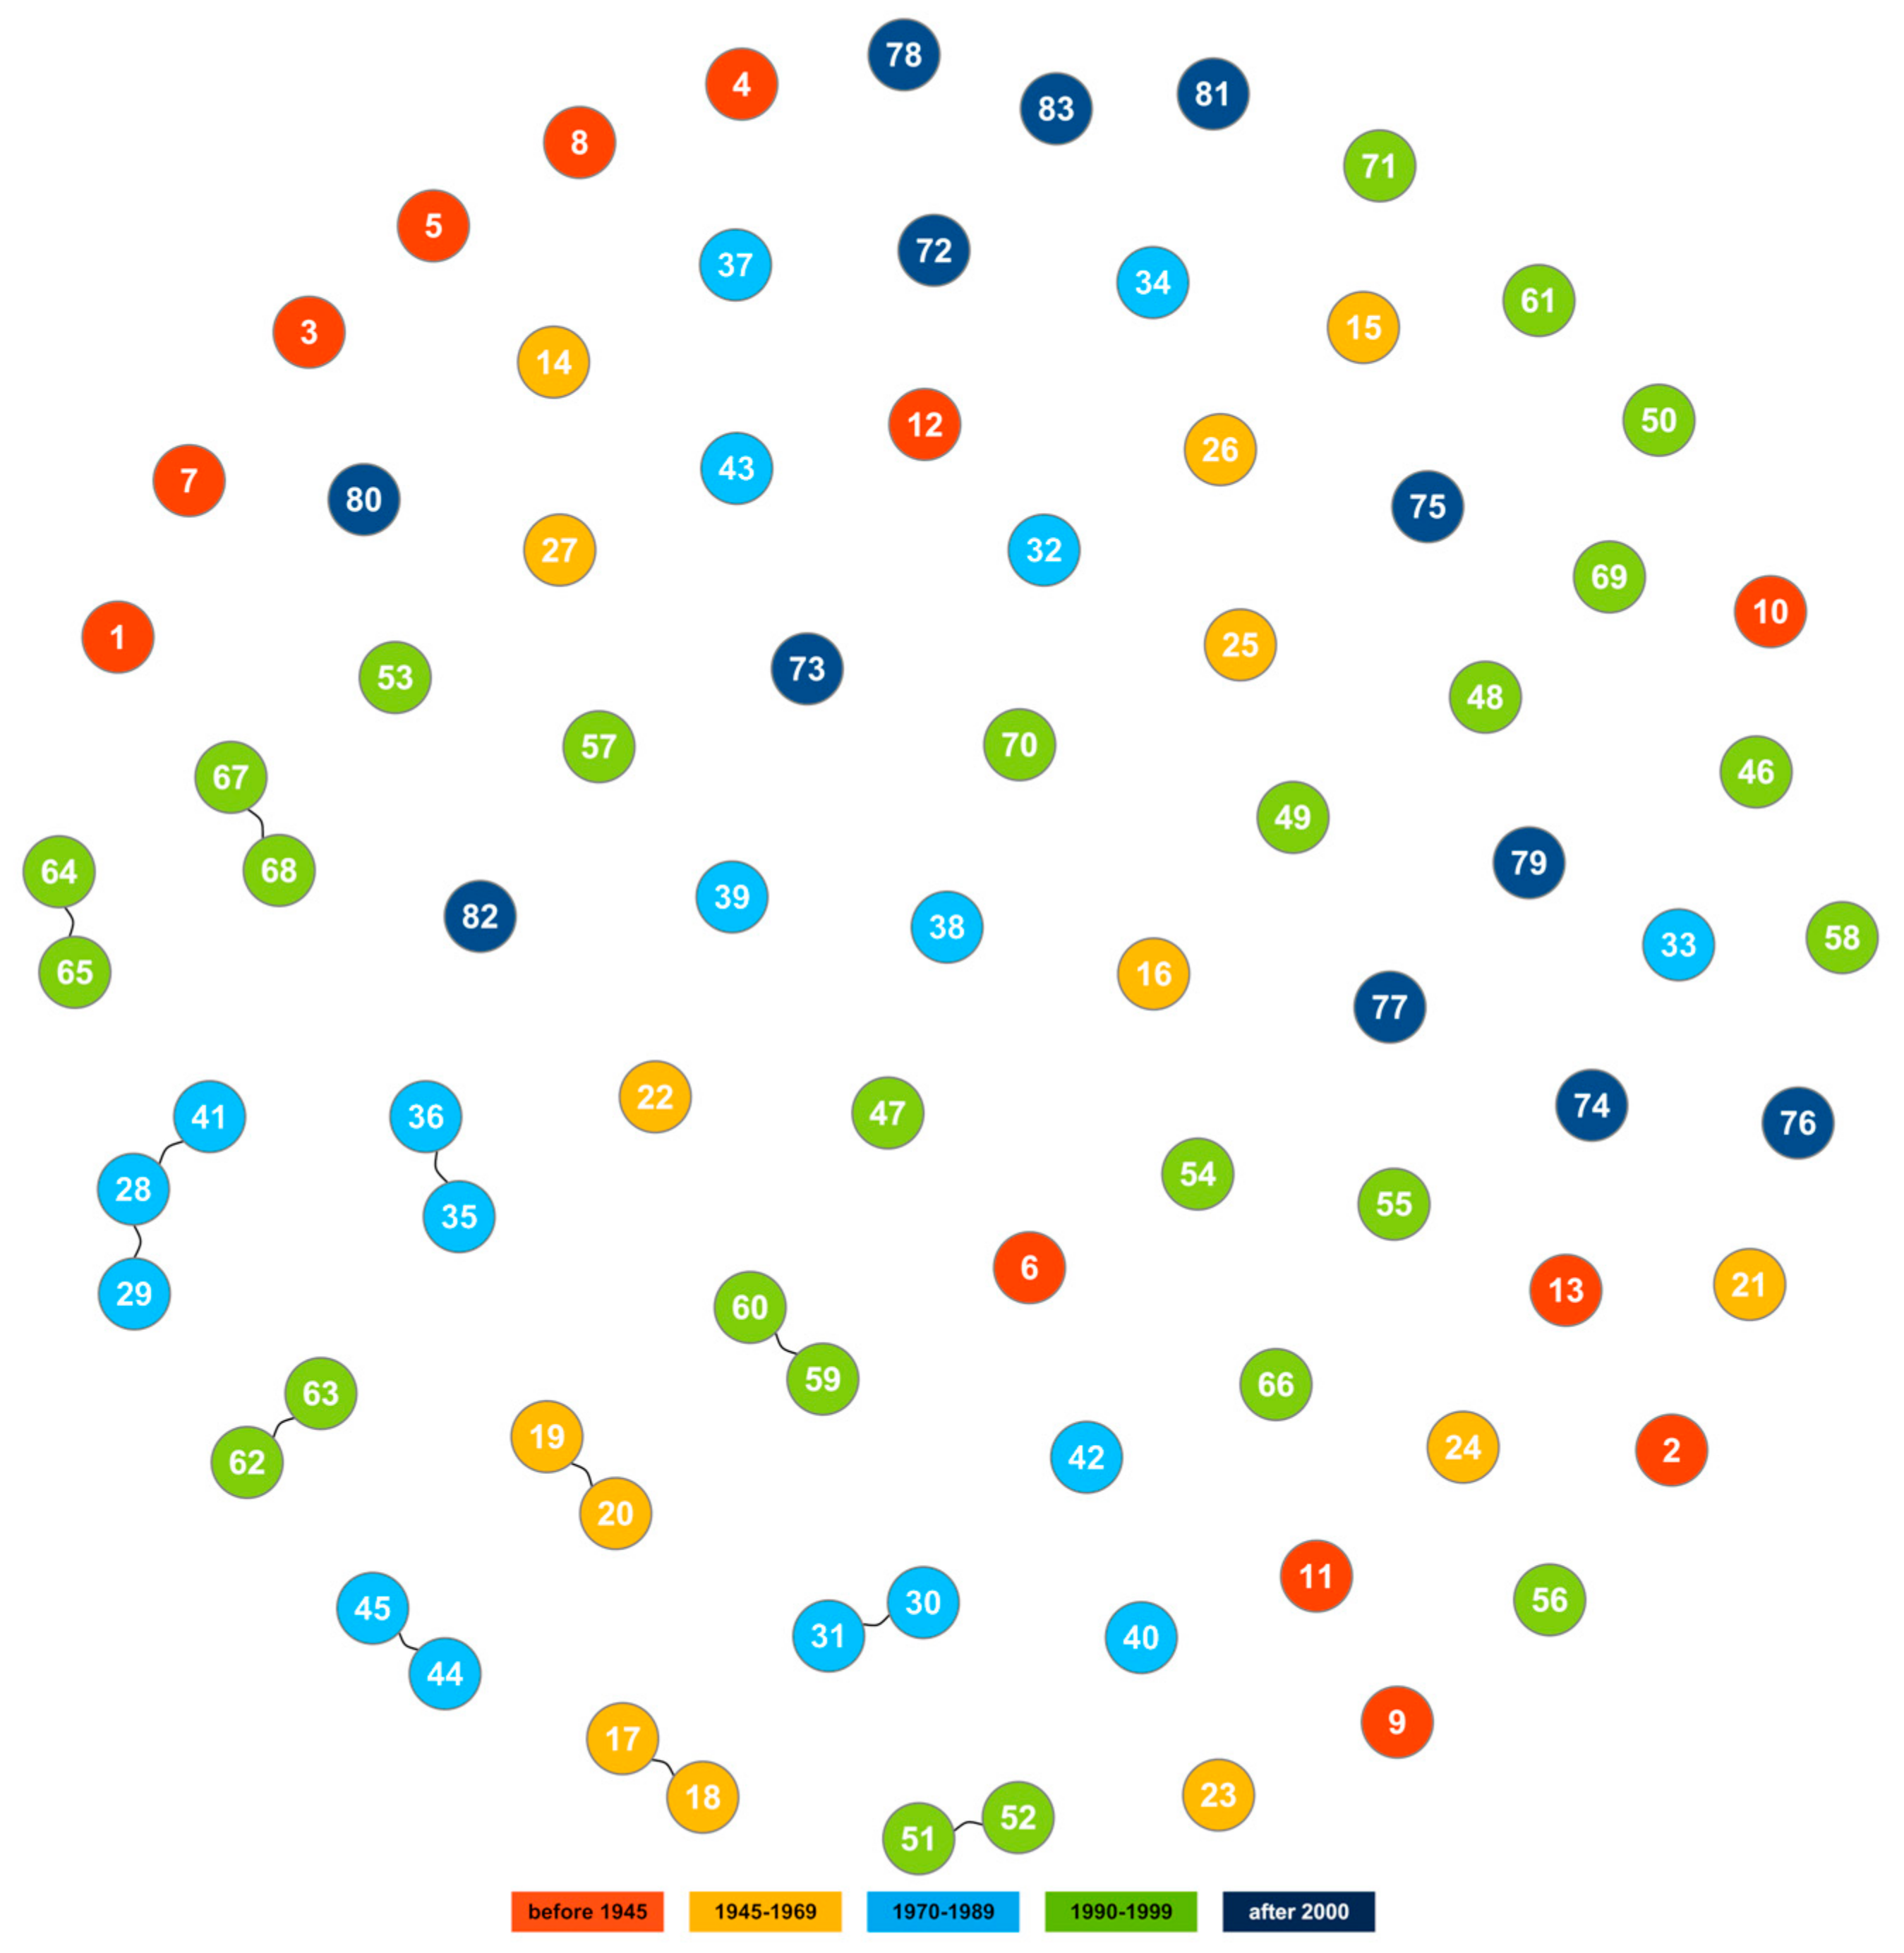
In the studied set of 83 spring barley cultivars, as many as 31 accessions had passport data indicating that they appeared to be duplicates or even triplicates of cultivars. These accessions were submitted to the gene bank in different years. One of the aims of this study was to verify whether these accessions were indeed duplicates. For final verification, an identity by descent (IBD) analysis was performed (Figure 12) and its results were compared with those obtained in previously described analyses (Table 5). In this way, using different analytical approaches, it was possible to determine that duplicates occur for 10 varieties in the gene bank collection. An additional triplicate was identified for the cultivar Ars. The cultivar Mago showed a very high level of genetic similarity to both accessions of ‘Ars’ cultivar. However, in the case of three ‘Bryl ‘accessions, DArTseq analysis revealed genetic distinctness of accession PL 43812. It should therefore be assumed that this accession does not represent the ‘Bryl’ cultivar because the seed sample was contaminated with another cultivar, as indicated by its exceptionally high heterogeneity. Accessions representing cultivars such as ‘Dema’, ‘Lot’, ’Polo’ and ‘Rhodes’ according to passport data cannot be considered duplicates. Especially in the case of ‘Polo’, we are dealing with completely different genetic makeup. According to the population structure analysis, accession PL 43368 is the only one in the studied set of cultivars that represents the third gene pool and is therefore a valuable source of the collection diversity.

2.8. Core Collection

An advanced maximization strategy through a modified heuristic algorithm (A*), which is complete and optimal, i.e., it finds a path if only one exists, and the shortest path, was used to identify the minimum group of cultivars representing the full diversity. Out of the studied 83 cultivars, a set of 50 that should form the core collection was extracted. The cultivars are marked in Table 6.

3. Discussion

Described in this paper, the analysis of 83 spring barley cultivars representing 120 years of Polish breeding is the next step towards a molecular characterization of the collection conserved at NCPGR using high-resolution and genome-wide genotyping via the DArTseq method. This is a direct continuation of the study by Dziurdziak et al. [25,26] in which barley landraces were characterized. So far, a large number of articles have been published on the analysis of barley genetic diversity. In spite of this, the topic is still of interest to researchers from all over the world, which may indicate its relevance. In the last two years only, a number of publications on this subject have appeared [27,28,29,30,31,32,33,34,35]. A detailed description of genetic diversity is a prerequisite for effective conservation and utilization of genetic resources and progress in crop breeding programs.

3.1. SNP Abundance and Analysis of Base Changes

The analyzed loci, relatively uniform, represented all barley chromosomes, and their proportion and density was consistent with previous results obtained by DArTseq for barley [25]. At the same time, the analysis provided significantly more uniform and above 3.5 times denser data than the results obtained for wheat based on 65,560 loci derived from genotyping-by-sequencing (GBS), of which over 77% SNPs had unknown chromosome location [36].
The distribution of the analyzed loci along chromosomes, i.e., their high frequency in the distal parts of chromosomes and low or complete absence in the centromeric and pericentromeric regions, was also observed in previous studies on barley, durum wheat, and soybean [21,25,37,38]. This is also consistent with the distribution of protein-coding genes on barley chromosomes and the recombination rate [21]. A characteristic feature of Triticeae, including barley, is a significantly reduced level of meiotic recombination in the centromeric and pericentromeric regions [39,40,41]. A high recombination rate in distal chromosome fragments is associated with barley domestication. In wild barley, high recombination rates have been found in more interstitial chromosomes’ regions [42].
The analysis showed the presence of all possible SNP types in the studied cultivar set. The number of transition-type SNPs was 1.5 times higher than the transversion-type. An excess of transversions was also observed in previous studies involving NGS technology for cowpea, wheat, rice, barley, and common bean, among others [25,36,43,44,45]. The higher frequency of transition SNPs over transversion SNPs is due to their higher probability of preserving protein structure and function [44,46]. The most abundant SNP was A > G followed by C > T which may reflect the frequency of methylation/demethylation related mutations and was also common in the above cited studies. It is noteworthy that the DArT-seq analysis also revealed an increased relative abundance of C > G SNPs compared to the other transversions. Similar results were previously obtained by Duran et al. [47] for barley, Lai et al. [48] and Alipour et al. [36] for wheat, but this phenomenon has not been explained so far.
Polymorphism of the examined loci, determined by the PIC coefficient, was slightly lower in the cultivars than in the landraces previously studied [25]. However, differences occurred at the chromosome level. For landraces, the lowest mean PIC value was observed for 2H and for cultivars for 1H. This may indicate increased selection within 1H during breeding.

3.2. Genetic Diversity

For thousands of years, since their domestication, crops have been cultivated as populations with a complex genetic structure. Selection occurred on farms either as a result of human efforts or as a result of pressure from local ecogeographic conditions. This resulted in a differentiation between populations and the formation of landraces [49,50]. The 20th century brought progress in breeding and the displacement of landraces by cultivars tending towards homogeneity. To be released, cultivars had to go through evaluation for distinctness, uniformity, and stability [51].
Looking ove4 120 years of barley breeding in Poland it is clearly visible that the average variability within old cultivars is almost three times higher than in the group of modern cultivars, which are very uniform. Breeding-related selection is even more pronounced when the results obtained here are compared with the previous ones for landraces. Even the most internally differentiated cultivar, i.e., ‘Cesarski Sieglera’ (Ho = 0.236), is almost twice as less heterogeneous than the Polish landrace PL503844 (0.422) [25]. Thus, it can be clearly seen how breeding progress leads to genetic uniformity of individuals within a cultivar. Obviously, among the old cultivars studied here, there were also some with low heterogeneity, comparable even to modern cultivars, e.g., ‘Danubia Ciolkowski’ or ‘Kujawski’. However, it should be considered that a time lapse took place from the breeding of the oldest cultivars to their acquisition by the gene bank and finally to the time of the genetic analysis presented here. The oldest cultivars in the studied set come from the turn of the 19th and 20th century. Thus, they must have survived one or sometimes two world wars, during which part of their original variability may have been lost. Before these cultivars were acquired for the gene bank, they were maintained in the collections of breeders, universities or scientific institutes. Improper conservation breeding, repeated propagation or even lack of sufficiently frequent seed regeneration may have led to the degeneration of cultivars by further loss of variability. The breeders’ habit is to remove individuals diverging from the remaining plants from the cultivar, so that the cultivar fulfils the condition of uniformity. However, in the case of old cultivars, this may have exacerbated the loss of genetic variation. In the period prior to preservation in the seed bank, situations could also arise in which an old cultivar was deliberately over-selected for use in a breeding program, but this information was not provided to the gene bank. The low heterogeneity of some old cultivars may also be the result of genetic drift that occurred during seed reproduction for the gene bank, i.e., when the initial seed sample was too small and did not fully represent the original variability of the cultivar. Of course, at each of the stages the selection pressure of the environment may have also acted to remove some of the genotypes from the population, thus depleting its gene pool. At this point, from the point of view of the gene bank, it is irrelevant either where or for what reason the reduction in variation occurred. However, the information about the low level of heterogeneity attached to the description of the accessions in the gene bank database is important mainly for the end users, i.e., breeders and scientists, and sometimes also for farmers. Therefore, it cannot be generalized that old cultivars are always highly heterogeneous. It is worth noticing, that among old oat cultivars stored in NCPGR, and coming from the same breeding period, not so significant differences in the level of heterogeneity were observed [52]. However, the same trend was observed, i.e., that as breeding progressed in the 20th century, the genetic uniformity of individuals within a cultivar clearly increased [53]. However, the increase in genetic uniformity of the studied cultivars was not accompanied by a decrease in overall genetic diversity. Over the 120 years of breeding, fluctuations in the level of uHe, AR and maximum genetic distance were observed in the studied cultivar groups. Thus, no loss of genetic variation was observed as a result of breeding progress, as was implied by Gepts et al. [5] or Russell et al. [54]. The results of the analyses presented here are consistent with the meta-analysis of changes in genetic variation in crop cultivars conducted by van der Wouw et al. [55].
Based on the results obtained, no loss of genetic diversity was observed between the oldest and the newest cultivars studied. However, a detailed analysis of changes in allele frequency clearly indicated genetic erosion. In the course of breeding, about 600 alleles were lost from the gene pool of barley cultivars over the years. They have been preserved only thanks to the activity of the gene bank. Gradually, during breeding, ’old’ unique alleles were driven out from Polish cultivars and replaced by new allelic variation. As many as 11% of the 11,655 loci examined have completely different alleles in the group of the oldest and the newest cultivars. On the basis of the few pedigree data, we can state that alleles representing the native gene pool from landraces occurring in Poland and the Czech Republic were almost completely suppressed in breeding programs. This result also indicates that researchers should be very cautious about the results of the analysis of genetic diversity in the context of changes over time.

3.3. Evidence of Targeted Selection

Genome-wide DArTseq analysis provided an opportunity to evaluate changes in the genetic structure of spring barley cultivars bred in Poland. Both PCoA and STRUCTURE showed the merging of consecutive groups of gene pools. Breeding in Poland follows European trends, so it may be assumed that changes in population structure reflect a breeding focus on increasing yield and, in recent years, also on increasing resistance to pathogens. A gradient of variation and gradual targeted shifts were also observed in earlier studies on barley [56,57,58].
Thanks to the knowledge of the barley genome sequence and the mapping of DArTseq data to it, it was possible to determine the chromosomal localization of the analyzed loci. This allowed observation not only of the changes in genetic diversity in time, but also to what extent this affected individual chromosomes. In general, for most chromosomes there was the same pattern of change over time, i.e., a decrease in observed heterozygosity and an increase in inbreeding along with breeding progress. Comparison of the polymorphism level of loci along chromosomes in cultivars representing extreme breeding periods allowed detection of regions showing a lack of variation. These regions did not change during 120 years of breeding and were located in the centromeric and pericentromeric fragments of chromosomes 1H, 2H, 4H and 7H. Interestingly, in landraces of spring barley, such “empty” regions were observed at 1H, 2H and 4H [25] and, in the study of Tondelli et al. [58], at 1H, 2H and 7H. This means that landraces contain variability within 7H, and European modern cultivars within 4H, which is not present in Polish cultivars. The 4H centromeric region contains the QTL of net form net blotch (NFNB) resistance and Mlg, a powdery mildew resistance gene in the gene-dense pericentromeric region [59,60], while the 7H centromeric region contains QTLs related to heading date, yield and yield-forming traits such as plant height and root length [61,62,63,64,65,66].
FST analysis enabled identification of regions in which, during breeding, different alleles were fixed compared to the oldest cultivars. These regions occurred mainly on 5H. Their presence in the pericentromeric region was also found in modern European cultivars [58]. The fixation of “new” alleles in the pericentromeric region may be related to resistance breeding programs. In this region, several loci for resistance to leaf rust were found, including Rph2 [58,67]. The VRN-1 gene encoding the MADS-box transcription factor is located in close proximity to the high-fixation region found on 5HL. Its involvement in the regulation of genes related to reproductive organs and flowering of plants is well known [68]. Wild-type VRN-1 determines the need for vernalization, i.e., prolonged exposure to cold as a prerequisite for flowering in most winter cereals [69]. Deletion in the first intron allows spring-sown plants to flower without prior vernalization [70]. It was proved that a genetic variation of VRN-1 correlates with flowering time in spring forms of barley [71]. According to the Voss-Fels et al. [72] study, VRN-1 is also associated with root system morphology. In addition, variation in this gene also affects final biomass and yield, especially under drought and salinity stress [73,74]. The high FST region on 3H may be associated with selection for reduced plant height and increased lodging resistance. Numerous genes and QTLs related to plant height have been mapped on chromosome 3H [58,75,76,77,78].

3.4. Improving the Management of the Germplasm Collection

DArTseq analysis will also enable improved management of the germ plasm collection. On the one hand, verification or identification of duplicate accessions was performed, and on the other, a core collection was selected. In a group of 74 cultivars stored in the Polish gene bank, for 15 cultivars, there were two or even three separate accessions.
Duplicates in gene banks arise when, by mistake, a cultivar or other type of accession becomes added to a collection multiple times [79]. Here, duplicates were most often created as a result of inclusion of accessions into the collection before their official registration as a cultivar and subsequent incorporation of an already registered cultivar. Accessions with identical passport data and genetic makeup will be combined as separate subsamples under a common accession number. In contrast, accession PL43812 ‘Bryl’ will have its passport data corrected. Due to the genetic distinctiveness of this accession from the other cultivars, it will be submitted to the curator for characterization and evaluation.
Improved barley collection management will also be provided by the selected core collection. The idea behind the establishment of core collections is to facilitate scientists and breeders in using the genetic resources stored in germplasm collections [80]. This also facilitates the maintenance of germplasm collections in gene banks, which can thus reduce the number of accessions held in active collections and provide access to the full range of diversity.

4. Materials and Methods

4.1. Plant Material

From the spring barley collection held at the National Center for Plant Genetic Resources (NCPGR), 74 accessions classified as advanced/improved cultivars were selected and analyzed. In addition, nine cultivars that are currently cultivated and have not yet been accessioned into the gene bank collection were included in the analysis (Table 6).
For each investigated cultivar, information about the period and place of its breeding and the time of its entry and presence in the official register of cultivated varieties, maintained by the Research Centre for Cultivar Testing (RCCT), was collected. Data for historical cultivars were obtained from Arseniuk et al. [10] and for more contemporary cultivars directly from RCCT. Based on these data, the cultivars were divided into five groups i.e., bred before 1945, 1945–1969, 1970–1989, 1990–1999 and after 2000.
Table 6. The list of spring barley cultivars analyzed by DArTseq.
No.Accession NumberCultivar NameBREEDING SITECountryYear/Period of
Registration
Year/Period of
Deregistration
Core
Collection
1PL41572Antoniński BrowarnyAntoninyPOL19301939yes
2PL41323Cesarski StiegleraSobótkaPOLafter 19181929yes
3PL42125Danubia Ciołkowski (Danubia Ciślikowski)CiołkowoPOL19301940yes
4PL40306Elka HilderandaKleszczewoPOL19301939no
5PL41691Hanna BorzymowickiBorzymiePOL19301939yes
6PL41692Hanna Gambrinus; Hanna GambrvnusSielcePOL1918–19391957yes
7PL41695Hanna SkrzeszowickiPolanowicePOL1918–19391971yes
8PL43217KujawskiRusewkoPOLafter 19181929yes
9PL41475KutnowskiKutnoPOL19001918–1939yes
10PL42060Puławski BrowarnyPuławyPOL1918–19391939yes
11PL41905PrzeworskiDolnePOL1918–19391939yes
12PL42129PutzaRusewkoPOL19301940yes
13PL40460TeresaRusewkoPOL19301940yes
14PL41570AntałekTulcePOL19561971yes
15PL42034BorynaSzelejewoPOL19551958yes
16PL42042Browarny PZHRStrzelcePOL19461969no
17PL42124DamazyPolanowicePOL19691975yes
18PL43614DamazyPolanowicePOL19691975no
19PL40940JarekBąkówPOL19631970no
20PL42363JarekBąkówPOL19631970no
21PL41740KazimierskiBrzeziePOL19551967yes
22PL44075KosLesznoPOL19461958yes
23PL42127MazowieckiMłochów, DłużewPOL19461959yes
24PL41916RefleksSobótkaPOL19551960yes
25PL41924SandomierskiJasicePOL19551960no
26PL41940SkrzeszowickiPolanowicePOL19551972no
27PL41233WandaCelbowoPOL19651970no
28PL41419ArsGorzów Wlkp.POL19831996yes
29PL43646ArsGorzów Wlkp.POL19831996no
30PL43423BielikModzurówPOL19841994no
31PL41415BielikModzurówPOL19841994yes
32PL43033DemaŁagiewnikiPOL19871998no
33PL43416DemaŁagiewnikiPOL19871998no
34PL41328GryfGorzów Wlkp.POL19711980no
35PL43086KlimekStrzelcePOL19891996no
36PL43414KlimekStrzelcePOL19891996yes
37PL41329KosmosBąkówPOL19741978yes
38PL43032LotMałyszyn, Gorzów Wlkp.POL19872007yes
39PL43421LotMałyszyn, Gorzów Wlkp.POL19872007no
40PL41769LubuskiStrzelce, BorówPOL19701975no
41PL41418MagonaPOLnanano
42PL41886PiastPolanowicePOLna1970no
43PL40556PolonMałyszynPOL19771989yes
44PL43056RudzikModzurówPOL19872008yes
45PL43423RudzikModzurówPOL19872008no
46PL44045AtolStrzelcePOL19972007no
47PL44030BiesModzurówPOL19962010yes
48PL43637BossBąkówPOL19942020yes
49PL44031GwarekPolanowicePOL19992011no
50PL43424MobekModzurówPOL19932001yes
51PL43335OrlikBąkówPOL19902000yes
52PL43417OrlikBąkówPOL19902000no
53PL43368PoloStrzelcePOL19922003yes
54PL43411PoloStrzelcePOL19922003yes
55PL43867RastikRadzikówPOL19992010yes
56PL43749RodionRadzikówPOL19962021no
57PL35393StartPolanowicePOL19952010yes
58PL43868StratusStrzelcePOL19992020yes
59PL500074BrylBąkówPOL19982021no
60PL43949BrylBąkówPOL19982021yes
61PL43812BrylBąkówPOL19982021no
62PL500070EdgarBąkówPOL19922004no
63PL500666EdgarBąkówPOL19922004no
64PL43419NagradNagradowicePOL1990nano
65PL43379NagradNagradowicePOL1990nayes
66PL43750RabelRadzikówPOL19962010yes
67PL500667RamboRadzikówPOL19932003yes
68PL43747RamboRadzikówPOL19932003no
69PL43748RatajRadzikówPOL19962010yes
70PL43369RodosStrzelcePOL19922010yes
71PL43412RodosStrzelcePOL19922010yes
72PL503817GranalNagradowicePOL20012021no
73PL503818NadekNagradowicePOL20042014yes
74PL44032SezamSzelejewo, ModzurówPOL20002010no
75niRunnernaGER2018up nowno
76niAticoKrakówPOL2009up nowyes
77niPodarekStrzelcePOL2014up nowyes
78niAllianznaFRA2016up nowno
79niRubaszekSmolicePOL2014up nowyes
80niSoldonaGER2013up nowyes
81niEllanaFRA2012up nowyes
82niRezusSmolicePOL2018up nowyes
83niRGT PlanetnaFRA2016up nowyes
na—data not available; ni—not included in the gene bank collection; FRA—France; GER—Germany; POL—Poland.

4.2. DArTseq Genotyping

Seeds, were obtained from long term storage of NCPGR or directly from breeding stations, were sown in a greenhouse in a substrate dedicated to planting seeds. From eight, random seedlings in the second leaf stage, the middle part of the second leaf about 10 mm long was collected. A modified CTAB protocol [81,82] was used to isolate total genomic DNA. The DNA quantity and quality were assessed by spectrophotometric analysis using a NanoDrop ND-1000 spectrophotometer (NanoDrop Technologies, Willmington, DA, USA) followed by agarose gel electrophoresis (1.5% agarose). The obtained DNA isolates were mixed in equal proportions to form a pooled sample representing the tested cultivar. All bulk samples were diluted to a final concentration of 75 ng/µL and shipped to the Diversity Arrays Technology Pty Ltd., Canberra, Australia for DArTseq genotyping. The resulting sequences were aligned to the barley Morex genome assembly [21].

4.3. Data Analysis

DArTseq results in a form of a table containing codominant single nucleotide polymorphisms (SNPs) were transformed into a binary matrix. Each locus was recorded as two lines where homozygotes were denoted as 1/1 or 0/0 and heterozygotes as 1/0. In the first step the array was filtered according to reproducibility (RepAvg ≥ 0.95), call rate (CallRate ≥ 0.95), and the minor allele frequency (MAF > 0.01).
Further preliminary analysis included determination of the proportion of polymorphic loci and calculation of polymorphic information content (PIC), observed (Ho) and expected heterozygosity (He), and inbreeding coefficient (F) according to the formulas published in Dziurdziak et al. [25].
The distribution of the investigated loci on the chromosomes and PIC, Ho and F along the chromosomes were also assessed using the sliding window method with 500 kb intervals at 250 positions for each chromosome.
Values of variation coefficients were calculated for groups of cultivars using a formula excluding the effect of sample size. Analysis of variance ANOVA and Tukey’s post hoc test were used to compare the degree of variation. The level of allelic richness (AR) was assessed based on rarefaction method. Analysis of molecular variance AMOVA was also performed. The Wright’s FST parameter was used to estimate genome wide group differentiation, and to increase plot resolution transformation by rising FST to the 10th power (FST10) was performed [58].
The genetic distance between the sites was calculated using the Jaccard coefficient and then principal coordinate analysis (PCoA) was performed. Moreover, the identity by descent (IBD) was estimated for all pairwise comparisons among the accessions. Duplicates were defined as having IBD > 0.95 among accessions.
The final step of the analysis was to perform clustering based on the Bayesian model to analyze the genetic structure of examined accessions. In order to obtain the most probable value of K, a search was conducted in the range from 1 to 16 with six independent repetitions per K for cultivars analysis, whereas analysis of the compiled cultivars and preexisting landraces results was performed for K up to 11 with six independent runs/K. A LINUX cluster hosted by the Interdisciplinary Centre for Mathematical and Computational Modelling at the Warsaw University was used to run the analysis of batch files. The number of clusters was determined based on the posteriori data probability for a given K and ΔK [23] and the full search algorithm was used to find the best match for replicated cluster analysis results. A cutoff value of 0.8 was set as the probability of assigning accession to the group.
A core collection was extracted using the advanced M strategy implemented through a modified heuristic algorithm (A*).
The above mentioned analyses were performed using Microsoft Excel 2016, XLSTAT Ecology (Addinsoft, Inc., Brooklyn, NY, USA), GenAlEx 6.501 [22], HP-RARE 1.1 [83], PLINK [84], STRUCTURE v2.3.4 [85], CLUMPP [24], PowerCore [86]. The following packages in R were used to visualize the results: igraph [87], circlize [88]. The population structure analyses were performed in the framework of Computational Grant (G72-19) from the Interdisciplinary Center for Mathematical and Computer Modeling at the University of Warsaw, Poland (ICM UW).

5. Conclusions

This study showed that the gene pool structure of spring barley cultivars has changed significantly during 120 years of breeding in Poland. Many alleles have been displaced and replaced by new ones. These changes were associated with breeding priority evolution over time. Traces of directed selection are particularly visible on chromosomes 3H and 5H. The genetic uniformity of the cultivars increased with the progress of breeding. In contrast, the low variation within some of the old cultivars is the result of selection that probably occurred before they were obtained by the gene bank. A side effect of the analysis was the identification and verification of duplicates and the establishment of a core collection and thus DArTseq analysis will contribute to more efficient management of the barley collection in the gene bank. Analysis of changes in the level of genetic diversity over time may not reflect changes in genetic structure, so its results should be treated with caution.

Supplementary Materials

The following supporting information can be downloaded at: https://www.mdpi.com/article/10.3390/ijms23094553/s1.

Author Contributions

Conceptualization, J.D. and M.B.; methodology, J.D. and M.B.; formal analysis, M.B.; investigation, J.D.; resources, H.B. and W.P.; data curation, J.D. and M.B.; writing—original draft preparation, J.D.; writing—review and editing, M.B., H.B. and W.P.; visualization, J.D. and M.B.; supervision, M.B.; project administration, W.P. and M.B.; funding acquisition, W.P. and H.B. All authors have read and agreed to the published version of the manuscript.

Funding

This work was supported by the multi-annual program: 2015–2020 “Establishment of a scientific basis for biological progress and preservation of plant genetic resources as a source of innovation to support sustainable agriculture and food security of the country” coordinated by Plant Breeding and Acclimatization Institute-National Research Institute and financed by the Ministry of Agriculture and Rural Development of Poland. The calculations were performed at the Interdisciplinary Centre for Mathematical and Computational Modelling, University of Warsaw (ICM UW) within the framework of Computational Grant No. G72–19.

Institutional Review Board Statement

Not applicable.

Informed Consent Statement

Not applicable.

Data Availability Statement

The raw data of DArTseq SNP used in this study are openly available on the platform Center for Open Science at https://osf.io/v4m5s/ (accessed on 17 April 2022).

Conflicts of Interest

The authors declare no conflict of interest. The funders had no role in the design of the study; in the collection, analyses, or interpretation of data; in the writing of the manuscript, or in the decision to publish the results.

References

  1. FAO. International Treaty on Plant Genetic Resources for Food and Agriculture; FAO: Rome, Italy, 2009. [Google Scholar]
  2. Murphy, D.J. People, Plants & Genes: The Story of Crops and Humanity; Oxford University Press: Cambridge, UK, 2007. [Google Scholar]
  3. Dudley, J.W.; Frey, K. Plant breeding-a vital part of improvement in crop yields, quality and production efficiency. In Historical Perspectives in Plant Sciences; Iowa State University Press: Ames, IA, USA, 1994; pp. 163–177. [Google Scholar]
  4. Evenson, R.E.; Gollin, D. Assessing the impact of the Green Revolution, 1960 to 2000. Science 2003, 300, 758–762. [Google Scholar] [CrossRef] [PubMed] [Green Version]
  5. Gepts, P. Plant genetic resources conservation and utilization: The accomplishments and future of a societal insurance policy. Crop Sci. 2006, 46, 2278–2292. [Google Scholar] [CrossRef]
  6. Plucknett, D.L.; Smith, N.J. Gene Banks and the World’s Food; Princeton University Press: Princeton, NJ, USA, 2014. [Google Scholar]
  7. El-Hashash, E.F.; El-Absy, K.M. Barley (Hordeum vulgare L.) breeding. In Advances in Plant Breeding Strategies: Cereals; Springer: Berlin/Heidelberg, Germany, 2019; pp. 1–45. [Google Scholar]
  8. Verstegen, H.; Köneke, O.; Korzun, V.; Broock, R.V. The world importance of barley and challenges to further improvements. In Biotechnological Approaches to Barley Improvement; Springer: Berlin/Heidelberg, Germany, 2014; pp. 3–19. [Google Scholar]
  9. Newman, R.K.; Newman, C.W. Barley for Food and Health: Science, Technology, and Products; John Wiley & Sons: Hoboken, NJ, USA, 2008. [Google Scholar]
  10. Arseniuk, E.; Krzymuski, J.; Martyniak, J.; Oleksiak, T. Historia Hodowli i Nasiennictwa na Ziemiach Polskich w XX Wieku (the History of Breeding and Seed Production on Polish Territory in the XX Century); Wydawnictwo Prodruk: Poznań, Poland, 2003. [Google Scholar]
  11. Sempołowski, A. Hodowla i Uszlachetnianie Roślin Gospodarskich [Breeding and Improvement of Crops]; Skład Główny w Księgarni E. Wende i S-ka: Warsaw, Poland, 1902. [Google Scholar]
  12. Czajkowski, K.; Czembor, H.; Gawda, J.; Gierat, K.; Góski, T.; Kowalska, M.; Kozera, W.; Król, M.; Nalepa, S.; Ralski, E.; et al. Jęczmień [Barley]; Państwowe Wydawnictwo Rolnicze i Leśne: Warsaw, Poland, 1973. [Google Scholar]
  13. Tomka, M.; Gálová, Z.; Urminská, D. The differences between the old and new barley varieties on the basis of hordein polymorphism with respect to qualitative parameters. J. Microbiol. Biotechnol. Food Sci. 2021, 2021, 108–110. [Google Scholar] [CrossRef] [Green Version]
  14. Sowa, S.; Paczos-Grzęda, E. A study of crown rust resistance in historical and modern oat cultivars representing 120 years of Polish oat breeding. Euphytica 2020, 216, 12. [Google Scholar] [CrossRef]
  15. Li, G.; Xu, X.; Bai, G.; Carver, B.F.; Hunger, R.; Bonman, J.M. Identification of novel powdery mildew resistance sources in wheat. Crop Sci. 2016, 56, 1817–1830. [Google Scholar] [CrossRef]
  16. Tóth, M.; Kása, K.; Szani, Z.; Balikó, E. Traditional old apple cultivars as new gene sources for apple breeding. In Proceedings of the XI Eucarpia Symposium on Fruit Breeding and Genetics, Angers, France, 1–5 September 2003; pp. 609–612. [Google Scholar]
  17. Hoisington, D.; Khairallah, M.; Reeves, T.; Ribaut, J.-M.; Skovmand, B.; Taba, S.; Warburton, M. Plant genetic resources: What can they contribute toward increased crop productivity? Proc. Natl. Acad. Sci. USA 1999, 96, 5937–5943. [Google Scholar] [CrossRef] [Green Version]
  18. Lammerts van Bueren, E.; Verhoog, H.; Tiemens-Hulscher, M.; Struik, P.; Haring, M. Organic agriculture requires process rather than product evaluation of novel breeding techniques. NJAS Wagening J. Life Sci. 2007, 54, 401–412. [Google Scholar] [CrossRef] [Green Version]
  19. Kumar, A.; Verma, R.P.S.; Singh, A.; Sharma, H.K.; Devi, G. Barley landraces: Ecological heritage for edaphic stress adaptations and sustainable production. Environ. Sustain. Indic. 2020, 6, 100035. [Google Scholar] [CrossRef]
  20. Dreiseitl, A. Genes for resistance to powdery mildew in European barley cultivars registered in the Czech Republic from 2011 to 2015. Plant Breed. 2017, 136, 351–356. [Google Scholar] [CrossRef]
  21. Mascher, M.; Gundlach, H.; Himmelbach, A.; Beier, S.; Twardziok, S.O.; Wicker, T.; Radchuk, V.; Dockter, C.; Hedley, P.E.; Russell, J. A chromosome conformation capture ordered sequence of the barley genome. Nature 2017, 544, 427–433. [Google Scholar] [CrossRef] [Green Version]
  22. Peakall, R.; Smouse, P.E. GenAlEx 6.5: Genetic analysis in Excel. Population genetic software for teaching and research—An update. Bioinformatics 2012, 28, 2537–2539. [Google Scholar] [CrossRef] [Green Version]
  23. Evanno, G.; Regnaut, S.; Goudet, J. Detecting the number of clusters of individuals using the software STRUCTURE: A simulation study. Mol. Ecol. 2005, 14, 2611–2620. [Google Scholar] [CrossRef] [Green Version]
  24. Jakobsson, M.; Rosenberg, N.A. CLUMPP: A cluster matching and permutation program for dealing with label switching and multimodality in analysis of population structure. Bioinformatics 2007, 23, 1801–1806. [Google Scholar] [CrossRef] [Green Version]
  25. Dziurdziak, J.; Gryziak, G.; Groszyk, J.; Podyma, W.; Boczkowska, M. DArTseq Genotypic and Phenotypic Diversity of Barley Landraces Originating from Different Countries. Agronomy 2021, 11, 2330. [Google Scholar] [CrossRef]
  26. Dziurdziak, J.; Bolc, P.; Wlodarczyk, S.; Puchta, M.; Gryziak, G.; Podyma, W.; Boczkowska, M. Multifaceted Analysis of Barley Landraces Collected during Gene Bank Expeditions in Poland at the End of the 20th Century. Agronomy 2020, 10, 1958. [Google Scholar] [CrossRef]
  27. Brbaklić, L.; Trkulja, D.; Mikić, S.; Mirosavljević, M.; Momčilović, V.; Dudić, B.; Procházková, L.; Aćin, V. Genetic diversity and population structure of serbian barley (Hordeum vulgare L.) collection during a 40-year long breeding period. Agronomy 2021, 11, 118. [Google Scholar] [CrossRef]
  28. Almerekova, S.; Genievskaya, Y.; Abugalieva, S.; Sato, K.; Turuspekov, Y. Population structure and genetic diversity of two-rowed barley accessions from Kazakhstan based on snp genotyping data. Plants 2021, 10, 2025. [Google Scholar] [CrossRef]
  29. Gadissa, F.; Abebe, M.; Bekele, T. Agro-morphological traits-based genetic diversity assessment in Ethiopian barley (Hordeum vulgare L.) landrace collections from Bale highlands, Southeast Ethiopia. Agric. Food Secur. 2021, 10, 1–14. [Google Scholar] [CrossRef]
  30. Larsson, M.N.; Leino, M.W.; Hagenblad, J. Genetic Diversity in 19th Century Barley (Hordeum vulgare) Reflects Differing Agricultural Practices and Seed Trade in Jämtland, Sweden. Diversity 2021, 13, 315. [Google Scholar] [CrossRef]
  31. Dido, A.A.; Krishna, M.; Assefa, E.; Degefu, D.T.; Singh, B.; Tesfaye, K. Genetic diversity, population structure and relationship of Ethiopian barley (Hordeum vulgare L.) landraces as revealed by SSR markers. J. Genet. 2022, 101, 1–20. [Google Scholar] [CrossRef]
  32. Iannucci, A.; Suriano, S.; Codianni, P. Genetic Diversity for Agronomic Traits and Phytochemical Compounds in Coloured Naked Barley Lines. Plants 2021, 10, 1575. [Google Scholar] [CrossRef] [PubMed]
  33. Nyiraguhirwa, S.; Grana, Z.; Henkrar, F.; Ouabbou, H.; Mohammed, I.; Udupa, S.M. Genetic diversity and structure of a barley collection predominatly from North African region. Cereal Res. Commun. 2021, 1–8. [Google Scholar] [CrossRef]
  34. Al Lawati, A.H.; Nadaf, S.K.; AlSaady, N.A.; Al Hinai, S.A.; Almamari, A.R.; Al Maawali, A.A. Genetic diversity of Omani barley (Hordeum vulgare L.) germplasm. Open Agric. 2021, 6, 628–639. [Google Scholar] [CrossRef]
  35. Verma, S.; Yashveer, S.; Rehman, S.; Gyawali, S.; Kumar, Y.; Chao, S.; Sarker, A.; Verma, R.P.S. Genetic and Agro-morphological diversity in global barley (Hordeum vulgare L.) collection at ICARDA. Genet. Resour. Crop Evol. 2021, 68, 1315–1330. [Google Scholar] [CrossRef]
  36. Alipour, H.; Bai, G.; Zhang, G.; Bihamta, M.R.; Mohammadi, V.; Peyghambari, S.A. Imputation accuracy of wheat genotyping-by-sequencing (GBS) data using barley and wheat genome references. PLoS ONE 2019, 14, e0208614. [Google Scholar] [CrossRef]
  37. Ávila, C.M.; Requena-Ramírez, M.D.; Rodríguez-Suárez, C.; Flores, F.; Sillero, J.C.; Atienza, S.G. Genome-Wide Association Analysis for Stem Cross Section Properties, Height and Heading Date in a Collection of Spanish Durum Wheat Landraces. Plants 2021, 10, 1123. [Google Scholar] [CrossRef]
  38. Hahn, V.; Würschum, T. Molecular genetic characterization of Central European soybean breeding germplasm. Plant Breed. 2014, 133, 748–755. [Google Scholar] [CrossRef]
  39. Künzel, G.; Korzun, L.; Meister, A. Cytologically integrated physical restriction fragment length polymorphism maps for the barley genome based on translocation breakpoints. Genetics 2000, 154, 397–412. [Google Scholar] [CrossRef]
  40. Künzel, G.; Waugh, R. Integration of microsatellite markers into the translocation-based physical RFLP map of barley chromosome 3H. Theor. Appl. Genet. 2002, 105, 660–665. [Google Scholar] [CrossRef]
  41. Russell, J.; Mascher, M.; Dawson, I.K.; Kyriakidis, S.; Calixto, C.; Freund, F.; Bayer, M.; Milne, I.; Marshall-Griffiths, T.; Heinen, S. Exome sequencing of geographically diverse barley landraces and wild relatives gives insights into environmental adaptation. Nat. Genet. 2016, 48, 1024–1030. [Google Scholar] [CrossRef] [Green Version]
  42. Dreissig, S.; Mascher, M.; Heckmann, S. Variation in recombination rate is shaped by domestication and environmental conditions in barley. Mol. Biol. Evol. 2019, 36, 2029–2039. [Google Scholar] [CrossRef]
  43. Ketema, S.; Tesfaye, B.; Keneni, G.; Amsalu Fenta, B.; Assefa, E.; Greliche, N.; Machuka, E.; Yao, N. DArTSeq SNP-based markers revealed high genetic diversity and structured population in Ethiopian cowpea [Vigna unguiculata (L.) Walp] germplasms. PLoS ONE 2020, 15, e0239122. [Google Scholar] [CrossRef]
  44. Vasumathy, S.K.; Peringottillam, M.; Sundaram, K.T.; Kumar, S.; Alagu, M. Genome-wide structural and functional variant discovery of rice landraces using genotyping by sequencing. Mol. Biol. Rep. 2020, 47, 7391–7402. [Google Scholar] [CrossRef]
  45. Delfini, J.; Moda-Cirino, V.; dos Santos Neto, J.; Ruas, P.M.; Sant’Ana, G.C.; Gepts, P.; Gonçalves, L.S.A. Population structure, genetic diversity and genomic selection signatures among a Brazilian common bean germplasm. Sci. Rep. 2021, 11, 1–12. [Google Scholar] [CrossRef]
  46. Wakeley, J. The excess of transitions among nucleotide substitutions: New methods of estimating transition bias underscore its significance. Trends Ecol. Evol. 1996, 11, 158–162. [Google Scholar] [CrossRef]
  47. Duran, C.; Appleby, N.; Vardy, M.; Imelfort, M.; Edwards, D.; Batley, J. Single nucleotide polymorphism discovery in barley using autoSNPdb. Plant Biotechnol. J. 2009, 7, 326–333. [Google Scholar] [CrossRef]
  48. Lai, K.; Duran, C.; Berkman, P.J.; Lorenc, M.T.; Stiller, J.; Manoli, S.; Hayden, M.J.; Forrest, K.L.; Fleury, D.; Baumann, U. Single nucleotide polymorphism discovery from wheat next-generation sequence data. Plant Biotechnol. J. 2012, 10, 743–749. [Google Scholar] [CrossRef] [Green Version]
  49. Dawson, J.C.; Goldringer, I. Breeding for genetically diverse populations: Variety mixtures and evolutionary populations. In Organic Crop Breeding; van Bueren, E.T.L., Myers, J.R., Eds.; Wiley: New Dheli, India, 2012; pp. 77–98. [Google Scholar]
  50. Jarvis, D.I.; Brown, A.H.; Cuong, P.H.; Collado-Panduro, L.; Latournerie-Moreno, L.; Gyawali, S.; Tanto, T.; Sawadogo, M.; Mar, I.; Sadiki, M. A global perspective of the richness and evenness of traditional crop-variety diversity maintained by farming communities. Proc. Natl. Acad. Sci. USA 2008, 105, 5326–5331. [Google Scholar] [CrossRef] [Green Version]
  51. Saccomanno, B.; Wallace, M.; O’Sullivan, D.M.; Cockram, J. Use of genetic markers for the detection of off-types for DUS phenotypic traits in the inbreeding crop, barley. Mol. Breed. 2020, 40, 1–10. [Google Scholar] [CrossRef] [Green Version]
  52. Boczkowska, M.; Harasimiuk, M.; Onyśk, A. Studies on genetic variation within old Polish cultivars of common oat. Cereal Res. Commun. 2015, 43, 12–21. [Google Scholar] [CrossRef] [Green Version]
  53. Boczkowska, M.; Onyśk, A. Unused genetic resources: A case study of Polish common oat germplasm. Ann. Appl. Biol. 2016, 169, 155–165. [Google Scholar] [CrossRef]
  54. Bayer, M.M.; Rapazote-Flores, P.; Ganal, M.; Hedley, P.E.; Macaulay, M.; Plieske, J.; Ramsay, L.; Russell, J.; Shaw, P.D.; Thomas, W. Development and evaluation of a barley 50k iSelect SNP array. Front. Plant Sci. 2017, 8, 1792. [Google Scholar] [CrossRef] [Green Version]
  55. Van de Wouw, M.; van Hintum, T.; Kik, C.; van Treuren, R.; Visser, B. Genetic diversity trends in twentieth century crop cultivars: A meta analysis. Theor. Appl. Genet. 2010, 120, 1241–1252. [Google Scholar] [CrossRef] [Green Version]
  56. Koebner, R.; Donini, P.; Reeves, J.; Cooke, R.; Law, J. Temporal flux in the morphological and molecular diversity of UK barley. Theor. Appl. Genet. 2003, 106, 550–558. [Google Scholar] [CrossRef]
  57. Ovesná, J.; Kučera, L.; Vaculová, K.; Milotová, J.; Snape, J.; Wenzl, P.; Huttner, E.; Kilian, A.; Martelli, G.; Milella, L. Analysis of the genetic structure of a barley collection using DNA diversity array technology (DArT). Plant Mol. Biol. Rep. 2013, 31, 280–288. [Google Scholar] [CrossRef]
  58. Tondelli, A.; Xu, X.; Moragues, M.; Sharma, R.; Schnaithmann, F.; Ingvardsen, C.; Manninen, O.; Comadran, J.; Russell, J.; Waugh, R. Structural and temporal variation in genetic diversity of European spring two-row barley cultivars and association mapping of quantitative traits. Plant Genome 2013, 6, plantgenome2013-03. [Google Scholar] [CrossRef] [Green Version]
  59. Close, T.J.; Bhat, P.R.; Lonardi, S.; Wu, Y.; Rostoks, N.; Ramsay, L.; Druka, A.; Stein, N.; Svensson, J.T.; Wanamaker, S. Development and implementation of high-throughput SNP genotyping in barley. BMC Genom. 2009, 10, 582. [Google Scholar] [CrossRef] [Green Version]
  60. Islamovic, E.; Bregitzer, P.; Friesen, T.L. Barley 4H QTL confers NFNB resistance to a global set of P. teres f. teres isolates. Mol. Breed. 2017, 37, 29. [Google Scholar] [CrossRef]
  61. Cuesta-Marcos, A.; Casas, A.M.; Hayes, P.M.; Gracia, M.P.; Lasa, J.M.; Ciudad, F.; Codesal, P.; Molina-Cano, J.L.; Igartua, E. Yield QTL affected by heading date in Mediterranean grown barley. Plant Breed. 2009, 128, 46–53. [Google Scholar] [CrossRef] [Green Version]
  62. Hayes, P.; Liu, B.; Knapp, S.; Chen, F.; Jones, B.; Blake, T.; Franckowiak, J.; Rasmusson, D.; Sorrells, M.; Ullrich, S. Quantitative trait locus effects and environmental interaction in a sample of North American barley germ plasm. Theor. Appl. Genet. 1993, 87, 392–401. [Google Scholar] [CrossRef] [PubMed]
  63. Laurie, D.; Pratchett, N.; Snape, J.; Bezant, J. RFLP mapping of five major genes and eight quantitative trait loci controlling flowering time in a winter× spring barley (Hordeum vulgare L.) cross. Genome 1995, 38, 575–585. [Google Scholar] [CrossRef] [PubMed]
  64. De la Pena, R.; Smith, K.; Capettini, F.; Muehlbauer, G.; Gallo-Meagher, M.; Dill-Macky, R.; Somers, D.; Rasmusson, D. Quantitative trait loci associated with resistance to Fusarium head blight and kernel discoloration in barley. Theor. Appl. Genet. 1999, 99, 561–569. [Google Scholar] [CrossRef]
  65. Marquez-Cedillo, L.; Hayes, P.; Kleinhofs, A.; Legge, W.; Rossnagel, B.; Sato, K.; Ullrich, S.; Wesenberg, D. QTL analysis of agronomic traits in barley based on the doubled haploid progeny of two elite North American varieties representing different germplasm groups. Theor. Appl. Genet. 2001, 103, 625–637. [Google Scholar] [CrossRef]
  66. Jefferies, S.; Barr, A.; Karakousis, A.; Kretschmer, J.; Manning, S.; Chalmers, K.; Nelson, J.; Islam, A.; Langridge, P. Mapping of chromosome regions conferring boron toxicity tolerance in barley (Hordeum vulgare L.). Theor. Appl. Genet. 1999, 98, 1293–1303. [Google Scholar] [CrossRef]
  67. Borovkova, I.; Steffenson, B.; Jin, Y.; Kilian, A.; Kleinhofs, A.; Blake, T. Identification and mapping of a leaf rust resistance gene in barley line Q21861. Genome 1997, 40, 236–241. [Google Scholar] [CrossRef] [PubMed]
  68. Deng, W.; Casao, M.C.; Wang, P.; Sato, K.; Hayes, P.M.; Finnegan, E.J.; Trevaskis, B. Direct links between the vernalization response and other key traits of cereal crops. Nat. Commun. 2015, 6, 5882. [Google Scholar] [CrossRef]
  69. Trevaskis, B.; Hemming, M.N.; Peacock, W.J.; Dennis, E.S. HvVRN2 responds to daylength, whereas HvVRN1 is regulated by vernalization and developmental status. Plant Physiol. 2006, 140, 1397–1405. [Google Scholar] [CrossRef] [PubMed] [Green Version]
  70. Fu, D.; Szűcs, P.; Yan, L.; Helguera, M.; Skinner, J.S.; Von Zitzewitz, J.; Hayes, P.M.; Dubcovsky, J. Large deletions within the first intron in VRN-1 are associated with spring growth habit in barley and wheat. Mol. Genet. Genom. 2005, 273, 54–65. [Google Scholar] [CrossRef] [Green Version]
  71. Milner, S.G.; Jost, M.; Taketa, S.; Mazón, E.R.; Himmelbach, A.; Oppermann, M.; Weise, S.; Knüpffer, H.; Basterrechea, M.; König, P. Genebank genomics highlights the diversity of a global barley collection. Nat. Genet. 2019, 51, 319–326. [Google Scholar] [CrossRef] [Green Version]
  72. Voss-Fels, K.P.; Robinson, H.; Mudge, S.R.; Richard, C.; Newman, S.; Wittkop, B.; Stahl, A.; Friedt, W.; Frisch, M.; Gabur, I. VERNALIZATION1 modulates root system architecture in wheat and barley. Mol. Plant 2018, 11, 226–229. [Google Scholar] [CrossRef] [Green Version]
  73. Rollins, J.A.; Drosse, B.; Mulki, M.; Grando, S.; Baum, M.; Singh, M.; Ceccarelli, S.; Von Korff, M. Variation at the vernalisation genes Vrn-H1 and Vrn-H2 determines growth and yield stability in barley (Hordeum vulgare) grown under dryland conditions in Syria. Theor. Appl. Genet. 2013, 126, 2803–2824. [Google Scholar] [CrossRef]
  74. Saade, S.; Brien, C.; Pailles, Y.; Berger, B.; Shahid, M.; Russell, J.; Waugh, R.; Negrão, S.; Tester, M. Dissecting new genetic components of salinity tolerance in two-row spring barley at the vegetative and reproductive stages. PLoS ONE 2020, 15, e0236037. [Google Scholar] [CrossRef]
  75. Malosetti, M.; van Eeuwijk, F.A.; Boer, M.P.; Casas, A.M.; Elía, M.; Moralejo, M.; Bhat, P.R.; Ramsay, L.; Molina-Cano, J.-L. Gene and QTL detection in a three-way barley cross under selection by a mixed model with kinship information using SNPs. Theor. Appl. Genet. 2011, 122, 1605–1616. [Google Scholar] [CrossRef] [Green Version]
  76. Pasam, R.K.; Sharma, R.; Malosetti, M.; van Eeuwijk, F.A.; Haseneyer, G.; Kilian, B.; Graner, A. Genome-wide association studies for agronomical traits in a world wide spring barley collection. BMC Plant Biol. 2012, 12, 16. [Google Scholar] [CrossRef] [Green Version]
  77. Lundqvist, U. New and revised descriptions of barley genes. Barley Genet. Newslett. 1997, 26, 22–516. [Google Scholar]
  78. Li, H.; Chen, G.; Yan, W. Molecular characterization of barley 3H semi-dwarf genes. PLoS ONE 2015, 10, e0120558. [Google Scholar] [CrossRef]
  79. Knüpffer, H.; Frese, L.; Jongen, M. Using central crop databases: Searching for duplicates and gaps. In Proceedings of the Central Crop Databases: Tools for Plant Genetic Resources Management, Report of a Workshop, Budapest, Hungary, 13–16 October 1996; pp. 67–77. [Google Scholar]
  80. Frankel, O. Genetic perspectives of germplasm conservation. Genet. Manip. Impact Man Soc. 1984, 161, 170. [Google Scholar]
  81. Doyle, J.J.; Doyle, J.L. Isolation ofplant DNA from fresh tissue. Focus 1990, 12, 39–40. [Google Scholar]
  82. Edwards, K.; Johnstone, C.; Thompson, C. A simple and rapid method for the preparation of plant genomic DNA for PCR analysis. Nucleic Acids Res. 1991, 19, 1349. [Google Scholar] [CrossRef]
  83. Kalinowski, S.T. Hp-rare 1.0: A computer program for performing rarefaction on measures of allelic richness. Mol. Ecol. Notes 2005, 5, 187–189. [Google Scholar]
  84. Chang, C.C.; Chow, C.C.; Tellier, L.C.; Vattikuti, S.; Purcell, S.M.; Lee, J.J. Second-generation PLINK: Rising to the challenge of larger and richer datasets. Gigascience 2015, 4, 7. [Google Scholar] [CrossRef] [PubMed]
  85. Hubisz, M.J.; Falush, D.; Stephens, M.; Pritchard, J.K. Inferring weak population structure with the assistance of sample group information. Mol. Ecol. Resour. 2009, 9, 1322–1332. [Google Scholar] [CrossRef] [PubMed] [Green Version]
  86. Kim, K.-W.; Chung, H.-K.; Cho, G.-T.; Ma, K.-H.; Chandrabalan, D.; Gwag, J.-G.; Kim, T.-S.; Cho, E.-G.; Park, Y.-J. PowerCore: A program applying the advanced M strategy with a heuristic search for establishing core sets. Bioinformatics 2007, 23, 2155–2162. [Google Scholar] [CrossRef] [PubMed] [Green Version]
  87. Csardi, G.; Nepusz, T. The igraph software package for complex network research. InterJournal Complex Syst. 2006, 1695, 1–9. [Google Scholar]
  88. Gu, Z.; Gu, L.; Eils, R.; Schlesner, M.; Brors, B. Circlize implements and enhances circular visualization in R. Bioinformatics 2014, 30, 2811–2812. [Google Scholar] [CrossRef] [PubMed] [Green Version]
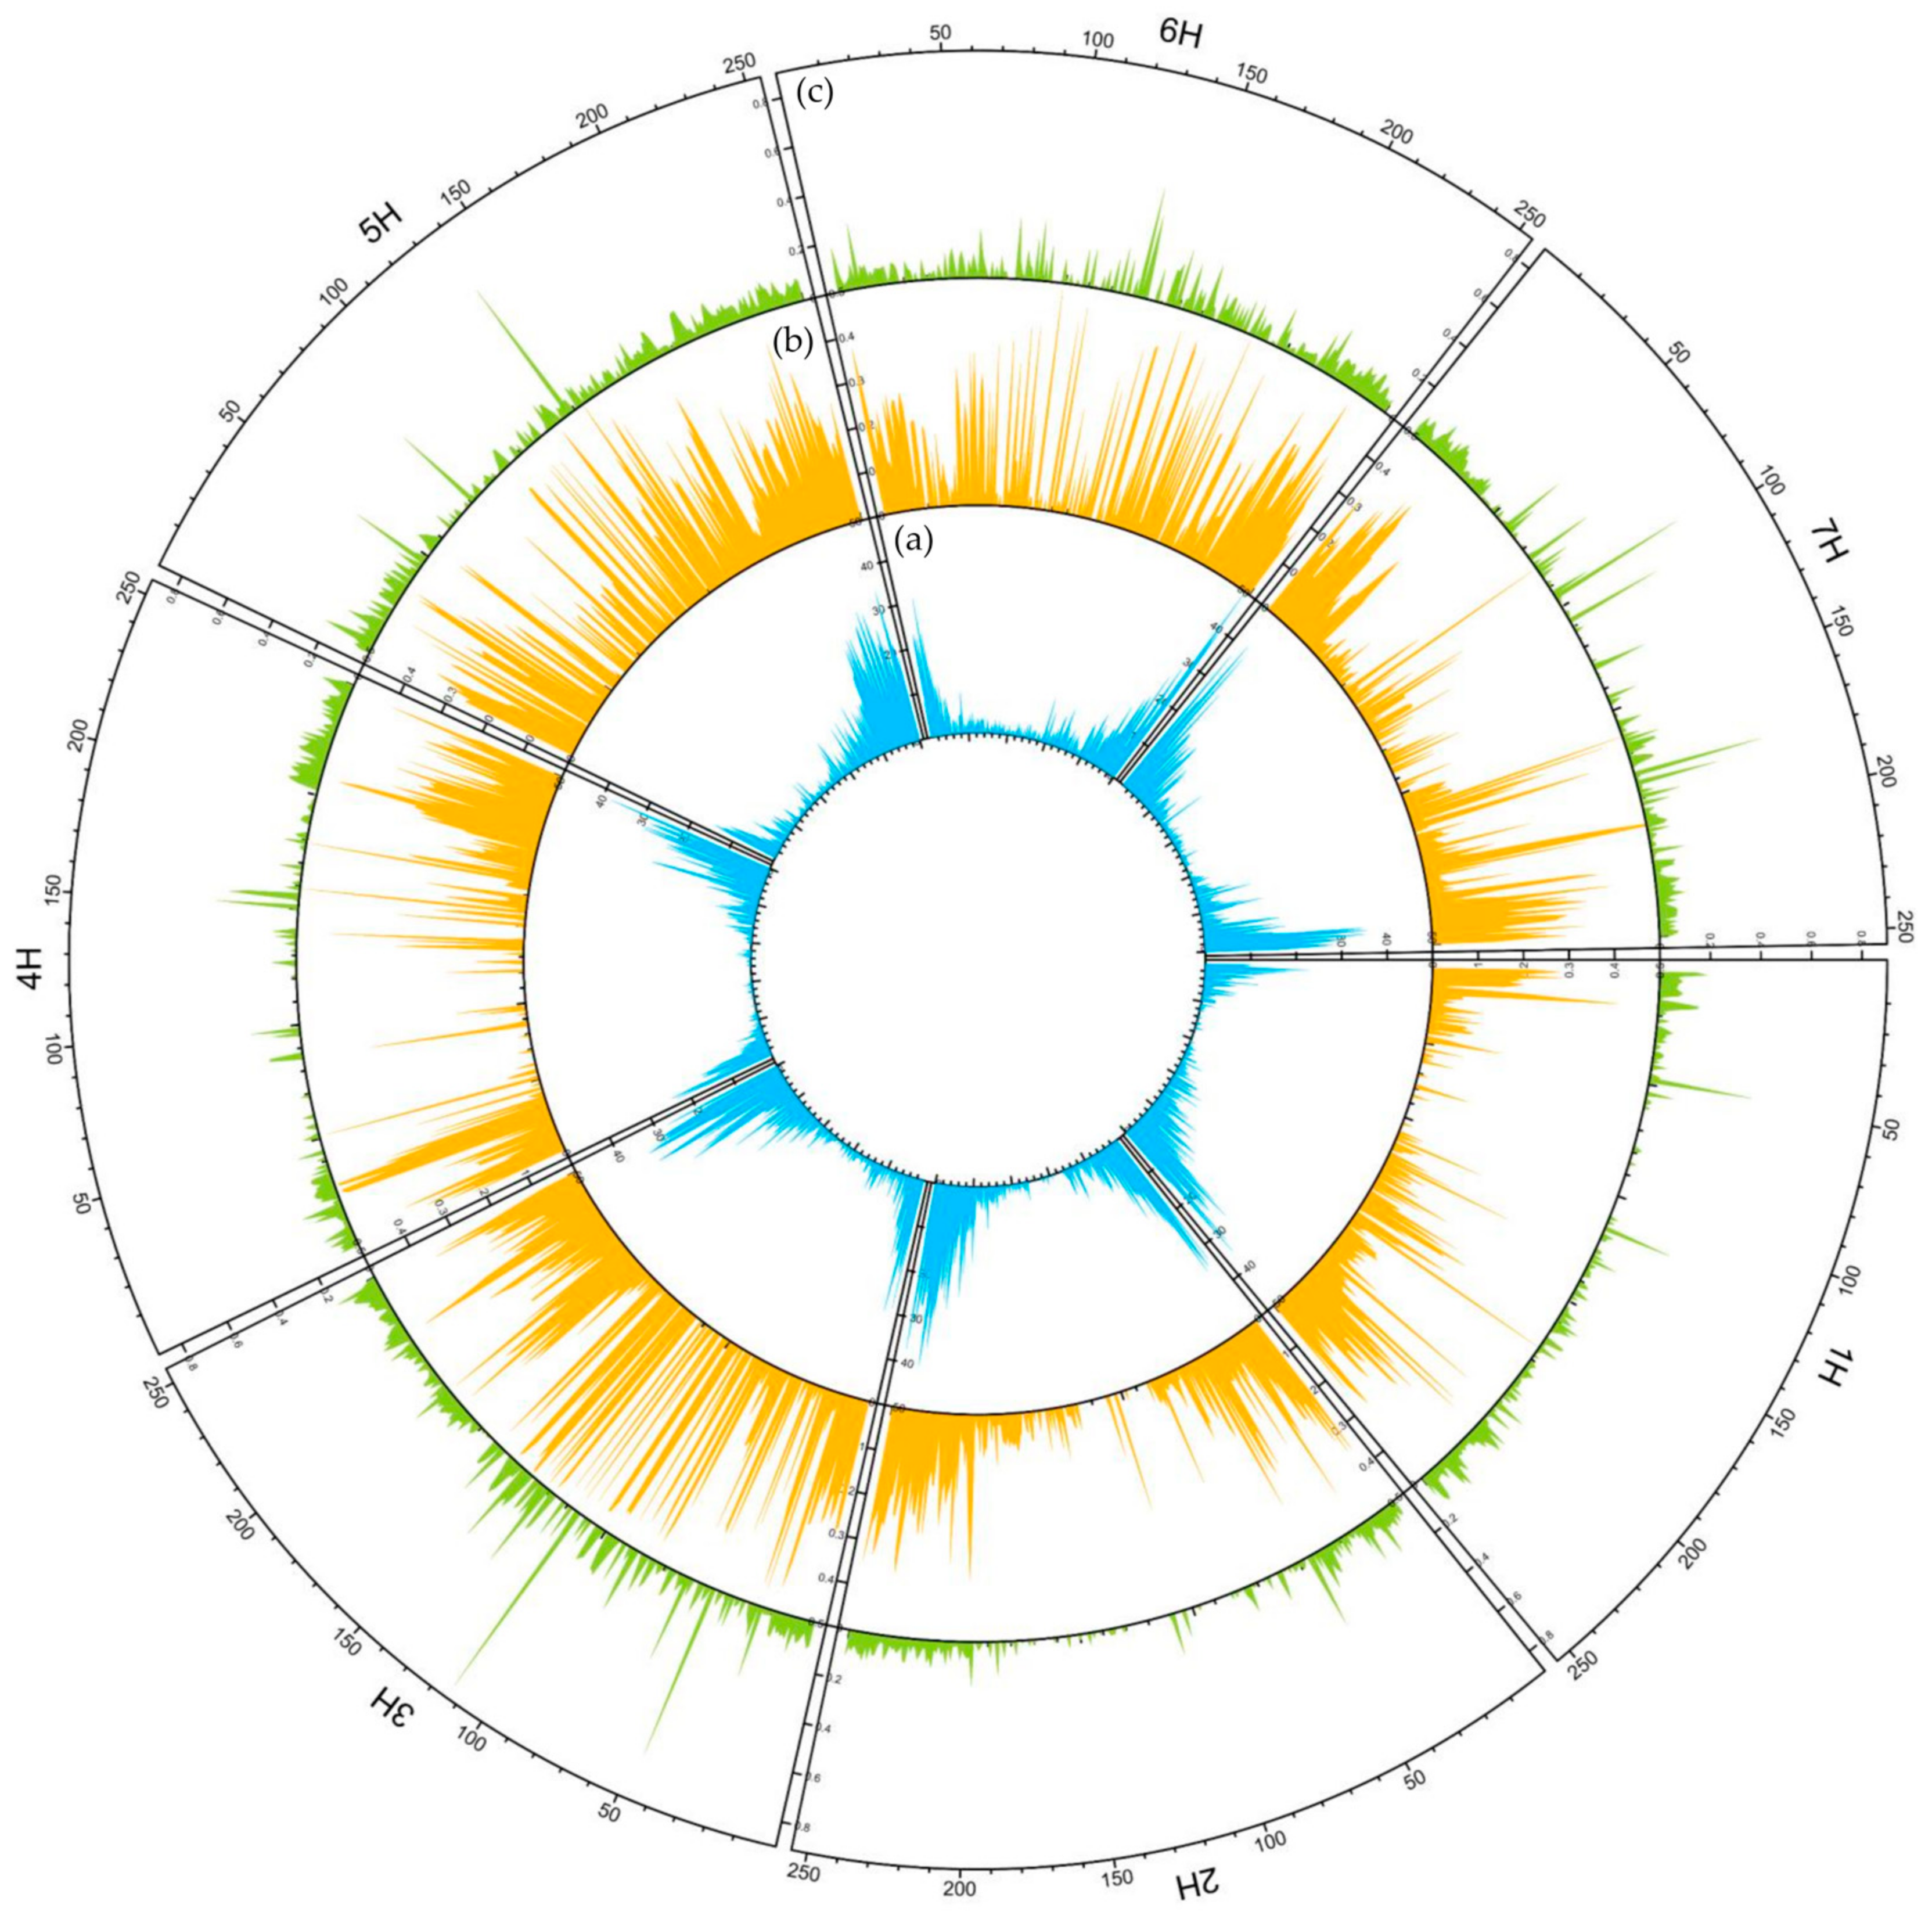
Figure 1. Circular overview of seven H. vulgare chromosomes based on DArTseq data acquired for 83 spring cultivars. (a) DArTseq loci distribution; (b) Average polymorphism information content (PIC) distribution; (c) Average observed heterozygosity (Ho) distribution. A sliding window approach with 500 kb windows, printed for 250 positions along the full length of barley chromosomes based on the genome assembly: IBSC_v2 [21] was applied.
Ijms 23 04553 g001
Figure 2. Summary of polymorphism information content (PIC) values. (a) Range of relative frequencies for all analyzed DArTseq loci in 83 spring barley cultivars; (b) Mean PIC value including chromosomal location of studied DArTseq loci. Letters above the bars in the graph indicate homogeneous groups determined by Tukey’s post hoc test.
Ijms 23 04553 g002
Figure 3. Summary of the diversity coefficient values across barley chromosomes for 83 cultivars based on DArTseq data. Letters above the bars in the graph indicate homogeneous groups determined by Tukey’s post hoc test.
Ijms 23 04553 g003
Figure 4. Summary of the diversity coefficient values for cultivar groups assigned based on the breeding date. Letters above the bars in the graph indicate homogeneous groups determined by Tukey’s post hoc test.
Ijms 23 04553 g004
Figure 5. Summary of the diversity coefficients values for cultivar groups, assigned based on the breeding date considering chromosome localization. Letters above the bars in the graph indicate homogeneous groups determined by Tukey’s post hoc test. (a) observed heterozygosity (uHo); (b) expected heterozygosity (uHe); (c) inbreeding coefficient (F).
Ijms 23 04553 g005
Figure 6. Heterogeneity level of 83 spring barley cultivars expressed by observed heterozygosity value based on SNPs derived from DArTseq analysis.
Ijms 23 04553 g006
Figure 7. Summary of changes in the number of unique alleles during more than 120 years of breeding and cultivation of spring barley in Poland. Colors indicate groups and dashed lines connect compared periods. Above the axis, information about the new breeding objectives is placed.
Ijms 23 04553 g007
Figure 8. Graphical presentation of the Principal Coordinate Analysis results for DArTseq data of 83 spring barley cultivars. Results in the first three coordinates’ system. Each point denotes one tested cultivar. Numbering according to Table 6. Rotable 3D figure can be found in the supplementary materials (Figure S1).
Ijms 23 04553 g008
Figure 9. The results of 100,000 iterations of STRUCTURE software [22] for 83 spring barley cultivars based on DArTseq-derived SNPs data with K values K = 11 based on ad hoc measure ∆K [23,24], where K is the number of ad hoc clusters; each vertical bar represents one cultivar that is marked by order number according to Table 6. The length of the colored segment shows the estimated proportion of membership of each gene pool in the cultivar genetic makeup.
Ijms 23 04553 g009
Figure 10. Proportion of 11 gene pools in five breeding periods of spring barley based on population structure analysis. (a) Cultivars bred before 1945; (b) cultivars bred between 1945 and 1969; (c) cultivars bred between 1970 and 1989; (d) cultivars bred between 1990 and 1999; (e) cultivars bred after 2000.
Ijms 23 04553 g010
Figure 11. Circular overview of seven H. vulgare chromosomes. (a) Transformed FST10 for cultivars bred before 1945 and after 2000; (b) Average polymorphism information content (PIC) distribution in cultivars bred before 1945; (c) Average polymorphism information content (PIC) Distribution in cultivars bred after 2000; (d) Number of unique SNPs in cultivars bred before 1945; (e) Number of unique SNPs in cultivars bred after 2000. A sliding window approach with 500 kb windows, printed for 250 positions along the full length of barley chromosomes based on the genome assembly: IBSC_v2 [21].
Ijms 23 04553 g011
Figure 12. Identity by descent (IBD) based clustering of spring barley cultivars with cutoff at 0.95. Accession numbers according to Table 6.
Ijms 23 04553 g012
Table 1. Summary of DArTseq loci distribution on chromosomes for 83 spring barley cultivars. Chromosome lengths according to barley Morex genome assembly [21].
ChromosomeLength (Mbp)Number of LociMean Distance (Mbp)Percentage of LociPercentage of Homozygous Loci/Chromosome
1H558.5411500.4910%25%
2H768.0816950.4515%32%
3H699.7115410.4513%19%
4H647.0611090.5810%30%
5H670.0315740.4314%15%
6H583.3811580.5010%20%
7H657.2215710.4213%23%
Unknownna1857na16%22%
Table 2. Summary of point mutation abundance at the studied loci by chromosome based on DArTseq analysis of 83 spring barley cultivars.
TotalAbundance on ChromosomesUnknown
1H2H3H4H5H6H7H
Transitions
(Ts)
PurinesA > G1910186263235206278183245314
G > A1752178254211168249193228271
PyrimidinesC > T1754184248252165240169243253
T > C1604160222244145207151237238
Transversion
(Tv)
Purines > PyrimidinesA > C52233707547705670101
A > T2923744243445333243
G > C8901011191079011680125152
G > T5255695654572527268
Pyrimidines > PurinesC > A5334579674472479188
C > G10278917014686118103128187
T > A2912845392348323640
T > G55553867656595964102
% Ts60.2%61.6%58.2%61.1%61.7%61.9%60.1%60.7%57.9%
% Tv39.8%38.4%41.8%38.9%38.3%38.1%39.9%39.3%42.1%
Ts/Tv ratio1.511.601.391.571.611.621.511.541.38
Table 3. Change in the number of unique alleles in consecutive breeding periods considering chromosome allocation. Results based on DArTseq analysis for 83 spring barley cultivars.
Groups
Before 1945 vs. 1945–19691945–1969 vs. 1970–19891970–1989 vs. 1990–19991990–1999 vs. After 2000
Chromosomes1H01321302326
2H3621023242168
3H1218251620333
4H12496224559
5H34330323395954
6H13244203133
7H61888281359
Unknown71724171073554
Table 4. Summary of Jaccard genetic distance analysis for 83 spring barley cultivars based on DArTseq-derived SNPs.
MinimumMaximum
Genetic DistanceCultivarsGenetic DistanceCultivars
Before 19450.162Danubia Ciołkowski–Hanna Borzymowski0.462Cesarski Stieglera–Puławski Browarny
1945–19690.015Jarek–Jarek0.667Kos–Mazowiecki
1970–19890.014Klimek–Klimek0.632Klimek(36)–Polon
1990–19990.021Rambo–Rambo0.649Start–Bryl(59)
after 20000.249Granal–Sezam0.450Atico–Ella
total0.014Klimek–Klimek0.677Mazowiecki–Stratus
The number in parentheses is according to Table 6.
Table 5. List of duplicate accessions verified from passport data and DArTseq analysis results.
No.Accession
Number
Cultivar NamePassport DataGenetic
Distance
Population
Structure
Identity
by Descent
17PL42124Damazyyesyesyesyes
18PL43614Damazy
19PL40940Jarekyesyesyesyes
20PL42363Jarek
28PL41419Arsyesnoyesyes
29PL43646Ars
41PL41418Magono
30PL43423Bielikyesyesyesyes
31PL41415Bielik
32PL43033Demayesnonono
33PL43416Dema
35PL43086Klimekyesyesyesyes
36PL43414Klimek
38PL43032Lotyesnonono
39PL43421Lot
44PL43056Rudzikyesyesyesyes
45PL43423Rudzik
51PL43335Orlikyesyesyesyes
52PL43417Orlik
53PL43368Poloyesnonono
54PL43411Polo
59PL500074Brylyesyesyesyes
60PL43949Bryl
61PL43812Brylnonono
62PL500070Edgaryesyesyesyes
63PL500666Edgar
64PL43419Nagradyesyesyesyes
65PL43379Nagrad
67PL500667Ramboyesyesyesyes
68PL43747Rambo
70PL43369Rodosyesnonono
71PL43412Rodos
Publisher’s Note: MDPI stays neutral with regard to jurisdictional claims in published maps and institutional affiliations.