
RNA Microarray-Based Comparison of Innate Immune Phenotypes between Human THP-1 Macrophages Stimulated with Two BCG Strains

 ,
,
Abstract
:1. Introduction
2. Results
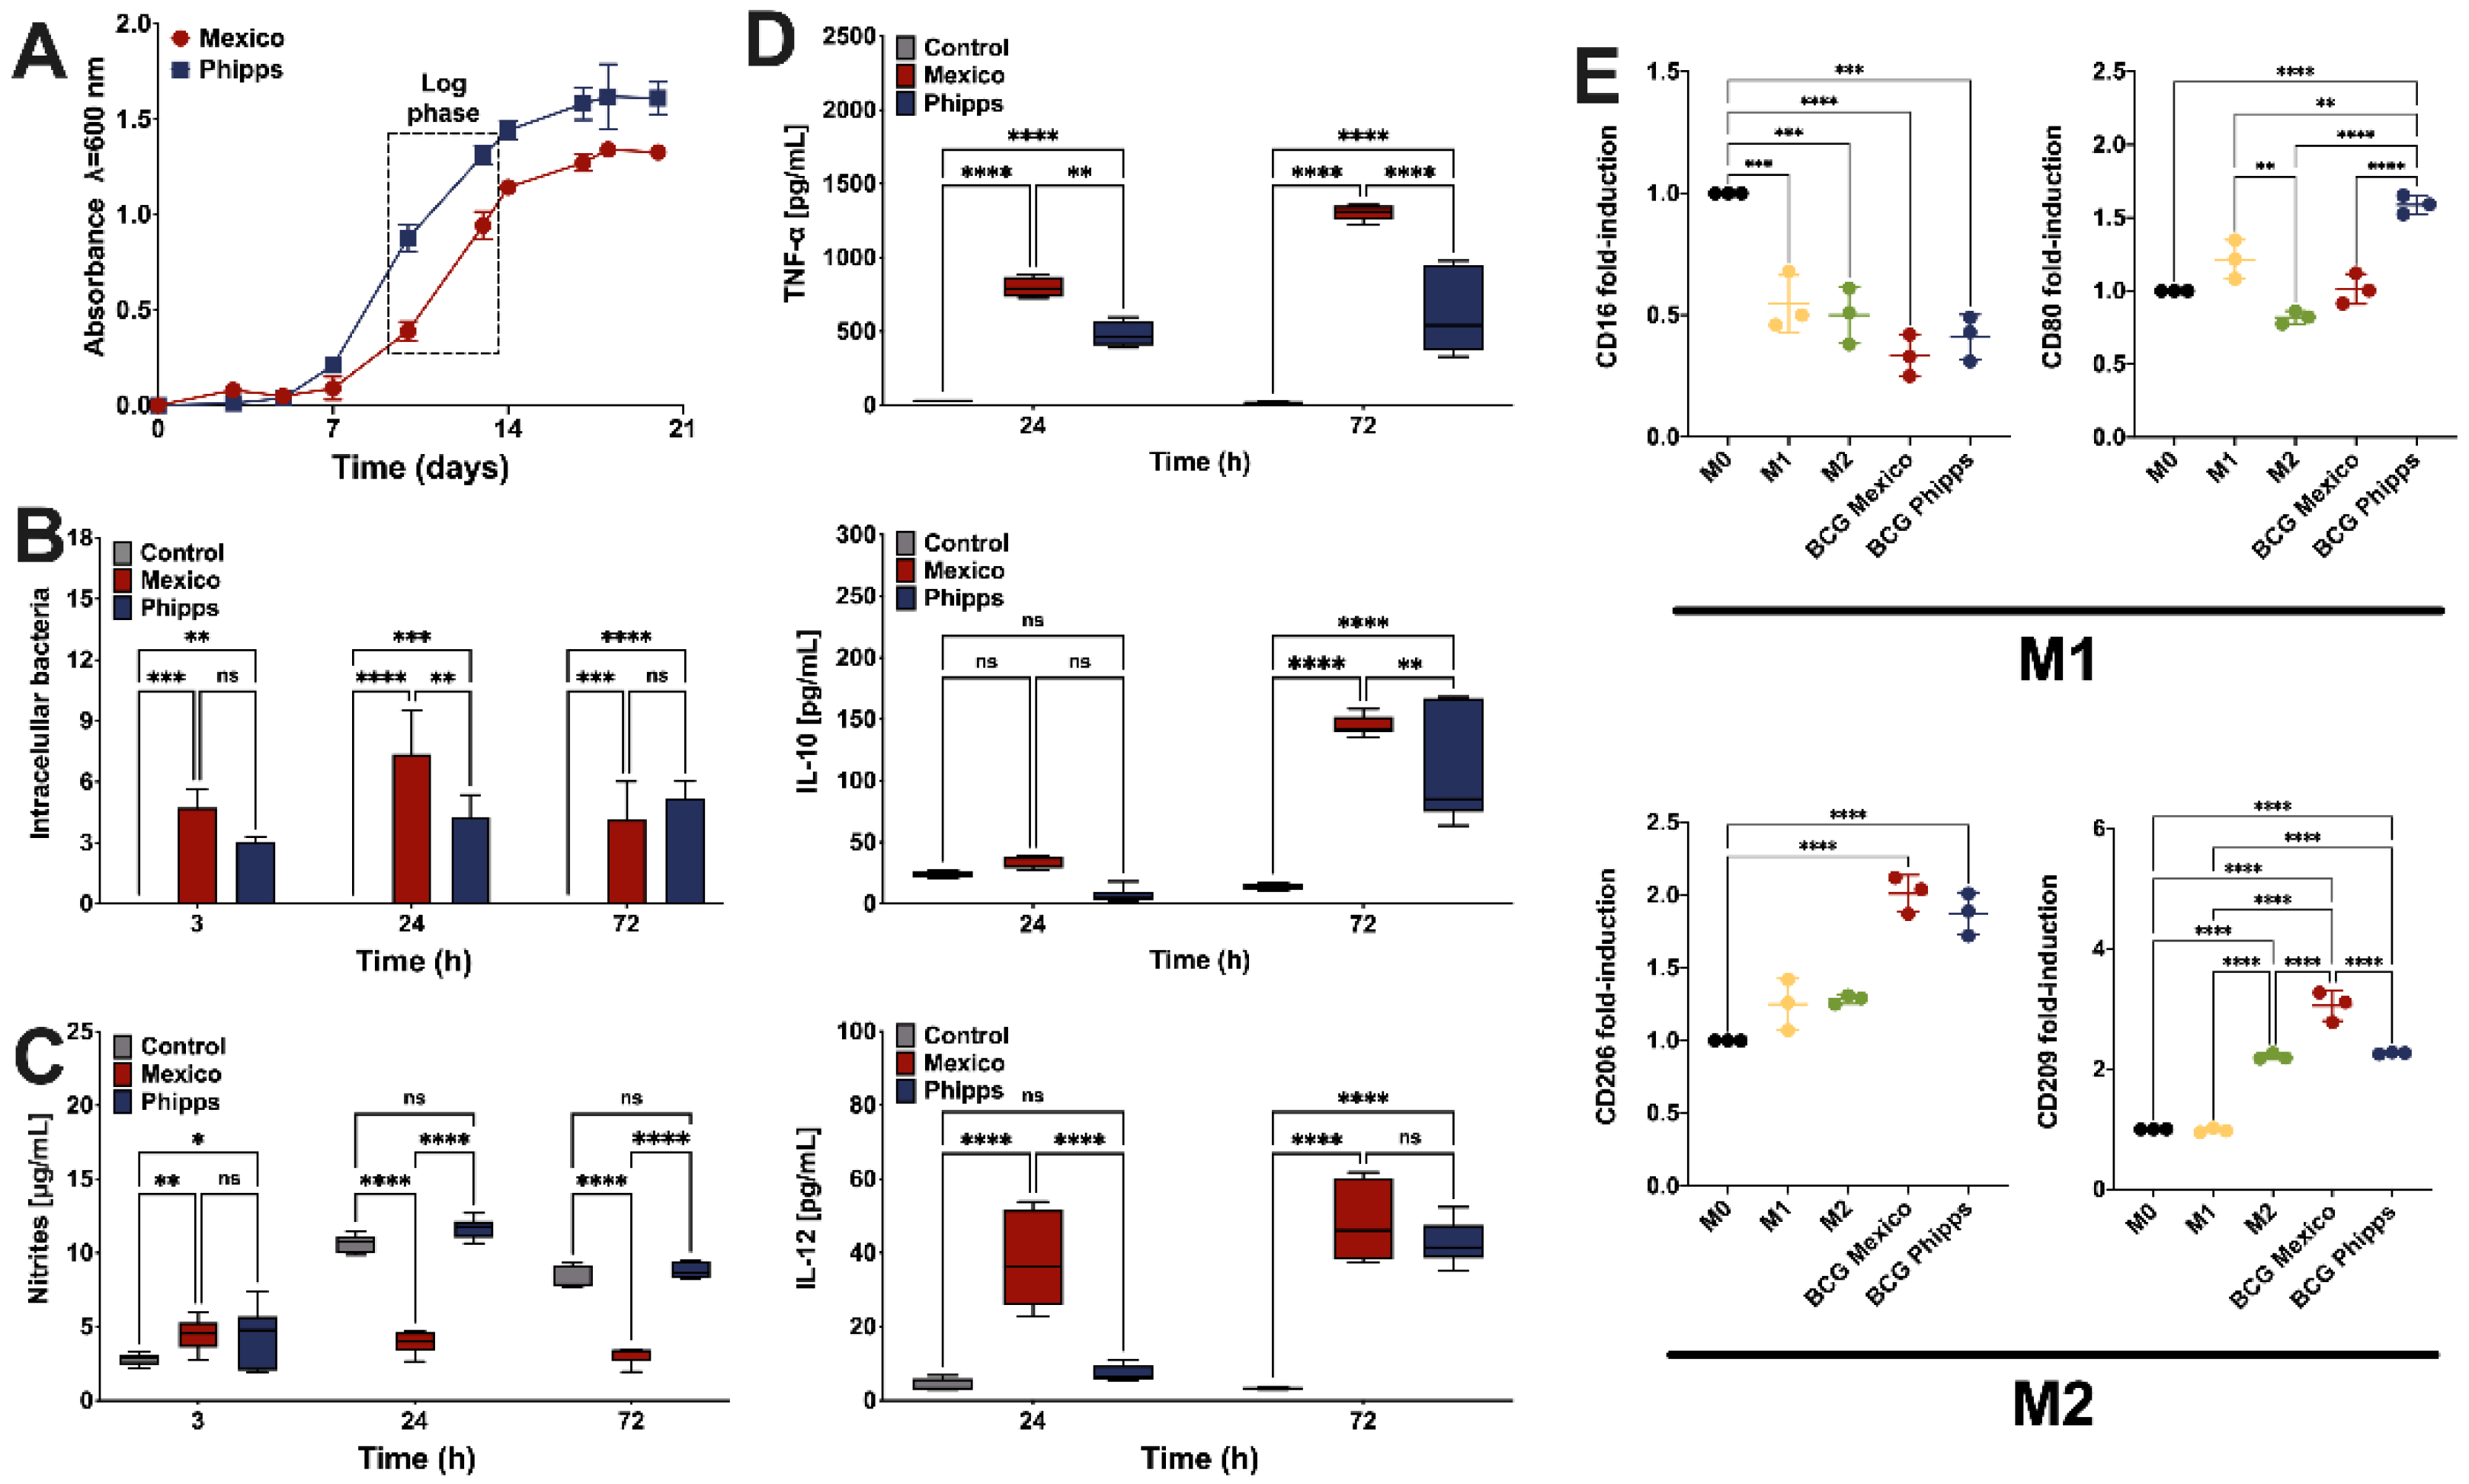
2.1. Characterization of the THP-1 Cells Infected with the BCG Mexico or Phipps Strains
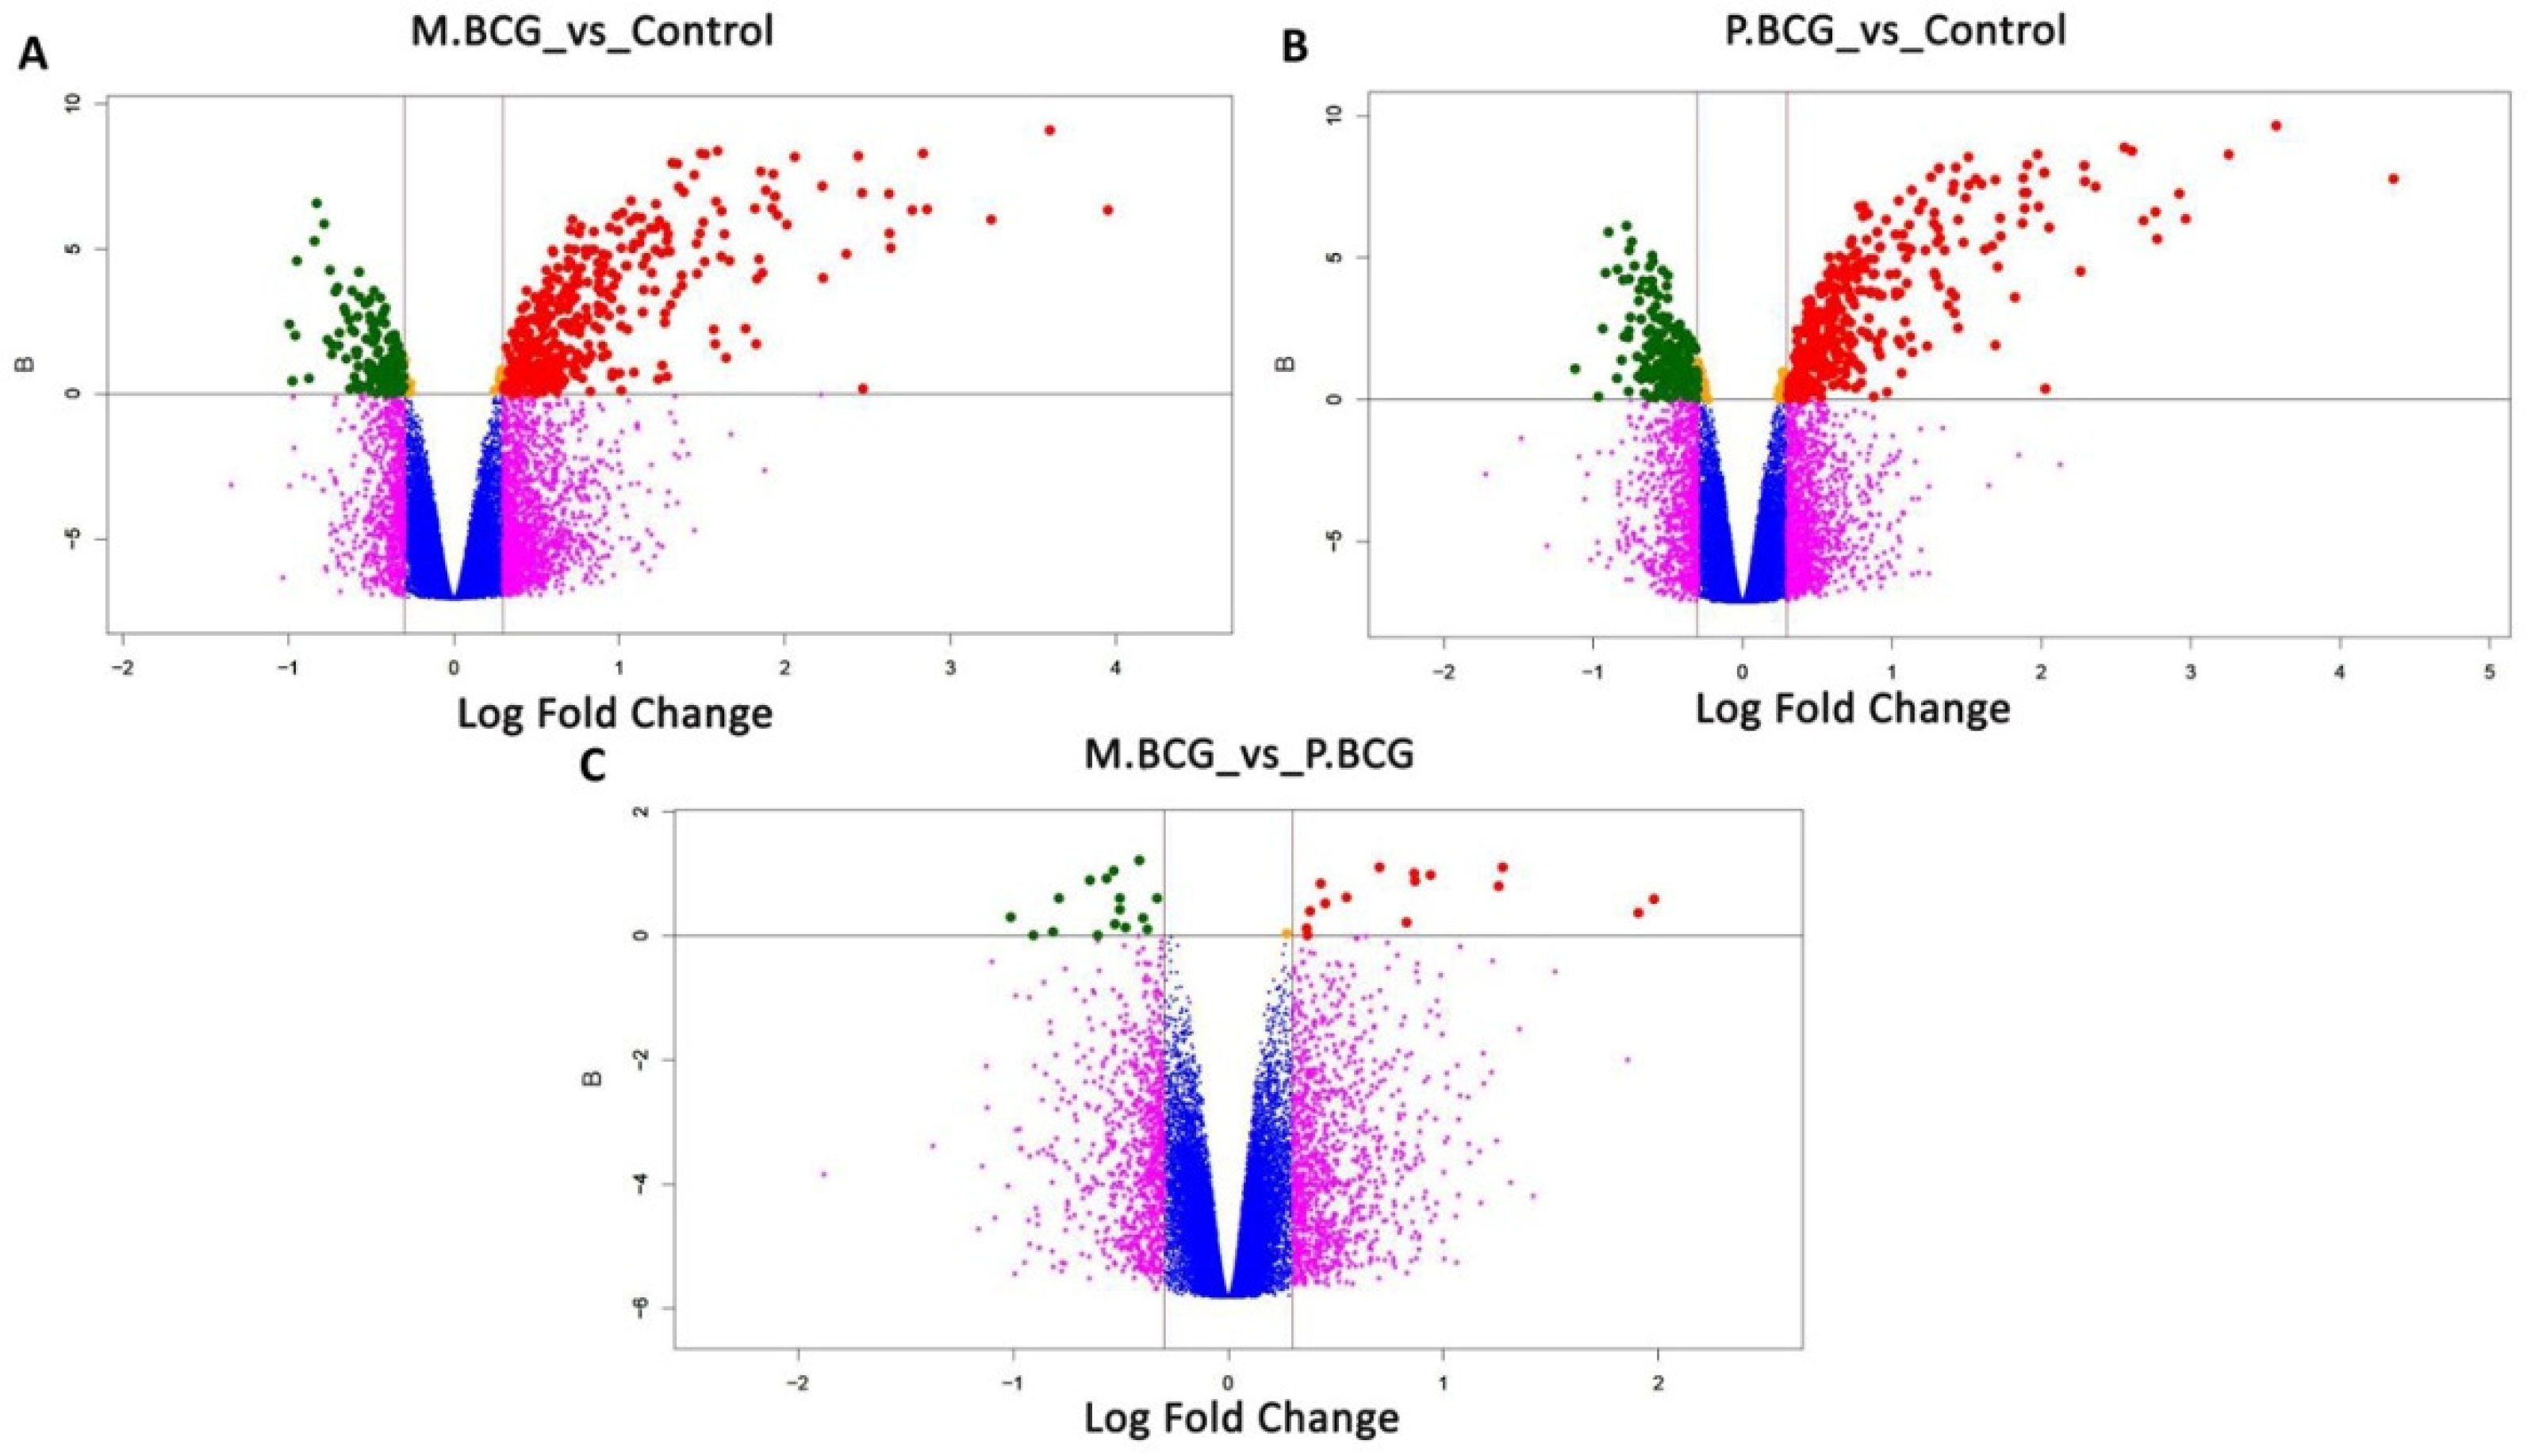
2.2. Gene Expression Differences
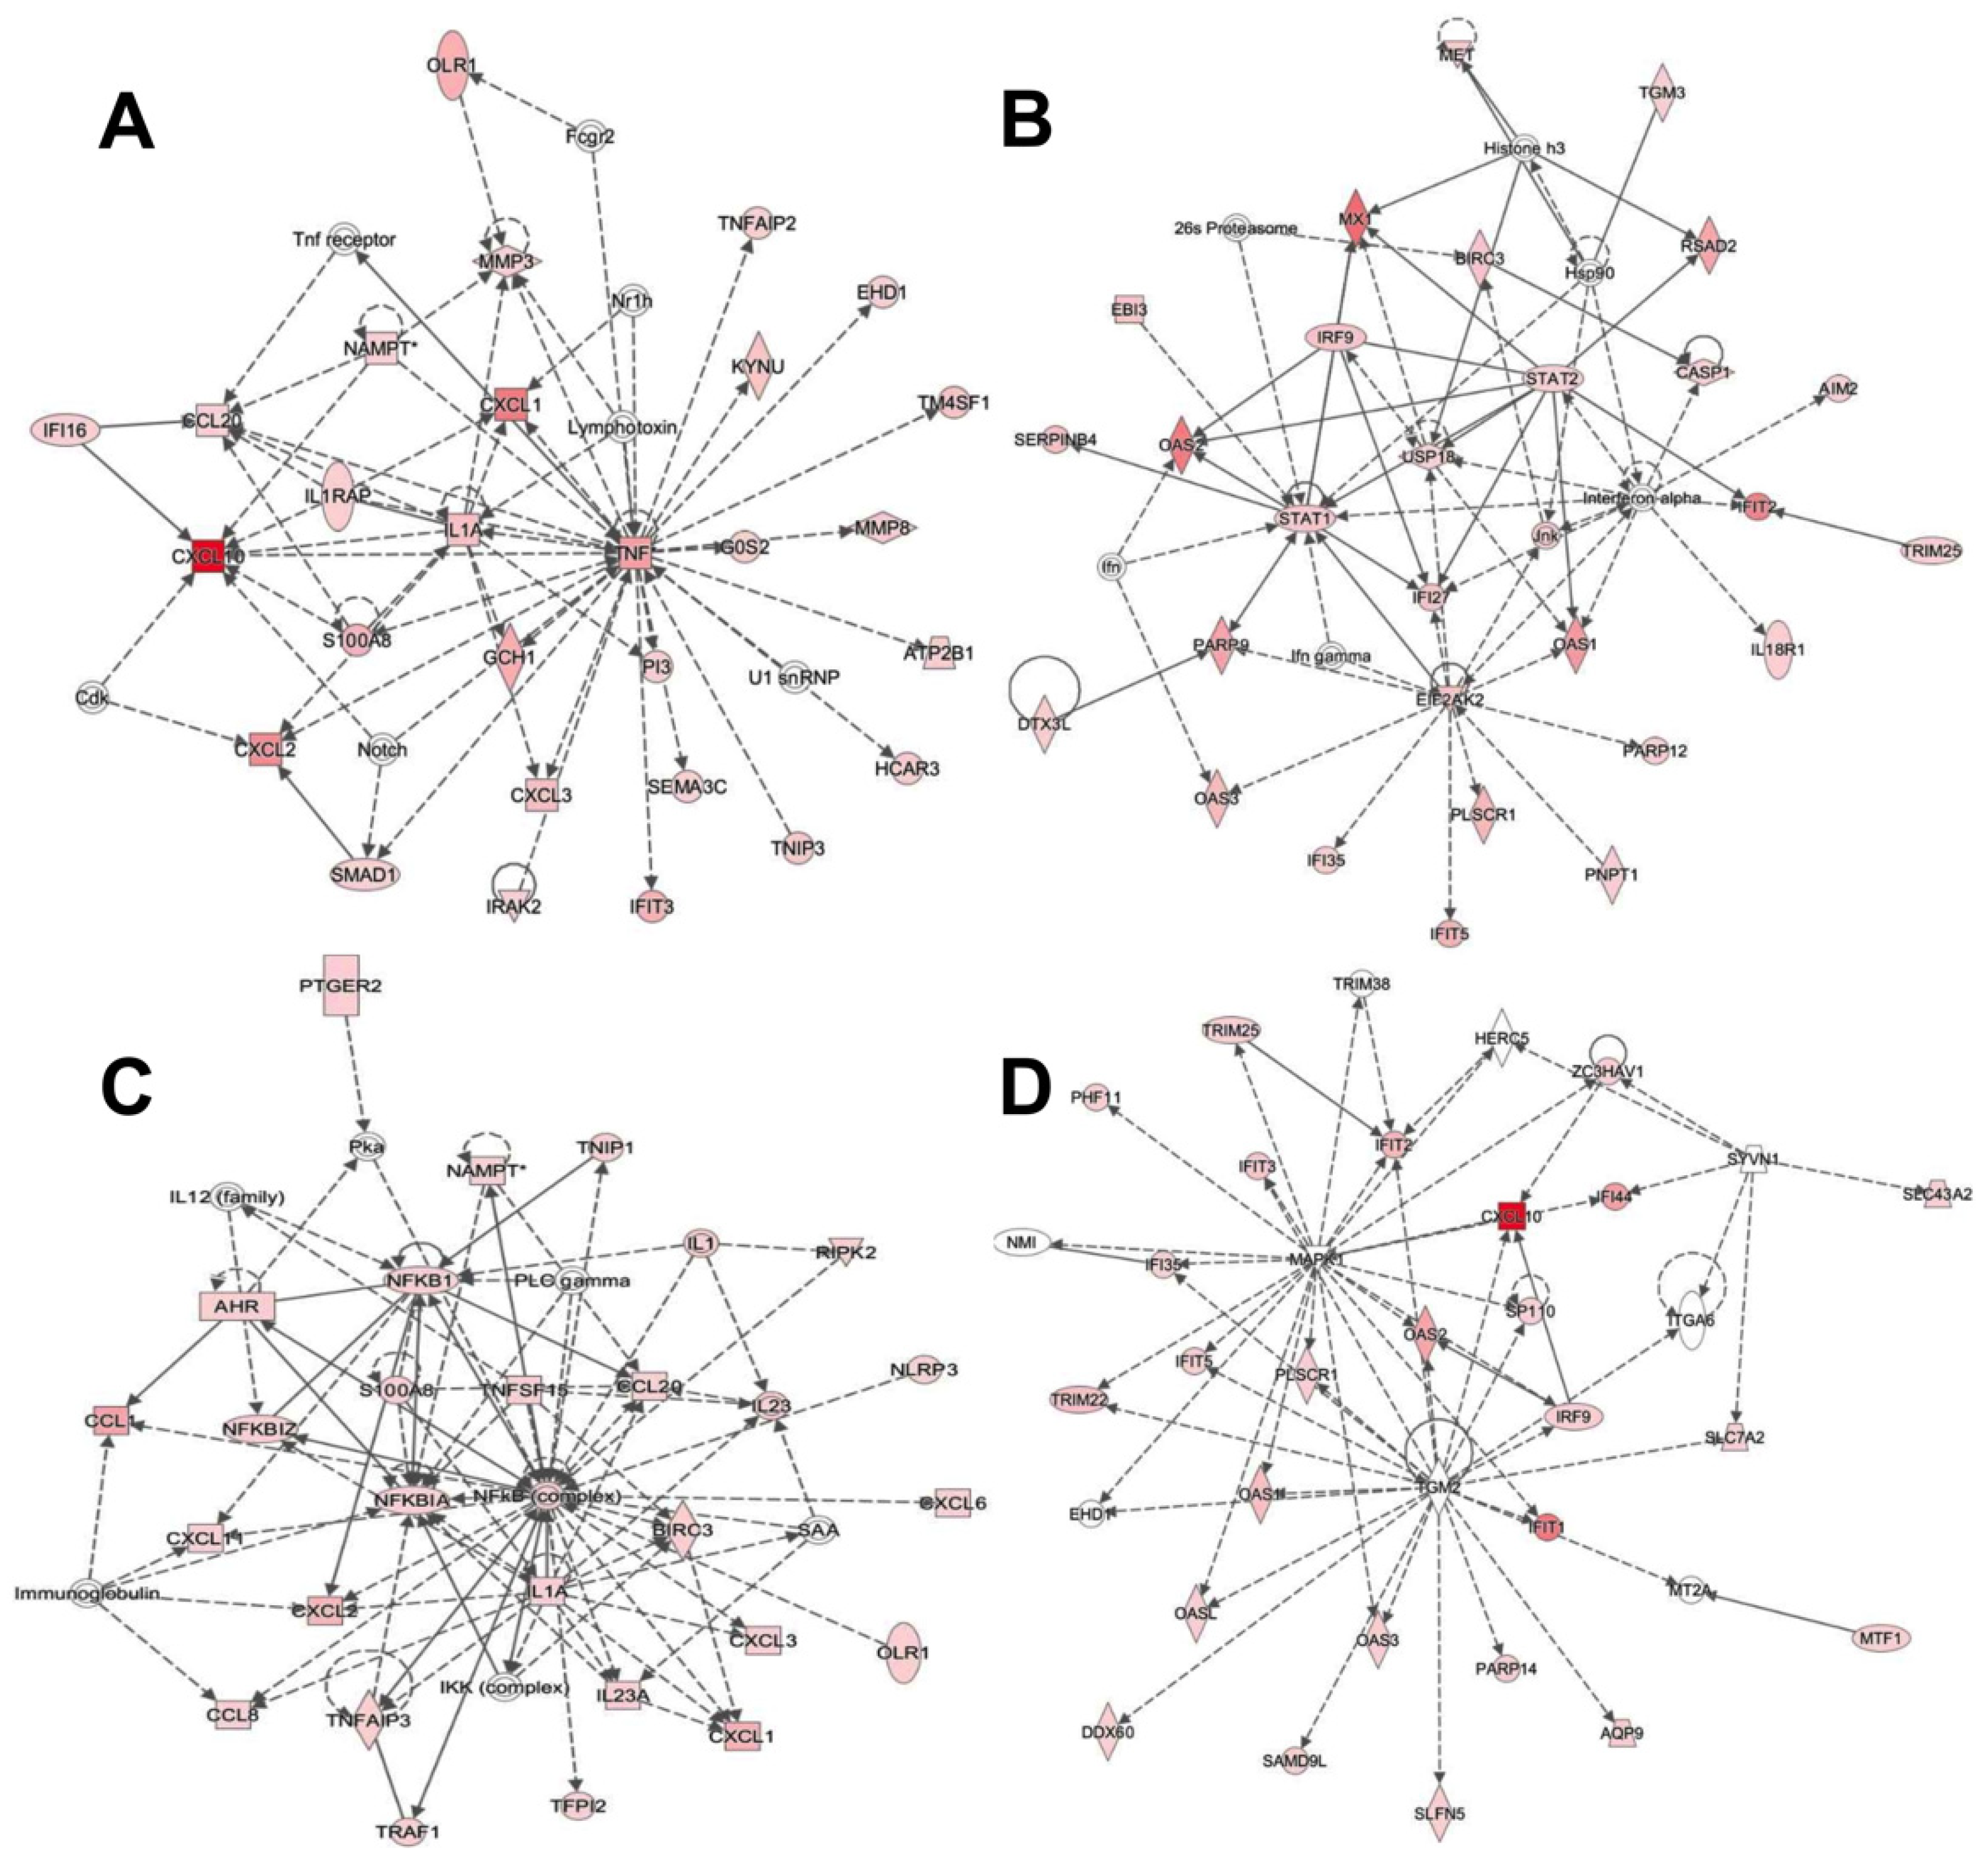
2.3. Proinflammatory Signaling Pathways in THP-1-Derived Macrophages in Response to BCG Mexico and Phipps
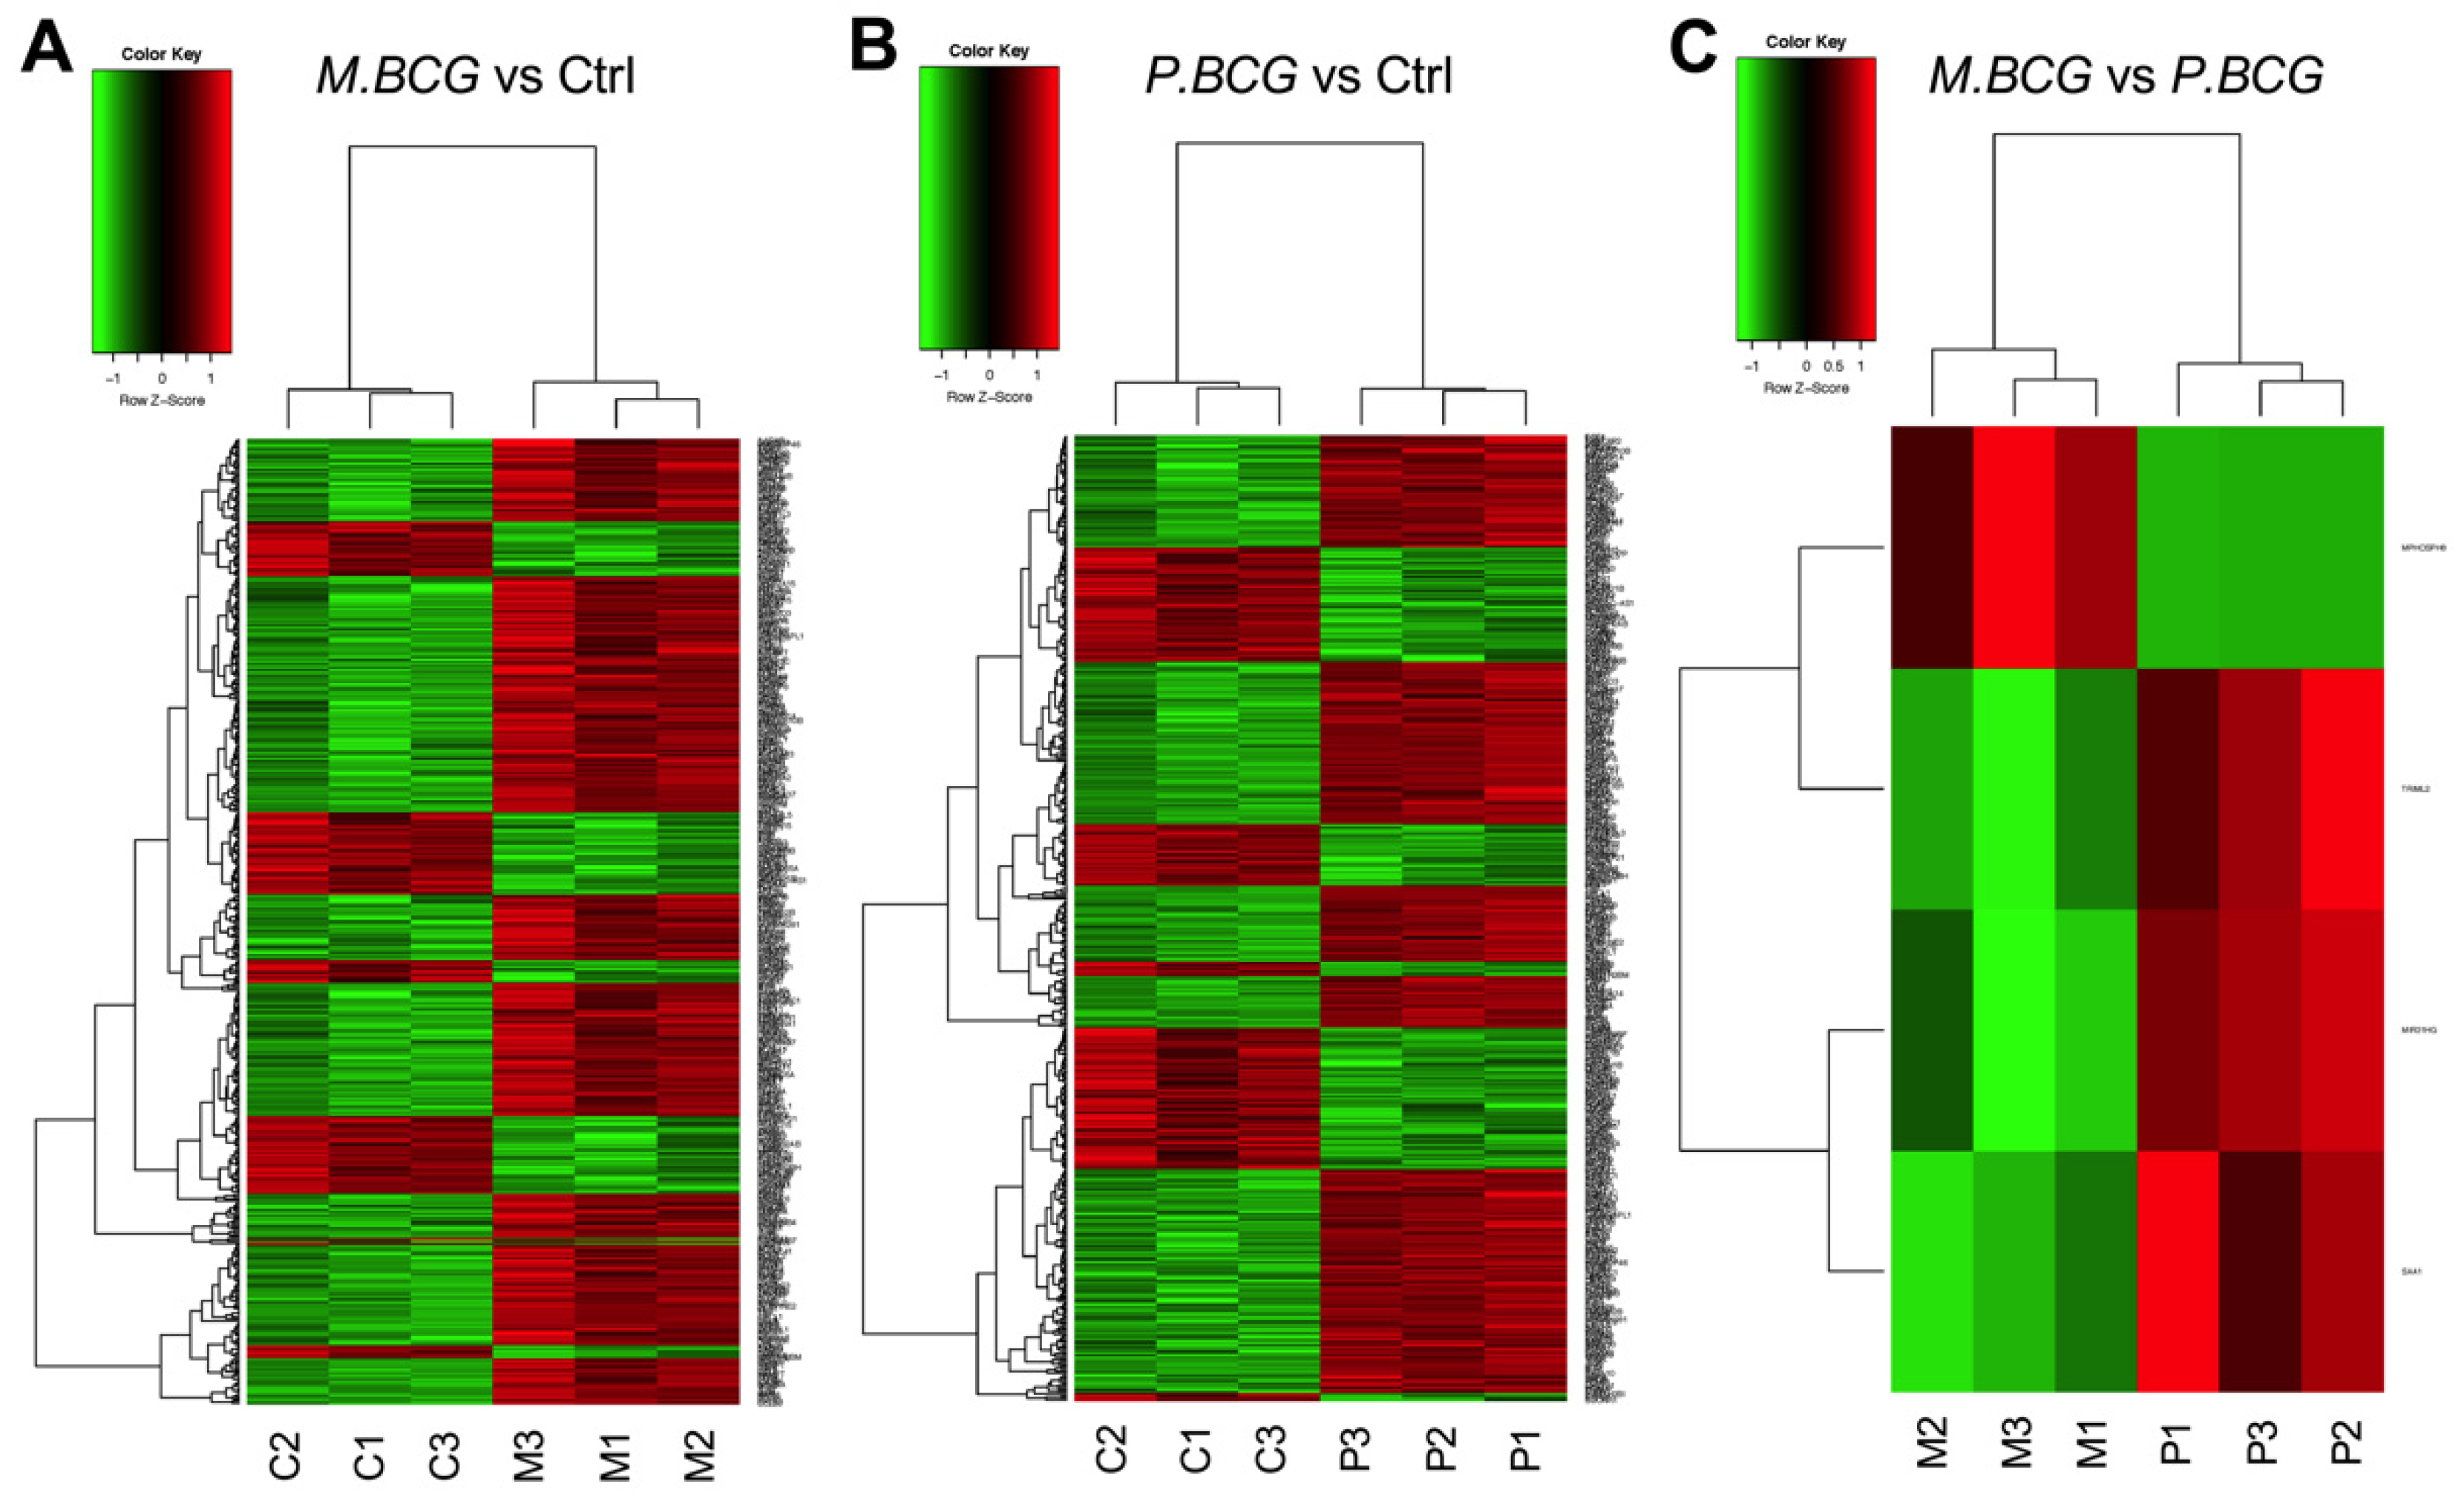
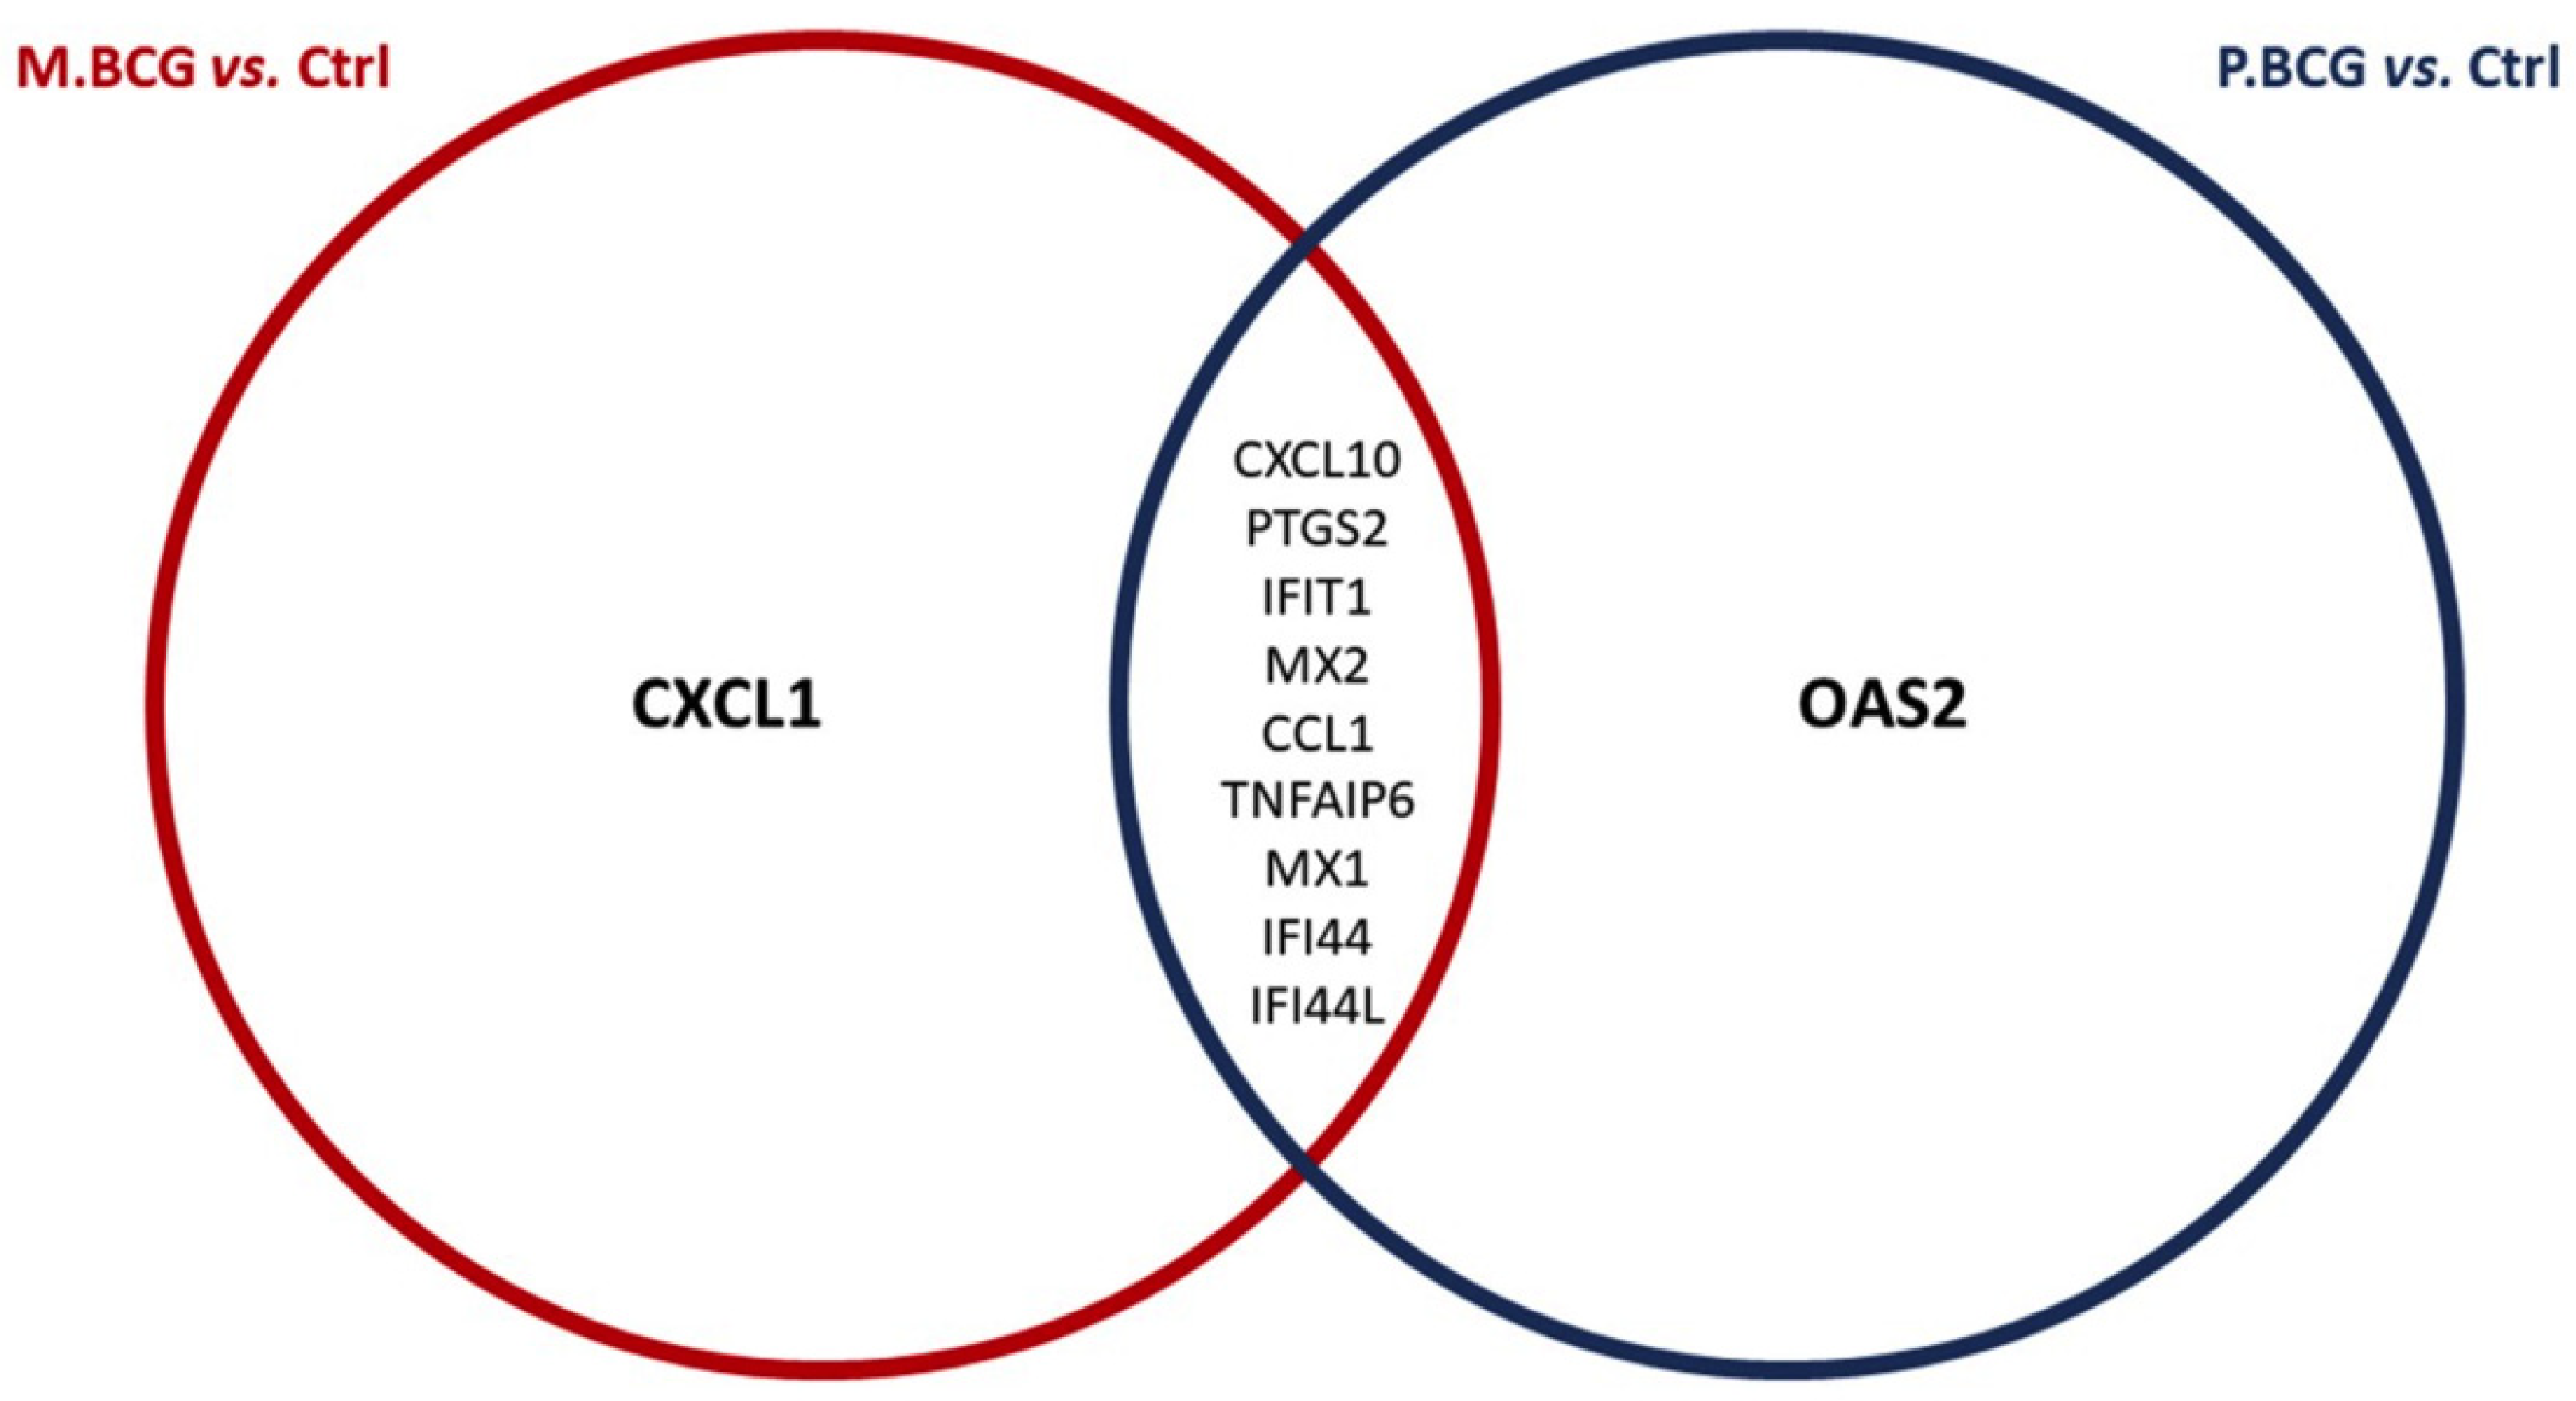
2.4. Analysis of Gene Expression Patterns Compared between BCG Mexico and BCG Phipps
3. Discussion
4. Materials and Methods
4.1. BCG Strains
4.2. Bacterial Growth Curve
4.3. Bacterial Cultures
4.4. Human Cell Line
4.5. Macrophage Infection with the BCG Strains
4.6. Nitrite Quantification
4.7. Cytokine Quantification
4.8. Immunophenotype of the Infected Macrophages
4.9. RNA Isolation from Macrophages, Evaluation of RNA Integrity, and Microarray Assay
4.10. Microarray Gene Expression Analysis
4.11. Statistical Analysis
Supplementary Materials
Author Contributions
Funding
Institutional Review Board Statement
Informed Consent Statement
Data Availability Statement
Acknowledgments
Conflicts of Interest
References
- Floyd, K.; Glaziou, P.; Zumla, A.; Raviglione, M. The global tuberculosis epidemic and progress in care, prevention, and research: An overview in year 3 of the End TB era. Lancet Respir. Med. 2018, 6, 299–314. [Google Scholar] [CrossRef]
- World Health Organization. Global Tuberculosis Report 2020; World Health Organization: Geneva, Switzerland, 2020. [Google Scholar]
- Fine, P.E.; Small, P.M. Exogenous reinfection in tuberculosis. N. Engl. J. Med. 1999, 341, 1226–1227. [Google Scholar] [CrossRef] [PubMed]
- Cardona, P.J. Reactivation or reinfection in adult tuberculosis: Is that the question? Int. J. Mycobacteriol. 2016, 5, 400–407. [Google Scholar] [CrossRef] [PubMed] [Green Version]
- Schrager, L.K.; Harris, R.C.; Vekemans, J. Research and development of new tuberculosis vaccines: A review. F1000Research 2018, 7, 1732. [Google Scholar] [CrossRef] [PubMed]
- Nieuwenhuizen, N.E.; Kulkarni, P.S.; Shaligram, U.; Cotton, M.F.; Rentsch, C.A.; Eisele, B.; Grode, L.; Kaufmann, S.H.E. The Recombinant Bacille Calmette-Guerin Vaccine VPM1002: Ready for Clinical Efficacy Testing. Front. Immunol. 2017, 8, 1147. [Google Scholar] [CrossRef]
- Queval, C.J.; Brosch, R.; Simeone, R. The Macrophage: A Disputed Fortress in the Battle against Mycobacterium tuberculosis. Front. Microbiol. 2017, 23, 2284. [Google Scholar] [CrossRef]
- Hsu, T.; Hingley-Wilson, S.M.; Chen, B.; Chen, M.; Dai, A.Z.; Morin, P.M.; Marks, C.B.; Padiyar, J.; Goulding, C.; Gingery, M.; et al. The primary mechanism of attenuation of bacillus Calmette–Guérin is a loss of secreted lytic function required for invasion of lung interstitial tissue. Proc. Natl. Acad. Sci. USA 2003, 100, 12420–12425. [Google Scholar] [CrossRef] [Green Version]
- Tran, V.; Ahn, S.K.; Ng, M.; Li, M.; Liu, J. Loss of Lipid Virulence Factors Reduces the Efficacy of the BCG Vaccine. Sci. Rep. 2016, 6, 29076. [Google Scholar] [CrossRef] [Green Version]
- Abubakar, I.; Pimpin, L.; Ariti, C.; Beynon, R.; Mangtani, P.; Sterne, J.A.; Fine, P.E.; Smith, P.G.; Lipman, M.; Elliman, D.; et al. Systematic review and meta-analysis of the current evidence on the duration of protection by bacillus Calmette-Guerin vaccination against tuberculosis. Health Technol. Assess. 2013, 17, 1–372, v–vi. [Google Scholar] [CrossRef]
- Brosch, R.; Gordon, S.V.; Garnier, T.; Eiglmeier, K.; Frigui, W.; Valenti, P.; Dos Santos, S.; Duthoy, S.; Lacroix, C.; Garcia-Pelayo, C.; et al. Genome plasticity of BCG and impact on vaccine efficacy. Proc. Natl. Acad. Sci. USA 2007, 104, 5596–5601. [Google Scholar] [CrossRef] [Green Version]
- Moliva, J.I.; Turner, J.; Torrelles, J.B. Prospects in Mycobacterium bovis Bacille Calmette et Guerin (BCG) vaccine diversity and delivery: Why does BCG fail to protect against tuberculosis? Vaccine 2015, 33, 5035–5041. [Google Scholar] [CrossRef] [PubMed] [Green Version]
- Hoheisel, J.D. Microarray technology: Beyond transcript profiling and genotype analysis. Nat. Rev. Genet. 2006, 7, 200–210. [Google Scholar] [CrossRef] [PubMed]
- Miller, M.B.; Tang, Y.-W. Basic Concepts of Microarrays and Potential Applications in Clinical Microbiology. Clin. Microbiol. Rev. 2009, 22, 611–633. [Google Scholar] [CrossRef] [PubMed] [Green Version]
- Ragno, S.; Romano, M.; Howell, S.; Pappin, D.J.; Jenner, P.J.; Colston, M.J. Changes in gene expression in macrophages infected with Mycobacterium tuberculosis: A combined transcriptomic and proteomic approach. Immunology 2001, 104, 99–108. [Google Scholar] [CrossRef] [PubMed] [Green Version]
- Galvan-Pena, S.; O’Neill, L.A. Metabolic reprograming in macrophage polarization. Front. Immunol. 2014, 5, 420. [Google Scholar]
- Mortaz, E.; Adcock, I.M.; Tabarsi, P.; Masjedi, M.R.; Mansouri, D.; Velayati, A.A.; Casanova, J.L.; Barnes, P.J. Interaction of Pattern Recognition Receptors with Mycobacterium Tuberculosis. J. Clin. Immunol. 2015, 35, 1–10. [Google Scholar] [CrossRef] [Green Version]
- Vajjhala, P.R.; Ve, T.; Bentham, A.; Stacey, K.J.; Kobe, B. The molecular mechanisms of signaling by cooperative assembly formation in innate immunity pathways. Mol. Immunol. 2017, 86, 23–37. [Google Scholar] [CrossRef]
- Castillo-Rodal, A.I.; Castanon-Arreola, M.; Hernandez-Pando, R.; Calva, J.J.; Sada-Diaz, E.; Lopez-Vidal, Y. Mycobacterium bovis BCG substrains confer different levels of protection against Mycobacterium tuberculosis infection in a BALB/c model of progressive pulmonary tuberculosis. Infect. Immun. 2006, 74, 1718–1724. [Google Scholar] [CrossRef] [Green Version]
- Chanput, W.; Mes, J.J.; Wichers, H.J. THP-1 cell line: An in vitro cell model for immune modulation approach. Int. Immunopharmacol. 2014, 23, 37–45. [Google Scholar] [CrossRef]
- Medley, J.; Goff, A.; Bettencourt, P.J.G.; Dare, M.; Cole, L.; Cantillon, D.; Waddell, S.J. Dissecting the Mycobacterium bovis BCG Response to Macrophage Infection to Help Prioritize Targets for Anti-Tuberculosis Drug and Vaccine Discovery. Vaccines 2022, 10, 113. [Google Scholar] [CrossRef]
- Rivera-Marrero, C.A.; Stewart, J.; Shafer, W.M.; Roman, J. The down-regulation of cathepsin G in THP-1 monocytes after infection with Mycobacterium tuberculosis is associated with increased intracellular survival of bacilli. Infect. Immun. 2004, 72, 5712–5721. [Google Scholar] [CrossRef] [PubMed] [Green Version]
- Hayashi, D.; Takii, T.; Fujiwara, N.; Fujita, Y.; Yano, I.; Yamamoto, S.; Kondo, M.; Yasuda, E.; Inagaki, E.; Kanai, K.; et al. Comparable studies of immunostimulating activities in vitro among Mycobacterium bovis bacillus Calmette-Guerin (BCG) substrains. FEMS Immunol. Med. Microbiol. 2009, 56, 116–128. [Google Scholar] [CrossRef] [PubMed] [Green Version]
- Uenishi, Y.; Takii, T.; Yano, I.; Sunagawa, M. Separation and molecular characterization of mycolic acid from the cell wall skeleton of Mycobacterium bovis BCG Tokyo 172 (SMP-105) and BCG substrains by normal-phase high performance liquid chromatography and liquid chromatography/mass spectrometry. J. Microbiol. Methods 2009, 77, 320–322. [Google Scholar] [CrossRef] [PubMed]
- Miyauchi, M.; Murata, M.; Shibuya, K.; Koga-Yamakawa, E.; Uenishi, Y.; Kusunose, N.; Sunagawa, M.; Yano, I.; Kashiwazaki, Y. Arabino-mycolates derived from cell-wall skeleton of Mycobacterium bovis BCG as a prominent structure for recognition by host immunity. Drug Discov. Ther. 2011, 5, 130–135. [Google Scholar] [CrossRef]
- Ishikawa, E.; Mori, D.; Yamasaki, S. Recognition of Mycobacterial Lipids by Immune Receptors. Trends Immunol. 2017, 38, 66–76. [Google Scholar] [CrossRef]
- Back, Y.W.; Choi, S.; Choi, H.G.; Shin, K.W.; Son, Y.J.; Paik, T.H.; Kim, H.J. Cell wall skeleton of Mycobacterium bovis BCG enhances the vaccine potential of antigen 85B against tuberculosis by inducing Th1 and Th17 responses. PLoS ONE 2019, 14, e0213536. [Google Scholar] [CrossRef] [Green Version]
- Jin, Z.; Tian, Y.; Yan, D.; Li, D.; Zhu, X. BCG Increased Membrane Expression of TRIM59 through the TLR2/ TLR4/IRF5 Pathway in RAW264.7 Macrophages. Protein Pept. Lett. 2017, 24, 765–770. [Google Scholar] [CrossRef]
- Meyers, P.R.; Bourn, W.R.; Steyn, L.M.; van Helden, P.D.; Beyers, A.D.; Brown, G.D. Novel method for rapid measurement of growth of mycobacteria in detergent-free media. J. Clin. Microbiol. 1998, 36, 2752–2754. [Google Scholar] [CrossRef] [Green Version]
- Pascoe, J.; Hendon-Dunn, C.L.; Birch, C.P.D.; Williams, G.A.; Chambers, M.A.; Bacon, J. Optimisation of Mycobacterium bovis BCG Fermentation and Storage Survival. Pharmaceutics 2020, 12, 900. [Google Scholar] [CrossRef]
- Orduna, P.; Cevallos, M.A.; de Leon, S.P.; Arvizu, A.; Hernandez-Gonzalez, I.L.; Mendoza-Hernandez, G.; Lopez-Vidal, Y. Genomic and proteomic analyses of Mycobacterium bovis BCG Mexico 1931 reveal a diverse immunogenic repertoire against tuberculosis infection. BMC Genom. 2011, 12, 493. [Google Scholar] [CrossRef] [Green Version]
- Matsumoto, H.; Suzuki, K.; Tsuyuguchi, K.; Tanaka, E.; Amitani, R.; Maeda, A.; Yamamoto, K.; Sasada, M.; Kuze, F. Interleukin-12 gene expression in human monocyte-derived macrophages stimulated with Mycobacterium bovis BCG: Cytokine regulation and effect of NK cells. Infect. Immun. 1997, 65, 4405–4410. [Google Scholar] [CrossRef] [PubMed] [Green Version]
- Rienksma, R.A.; Suarez-Diez, M.; Mollenkopf, H.J.; Dolganov, G.M.; Dorhoi, A.; Schoolnik, G.K.; Martins Dos Santos, V.A.; Kaufmann, S.H.; Schaap, P.J.; Gengenbacher, M. Comprehensive insights into transcriptional adaptation of intracellular mycobacteria by microbe-enriched dual RNA sequencing. BMC Genom. 2015, 16, 34. [Google Scholar] [CrossRef] [PubMed] [Green Version]
- Liu, Z.; Zhou, G.; Deng, X.; Yu, Q.; Hu, Y.; Sun, H.; Wang, Z.; Chen, H.; Jia, C.; Wang, D. Analysis of miRNA expression profiling in human macrophages responding to Mycobacterium infection: Induction of the immune regulator miR-146a. J. Infect. 2014, 68, 553–561. [Google Scholar] [CrossRef] [PubMed]
- Rusca, N.; Monticelli, S. MiR-146a in Immunity and Disease. Mol. Biol. Int. 2011, 2011, 437301. [Google Scholar] [CrossRef] [Green Version]
- Ariel, O.; Gendron, D.; Dudemaine, P.L.; Gevry, N.; Ibeagha-Awemu, E.M.; Bissonnette, N. Transcriptome Profiling of Bovine Macrophages Infected by Mycobacterium avium spp. paratuberculosis Depicts Foam Cell and Innate Immune Tolerance Phenotypes. Front. Immunol. 2019, 10, 2874. [Google Scholar]
- Toka, F.N.; Dunaway, K.; Smaltz, F.; Szulc-Dabrowska, L.; Drnevich, J.; Mielcarska, M.B.; Bossowska-Nowicka, M.; Schweizer, M. Bacterial and viral pathogen-associated molecular patterns induce divergent early transcriptomic landscapes in a bovine macrophage cell line. BMC Genom. 2019, 20, 15. [Google Scholar] [CrossRef]
- Boro, M.; Balaji, K.N. CXCL1 and CXCL2 Regulate NLRP3 Inflammasome Activation via G-Protein-Coupled Receptor CXCR2. J. Immunol. 2017, 199, 1660–1671. [Google Scholar] [CrossRef]
- Leisching, G.; Wiid, I.; Baker, B. The Association of OASL and Type I Interferons in the Pathogenesis and Survival of Intracellular Replicating Bacterial Species. Front. Cell. Infect. Microbiol. 2017, 7, 196. [Google Scholar] [CrossRef] [Green Version]
- Leisching, G.; Cole, V.; Ali, A.T.; Baker, B. OAS1, OAS2 and OAS3 restrict intracellular M. tb replication and enhance cytokine secretion. Int. J. Infect. Dis. 2019, 80S, S77–S84. [Google Scholar] [CrossRef] [Green Version]
- Li, Q.; Zhang, H.; Yu, L.; Wu, C.; Luo, X.; Sun, H.; Ding, J. Down-regulation of Notch signaling pathway reverses the Th1/Th2 imbalance in tuberculosis patients. Int. Immunopharmacol. 2018, 54, 24–32. [Google Scholar] [CrossRef]
- Rajaram, M.V.; Ni, B.; Dodd, C.E.; Schlesinger, L.S. Macrophage immunoregulatory pathways in tuberculosis. Semin. Immunol. 2014, 26, 471–485. [Google Scholar] [CrossRef] [PubMed] [Green Version]
- Keiran, N.; Ceperuelo-Mallafre, V.; Calvo, E.; Hernandez-Alvarez, M.I.; Ejarque, M.; Nunez-Roa, C.; Horrillo, D.; Maymo-Masip, E.; Rodriguez, M.M.; Fradera, R.; et al. SUCNR1 controls an anti-inflammatory program in macrophages to regulate the metabolic response to obesity. Nat. Immunol. 2019, 20, 581–592. [Google Scholar] [CrossRef] [PubMed]
- Yang, Y.; Wang, C.; Cheng, P.; Zhang, X.; Li, X.; Hu, Y.; Xu, F.; Hong, F.; Dong, G.; Xiong, H. CD180 Ligation Inhibits TLR7- and TLR9-Mediated Activation of Macrophages and Dendritic Cells through the Lyn-SHP-1/2 Axis in Murine Lupus. Front. Immunol. 2018, 9, 2643. [Google Scholar] [CrossRef] [PubMed]
- Welz, B.; Bikker, R.; Junemann, J.; Christmann, M.; Neumann, K.; Weber, M.; Hoffmeister, L.; Preuss, K.; Pich, A.; Huber, R.; et al. Proteome and Phosphoproteome Analysis in TNF Long Term-Exposed Primary Human Monocytes. Int. J. Mol. Sci. 2019, 20, 1241. [Google Scholar] [CrossRef] [PubMed] [Green Version]
- Shih, J.W.; Chiang, W.F.; Wu, A.T.H.; Wu, M.H.; Wang, L.Y.; Yu, Y.L.; Hung, Y.W.; Wang, W.C.; Chu, C.Y.; Hung, C.L.; et al. Long noncoding RNA LncHIFCAR/MIR31HG is a HIF-1alpha co-activator driving oral cancer progression. Nat. Commun. 2017, 8, 15874. [Google Scholar] [CrossRef] [PubMed] [Green Version]
- Cheng, N.; Liang, Y.; Du, X.; Ye, R.D. Serum amyloid A promotes LPS clearance and suppresses LPS-induced inflammation and tissue injury. EMBO Rep. 2018, 19, e45517. [Google Scholar] [CrossRef]
- Kung, C.P.; Khaku, S.; Jennis, M.; Zhou, Y.; Murphy, M.E. Identification of TRIML2, a novel p53 target, that enhances p53 SUMOylation and regulates the transactivation of proapoptotic genes. Mol. Cancer Res. 2015, 13, 250–262. [Google Scholar] [CrossRef] [Green Version]
- Yang, X.; Yang, J.; Wang, J.; Wen, Q.; Wang, H.; He, J.; Hu, S.; He, W.; Du, X.; Liu, S.; et al. Microarray analysis of long noncoding RNA and mRNA expression profiles in human macrophages infected with Mycobacterium tuberculosis. Sci. Rep. 2016, 6, 38963. [Google Scholar] [CrossRef]
- Wu, S.; Nitschke, K.; Worst, T.S.; Fierek, A.; Weis, C.A.; Eckstein, M.; Porubsky, S.; Kriegmair, M.; Erben, P. Long noncoding RNA MIR31HG and its splice variants regulate proliferation and migration: Prognostic implications for muscle invasive bladder cancer. J. Exp. Clin. Cancer Res. 2020, 39, 288. [Google Scholar] [CrossRef]
- Cao, L.; Jiang, H.; Yang, J.; Mao, J.; Wei, G.; Meng, X.; Zang, H. LncRNA MIR31HG is induced by tocilizumab and ameliorates rheumatoid arthritis fibroblast-like synoviocyte-mediated inflammation via miR-214-PTEN-AKT signaling pathway. Aging 2021, 13, 24071–24085. [Google Scholar] [CrossRef]
- Montes, M.; Lubas, M.; Arendrup, F.S.; Mentz, B.; Rohatgi, N.; Tumas, S.; Harder, L.M.; Skanderup, A.J.; Andersen, J.S.; Lund, A.H. The long noncoding RNA MIR31HG regulates the senescence associated secretory phenotype. Nat. Commun. 2021, 12, 2459. [Google Scholar] [CrossRef] [PubMed]
- Eide, P.W.; Eilertsen, I.A.; Sveen, A.; Lothe, R.A. Long noncoding RNA MIR31HG is a bona fide prognostic marker with colorectal cancer cell-intrinsic properties. Int. J. Cancer 2019, 144, 2843–2853. [Google Scholar] [CrossRef] [PubMed] [Green Version]
- Gallego-Marin, C.; Schrum, J.E.; Andrade, W.A.; Shaffer, S.A.; Giraldo, L.F.; Lasso, A.M.; Kurt-Jones, E.A.; Fitzgerald, K.A.; Golenbock, D.T. Cyclic GMP-AMP Synthase Is the Cytosolic Sensor of Plasmodium falciparum Genomic DNA and Activates Type I IFN in Malaria. J. Immunol. 2018, 200, 768–774. [Google Scholar] [CrossRef] [Green Version]
- Carthagena, L.; Bergamaschi, A.; Luna, J.M.; David, A.; Uchil, P.D.; Margottin-Goguet, F.; Mothes, W.; Hazan, U.; Transy, C.; Pancino, G.; et al. Human TRIM gene expression in response to interferons. PLoS ONE 2009, 4, e4894. [Google Scholar] [CrossRef] [PubMed] [Green Version]
- Gu, F.; Wang, C.; Wei, F.; Wang, Y.; Zhu, Q.; Ding, L.; Xu, W.; Zhu, C.; Cai, C.; Qian, Z.; et al. STAT6 degradation and ubiquitylated TRIML2 are essential for activation of human oncogenic herpesvirus. PLoS Pathog. 2018, 14, e1007416. [Google Scholar] [CrossRef] [Green Version]
- Yoshino, A.; Tashiro, S.; Ogino, A.; Yachi, K.; Ohta, T.; Fukushima, T.; Watanabe, T.; Katayama, Y.; Okamoto, Y.; Sano, E.; et al. Gene expression profiles predicting the response to IFN-beta and a combination of temozolomide and IFN-beta in malignant gliomas. Int. J. Oncol. 2011, 39, 529–542. [Google Scholar]
- Griffin, G.K.; Wu, J.; Iracheta-Vellve, A.; Patti, J.C.; Hsu, J.; Davis, T.; Dele-Oni, D.; Du, P.P.; Halawi, A.G.; Ishizuka, J.J.; et al. Epigenetic silencing by SETDB1 suppresses tumour intrinsic immunogenicity. Nature 2021, 595, 309–314. [Google Scholar] [CrossRef]
- Urieli-Shoval, S.; Meek, R.L.; Hanson, R.H.; Eriksen, N.; Benditt, E.P. Human serum amyloid A genes are expressed in monocyte/macrophage cell lines. Am. J. Pathol. 1994, 145, 650–660. [Google Scholar]
- Jumeau, C.; Awad, F.; Assrawi, E.; Cobret, L.; Duquesnoy, P.; Giurgea, I.; Valeyre, D.; Grateau, G.; Amselem, S.; Bernaudin, J.F.; et al. Expression of SAA1, SAA2 and SAA4 genes in human primary monocytes and monocyte-derived macrophages. PLoS ONE 2019, 14, e0217005. [Google Scholar]
- Timmers, H.T.M.; Tora, L. Transcript Buffering: A Balancing Act between mRNA Synthesis and mRNA Degradation. Mol. Cell 2018, 72, 10–17. [Google Scholar] [CrossRef] [Green Version]
- Chasse, H.; Boulben, S.; Costache, V.; Cormier, P.; Morales, J. Analysis of translation using polysome profiling. Nucleic Acids Res. 2017, 45, e15. [Google Scholar] [CrossRef] [Green Version]
- Barhoumi, M.; Meddeb-Garnaoui, A.; Tanner, N.K.; Banroques, J.; Kaabi, B.; Guizani, I. DEAD-box proteins, like Leishmania eIF4A, modulate interleukin (IL)-12, IL-10 and tumour necrosis factor-alpha production by human monocytes. Parasite Immunol. 2013, 35, 194–199. [Google Scholar] [CrossRef] [PubMed]
- Daigneault, M.; Preston, J.A.; Marriott, H.M.; Whyte, M.K.; Dockrell, D.H. The identification of markers of macrophage differentiation in PMA-stimulated THP-1 cells and monocyte-derived macrophages. PLoS ONE 2010, 5, e8668. [Google Scholar] [CrossRef] [PubMed]
- Genin, M.; Clement, F.; Fattaccioli, A.; Raes, M.; Michiels, C. M1 and M2 macrophages derived from THP-1 cells differentially modulate the response of cancer cells to etoposide. BMC Cancer 2015, 15, 577. [Google Scholar] [CrossRef] [PubMed] [Green Version]
- Veinalde, R.; Petrovska, R.; Bruvere, R.; Feldmane, G.; Pjanova, D. Ex vivo cytokine production in peripheral blood mononuclear cells after their stimulation with dsRNA of natural origin. Biotechnol. Appl. Biochem. 2014, 61, 65–73. [Google Scholar] [CrossRef]
- Chen, X.; Sakamoto, K.; Quinn, F.D.; Chen, H.; Fu, Z. Lack of intracellular replication of M. tuberculosis and M. bovis BCG caused by delivering bacilli to lysosomes in murine brain microvascular endothelial cells. Oncotarget 2015, 6, 32456–32467. [Google Scholar] [CrossRef] [Green Version]
- Kim, S.M.; Lee, S.H.; Kim, Y.G.; Kim, S.Y.; Seo, J.W.; Choi, Y.W.; Kim, D.J.; Jeong, K.H.; Lee, T.W.; Ihm, C.G.; et al. Hyperuricemia-induced NLRP3 activation of macrophages contributes to the progression of diabetic nephropathy. Am. J. Physiol. Renal Physiol. 2015, 308, F993–F1003. [Google Scholar] [CrossRef]
- Jeong, S.K.; Yang, K.; Park, Y.S.; Choi, Y.J.; Oh, S.J.; Lee, C.W.; Lee, K.Y.; Jeong, M.H.; Jo, W.S. Interferon gamma induced by resveratrol analog, HS-1793, reverses the properties of tumor associated macrophages. Int. Immunopharmacol. 2014, 22, 303–310. [Google Scholar] [CrossRef]
- Spano, A.; Barni, S.; Sciola, L. PMA withdrawal in PMA-treated monocytic THP-1 cells and subsequent retinoic acid stimulation, modulate induction of apoptosis and appearance of dendritic cells. Cell Prolif. 2013, 46, 328–347. [Google Scholar] [CrossRef]
- Bolstad, B.M.; Irizarry, R.A.; Astrand, M.; Speed, T.P. A comparison of normalization methods for high density oligonucleotide array data based on variance and bias. Bioinformatics 2003, 19, 185–193. [Google Scholar] [CrossRef] [Green Version]
- Gautier, L.; Cope, L.; Bolstad, B.M.; Irizarry, R.A. Affy—Analysis of Affymetrix GeneChip data at the probe level. Bioinformatics 2004, 20, 307–315. [Google Scholar] [CrossRef] [PubMed]
- Smyth, G.K. Linear models and empirical bayes methods for assessing differential expression in microarray experiments. Stat. Appl. Genet. Mol. Biol. 2004, 3. [Google Scholar] [CrossRef] [PubMed]
- Ritchie, M.E.; Phipson, B.; Wu, D.; Hu, Y.; Law, C.W.; Shi, W.; Smyth, G.K. Limma powers differential expression analyses for RNA-sequencing and microarray studies. Nucleic Acids Res. 2015, 43, e47. [Google Scholar] [CrossRef]
- Huang, D.W.; Sherman, B.T.; Lempicki, R.A. Systematic and integrative analysis of large gene lists using DAVID bioinformatics resources. Nat. Protoc. 2009, 4, 44–57. [Google Scholar] [CrossRef] [PubMed]
- Huang, D.W.; Sherman, B.T.; Lempicki, R.A. Bioinformatics enrichment tools: Paths toward the comprehensive functional analysis of large gene lists. Nucleic Acids Res. 2009, 37, 1–13. [Google Scholar] [CrossRef] [PubMed] [Green Version]
- Mootha, V.K.; Lindgren, C.M.; Eriksson, K.F.; Subramanian, A.; Sihag, S.; Lehar, J.; Puigserver, P.; Carlsson, E.; Ridderstrale, M.; Laurila, E.; et al. PGC-1alpha-responsive genes involved in oxidative phosphorylation are coordinately downregulated in human diabetes. Nat. Genet. 2003, 34, 267–273. [Google Scholar] [CrossRef] [PubMed]
- Subramanian, A.; Tamayo, P.; Mootha, V.K.; Mukherjee, S.; Ebert, B.L.; Gillette, M.A.; Paulovich, A.; Pomeroy, S.L.; Golub, T.R.; Lander, E.S.; et al. Gene set enrichment analysis: A knowledge-based approach for interpreting genome-wide expression profiles. Proc. Natl. Acad. Sci. USA 2005, 102, 15545–15550. [Google Scholar] [CrossRef] [PubMed] [Green Version]

| Name of the Pathway | Size | ES | NES | NOM p-val | FDR q-val |
|---|---|---|---|---|---|
| RESPONSE_TO_VIRUS | 205 | 0.76 | 0 | 0 | 0.008 |
| DEFENSE_RESPONSE_TO_VIRUS | 132 | 0.79 | 0 | 0 | 0.012 |
| CYTOKINE_MEDIATED_SIGNALING_PATHWAY | 391 | 0.67 | 0 | 0 | 0.009 |
| RESPONSE_TO_INTERFERON_GAMMA | 114 | 0.76 | 0 | 0 | 0.011 |
| RESPONSE_TO_TYPE_I_INTERFERON | 50 | 0.87 | 0 | 0 | 0.011 |
| NEGATIVE_REGULATION_OF_VIRAL_PROCESS | 78 | 0.81 | 0 | 0 | 0.023 |
| CELLULAR_RESPONSE_TO_INTERFERON_GAMMA | 95 | 0.77 | 0 | 0 | 0.020 |
| POSITIVE_REGULATION_OF_LEUKOCYTE_MIGRATION | 104 | 0.74 | 0 | 0 | 0.020 |
| NEGATIVE_REGULATION_OF_MULTI_ORGANISM_PROCESS | 136 | 0.72 | 0 | 0 | 0.022 |
| IMMUNE_EFFECTOR_PROCESS | 393 | 0.62 | 0 | 0 | 0.020 |
| REGULATION_OF_VIRAL_GENOME_REPLICATION | 64 | 0.78 | 0 | 0 | 0.023 |
| POSITIVE_REGULATION_OF_LEUKOCYTE_CHEMOTAXIS | 77 | 0.76 | 0 | 0 | 0.021 |
| KEGG Pathway | Genes | % | Enrichment | p-Value | Benjamini |
|---|---|---|---|---|---|
| Influenza A | 30 | 6.74 | 5.3186 | 0.000 | 0.000 |
| TNF signaling pathway | 22 | 4.94 | 6.4024 | 0.000 | 0.000 |
| Chemokine signaling pathway | 27 | 6.06 | 4.4779 | 0.000 | 0.000 |
| Herpes simplex infection | 26 | 5.84 | 4.3828 | 0.000 | 0.000 |
| NF-kappa B signaling pathway | 17 | 3.82 | 6.0278 | 0.000 | 0.000 |
| Measles | 20 | 4.49 | 4.6388 | 0.000 | 0.000 |
| Legionellosis | 13 | 2.92 | 7.4264 | 0.000 | 0.000 |
| Hepatitis C | 19 | 4.26 | 4.4068 | 0.000 | 0.000 |
| Cytokine-cytokine receptor interaction | 25 | 5.61 | 3.3530 | 0.000 | 0.000 |
| Malaria | 12 | 2.69 | 7.5546 | 0.000 | 0.000 |
| Rheumatoid arthritis | 15 | 3.37 | 5.2582 | 0.000 | 0.000 |
| NOD-like receptor signaling pathway | 12 | 2.69 | 6.7305 | 0.000 | 0.000 |
| Pertussis | 13 | 2.92 | 5.3470 | 0.000 | 0.000 |
| Toll-like receptor signaling pathway | 15 | 3.37 | 4.3653 | 0.000 | 0.000 |
| Name of the Pathway | Size | ES | NES | NOM p-val | FDR q-val |
|---|---|---|---|---|---|
| DEFENSE_RESPONSE-TO-VIRUS | 132 | 0.82 | 2.98 | 0.00 | 0.00 |
| RESPONSE_TO_VIRUS | 205 | 0.77 | 2.98 | 0.00 | 0.00 |
| CYTOKINE_MEDIATED_SIGNALING_PATHWAY | 391 | 0.70 | 2.89 | 0.00 | 0.00 |
| RESPONSE_TO_INTERFERON_GAMMA | 114 | 0.79 | 2.79 | 0.00 | 0.00 |
| CELLULAR_RESPONSE_TO_INTERFERON_GAMMA | 95 | 0.80 | 2.79 | 0.00 | 0.00 |
| NEGATIVE_REGULATION_OF_VIRAL_PROCESS | 78 | 0.83 | 2.74 | 0.00 | 0.00 |
| RESPONSE_TO_TYPE_I_INTERFERON | 50 | 0.89 | 2.71 | 0.00 | 0.00 |
| NEGATIVE_REGULATION_OF_MULTI_ORGANISM_PROCESS | 136 | 0.74 | 2.70 | 0.00 | 0.00 |
| INFLAMMATORY_RESPONSE | 401 | 0.65 | 2.65 | 0.00 | 0.00 |
| IMMUNE_EFFECTOR_PROCESS | 393 | 0.64 | 2.63 | 0.00 | 0.00 |
| POSITIVE_REGULATION_OF_LEUKOCYTE_MIGRATION | 104 | 0.74 | 2.58 | 0.00 | 0.00 |
| INTERFERON_GAMMA_MEDIATED_SIGNALING_PATHWAY | 52 | 0.83 | 2.57 | 0.00 | 0.00 |
| KEGG Pathway | Genes | % | Enrichment | p-Value | Benjamini |
|---|---|---|---|---|---|
| Influenza A | 31 | 6.86 | 5.5959 | 0.000 | 0.000 |
| TNF signaling pathway | 21 | 4.65 | 6.2226 | 0.000 | 0.000 |
| NF-kappa B signaling pathway | 19 | 4.20 | 6.8595 | 0.000 | 0.000 |
| Herpes simplex infection | 26 | 5.75 | 4.4625 | 0.000 | 0.000 |
| Chemokine signaling pathway | 26 | 5.75 | 4.3905 | 0.000 | 0.000 |
| Legionellosis | 15 | 3.32 | 8.7247 | 0.000 | 0.000 |
| Measles | 21 | 4.65 | 4.9593 | 0.000 | 0.000 |
| Hepatitis C | 20 | 4.42 | 4.7232 | 0.000 | 0.000 |
| Pertussis | 15 | 3.32 | 6.2818 | 0.000 | 0.000 |
| Malaria | 12 | 2.65 | 7.6920 | 0.000 | 0.000 |
| NOD-like receptor signaling pathway | 12 | 2.65 | 6.8529 | 0.000 | 0.000 |
| Toll-like receptor signaling pathway | 16 | 3.54 | 4.7410 | 0.000 | 0.000 |
| Name of the Pathway | Size | ES | NES | NOM p-val | FDR q-val |
|---|---|---|---|---|---|
| POSITIVE_REGULATION_OF_INTERLEUKIN_1_SECRETION | 22 | −0.46 | −1.22 | 0.20 | 0.64 |
| REGULATION_OF_INTERLEUKIN_1_SECRETION | 29 | −0.40 | −1.13 | 0.31 | 0.75 |
| POSITIVE_REGULATION_OF_INTERLEUKIN_1_PRODUCTION | 34 | −0.34 | −0.99 | 0.46 | 0.92 |
| REGULATION_OF_INTERLEUKIN_1_PRODUCTION | 53 | −0.28 | −0.89 | 0.62 | 1 |
| REGULATION_OF_INTERLEUKIN_12_PRODUCTION | 46 | −0.26 | −0.80 | 0.77 | 1 |
| INTERLEUKIN_1_PRODUCTION | 15 | −0.33 | −0.80 | 0.73 | 1 |
| REGULATION_OF_INTERLEUKIN_10_PRODUCTION | 37 | −0.25 | −0.75 | 0.86 | 1 |
| POSITIVE_REGULATION_OF_INTERLEUKIN_12_PRODUCTION | 31 | −0.24 | −0.68 | 0.91 | 1 |
| NEGATIVE_REGULATION_OF_INTERLEUKIN_1_PRODUCTION | 17 | −0.17 | −0.43 | 0.99 | 1 |
| REGULATION_OF_INTERLEUKIN_1_BETA_PRODUCTION | 43 | −0.13 | −0.40 | 1 | 1 |
| TUMOR_NECROSIS_FACTOR_RECEPTOR_BINDING | 25 | −0.49 | −1.32 | 0.13 | 0.55 |
| TUMOR_NECROSIS_FACTOR_RECEPTOR_SUPERFAMILY_BINDING | 38 | −0.42 | −1.22 | 0.18 | 0.63 |
| NEGATIVE_REGULATION_OF_TUMOR_NECROSIS_FACTOR_SUPERFAMILY_CYTOKINE_PRODUCTION | 35 | −0.30 | −0.89 | 0.64 | 1 |
| REGULATION_OF_TUMOR_NECROSIS_FACTOR_SUPERFAMILY_CYTOKINE_PRODUCTION | 87 | −0.24 | −0.80 | 0.83 | 1 |
| TUMOR_NECROSIS_FACTOR_MEDIATED_SIGNALING_PATHWAY | 106 | −0.19 | −0.67 | 0.98 | 1 |
| RESPONSE_TO_TUMOR_NECROSIS_FACTOR | 208 | −0.17 | −0.62 | 1.00 | 1 |
| REGULATION_OF_TUMOR_NECROSIS_FACTOR_BIOSYNTHETIC_PROCESS | 15 | −0.25 | −0.61 | 0.93 | 1 |
| REGULATION_OF_TUMOR_NECROSIS_FACTOR_MEDIATED_SIGNALING_PATHWAY | 41 | −0.18 | −0.54 | 1.00 | 1 |
| POSITIVE_REGULATION_OF_TUMOR_NECROSIS_FACTOR_SUPERFAMILY_CYTOKINE_PRODUCTION | 52 | −0.17 | −0.53 | 1.00 | 1 |
| PHOSPHOPROTEIN_BINDING | 56 | −0.21 | −0.67 | 0.95 | 1 |
| PHOSPHOPROTEIN_PHOSPHATASE_ACTIVITY | 152 | −0.18 | −0.66 | 0.99 | 1 |
| Subpopulation | Surface Marker | Fluorochrome |
|---|---|---|
| M0 | CD11b | APC |
| CD14 | PE | |
| M1 | CD16 | APC/Cy7 |
| CD80 | FITC | |
| M2 | CD206 | FITC |
| CD209 | APC |
Publisher’s Note: MDPI stays neutral with regard to jurisdictional claims in published maps and institutional affiliations. |
© 2022 by the authors. Licensee MDPI, Basel, Switzerland. This article is an open access article distributed under the terms and conditions of the Creative Commons Attribution (CC BY) license (https://creativecommons.org/licenses/by/4.0/).
Share and Cite
Molina-Olvera, G.; Rivas-Ortiz, C.I.; Schcolnik-Cabrera, A.; Castillo-Rodal, A.I.; López-Vidal, Y. RNA Microarray-Based Comparison of Innate Immune Phenotypes between Human THP-1 Macrophages Stimulated with Two BCG Strains. Int. J. Mol. Sci. 2022, 23, 4525. https://doi.org/10.3390/ijms23094525
Molina-Olvera G, Rivas-Ortiz CI, Schcolnik-Cabrera A, Castillo-Rodal AI, López-Vidal Y. RNA Microarray-Based Comparison of Innate Immune Phenotypes between Human THP-1 Macrophages Stimulated with Two BCG Strains. International Journal of Molecular Sciences. 2022; 23(9):4525. https://doi.org/10.3390/ijms23094525
Chicago/Turabian StyleMolina-Olvera, Gabriela, Claudia I. Rivas-Ortiz, Alejandro Schcolnik-Cabrera, Antonia I. Castillo-Rodal, and Yolanda López-Vidal. 2022. "RNA Microarray-Based Comparison of Innate Immune Phenotypes between Human THP-1 Macrophages Stimulated with Two BCG Strains" International Journal of Molecular Sciences 23, no. 9: 4525. https://doi.org/10.3390/ijms23094525
APA StyleMolina-Olvera, G., Rivas-Ortiz, C. I., Schcolnik-Cabrera, A., Castillo-Rodal, A. I., & López-Vidal, Y. (2022). RNA Microarray-Based Comparison of Innate Immune Phenotypes between Human THP-1 Macrophages Stimulated with Two BCG Strains. International Journal of Molecular Sciences, 23(9), 4525. https://doi.org/10.3390/ijms23094525