
Pdx1 Is Transcriptionally Regulated by EGR-1 during Nitric Oxide-Induced Endoderm Differentiation of Mouse Embryonic Stem Cells

 , , , , ,
  , ,
, ,  , and
, and 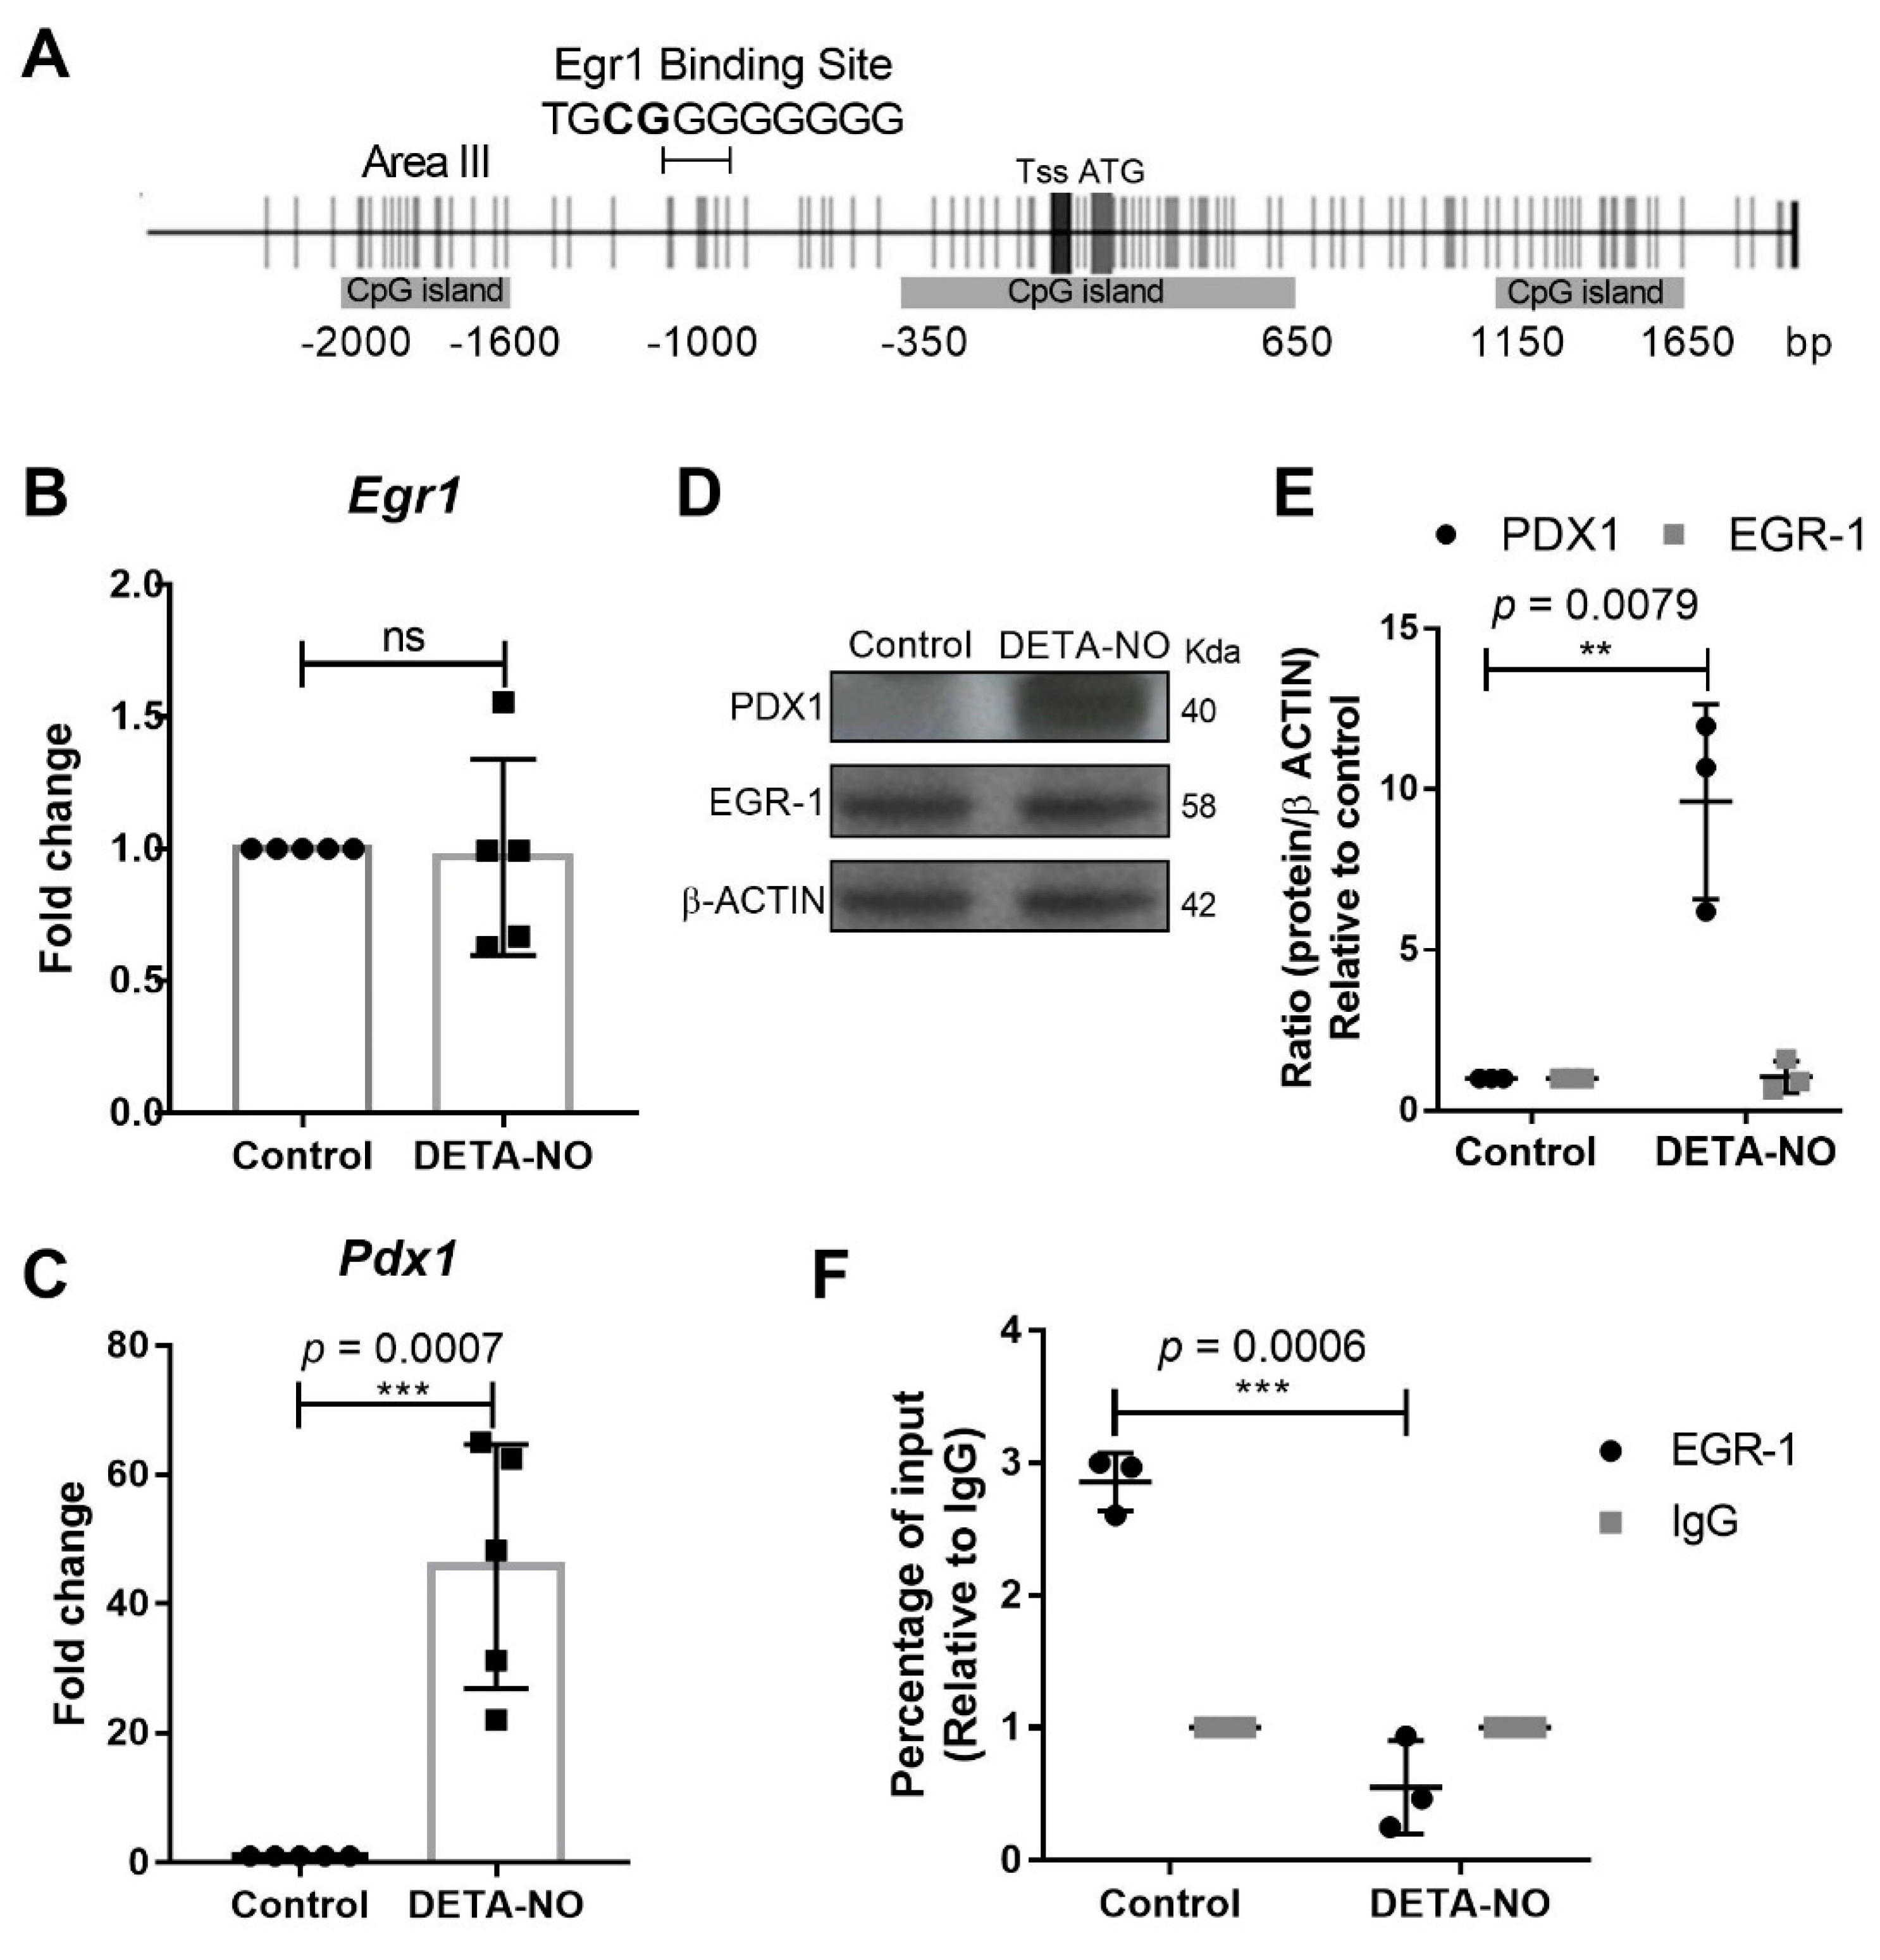
Abstract
1. Introduction
2. Results
2.1. EGR-1 Binds to Pdx1 Promoter in mESCs
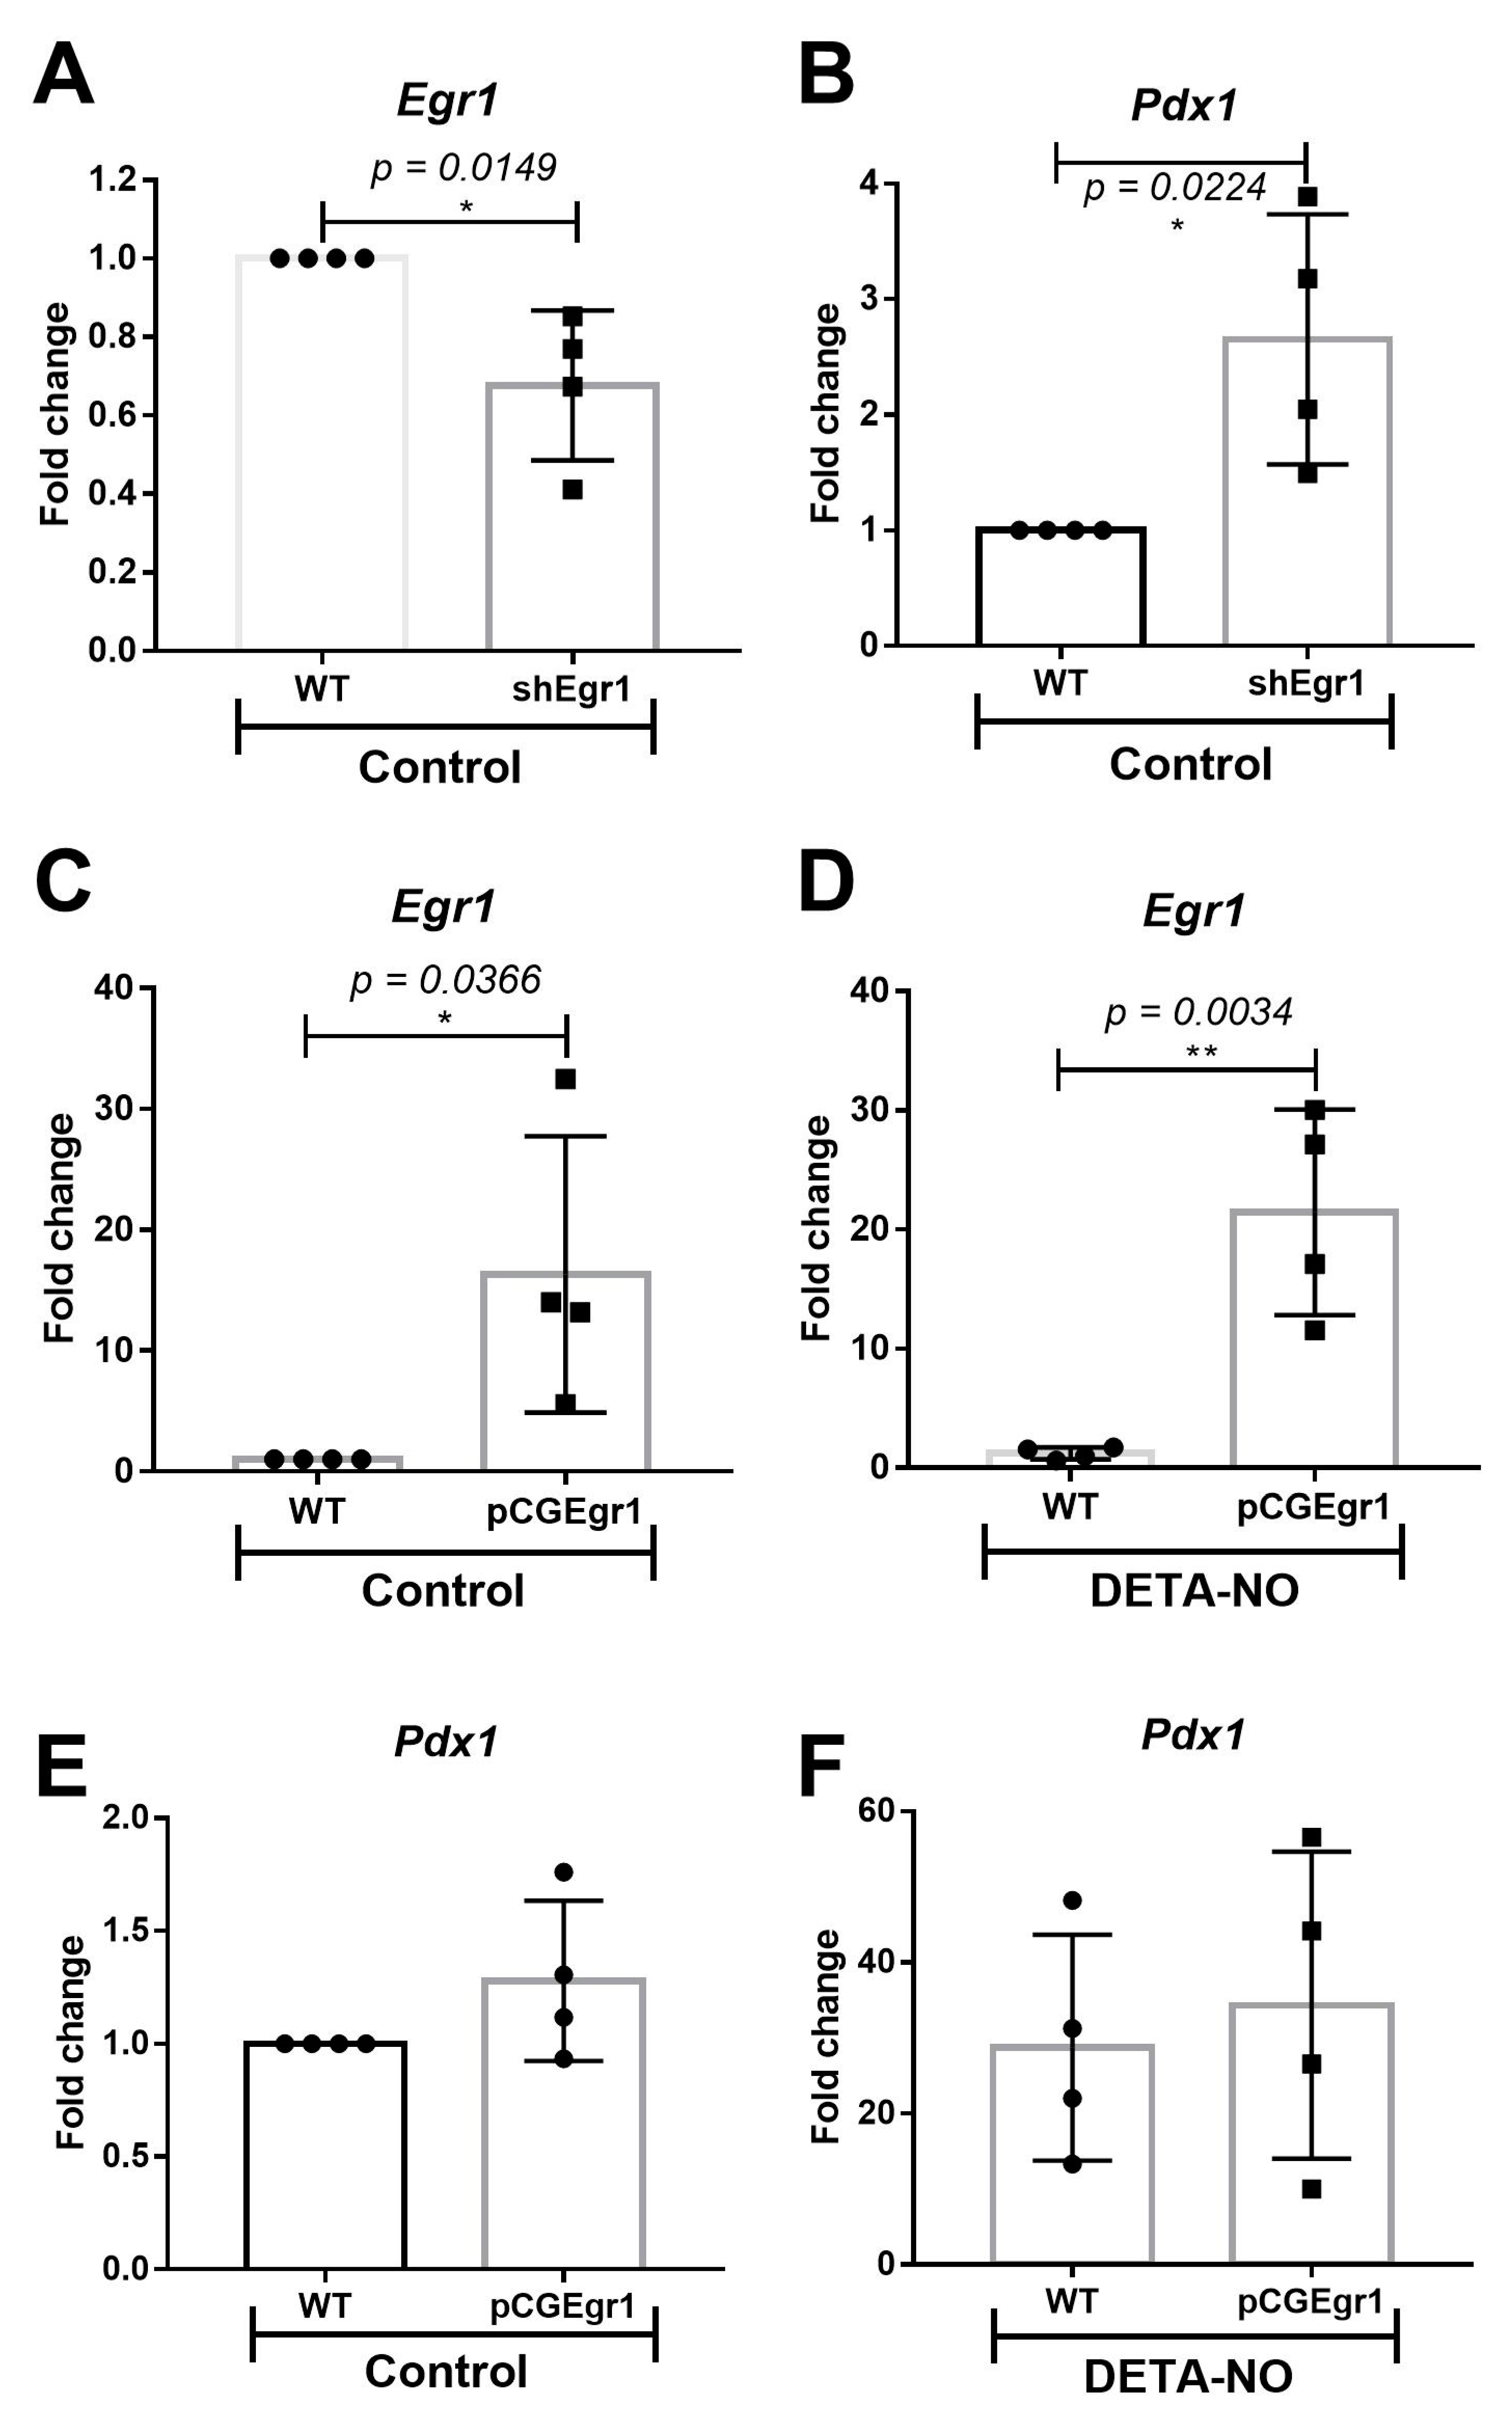
2.2. EGR-1 Has a Repressor Role on Pdx1 Expression in mESCs
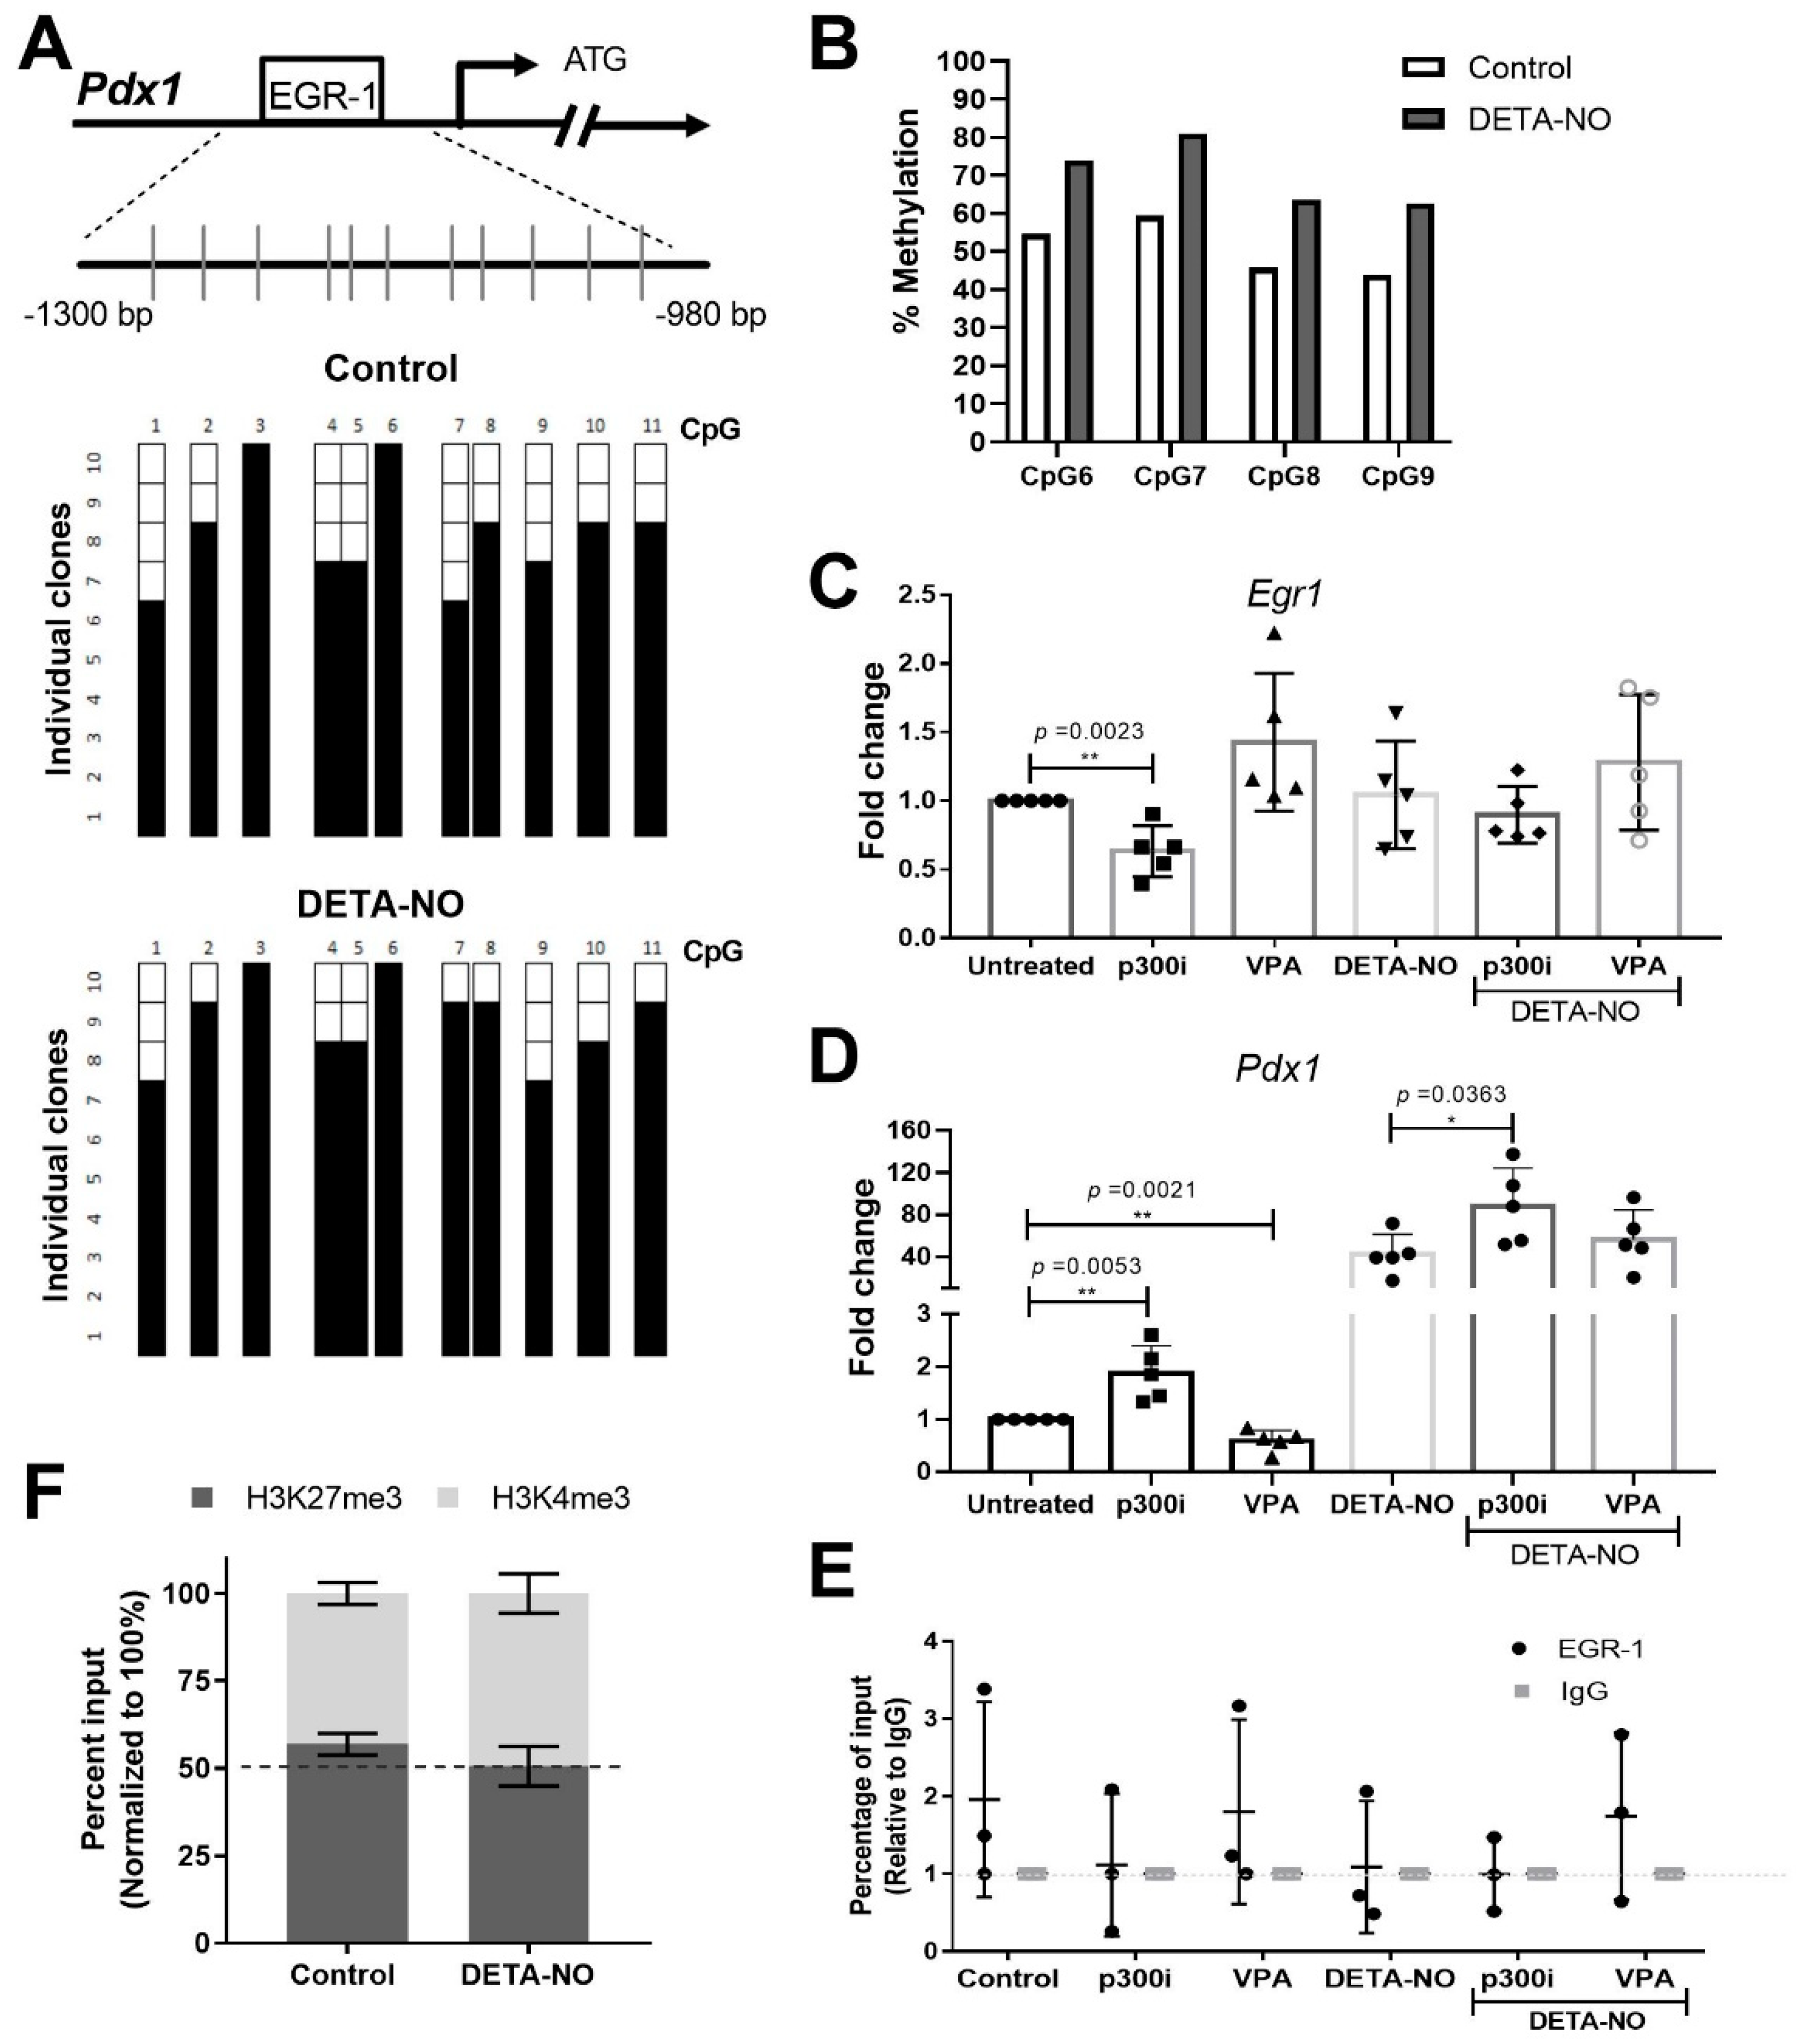
2.3. EGR-1 Binding to Pdx1 Promoter Is Dependent on DNA Methylation and Its Acetylation Status
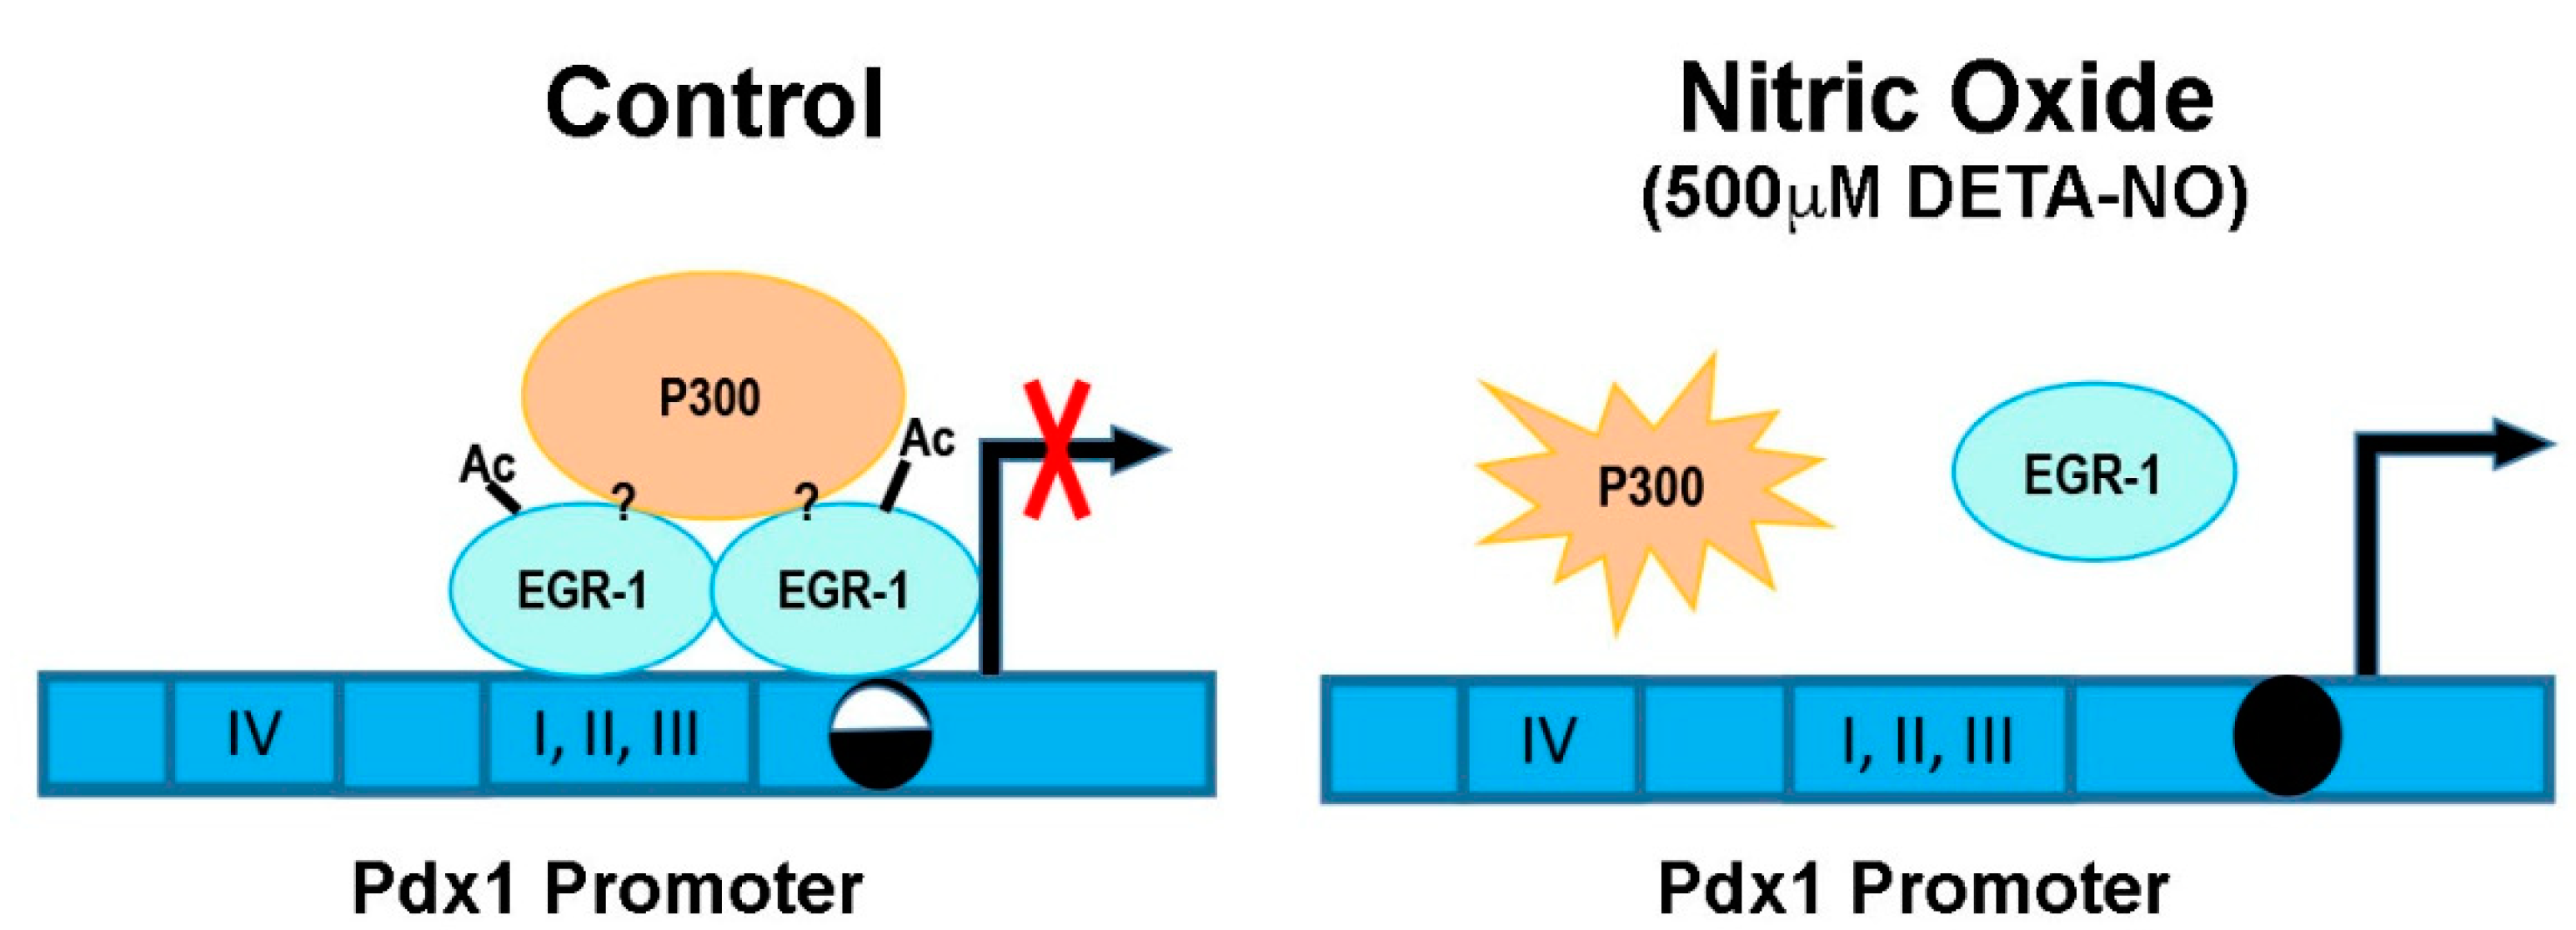
3. Discussion
4. Materials and Methods
4.1. Cell Culture and Treatments
4.2. RNA Isolation, Reverse Transcription, PCR, and Real-Time PCR Analysis
4.3. Protein Extraction and Western Blotting
4.4. Bisulfite Sequencing PCR (BSP)
4.5. Bisulfite Pyrosequencing
4.6. Chromatin Immunoprecipitation Assay
4.7. Egr-1 Loss and Gain of Function
4.8. Statistical Analyses
Supplementary Materials
Author Contributions
Funding
Institutional Review Board Statement
Informed Consent Statement
Data Availability Statement
Conflicts of Interest
References
- Sukhatme, V.P.; Cao, X.M.; Chang, L.C.; Tsai-Morris, C.H.; Stamenkovich, D.; Ferreira, P.C.; Cohen, D.R.; Edwards, S.A.; Shows, T.B.; Curran, T.; et al. A zinc finger-encoding gene coregulated with c-fos during growth and differentiation, and after cellular depolarization. Cell 1988, 53, 37–43. [Google Scholar] [CrossRef]
- Thiel, G.; Cibelli, G. Regulation of life and death by the zinc finger transcription factor Egr-1. J. Cell. Physiol. 2002, 193, 287–292. [Google Scholar] [CrossRef]
- Kumbrink, J.; Gerlinger, M.; Johnson, J.P. Egr-1 induces the expression of its corepressor nab2 by activation of the nab2 promoter thereby establishing a negative feedback loop. J. Biol. Chem. 2005, 280, 42785–42793. [Google Scholar] [CrossRef] [PubMed]
- Pagel, J.I.; Deindl, E. Disease progression mediated by egr-1 associated signaling in response to oxidative stress. Int. J. Mol. Sci. 2012, 13, 13104–13117. [Google Scholar] [CrossRef]
- Hasan, R.N.; Schafer, A.I. Hemin upregulates Egr-1 expression in vascular smooth muscle cells via reactive oxygen species ERK-1/2-Elk-1 and NF-kappaB. Circ. Res. 2008, 102, 42–50. [Google Scholar] [CrossRef]
- Jones, N.; Agani, F.H. Hyperoxia induces Egr-1 expression through activation of extracellular signal-regulated kinase 1/2 pathway. J. Cell. Physiol. 2003, 196, 326–333. [Google Scholar] [CrossRef] [PubMed]
- Mishra, S.; Fujita, T.; Lama, V.N.; Nam, D.; Liao, H.; Okada, M.; Minamoto, K.; Yoshikawa, Y.; Harada, H.; Pinsky, D.J. Carbon monoxide rescues ischemic lungs by interrupting MAPK-driven expression of early growth response 1 gene and its downstream target genes. Proc. Natl. Acad. Sci. USA 2006, 103, 5191–5196. [Google Scholar] [CrossRef] [PubMed]
- Rokosh, G. Heme Egr-1: New partners in atherosclerotic progression? Circ. Res. 2008, 102, 6–8. [Google Scholar] [CrossRef]
- Yan, S.F.; Lu, J.; Zou, Y.S.; Soh-Won, J.; Cohen, D.M.; Buttrick, P.M.; Cooper, D.R.; Steinberg, S.F.; Mackman, N.; Pinsky, D.J.; et al. Hypoxia-associated induction of early growth response-1 gene expression. J. Biol. Chem. 1999, 274, 15030–15040. [Google Scholar] [CrossRef] [PubMed]
- Yu, S.; Zhou, R.; Yang, T.; Liu, S.; Cui, Z.; Qiao, Q.; Zhang, J. Hypoxia promotes colorectal cancer cell migration and invasion in a SIRT1-dependent manner. Cancer Cell Int. 2019, 19, 116. [Google Scholar] [CrossRef]
- Lin, H.; You, B.; Lin, X.; Wang, X.; Zhou, D.; Chen, Z.; Chen, Y.; Wang, R. Silencing of long non-coding RNA Sox2ot inhibits oxidative stress and inflammation of vascular smooth muscle cells in abdominal aortic aneurysm via microRNA-145-mediated Egr1 inhibition. Aging 2020, 12, 12684–12702. [Google Scholar] [CrossRef]
- Baron, V.; Adamson, E.D.; Calogero, A.; Ragona, G.; Mercola, D. The transcription factor Egr1 is a direct regulator of multiple tumor suppressors including TGFbeta1, PTEN, p53, and fibronectin. Cancer Gene Ther. 2006, 13, 115–124. [Google Scholar] [CrossRef] [PubMed]
- Mohamad, T.; Kazim, N.; Adhikari, A.; Davie, J.K. EGR1 interacts with TBX2 and functions as a tumor suppressor in rhabdomyosarcoma. Oncotarget 2018, 9, 18084–18098. [Google Scholar] [CrossRef] [PubMed]
- Xiao, F.; Li, H.; Feng, Z.; Huang, L.; Kong, L.; Li, M.; Wang, D.; Liu, F.; Zhu, Z.; Wei, Y.; et al. Intermedin facilitates hepatocellular carcinoma cell survival and invasion via ERK1/2-EGR1/DDIT3 signaling cascade. Sci. Rep. 2021, 11, 488. [Google Scholar] [CrossRef] [PubMed]
- Zhang, W.; Tong, H.; Zhang, Z.; Shao, S.; Liu, D.; Li, S.; Yan, Y. Transcription factor EGR1 promotes differentiation of bovine skeletal muscle satellite cells by regulating MyoG gene expression. J. Cell. Physiol. 2018, 233, 350–362. [Google Scholar] [CrossRef] [PubMed]
- Shi, W.; Ling, D.; Zhang, F.; Fu, X.; Lai, D.; Zhang, Y. Curcumin promotes osteogenic differentiation of human periodontal ligament stem cells by inducting EGR1 expression. Arch. Oral Biol. 2021, 121, 104958. [Google Scholar] [CrossRef]
- Zhang, Q.; Zuo, H.; Yu, S.; Lin, Y.; Chen, S.; Liu, H.; Chen, Z. RUNX2 co-operates with EGR1 to regulate osteogenic differentiation through Htra1 enhancers. J. Cell. Physiol. 2020, 235, 8601–8612. [Google Scholar] [CrossRef] [PubMed]
- Bléher, M.; Meshko, B.; Cacciapuoti, I.; Gergondey, R.; Kovacs, Y.; Duprez, D.; L’Honoré, A.; Havis, E. Egr1 loss-of-function promotes beige adipocyte differentiation and activation specifically in inguinal subcutaneous white adipose tissue. Sci. Rep. 2020, 10, 15842. [Google Scholar] [CrossRef]
- Leu, S.Y.; Kuo, L.H.; Weng, W.T.; Lien, I.C.; Yang, C.C.; Hsieh, T.T.; Cheng, Y.N.; Chien, P.H.; Ho, L.C.; Chen, S.H.; et al. Loss of EGR-1 uncouples compensatory responses of pancreatic β cells. Theranostics 2020, 10, 4233–4249. [Google Scholar] [CrossRef]
- Eto, K.; Kaur, V.; Thomas, M.K. Regulation of insulin gene transcription by the immediate-early growth response gene Egr-1. Endocrinology 2006, 147, 2923–2935. [Google Scholar] [CrossRef] [PubMed]
- Eto, K.; Kaur, V.; Thomas, M.K. Regulation of pancreas duodenum homeobox-1 expression by early growth response-1. J. Biol. Chem. 2007, 282, 5973–5983. [Google Scholar] [CrossRef] [PubMed]
- Gerrish, K.; Gannon, M.; Shih, D.; Henderson, E.; Stoffel, M.; Wright, C.V.E.; Stein, R. Pancreatic β Cell-specific Transcription of thepdx-1 Gene: THE ROLE OF CONSERVED UPSTREAM CONTROL REGIONS AND THEIR HEPATIC NUCLEAR FACTOR 3β SITES. J. Biol. Chem. 2000, 275, 3485–3492. [Google Scholar] [CrossRef]
- Tsugata, T.; Nikoh, N.; Kin, T.; Saitoh, I.; Noguchi, Y.; Ueki, H.; Watanabe, M.; James Shapiro, A.M.; Noguchi, H. Potential Factors for the Differentiation of ESCs/iPSCs Into Insulin-Producing Cells. Cell Med. 2015, 7, 83–93. [Google Scholar] [CrossRef] [PubMed]
- Tsugata, T.; Nikoh, N.; Kin, T.; Miyagi-Shiohira, C.; Nakashima, Y.; Saitoh, I.; Noguchi, Y.; Ueki, H.; Watanabe, M.; Kobayashi, N.; et al. Role of Egr1 on Pancreatic Endoderm Differentiation. Cell Med. 2018, 10, 2155179017733177. [Google Scholar] [CrossRef] [PubMed]
- Mora-Castilla, S.; Tejedo, J.R.; Hmadcha, A.; Cahuana, G.M.; Martín, F.; Soria, B.; Bedoya, F.J. Nitric oxide repression of Nanog promotes mouse embryonic stem cell differentiation. Cell Death Differ. 2010, 17, 1025–1033. [Google Scholar] [CrossRef]
- Salguero-Aranda, C.; Tapia-Limonchi, R.; Cahuana, G.M.; Hitos, A.B.; Diaz, I.; Hmadcha, A.; Fraga, M.; Martín, F.; Soria, B.; Tejedo, J.R.; et al. Differentiation of Mouse Embryonic Stem Cells toward Functional Pancreatic β-Cell Surrogates through Epigenetic Regulation of Pdx1 by Nitric Oxide. Cell Transplant. 2016, 25, 1879–1892. [Google Scholar] [CrossRef]
- Sandelin, A.; Alkema, W.; Engström, P.; Wasserman, W.W.; Lenhard, B. JASPAR: An open-access database for eukaryotic transcription factor binding profiles. Nucleic Acids Res. 2004, 32, D91–D94. [Google Scholar] [CrossRef] [PubMed]
- Ogishima, T.; Shiina, H.; Breault, J.E.; Terashima, M.; Honda, S.; Enokida, H.; Urakami, S.; Tokizane, T.; Kawakami, T.; Ribeiro-Filho, L.A.; et al. Promoter CpG hypomethylation and transcription factor EGR1 hyperactivate heparanase expression in bladder cancer. Oncogene 2005, 24, 6765–6772. [Google Scholar] [CrossRef]
- Liu, D.X.; Qian, D.; Wang, B.; Yang, J.M.; Lu, Z. p300-Dependent ATF5 acetylation is essential for Egr-1 gene activation and cell proliferation and survival. Mol. Cell. Biol. 2011, 31, 3906–3916. [Google Scholar] [CrossRef] [PubMed]
- Yu, J.; de Belle, I.; Liang, H.; Adamson, E.D. Coactivating factors p300 and CBP are transcriptionally crossregulated by Egr1 in prostate cells, leading to divergent responses. Mol. Cell 2004, 15, 83–94. [Google Scholar] [CrossRef] [PubMed]
- Brinkman, A.B.; Pennings, S.W.; Braliou, G.G.; Rietveld, L.E.; Stunnenberg, H.G. DNA methylation immediately adjacent to active histone marking does not silence transcription. Nucleic Acids Res. 2007, 35, 801–811. [Google Scholar] [CrossRef] [PubMed]
- Kadowaki, M.; Yoshioka, H.; Kamitani, H.; Watanabe, T.; Wade, P.A.; Eling, T.E. DNA methylation-mediated silencing of nonsteroidal anti-inflammatory drug-activated gene (NAG-1/GDF15) in glioma cell lines. Int. J. Cancer 2012, 130, 267–277. [Google Scholar] [CrossRef] [PubMed]
- Kubosaki, A.; Tomaru, Y.; Tagami, M.; Arner, E.; Miura, H.; Suzuki, T.; Suzuki, M.; Suzuki, H.; Hayashizaki, Y. Genome-wide investigation of in vivo EGR-1 binding sites in monocytic differentiation. Genome Biol. 2009, 10, R41. [Google Scholar] [CrossRef]


Publisher’s Note: MDPI stays neutral with regard to jurisdictional claims in published maps and institutional affiliations. |
© 2022 by the authors. Licensee MDPI, Basel, Switzerland. This article is an open access article distributed under the terms and conditions of the Creative Commons Attribution (CC BY) license (https://creativecommons.org/licenses/by/4.0/).
Share and Cite
Salguero-Aranda, C.; Beltran-Povea, A.; Postigo-Corrales, F.; Hitos, A.B.; Díaz, I.; Caballano-Infantes, E.; Fraga, M.F.; Hmadcha, A.; Martín, F.; Soria, B.; et al. Pdx1 Is Transcriptionally Regulated by EGR-1 during Nitric Oxide-Induced Endoderm Differentiation of Mouse Embryonic Stem Cells. Int. J. Mol. Sci. 2022, 23, 3920. https://doi.org/10.3390/ijms23073920
Salguero-Aranda C, Beltran-Povea A, Postigo-Corrales F, Hitos AB, Díaz I, Caballano-Infantes E, Fraga MF, Hmadcha A, Martín F, Soria B, et al. Pdx1 Is Transcriptionally Regulated by EGR-1 during Nitric Oxide-Induced Endoderm Differentiation of Mouse Embryonic Stem Cells. International Journal of Molecular Sciences. 2022; 23(7):3920. https://doi.org/10.3390/ijms23073920
Chicago/Turabian StyleSalguero-Aranda, Carmen, Amparo Beltran-Povea, Fátima Postigo-Corrales, Ana Belén Hitos, Irene Díaz, Estefanía Caballano-Infantes, Mario F. Fraga, Abdelkrim Hmadcha, Franz Martín, Bernat Soria, and et al. 2022. "Pdx1 Is Transcriptionally Regulated by EGR-1 during Nitric Oxide-Induced Endoderm Differentiation of Mouse Embryonic Stem Cells" International Journal of Molecular Sciences 23, no. 7: 3920. https://doi.org/10.3390/ijms23073920
APA StyleSalguero-Aranda, C., Beltran-Povea, A., Postigo-Corrales, F., Hitos, A. B., Díaz, I., Caballano-Infantes, E., Fraga, M. F., Hmadcha, A., Martín, F., Soria, B., Tapia-Limonchi, R., Bedoya, F. J., Tejedo, J. R., & Cahuana, G. M. (2022). Pdx1 Is Transcriptionally Regulated by EGR-1 during Nitric Oxide-Induced Endoderm Differentiation of Mouse Embryonic Stem Cells. International Journal of Molecular Sciences, 23(7), 3920. https://doi.org/10.3390/ijms23073920