Article

The Spectral Compositions of Light Changes Physiological Response of Chinese Cabbage to Elevated Ozone Concentration

1
Institute of Biology, Pedagogical University of Krakow, Podchorążych 2, 30-084 Kraków, Poland
2
The Franciszek Górski Institute of Plant Physiology, Polish Academy of Sciences, Niezapominajek 21, 30-239 Kraków, Poland
3
Institute of Biology, The Jan Kochanowski University, Uniwersytecka 7, 25-406 Kielce, Poland
*
Author to whom correspondence should be addressed.
Int. J. Mol. Sci. 2022, 23(6), 2941; https://doi.org/10.3390/ijms23062941
Submission received: 18 February 2022 / Revised: 4 March 2022 / Accepted: 6 March 2022 / Published: 9 March 2022
(This article belongs to the Special Issue Response of Photosynthesis to Abiotic Stresses)

Abstract

:
The effects of ozone combined with other environmental factors remain an important topic of the research, both in connection with climate change and the possibility of using modern solutions in horticulture. In our experiment, we compared the influence of ozone (100 ppb) on photosynthesis and changes in the pigment composition of Chinese cabbage (Brassica rapa subsp. pekinensis) leaves depending on the spectral composition of light. We used white LED light (WL), a combination of red + green + blue (RGBL) with a dominant red component and white +blue (WBL) with a dominant blue component in comparison with the classic sodium lamp lighting (yellow light—YL). The values of the parameters describing the light-dependent phase of photosynthesis and the parameters of the gas exchange, as well as non-photosynthesis pigment contents, show that the spectral composition strongly differentiates the response of Chinese cabbage leaves to ozone. In general, the efficiency of photochemical reactions was the highest in YL, but after O3 fumigation, it decreased. In plants growing in WL and WBL, the increase of O3 concentration stimulated light photosynthesis reactions and led to the enhancement of transpiration, stomatal conductance and intracellular CO2 concentration. Changes in photosynthetic activity were accompanied by an increase in the content of anthocyanins and flavonols.

1. Introduction

Abiotic environmental factors play a key role in the growth and development of all plants and, in the case of cultivated species, also have an impact on their value in use. Plant metabolic activity—in particular, the photosynthesis and the synthesis of secondary metabolites—are strongly dependent on light conditions. Both the intensity and spectral composition of sunlight undergoes constant fluctuations, which are associated with dynamic changes in natural atmospheric components (CO2, water vapour and suspended dust), as well as an increase in air pollution, e.g., by ozone. In the case of vegetable growing, in addition to photon flux density, the spectral composition of light is also important, as it can be modified and adapted to optimise plant growth to obtain higher yields in shorter time. This modification of the light spectrum can significantly and favourably affect photochemical reactions of photosynthesis, as well as the anatomical and morphological structures of cultivated plants [1]. Long-term growth in low-light conditions (shadow) leads to a decrease in the plant’s energy resources, which results in a reduction in photosynthetic activity and a decrease in biomass. For this reason, the shade avoidance response is often found in many plant species. It manifests, among others, in the elongation of stems and petioles (hyponastic response), thanks to which, the plant can compete better for light. It has long been known that this mechanism is regulated by changing the red/far-red (R/FR) value ratio in the light spectrum. However, also, blue light (and, therefore, the blue/red ratio value) can significantly affect the shadow avoidance response [2].
Ozone is usually treated as a pollutant, which, in high concentrations, adversely affects the development of plants, contributing to the reduction of the primary productivity of both natural ecosystems and crops [3,4,5]. Many crop species (e.g., tobacco, string beans, soybeans, wheat and cowpeas) are sensitive to high ozone concentrations [6,7,8]. The negative effect of an elevated O3 concentration on crop plants, which is manifested by stomatal limitation, increased reactive oxygen species (ROS) synthesis and, consequently, inhibition of photosynthesis, has been repeatedly confirmed [6,9,10]. Previous studies presented a diverse experimental approach and were carried out under controlled (climatic chambers), semi-controlled (greenhouses, top-openchambers) and outdoor conditions [9]. However, only a small part of the experiments considered the synergistic effects of ozone and other abiotic factors, especially light [11,12,13].
The tolerance of elevated ozone concentrations in individual plant species differs fundamentally. It is associated with the ability to regulate the stomatal conductance and change in oxidative signalling, as well as activation of defence mechanisms [3,4,5,14]. As a result, acclimatisation to a new O3 concentration and an increase in photosynthesis efficiency were observed in some species (e.g., apple trees) [15]. In turn, in Brassica oleracea L., ozone fumigation caused growth acceleration and permanent changes in the antioxidant system [14]. The use of short exposure to O3 may increase plant tolerance to photoinhibition [12]. Antioxidants such as anthocyanins and flavonoids play an important role in this process, as they protect the photosynthetic apparatus from excess light energy [16,17].
The measurement of Chla fluorescence kinetics is a non-destructive method often used to analyse PSII responses to environmental stress [18,19,20,21]. It ensures obtaining, in a short time, parameters describing the efficiency of absorption, distribution and dissipation of light energy within PSII that reacts quickly with changes in abiotic factors, e.g., an increase in ozone concentration [15,22,23,24]. It has long been successfully used for the early detection of changes in the light phase of photosynthesis under the influence of O3 before visible signs of stress appear [24]. The analysis of Chla fluorescence kinetics was also used to assess the interaction of ozone and other environmental stresses, e.g., high light [12]. This method is also particularly useful for assessing changes occurring in PSII under the influence of the different spectral compositions of light [25,26]. A complementary method that allows determining the effect of O3 on photosynthesis is gas exchange analysis, i.e., net photosynthesis, as well as transpiration, stomatal conductance and intracellular CO2 concentration [6,13,24]. In turn, FT-Raman spectroscopy and light reflectance analysis allow to assess the chemical compositions of plants—in particular, the estimation of the total protective pigments content (such as anthocyanins, flavonols and carotenoids) without affecting the tissue structure [27,28,29,30,31].
The goal of this experiment was to investigate how the spectral composition of light influences the photosynthetic response and photosynthetic pigment contents of Chinese cabbage leaves exposed to an elevated O3 concentration (100 ppb). As a light source, we used LED matrices emitting white (WL), white–blue with a dominant blue component (WBL) and red–green–blue with a dominant red component (RGBL), respectively, and sodium lamp emitting yellow light (YL).

2. Results

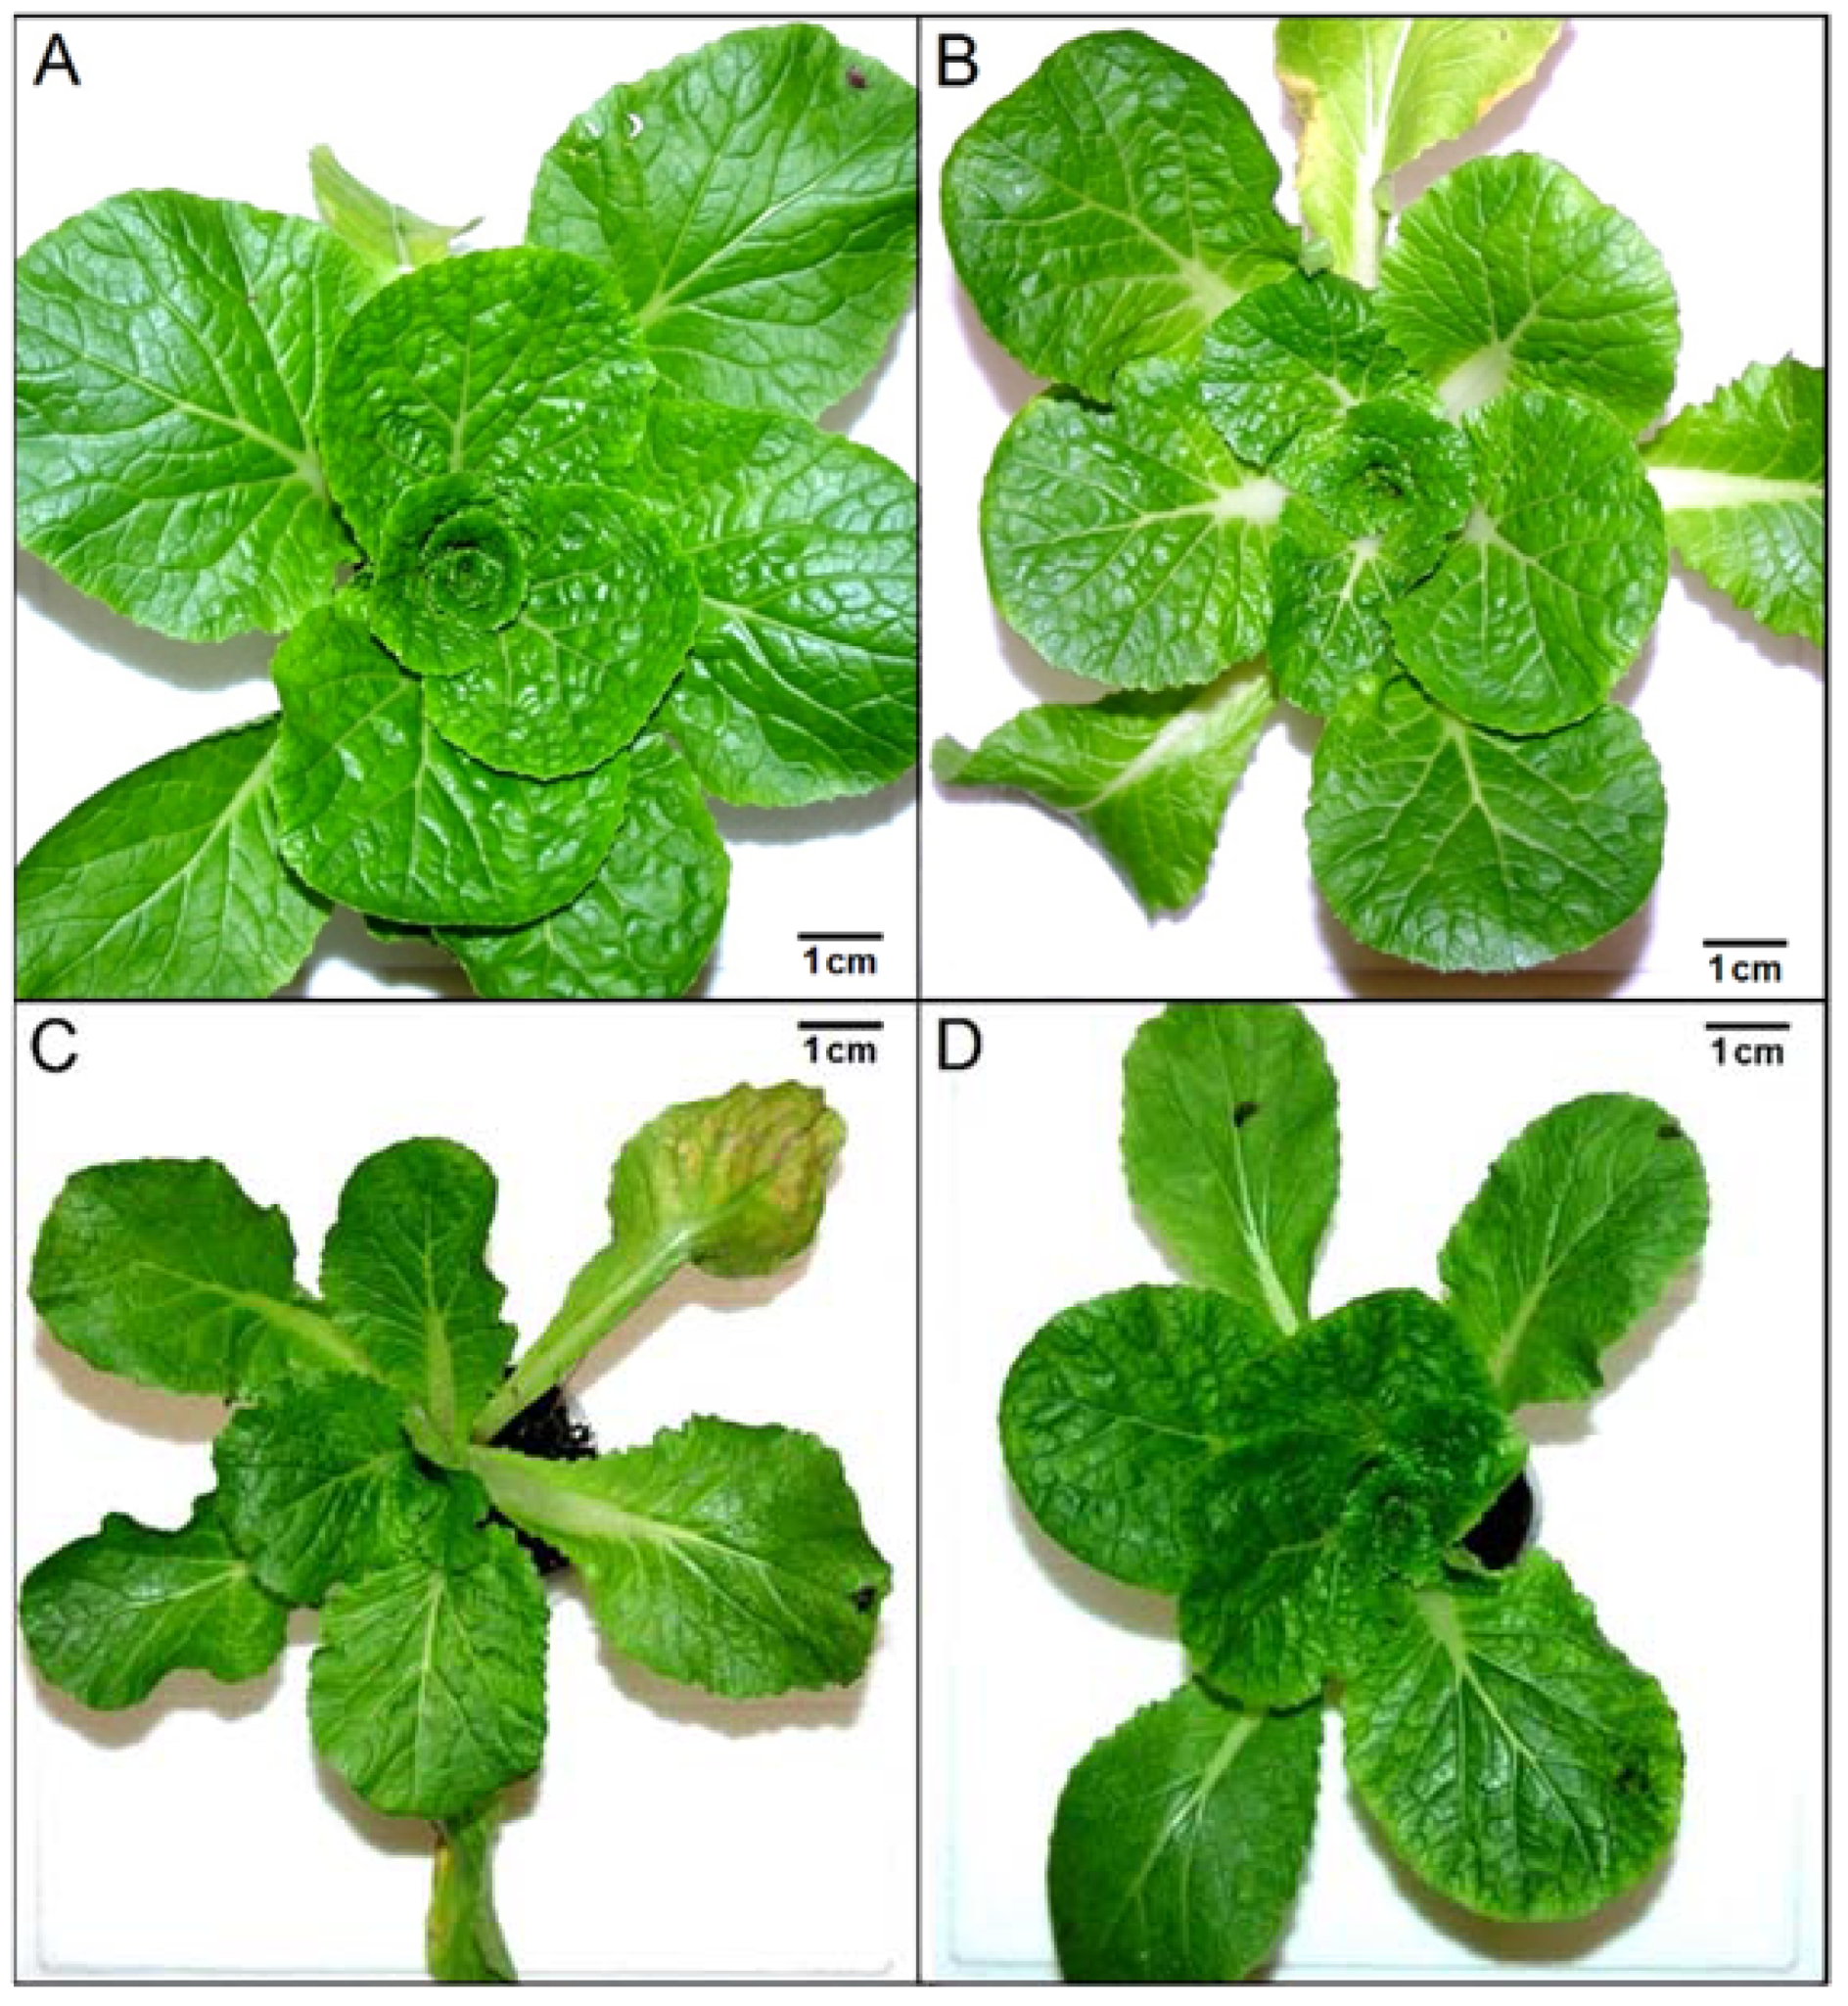
2.1. Morphological Changes

Plants after 21 days of exposure to 100-ppb O3 depending on the spectral composition of light are shown in Figure 1. After O3 exposure, no symptoms typical of ozone stress, i.e., chlorosis or necrosis, were observed. Ozone plants growing in YL and WL, Figure 1A and Figure 1B, respectively, had a much larger leaf blade size than in RGBL and WBL. In addition, WBL plants showed an increase in the length of petioles (Figure 1C).

2.2. Chlorophyll a Fluorescence

The maximum photochemical yield of PSII, measured as Fv/Fm in all ozonated and control plants, varied slightly (Table 1). Despite slight differences in the Fv/Fm values, WL, RGBL and WBL plants showed a statistically significant increase in this parameter after 21 days of O3 fumigation. The performance index of PSII (PIABS) best differentiated the response of plants to the spectral composition of light and exposure to ozone (Table 1). In YL plants under the influence of O3, there was a decrease in PIABS value, while, in plants at other light spectra, a significant increase in this parameter was observed (especially in RGBL).
Phenomenological energy fluxes per excited cross-section such as RC/CSm and ABS/CSm were generally not significantly different after treatment with O3 in plants growing in WL, RGBL and WBL (exception RC/CSm in RGBL) but fell in YL (Table 1). Additionally, TR0/CSm and ET0/CSm values describing trapping and energy transfer in PSII were reduced in YL after fumigation, and in other spectral compositions, they increased or remained unchanged. Energy dissipation by PSII estimated based on DI0/CSm decreased in ozonated plants growing in WL, RGBL and WBL compared to controls but did not change in YL.

2.3. Gas Exchange Measurements

Net photosynthesis (PN) slightly decreased after O3 fumigation in YL and WBL plants, while WL plants showed a PN increase. There were no significant differences in plants growing in RGBL. Generally, the PN value of control plants in WL was the lowest and, in YL even after fumigation, remained the highest of all treatments. Values of the parameters connected with gas exchange, i.e., transpiration (E), stomatal conductance to water (gs) and intracellular CO2 concentration (Ci) decreased under the influence of O3 in YL and increased significantly in the other spectral compositions of light (Table 2). After 21 days of exposure to O3, the highest values of most of the above parameters were recorded in plants growing in RGBL.

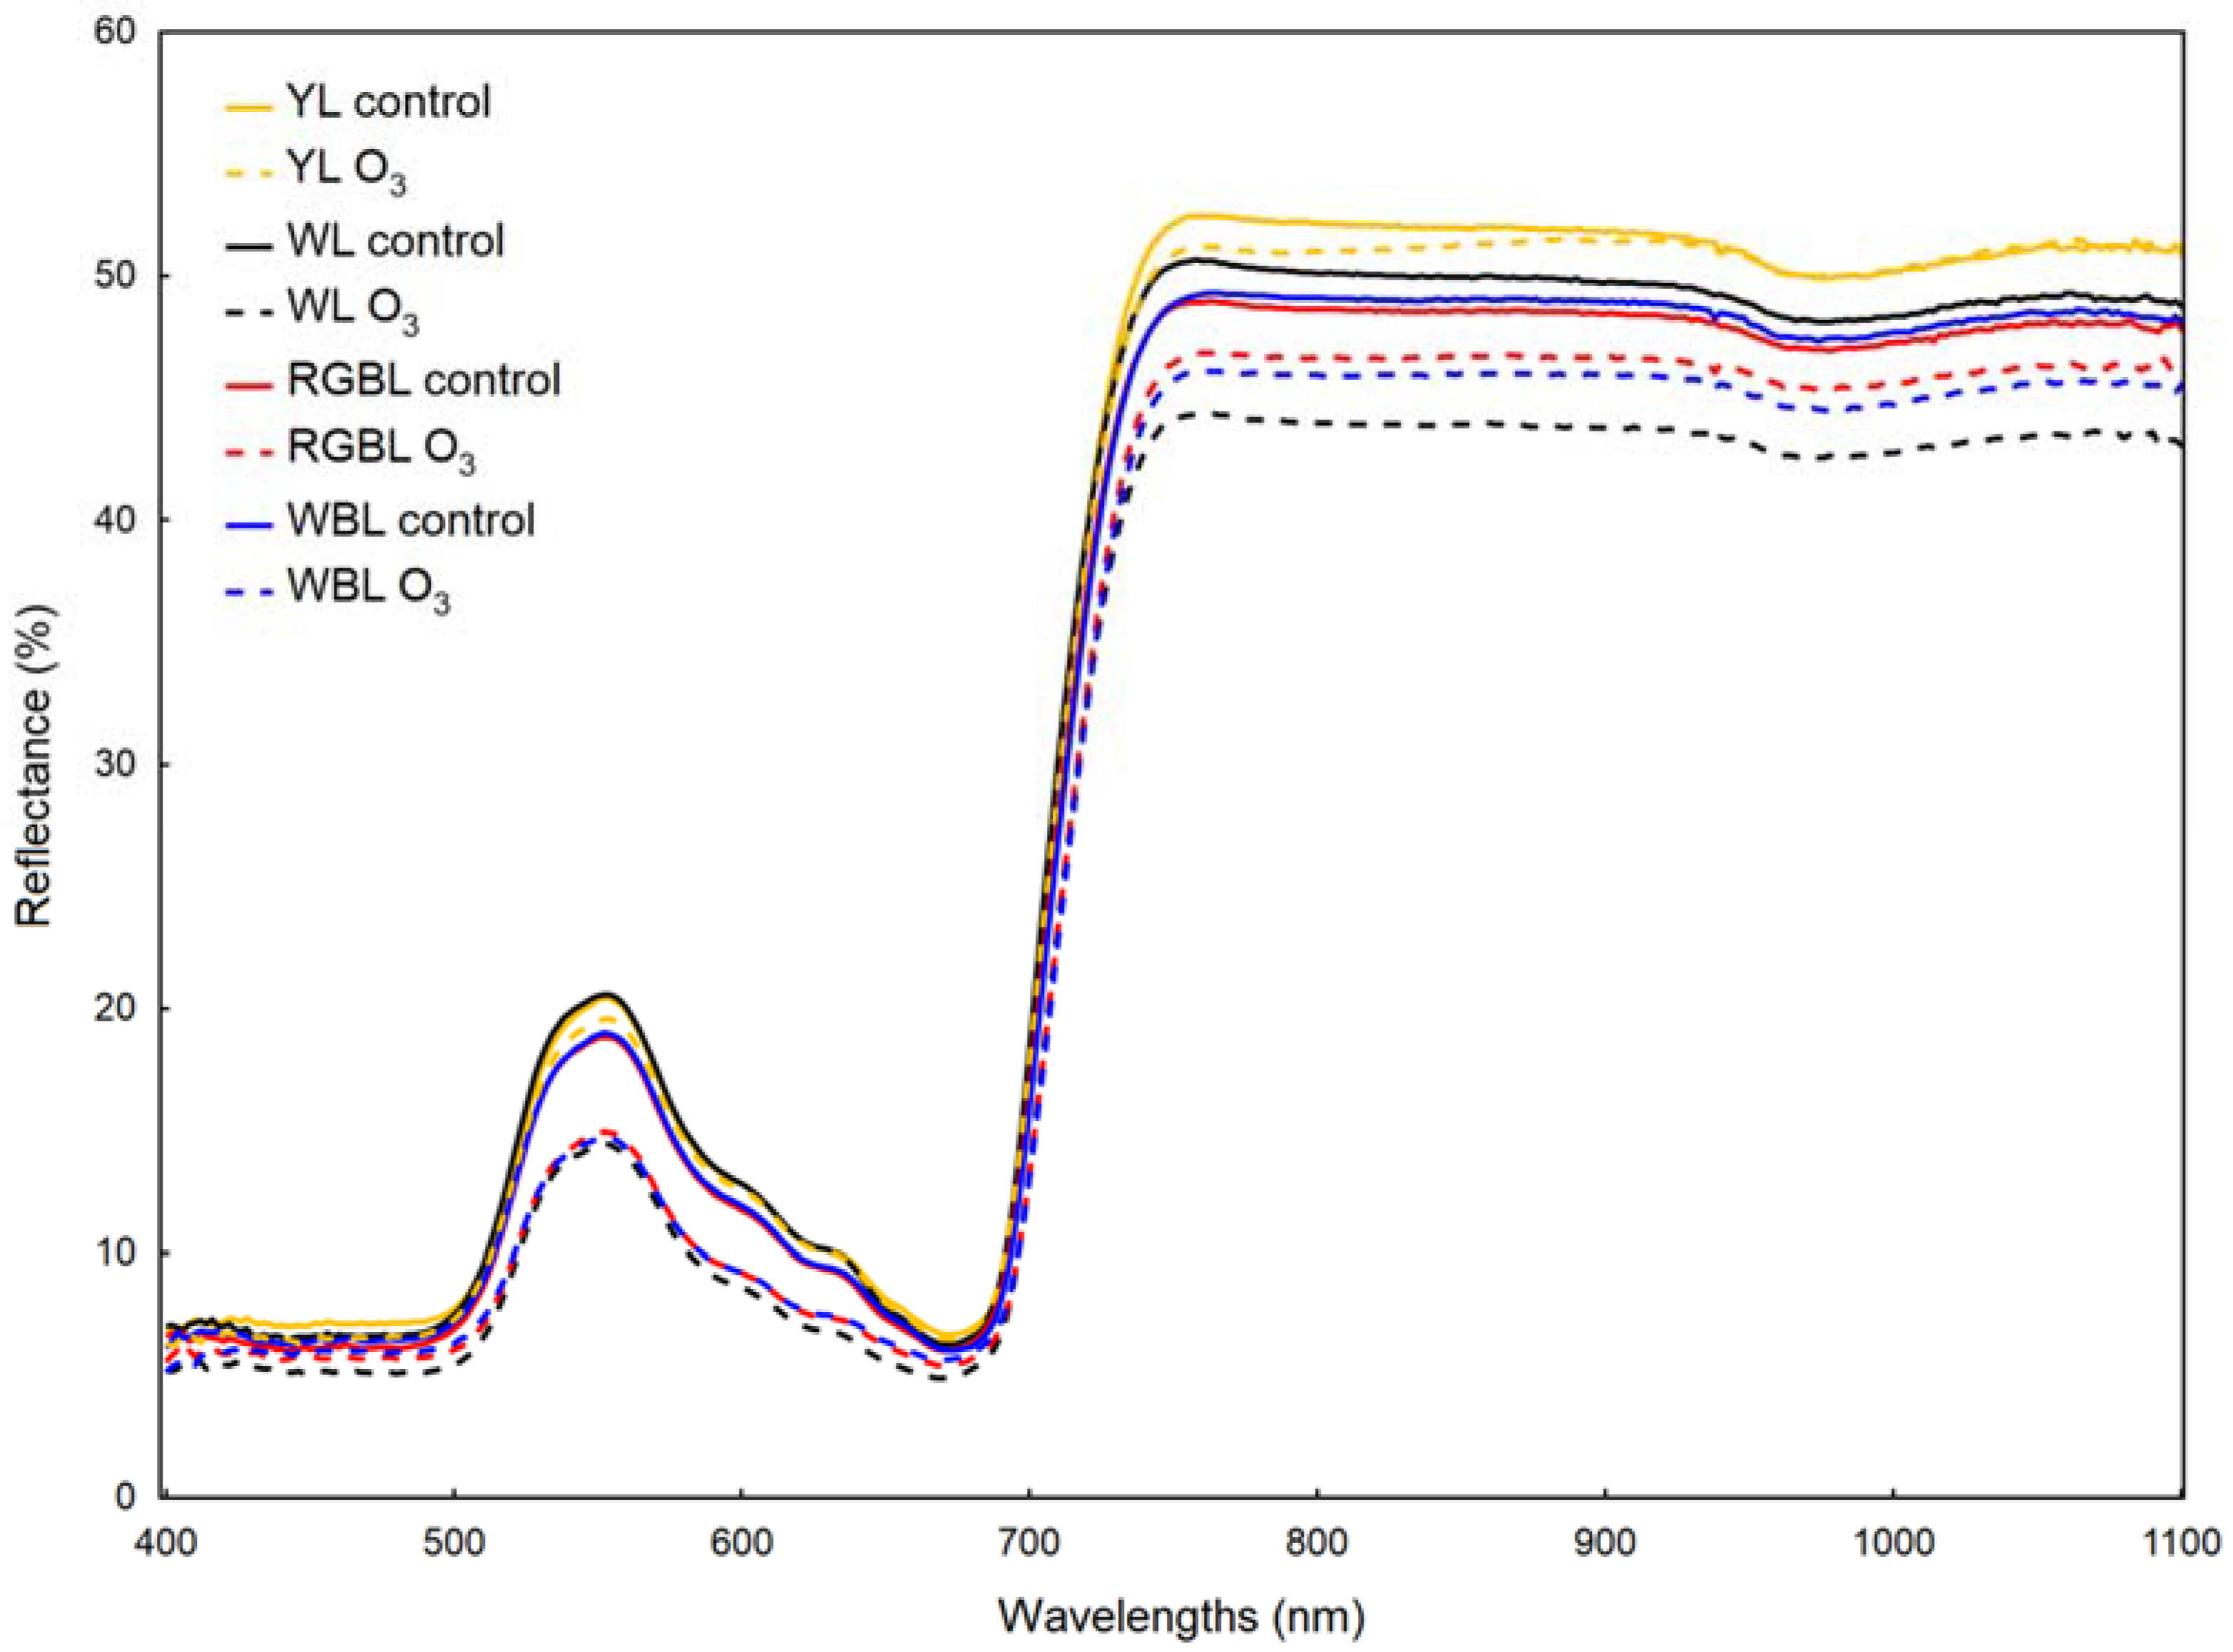
2.4. Reflectance Measurements

The spectrum of reflectance from leaves in the visible region (peak around 550 nm) was reduced after O3 fumigation in plants growing in WL, RGBL and WBL (Figure 2). The percentage reflectance values in the infrared region of spectrum (NIR) were variable, and the largest decrease under ozone in the WL plants spectrum occurred. In the whole 400–1100-nm range analysed, the spectra of YL plants did not change significantly after O3 exposure (Figure 2).
The spectral composition of light significantly affected the changes in the content of protective dyes such as anthocyanins and flavonols. The total anthocyanins pool expressed by the ARI2 value increased under the influence of O3 in plants from all spectral compositions, except for RGBL, with the highest increase observed in YL plants (Table 3). After 21 days of O3 treatment, the anthocyanin content in YL and WL plants was similar. A very large increase in the content of flavonols (FRI) after ozone exposure took place in leaves growing under WBL. In the case of YL, WL and RGBL plants, this increase was significantly smaller (Table 3). The structure independent pigment index (SIPI) did not differ between treatments. Additionally, tissue hydration (water band index—WBI) was not dependent on light conditions and exposure to ozone (Table 3).

2.5. Chlorophyll Content

The chlorophyll content expressed in SPAD units was similar for all O3-treated and control plants, regardless of the light spectrum (Table 4). Only on the bottom side of the leaves in YL, a slight decrease in the content of Chl after ozonation was observed.

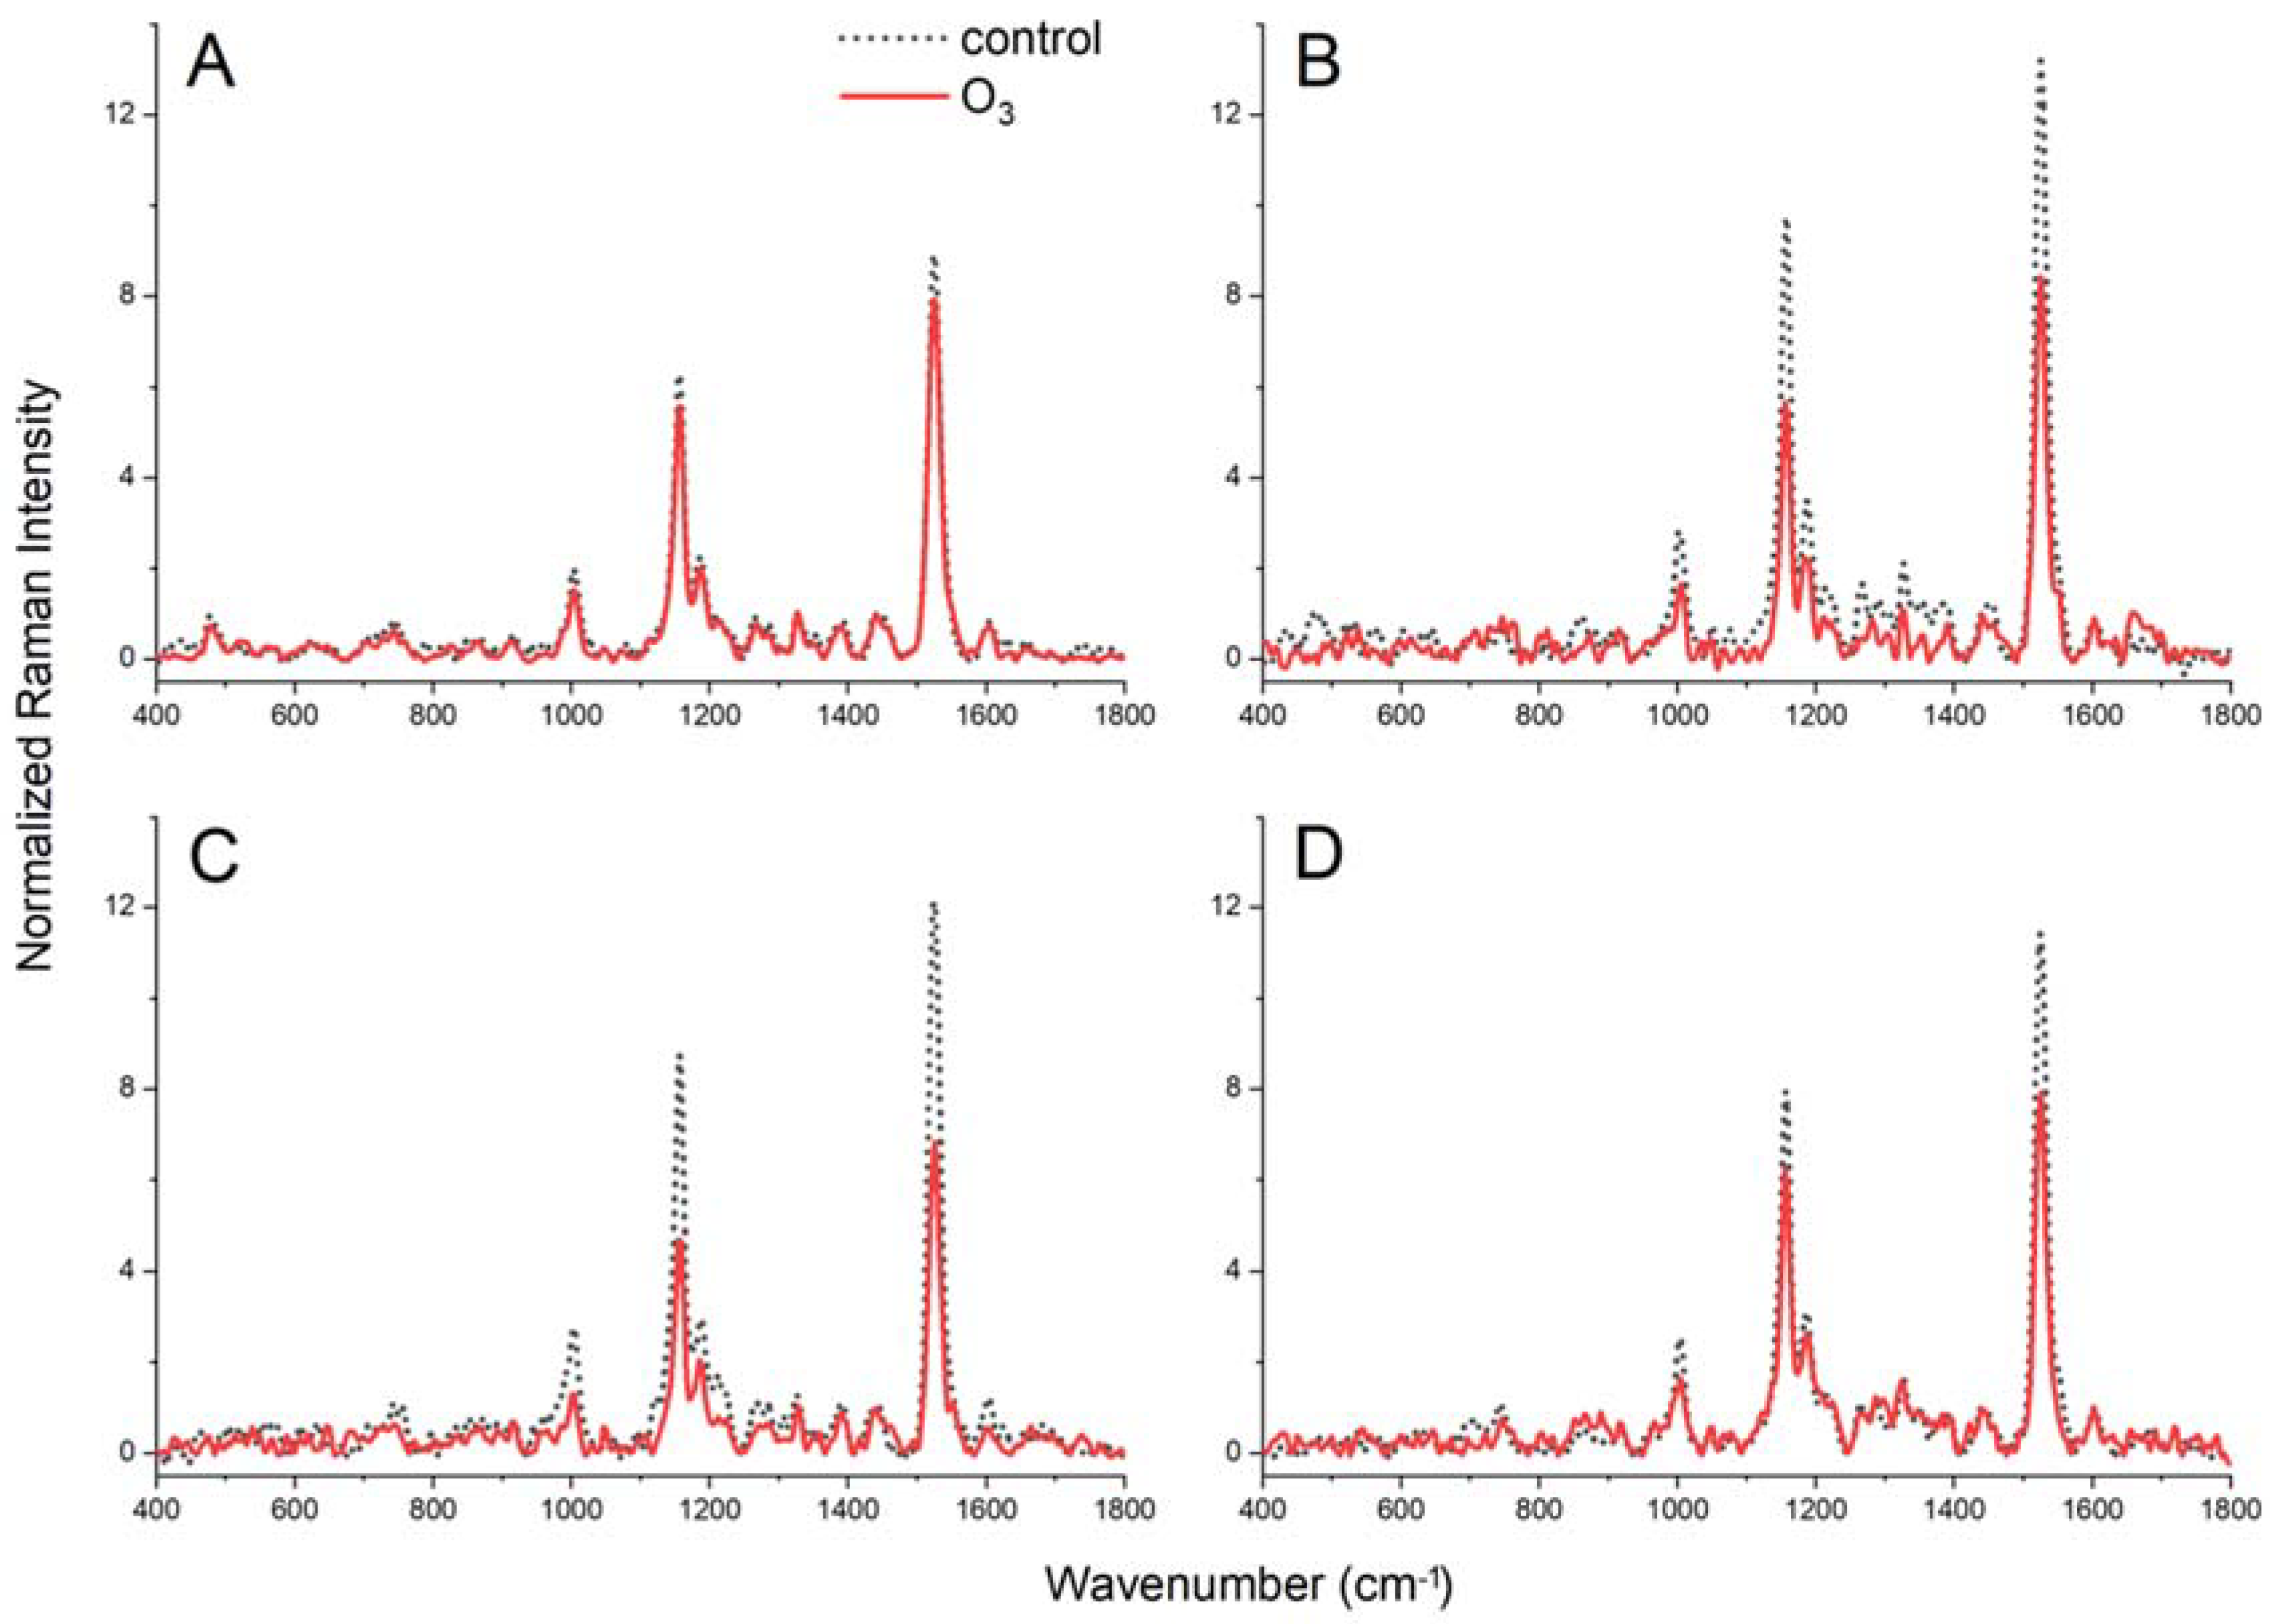
2.6. FT-Raman Spectroscopy Measurements

Table S1 presents the identification of chemical compounds assigned to bands in the obtained Raman spectra shown in Figure 3. The most characteristic are bands derived from carotenoids localised at 1005, 1158 and 1525 cm−1, the so-called carotenoid triplets [32,33]. The peaks observed at 1158 and 1525 cm−1 are attributed to –C–C and C=C-stretching vibrations of the polyene chain, respectively. Furthermore, the position of the band at 1525 cm−1 suggests that the carotenoid moiety possesses nine conjugated C=C bonds. It should also be noted that the band at 1158 cm−1 is formed as an imposition, with the weaker band deriving from deformation vibrations δ(CH) in phenolic compounds [34]. The low-intensity band at 1005 cm−1 reflected –CH3 groups attached to the main chain coupled with –C–C bonds [32,35].
In non-fumigated YL plants, the intensity of the carotenoid triplets was weaker compared to WL, WBL and RGBL plants. After O3 treatment, the decrease of the carotenoid triplet intensity was observed in WL, WBL and RGBL (up to 50% for WL and WBL compared to the control), and a significantly lower decrease was registered in YL (app. 12%). Furthermore, at frequencies 746, 1186, 1282 and 1552 cm−1, vibrations characteristic of chlorophylls were identified [32,34,35,36,37]. However, it is important to add that the band localised at 1552 cm−1 originates from the superposition of chlorophylls and phenolic compounds [38]. In the range of 1250–1400 cm−1, there are several peaks that indicate the presence of stretching and deformation vibrations specific to the -CH, -CH2 and -CH3 groups that are responsible for building chains of fatty compounds [37,39,40]. In the presented spectra, the bands at 1602 cm−1 originating from phenyl ring vibrations are also visible, which endorses the phenolic compound presence in examined plant samples.
The effect of the spectral composition of light and ozone on the chemical composition of the leaves was investigated using a hierarchical similarity analysis (Figure 4A and Figure 4B, respectively). Increased ozone concentrations in different spectral compositions of light differentiate the chemical compositions of leaves more than the light colour itself. In the case of ozone-treated plants, two main clusters that connect leaves of similar chemical composition could be distinguished: the first for YL and WBL and the second for WL and RGBL (Figure 4B).

3. Discussion

3.1. Morphological Differences

A change in the spectral composition of light significantly affects a plant’s anatomy and morphology [41]. In our experiment, dominance of the selected wavelength in the spectrum (blue—WBL or red—RGBL) in combination with an increased concentration of O3 resulted in differences in plant habits (size reduction of the leaf blade) compared with plants from YL and WL (Figure 1). Moreover, WBL plants showed petiole elongation, which should be explained by a hyponastic response [2]. A similar effect on leaf development was demonstrated in Brassica oleracea with an increase in the value of the R/FR ratio in the light spectrum [42]. Sometimes, an increased ozone concentration may have a positive effect on the rosette size and leaf number in Brassica plants [14]. However, the simultaneous effects of ozone and qualitative changes in lighting can also induce stress reactions in plants [12].

3.2. The Physiological Effect of Ozone and Yellow LIGHT (YL) on Plants

In plants growing in YL, ozone induced an increased production of compounds aimed at protecting PSII against the adverse effects of ROS—increase in ARI2 and FRI values (Table 3). Despite the synthesis of antioxidants in YL plants, ozone reduced the efficiency of the photosynthesis light phase, which was manifested in a decrease in the density of active PSII reaction centres calculated on the surface of the excited sample (RC/CSm), a decreased energy absorption by the excited photosynthetic surface (ABS/CSm). This was confirmed by the parameters of the trapping efficiency and energy transport by PSII of the excited sample (TR0/CSm and ET0/CSm). The PIABS value also decreased. The changes in PIABS perfectly reflect the overall functioning of PSII, because they combine information about the number of active RCs per Chl molecule and the initial reactions of the light phase with data on the electron flux through the RC [18]. For this reason, this parameter allows a comprehensive assessment of the state of PSII and is interpreted as a measure of the internal strength of the plant that allows it to counteract the stress symptoms [43].
Sunlight can change the reaction of leaves to O3 mainly by reducing the rate of electron transport in PSII [12]. In our research, exposure to an elevated O3 concentration has slightly reduced the efficiency of photosynthesis in B. rapa leaves growing in YL (Table 2), which is often the observed effect of ozone. We suggest that the decrease in net photosynthesis in this case was due to stomatal limitation, which was aimed at reducing the intensity of O3 diffusion [44,45]. This corresponds to a decrease in stomatal conductance, intercellular CO2 concentration and transpiration (Table 2). Ozone diffusion by stomata and the local accumulation of excess ROS is also evidenced by a slight decrease in the chlorophyll content observed only on the bottom side of the leaves growing in YL (Table 4). Despite this, no negative changes in the leaf morphology and plant habit were observed.

3.3. Physiological Response of Plants to Ozone under LED Lighting

In contrast to YL plants, we observed a positive effect of ozone in Chinese cabbage leaves in WL, RGBL and WBL on the photosynthesis parameters. After O3 fumigation, PIABS values in RGBL increased almost twice, which shows a significant increase in energy conversion efficiency in PSII under the influence of O3 [46]. However, a large increase in the value of PIABS and a slight increase in the value of Fv/Fm were visible in all plants growing under the LED light, despite the lack of differences in chlorophyll content (Table 4) and the density of PSII reaction centres on chlorophyll (RC/CSm—Table 1). This was accompanied by an increase in the efficiency of energy transfer by excited chlorophyll (ET0/CSm) and a decrease in energy dissipation by chlorophyll (Di0/CSm). Thus, in white light and in the spectrum with predominantly red or blue colour, ozone not only did not interfere with the photosynthesis light reaction processes but even increased the efficiency of the light-dependent reactions. Combined with the increase in ARI2 values in WL and WBL plants and FRI in RGBL and WBL plants (Table 3), this indicates the involvement of de novo synthesised pigments (anthocyanins and flavonols) in better energy distribution in PSII after exposure to ozone. The accumulated pigments can act as an antioxidant system that prevents the generation of ROS and as a photoprotective compound [47,48]. Ozone, absorbed by stomata, quickly penetrates the intercellular spaces and interacts with water and other compounds in the apoplast (e.g., thiols or phenols), inducing the formation of reactive oxygen species (ROS), the excess of which leads to membrane lipid ozonolysis and protein damage [49,50]. This stimulates the increased synthesis of compounds whose function is to protect thylakoid chloroplast membranes against damage by ROS [47,51,52]. This is particularly important when exposing P680 triplets to singlet oxygen [53,54]. The rapid synthesis of anthocyanins and flavonols supports the inhibition of ROS production and stabilises chloroplast membranes [55]. Interestingly, at the same time, it was noticed that O3 fumigation led to a decrease in the intensity of the carotenoid triplets compared to the control (Figure 3). This indicates a reduction in the carotenoid pool and suggests their minor role in the response to ozone stress in WL, RGBL and WBL plants.
Low values of E, gs and Ci in control plants growing in WL, RGBL and WBL increased significantly after 21 days of exposure to O3 (Table 2). In WL plants, which, under control conditions, achieved significantly lower PN values than YL and RGBL, this value increased after fumigation. This indicates an increase in the activity of photosynthesis, probably due to an increase in the supply of energy from light reactions (Table 1). Additionally, according to Kleiber et al. [13], lettuce, whose seeds were ozonated, showed the largest increase in photosynthetic activity in WBL. In addition, the positive effect of ozone was dependent on the light spectral composition, and the highest effect was observed for WL.

4. Materials and Methods

4.1. Plant Materials

Sprouted Chinese cabbage seeds (Brassica rapa subsp. pekinensis) variety Optico F1 were sown into seedbeds with soil substrate and placed in a phytotron chamber for a period of three weeks. Seedlings grew under sodium lamps widely used in greenhouse and tunnel crops. The light source was a Philips SON–T AGRO 400W lamp (Agro Care, Rilland, The Netherlands), and the photon flux density was 300-µmol quantum m−2 s−1. The growth temperature was set at 18 °C/14 °C and photoperiod at 12h/12h (day/night, respectively). The relative humidity (RH) was kept at 80%. When the seedlings reached stage 4/5 of the leaves, the plants were divided into four groups: one part was left under yellow light (YL—sodium lamp), and the other was transferred to white light (WL), white light supplemented with blue light (WBL) and red-green-blue light (RGBL). The light sources were LED matrices made using white, blue and RGB LEDs, 1W each. All matrices consisted of 225 diodes. In the WL spectrum, the intensity ratio of blue/red light ≅ 1 and in WBL > 1, while in RGBL < 1. The spectra of the light sources were determined by a Mini-spectrometer TM-VIS/NIR C10083CAH (Hamamatsu, Japan) and are shown in Figure S1. All other parameters such as temperature, day length, RH and PFD remained unchanged. Plants were fumigated with 100-ppb ozone for three weeks, 8 h per day (during the light period). The Aqua Medic Ozone 50 generator (Aqua Medic, Poznan, Poland) was used to generate ozone, and the O3 level was controlled using a 49C Photometric Ozone Analyser (Thermo Environmental Instruments, Franklin, MA, USA). Control plants (not treated with ozone) grew under analogous lighting, temperature and humidity conditions as the plants treated with ozone. Experiments were carried out in 7 replications (1 single plant was the replication). All measurements were performed after 21 days of plant growth in 100-ppb O3 or under the control conditions for each type of lighting.

4.2. Chlorophyll a Fluorescence

Measurements of the Chla fluorescence kinetics parameters were made with a Handy-PEA fluorometer (Hansatech Instruments, Narborough, UK), according to Strasser et al. [56]. Each time, the leaf blade fragments were acclimated to darkness for 20 min. The Chla fluorescence was induced with 3500-μmol quantum m−2 s−1 radiation (650-nm peak wavelength, 22-nm half-width spectral line). The data were read in the PEA Plus program (Hansatech Instruments, Narborough, UK). Fluorescence parameters were calculated automatically: maximum quantum yield of PSII (Fv/Fm) and performance index of PSII based to absorption (PIABS). Moreover, the following phenomenological indices of energy flow converted to the excited surface of the leaf were determined: density of reaction centres (RC/CSm), absorption of light energy (ABS/CSm), excitation energy trapped in PSII reaction centres (TR0/CSm), energy used for electron transport (ET0/CSm) and energy dissipated from PSII (DI0/CSm).

4.3. Gas Exchange Measurements

Photosynthesis rate (PN), stomatal conductance (gs), transpiration rate (E) and internal CO2 concentration (Ci) values were measured using an LI-COR 6400 (Li-Cor, Lincoln, NE, USA) infrared gas analyser in an open system. All measurements were made on the seventh leaf.

4.4. Chlorophyll Content

Measurements of the Chl content were taken using the SPAD 502 Chlorophyll Meter (Konica Minolta, Tokyo, Japan). The SPAD values were calculated based on the amount of radiation transmitted by the leaf at 650 and 940 nm. For each plant, the 7th leaf was selected, on which the Chl content was measured 3 times, and then, the internal mean was calculated.

4.5. Reflectance Measurements

The leaf reflectance was measured using the LI-1800 spectroradiometer (Li-Cor, Lincoln, NE, USA) with a−12 S external integrating sphere in the range 400–1100 nm [57]. Based on the spectra obtained, the following reflection parameters were calculated:
  • Anthocyanin Reflectance Index (ARI2) = [(R550−1) − (R700−1)] R800, Gitelson et al. [58];
  • Flavonol Reflectance Index (FRI) = [(R410)−1 − (R460)−1] R800, Merzlyak et al. [59];
  • Structure-Insensitive Pigment Index (SIPI) = (R800 − R445) (R800 + R680) − 1, Peñuelas et al. [60];
  • Water Band Index (WBI) = R900∙(R970)−1, Peñuelas et al. [61];
    where Rx—means the intensity of reflectance at a specific wavelength x.

4.6. FT-Raman Spectroscopy Measurements

FT-Raman measurements were performed on lyophilised leaves of Chinese cabbage using a Nicolet NXR 9650 Fourier-Transform Raman spectrometer (Thermo Scientific, Waltham, MA, USA) equipped with a Nd:YAG3+ laser emitting a beam at the 1064-nm wavelength and an InGaAs detector. The measurements were done at room temperature, an aperture of 80 and a spectral resolution of 4 cm−1. All spectra were recorded with a laser power of 0.4 W and analysed in the range of 400–2000 cm−1. The number of accumulations for each spectrum was equal to 128 scans. Each measurement was done in 10 repeats and averaged. The spectra were baseline-corrected and normalised to the 1441-cm−1 band, whichis typical for C-H vibrations originating most likely from the CH3, CH2, and CH functional groups in lipids, amino acid side chains of the proteins and carbohydrates [62,63]. The analysis of the spectra was carried out using Omnic 8 (Thermo Scientific, Waltham, MA, USA) and OriginPro 2017 (OriginLab Corporation, Northampton, MA, USA) software packages for Windows.
Similarities between FT-Raman spectra were studied using hierarchical cluster analysis using the Statistica software package 13 (TIBCO Software, Palo Alto, CA, USA). The cluster analysis was performed for the whole wavenumber range using Ward’s algorithm. The spectral distances were calculated with the standard algorithm.

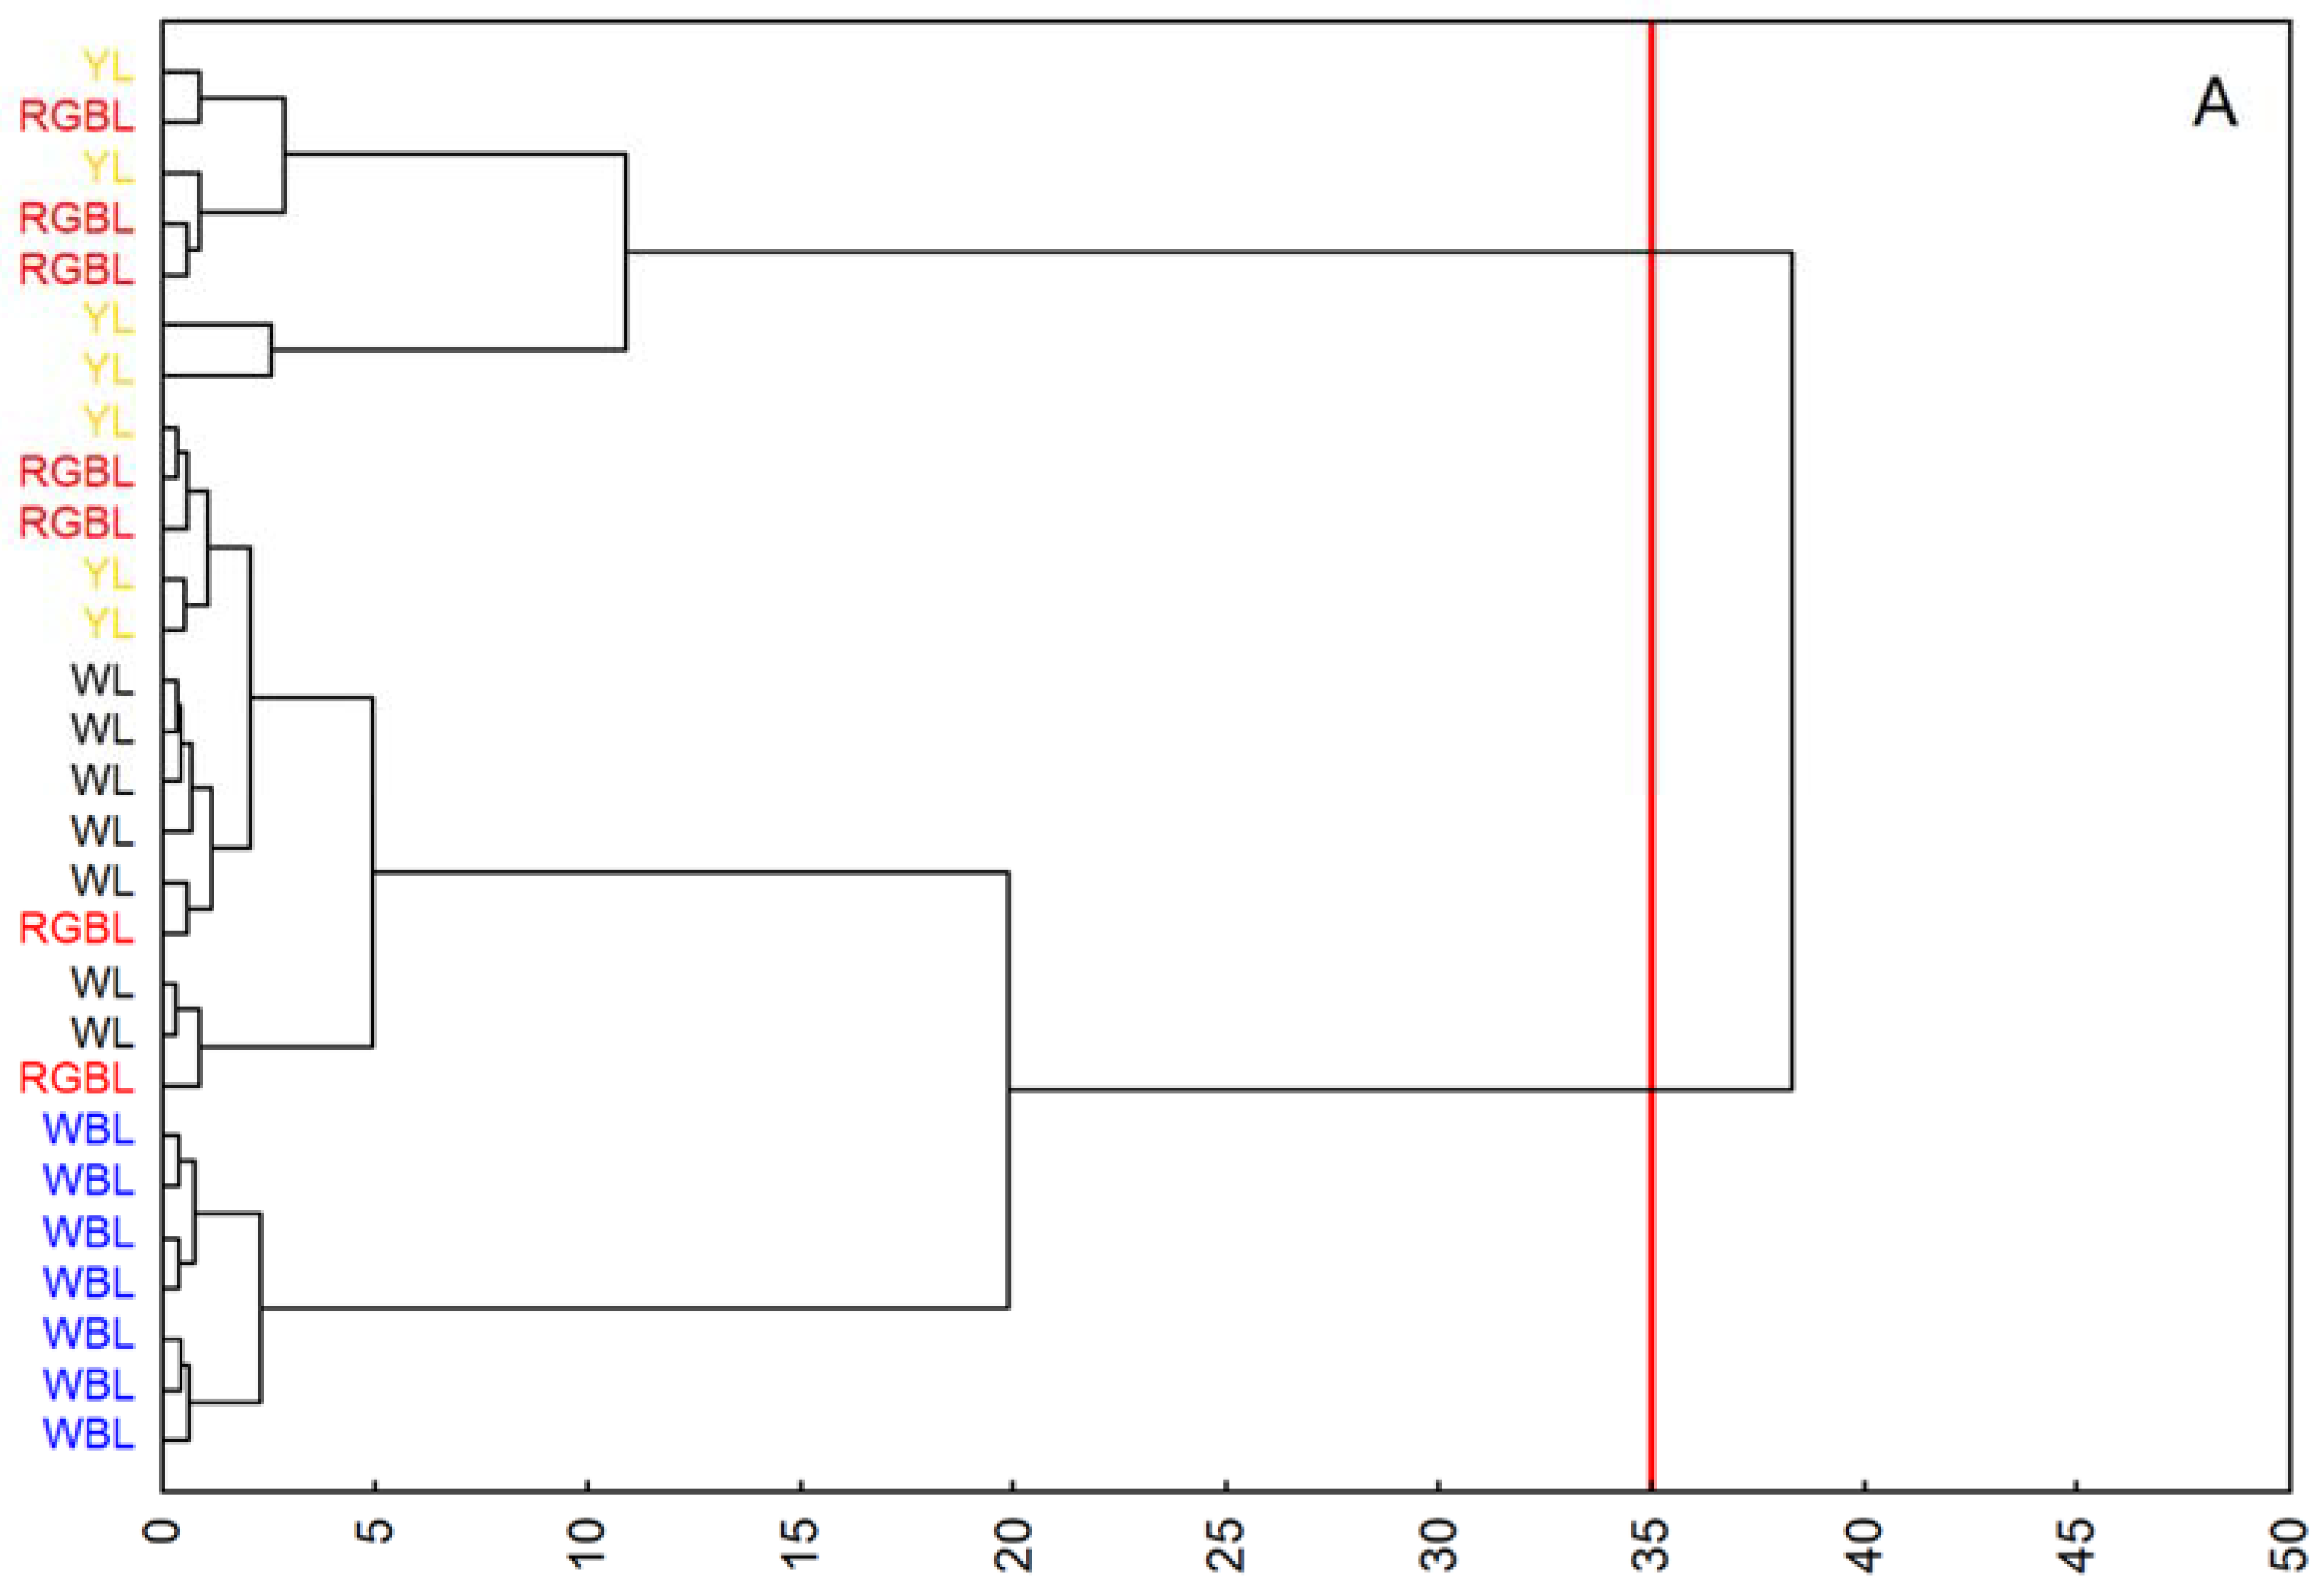
4.7. Statistical Analysis

The Chla fluorescence, gas exchange and leaf reflectance parameters were analysed using the program Statistica 13 (TIBCO Software, Palo Alto, CA, USA) using a one-way or multifactorial analysis of variance (ANOVA). The significance of the differences between averages was tested using Duncan’s test or Tukey’s test (for various N) at a significance level of p ≤ 0.05.

5. Conclusions

The photosynthetic activity of plants exposed to an elevated ozone concentration depends on light conditions. This translates into the processes of growth and development and, in the cultivated species, also, their value in use.
White light (WL) and spectrum with a predominant red (RGBL) or blue colour (WBL) increases plants’ ozone tolerance. Especially in plants growing in WL and WBL, exposure to an elevated O3 concentration stimulates photosynthesis light reactions and leads to an increase in transpiration, stomatal conductance and intracellular CO2 concentration, which, however, does not correspond directly with the morphological features of plants.
The spectral composition strongly differentiates the plant response to ozone; therefore, when conducting research on the influence of this factor on the physiological processes of plants in controlled conditions, it is necessary to precisely specify the quality parameters of the lighting used.

Supplementary Materials

The following supporting information can be downloaded at https://www.mdpi.com/article/10.3390/ijms23062941/s1. References [64,65,66,67,68] are cited in the Supplementary Materials.

Author Contributions

A.S. and I.C.-M. conceived and designed the research. A.S. designed and constructed the growth chambers with LED matrices and apparatus for the ozonation of plants. M.K. was responsible for the photosynthesis measurements. M.R. and I.S. performed and developed the FT-Raman analyses. J.O. and A.S. prepared the data, conducted the statistical analysis and wrote the manuscript. All authors have read and agreed to the published version of the manuscript.

Funding

This research received no external funding.

Institutional Review Board Statement

Not applicable.

Informed Consent Statement

Not applicable.

Data Availability Statement

Data are contained within the article.

Acknowledgments

We would like to thank Monika Wdowin for help in taking measurements and Jan Pilarski for performing spectral analyses of light sources and measuring optical properties of leaves. We also thank Andrzej Kornas for valuable substantive comments provided during the editing of this manuscript.

Conflicts of Interest

The authors declare no conflict of interest. The funders had no role in the design of the study; in the collection, analyses or interpretation of the data; in the writing of the manuscript or in the decision to publish the results.

References

  1. Hogewoning, S.W.; Trouwborst, G.; Maljaars, H.; Poorter, H.; Iperen, W.; Harbison, J. Blue light dose-responses of leaf photosynthesis, morphology andchemical composition of Cucumis sativus grown under different combinationsof red and blue light. J. Exp. Bot. 2010, 61, 3107–3117. [Google Scholar] [CrossRef] [PubMed]
  2. Pedmale, U.V.; Huang, S.C.; Zander, M.; Cole, B.J.; Hetzel, J.; Ljung, K.; Reis, P.A.; Sridevi, P.; Nito, K.; Nery, J.R.; et al. Cryptochromes interact directly with PIFs to control plant growth in limiting blue light. Cell 2016, 164, 233–245. [Google Scholar] [CrossRef] [PubMed] [Green Version]
  3. Vingarzan, R. A review of surface ozone background levels and trends. Atmos. Environ. 2004, 38, 3431–3442. [Google Scholar] [CrossRef]
  4. Mills, G.; Hayes, F.; Simpson, D.; Emberson, L.; Norris, D.; Harmens, H.; Büker, P. Evidence of widespread effects of ozone on crops and (semi-)natural vegetation in Europe (1990–2006) in relation to AOT40- and flux-based risk maps. Glob. Chang. Biol. 2011, 17, 592–613. [Google Scholar] [CrossRef] [Green Version]
  5. Schneider, G.F.; Cheesman, A.W.; Winter, K.; Turner, B.L.; Sitch, S.; Kursar, T.A. Current ambient concentrations of ozone in Panama modulate the leaf chemistry of the tropical tree Ficus insipida. Chemosphere 2017, 172, 363–372. [Google Scholar] [CrossRef] [Green Version]
  6. Degl’Innocenti, E.; Guidi, L.; Soldatini, G.F. Characterisation of the photosynthetic response of tobacco leaves toozone: CO2 assimilation and chlorophyll fluorescence. J. Plant Physiol. 2002, 159, 845–853. [Google Scholar] [CrossRef]
  7. Tetteh, R.; Yamaguchi, M.; Wadac, Y.; Funadad, R.; Izutad, T. Effects of ozoneon growth, net photosynthesis and yield of two African varieties of Vigna unguiculata. Environ. Pollut. 2015, 196, 230–238. [Google Scholar] [CrossRef]
  8. Emberson, L.; Pleijel, H.; Ainsworth, E.; Van Den Berg, M.; Ren, W.; Osborne, S.; Mills, G.; Pandey, D.; Dentener, F.; Bueker, P.; et al. Ozone effects on crops and consideration in crop models. Eur. J. Agron. 2018, 100, 19–34. [Google Scholar] [CrossRef]
  9. Booker, F.; Muntifering, R.; McGrath, M.; Burkey, K.; Decoteau, D.; Fiscus, E.; Manning, W.; Krupa, S.; Chappelka, A.; Grantz, D. The ozone component of global change: Potential effects on agricultural and horticultural plant yield, product quality and interactions with invasive species. J. Integr. Plant Biol. 2009, 51, 337–351. [Google Scholar] [CrossRef]
  10. Bergmann, E.; Bender, J.; Weigel, H.J. Impact of tropospheric ozone on terrestrial biodiversity: A literature analysis to identify ozone sensitive taxa. J. Appl. Bot. Food Qual. 2017, 90, 83–105. [Google Scholar] [CrossRef]
  11. Fiscus, E.L.; Miller, J.E.; Booker, F.L.; Heagle, A.S.; Reid, C.D. The impact of ozone and other limitations on the crop productivity response to CO2. Technology 2002, 8, 181–192. [Google Scholar]
  12. Guidi, L.; Degl’Innocenti, E. Ozone effects on high light-induced photoinhibition in Phaseolus vulgaris. Plant Sci. 2008, 174, 590–596. [Google Scholar] [CrossRef]
  13. Kleiber, T.; Borowiak, K.; Schroeter-Zakrzewska, A. Effect of ozone treatment and light colour on photosynthesis andyield of lettuce. Sci. Hortic. 2017, 217, 130–136. [Google Scholar] [CrossRef]
  14. Rozpądek, P.; Ślesak, I.; Cebula, S.; Waligorski, P.; Dziurka, M.; Skoczowski, A.; Miszalski, Z. Ozone fumigation results in accelerated growth and persistent changes in the antioxidant system of Brassica oleracea L. var. capitata f. alba. J. Plant Physiol. 2013, 170, 1259–1266. [Google Scholar] [CrossRef]
  15. Bussotti, F.; Strasser, R.J.; Schaub, M. Photosynthetic behavior of woody species under high ozone exposure probed with the JIP-Test—A review. Environ. Pollut. 2007, 147, 430–437. [Google Scholar] [CrossRef]
  16. Steyn, W.J.; Wand, S.J.E.; Holcroft, D.M.; Jacobs, G. Anthocyanins in vegetative tissues: A proposed unified function in photoprotection. New Phytol. 2002, 155, 349–361. [Google Scholar] [CrossRef]
  17. Neill, S.O.; Gould, K.S. Anthocyanins in leaves: Light attenuators or antioxidants? Funct. Plant Biol. 2003, 30, 865–873. [Google Scholar] [CrossRef] [Green Version]
  18. Kalaji, M.H.; Jajoo, A.; Oukarroum, A.; Brestic, M.; Zivcak, M.; Samborska, I.A.; Cetner, M.D.; Łukasik, I.; Goltsev, V.; Ladle, R.J.; et al. The use of chlorophyll fluorescence kinetics analysis to study the performance of photosynthetic machinery in plants. Emerg. Technol. Manag. Crop Stress Toler. 2014, 2, 347–384. [Google Scholar] [CrossRef]
  19. Rapacz, M.; Sasal, M.; Kalaji, H.M.; Kościelniak, J. Is the OJIP test a reliable indicator of winter hardiness and freezing tolerance of common wheat and Triticale under variable winter environments? PLoS ONE 2015, 10, e0134820. [Google Scholar] [CrossRef] [PubMed] [Green Version]
  20. Żurek, G.; Rybka, K.; Pogrzeba, M.; Krzyżak, J.; Prokopiuk, K. Chlorophyll a fluorescence in evaluation of the effect of heavy metal soil contamination on perennial grasses. PLoS ONE 2014, 9, e91475. [Google Scholar] [CrossRef]
  21. Kalaji, M.H.; Jajoo, A.; Oukarroum, A.; Brestic, M.; Zivcak, M.; Samborska, I.A.; Cetner, M.D.; Łukasik, I.; Goltsev, V.; Ladle, R.J. Chlorophyll a fluorescence as a tool to monitor physiological status of plants under abiotic stress conditions. Acta Physiol. Plant 2016, 38, 102. [Google Scholar] [CrossRef] [Green Version]
  22. Bussotti, F.; Desotgiu, R.; Cascio, C.; Pollastrini, M.; Gravano, E.; Gerosa, G.; Marzuoli, R.; Nali, C.; Lorenzini, G.; Salvatori, E.; et al. Ozone stress in woody plants assessed with chlorophyll a fluorescence. A criticalreassessment of existing data. Environ. Exp. Bot. 2011, 73, 19–30. [Google Scholar] [CrossRef]
  23. Goumenaki, E.; Taybi, T.; Borland, A.; Barnes, J. Mechanisms underlying the impacts of ozone on photosynthetic performance. Environ. Exp. Bot. 2010, 69, 259–266. [Google Scholar] [CrossRef]
  24. Gottardini, E.; Cristofori, A.; Cristofolini, F.; Nali, C.; Pellegrini, E.; Bussotti, F.; Ferretti, M. Chlorophyll-related indicators are linked to visible ozone symptoms: Evidence from a field study on native Viburnum lantana L. plants innorthern Italy. Ecol. Indic. 2014, 39, 65–74. [Google Scholar] [CrossRef]
  25. Oliwa, J.; Skoczowski, A. The high red/far-red ratio supports the acclimation of fern Platycerium bifurcatum to high light. Biol. Futur. 2019, 70, 185–197. [Google Scholar] [CrossRef] [Green Version]
  26. Oliwa, J.; Kornas, A.; Skoczowski, A. Morphogenesis of sporotrophophyll leaves in Platycerium bifurcatum depends on the red/far-red ratio in the light spectrum. Acta Physiol. Plant 2016, 38, 247. [Google Scholar] [CrossRef] [Green Version]
  27. Solovchenko, A. (Ed.) Quantification of screening pigments and their efficiency in situ. In Photoprotection in Plants; Springer: Berlin/Heidelberg, Germany, 2010. [Google Scholar]
  28. Rys, M.; Pociecha, E.; Oliwa, J.; Ostrowska, A.; Jurczyk, B.; Saja, D.; Janeczko, A. Deacclimation of winter oilseed rape: Insight into physiological changes. Agronomy 2020, 10, 1565. [Google Scholar] [CrossRef]
  29. Rys, M.; Szaleniec, M.; Skoczowski, A.; Stawoska, I.; Janeczko, A. FT-Raman spectroscopy as a tool in evaluation the response of plants to drought stress. Open Chemistry 2015, 13, 1091–1100. [Google Scholar] [CrossRef]
  30. Skoczowski, A.; Rys, M. Isothermal calorimetry and Raman spectroscopy to study response of plants to abiotic and biotic stress. In Molecular Stress Physiology of Plants; Rout, G.R., Das, A.B., Eds.; Springer: New Delhi, India, 2013; pp. 263–288. [Google Scholar]
  31. Rys, M.; Saja-Garbarz, D.; Skoczowski, A. Phytotoxic effects of selected herbal extracts on the germination, growth and metabolism of mustard and oilseed rape. Agronomy 2022, 12, 110. [Google Scholar] [CrossRef]
  32. Schrader, B.; Klump, H.H.; Schenzel, K.; Schulz, H. Non-destructive NIR FT Raman analysis of plants. J. Mol. Struct. 1999, 509, 201–212. [Google Scholar] [CrossRef]
  33. Schulz, H. Qualitative and quantitative FT-Raman analysis of plants. In Optical Spectroscopy and Computational Methods in Biology and Medicine; Baranska, M., Ed.; Springer: Dordrecht, The Netherlands, 2014; pp. 253–278. [Google Scholar]
  34. Vitek, P.; Novotna, K.; Hodanova, P.; Rapantova, B.; Klem, K. Detection of herbicide effects on pigment composition and PSII photochemistry in Helianthus annuus by Raman spectroscopy and chlorophyll a fluorescence. Spectrochim. Acta Part A Mol. Biomol. Spectrosc. 2017, 170, 234–241. [Google Scholar] [CrossRef]
  35. Schulz, H.; Baranska, M.; Baranski, R. Potential of NIR-FT-Raman spectroscopy in natural carotenoid analysis. Biopolymers 2005, 77, 212–221. [Google Scholar] [CrossRef] [PubMed]
  36. Baranska, M.; Schulz, H.; Baranski, R.; Nothnagel, T.; Christensen, L.P. In Situ Simultaneous Analysis of Polyacetylenes, Carotenoids and Polysaccharides in Carrot Roots. J. Agric. Food Chem. 2005, 53, 6565–6571. [Google Scholar] [CrossRef]
  37. Schulz, H.; Baranska, M. Identification and quantification of valuable plant substances by IR and Raman spectroscopy. Vib. Spectrosc. 2007, 43, 13–25. [Google Scholar] [CrossRef]
  38. Heredia-Guerrero, J.A.; Benitez, J.J.; Dominguez, E.; Bayer, I.S.; Cingolani, R.; Athanassiou, A.; Heredia, A. Infrared and Raman spectroscopic features of plant cuticles: A review. Front. Plant Sci. 2014, 5, 14. [Google Scholar] [CrossRef] [PubMed] [Green Version]
  39. Muik, B.; Lendl, B.; Molina-Diaz, A.; Ayora-Canada, M.J. Direct monitoring of lipid oxidation in edible oils by Fourier transform Raman spectroscopy. Chem. Phys. Lipids. 2005, 134, 173–182. [Google Scholar] [CrossRef] [PubMed]
  40. Thygesen, L.G.; Lokke, M.M.; Micklander, E.; Engelsen, S.B. Vibrational microspectroscopy of food. Raman vs. FT-IR. Trends Food Sci. Technol. 2003, 14, 50–57. [Google Scholar] [CrossRef]
  41. Massa, G.D.; Kim, H.H.; Wheeler, R.M.; Mitchell, C.A. Plant Productivity in Response to LED Lighting. Hortic. Sci. 2008, 43, 1951–1956. [Google Scholar] [CrossRef]
  42. Paul, N.D.; Moore, J.P. Manipulation of light spectrum for crop growth regulation. Acta Hortic. 2006, 711, 357–362. [Google Scholar] [CrossRef]
  43. Bacarin, M.A.; Deuner, S.; da Silva, F.S.; Cassol, D.; Silva, D.M. Chlorophyll a fluorescence as indicative of the salt stress on Brassica napus L. Braz. J. Plant Physiol. 2011, 23, 245–253. [Google Scholar] [CrossRef] [Green Version]
  44. Novak, K.; Schaub, M.; Fuhrer, J.; Skelly, J.M.; Hug, C.; Landolt, W.; Bleuler, P.; Kräuchi, N. Seasonal trends in reduced leaf gas exchange and ozone-induced foliar injury in three ozone sensitive woody plants species. Environ. Pollut. 2005, 136, 33–45. [Google Scholar] [CrossRef] [PubMed]
  45. Kitao, M.; Löw, M.; Heerdt, C.; Grams, T.E.E.; Häberle, K.H.; Matyssek, R. Effects of chronic elevated ozone exposure on gas exchange responses of adult beech trees (Fagus sylvatica) as related to the within–canopy light gradient. Environ. Pollut. 2009, 157, 537–544. [Google Scholar] [CrossRef]
  46. Bąba, W.; Kalaji, H.M.; Kompała-Bąba, A.; Goltsev, V. Acclimatization of photosynthetic apparatus of tor grass (Brachypodiumpinnatum) during expansion. PLoS ONE 2016, 11, e0156201. [Google Scholar] [CrossRef] [PubMed] [Green Version]
  47. Pellegrini, E.; Hoshika, Y.; Dusart, N.; Cotrozzi, L.; Gérard, J.; Nali, C.; Vaultier, M.-N.; Jolivet, Y.; Lorenzini, G.; Paoletti, E. Antioxidative responses of three oak species under ozone and water stress conditions. Sci. Total Environ. 2019, 647, 390–399. [Google Scholar] [CrossRef]
  48. Brunetti, C.; Guidi, L.; Sebastiani, F.; Tattini, M. Isoprenoids and phenylpropanoids are key components of the antioxidant defense system of plants facing severe excess light stress. Environ. Exp. Bot. 2015, 119, 54–62. [Google Scholar] [CrossRef]
  49. Long, S.P.; Naidu, S.L. Effects of oxidants at the biochemical, cell and physiological levels, with particular reference to ozone. In Air Pollution and Plant Life, 2nd ed.; Bell, J.N.B., Treshow, M., Eds.; John Wiley & Sons Ltd.: Chichester, UK, 2002; pp. 69–88. [Google Scholar]
  50. Fuhrer, J.; Booker, F.L. Ecological issues related to ozone: Agricultural issues. Environ. Int. 2003, 29, 141–154. [Google Scholar] [CrossRef]
  51. Gitelson, A.; Chivkunova, O.; Merzlyak, M. Nondestructive estimation of anthocyanins and chlorophylls in anthocyanic leaves. Am. J. Bot. 2009, 96, 1861–1868. [Google Scholar] [CrossRef]
  52. Steele, M.; Gitelson, A.; Rundquist, D.; Merzlyak, M. Nondestructive estimation of anthocyanin content in grapevine leaves. Am. J. Enol. Viticult. 2009, 60, 87–92. [Google Scholar]
  53. Baroli, I.; Melis, A. Photoinhibitory damage is modulated by the rate of photosynthesis and by the photosystem II lightharvesting chlorophyll antenna size. Planta 1998, 205, 288–296. [Google Scholar] [CrossRef]
  54. Burritt, D.J.; MacKenzie, S. Antioxidant metabolism during acclimation of Begonia × erythrophylla to high light levels. Ann. Bot. 2003, 91, 783–794. [Google Scholar] [CrossRef] [Green Version]
  55. Agati, G.; Azzarello, E.; Pollastri, S.; Tattini, M. Flavonoids as antioxidants in plants: Location and functional significance. Plant Sci. 2012, 196, 67–76. [Google Scholar] [CrossRef] [PubMed]
  56. Strasser, R.J.; Srivastava, A.; Tsimilli-Michael, M. The fluorescence transient as a tool to characterize and screen photosynthetic samples. In Probing Photosynthesis: Mechanism Regulation and Adaptation; Yunus, M., Pathre, U., Mohanty, P., Eds.; Taylor and Francis: London, UK, 2000; pp. 443–480. [Google Scholar]
  57. Knapp, A.K.; Carter, G.A. Variability in leaf optical properties among 26 species from a broad range of habitats. Am. J. Bot. 1998, 85, 940–946. [Google Scholar] [CrossRef] [PubMed] [Green Version]
  58. Gitelson, A.A.; Merzylak, M.N.; Chivkunova, O.B. Optical properties and nondestructive estimation of anthocyanin content in plant leaves. Photochem. Photobiol. 2001, 71, 38–45. [Google Scholar] [CrossRef]
  59. Merzlyak, M.N.; Solovchenko, A.E.; Smagin, A.I.; Gitelson, A.A. Apple flavonols during fruit adaptation to solar radiation: Spectral features and technique for non-destructive assessment. J. Plant Physiol. 2005, 162, 151–160. [Google Scholar] [CrossRef]
  60. Peñuelas, J.; Filella, I.; Baret, F. Semiempirical indices to assess carotenoids/chlorophyll a ratio from leaf spectra reflectance. Photosynthetica 1995, 31, 221–230. [Google Scholar]
  61. Peñuelas, J.; Filella, I.; Biel, C.; Serrano, L.; Save, R. The Reflectance at the 950–970 region as an indicator of plant water status. Int. J. Remote Sens. 1993, 14, 1887–1905. [Google Scholar] [CrossRef]
  62. Naumann, D. FT-infrared and FT-Raman spectroscopy in biomedical research. Appl. Spectrosc. Rev. 2001, 36, 239–298. [Google Scholar] [CrossRef]
  63. Farber, C.; Shires, M.; Ong, K.; Byrne, D.; Kurouski, D. Raman spectroscopy as an early detection tool for rose rosette infection. Planta 2019, 250, 1247–1254. [Google Scholar] [CrossRef]
  64. Andreev, G.; Schrader, B.; Schulz, H.; Fuchs, R.; Popov, S.; Handjieva, N. Non-destructive NIR-FT-Raman analyses in practice. Part 1. Analyses of plants and historic textiles. Fresenius J. Anal. Chem. 2001, 371, 1009–1017. [Google Scholar]
  65. Baranski, R.; Baranska, M.; Schulz, H. Changes in carotenoid content and distribution in living plant tissue can be observed and mapped in situ using NIR-FT-Raman spectroscopy. Planta 2005, 222, 448–457. [Google Scholar] [CrossRef]
  66. Eravuchira, P.J.; El-Abassy, R.M.; Deshpande, S.; Matei, M.F.; Mishra, S.; Tandon, P.; Kuhnert, N.; Materny, A. Raman spectroscopic characterization of different regioisomers of monoacyl and diacyl chlorogenic acid. Vib. Spectrosc. 2012, 61, 10–16. [Google Scholar] [CrossRef]
  67. Oliwa, J.; Stawoska, I.; Janeczko, A.; Oklestkova, J.; Skoczowski, A. Response of the photosynthetic apparatus in the tropical fern Platycerium bifurcatum to increased ozone concentration. Photosynthetica 2019, 57, 1119–1129. [Google Scholar] [CrossRef] [Green Version]
  68. Withnall, R.; Chowdhry, B.Z.; Silver, J.; Edwards, H.G.M.; de Oliveira, L.F.C. Raman spectra of carotenoids in natural products. Spectrochim. Acta Part A Mol. Biomol. Spectrosc. 2003, 59, 2207–2212. [Google Scholar] [CrossRef]
Figure 1. Typical plants of Brassica rapa subsp. pekinensis after 21 days of growth in 100-ppb O3 in different light spectra: (A) yellow light (sodium lamp, YL), (B) white light (WL), (C) light with a dominant blue component (WBL) and (D) light with a dominant red component (RGBL).
Ijms 23 02941 g001
Figure 2. Leaf reflectance spectra of Brassica rapa subsp. pekinensis after 21 days of growth in 100-ppb O3 or not fumigated (control) in different light spectra: YL—yellow light (sodium lamp), WL—white light, RGBL—light with a dominant red component and WBL—light with adominant blue component. Average values from 7 independent replications.
Ijms 23 02941 g002
Figure 3. FT-Raman spectra, normalised according to 1441 cm−1, obtained for lyophilised leaves of Brassica rapa subsp. pekinensis growing in different light spectra: (A) yellow light (sodium lamp, YL), (B) white light (WL), (C) light with a dominant blue component (WBL) and (D) light with a dominant red component (RGBL). Solid line—spectra obtained after 21 days of ozone fumigation and dashed line—spectra for non-fumigated plants (control). Particular spectra represent the average values of 10 replications.
Ijms 23 02941 g003
Figure 4. Dendrograms of a hierarchical cluster analysis according to Ward’s algorithm of the FT-Raman spectra obtained for the leaves of Brassica rapa subsp. pekinensis growing under different spectral compositions of light. (A) Control plants and (B) plants fumigated by ozone (21 days, 100 ppb). The red line indicates the number of statistically significant groups to which individual objects have been classified.
Ijms 23 02941 g004aIjms 23 02941 g004b
Table 1. Chlorophyll a fluorescence kinetics parameters of Brassica rapa subsp. pekinensis growing in a different light spectrum: YL—yellow light (sodium lamp), WL—white light (LED), RGBL—red + green + blue light (LED), WBL—white + blue light (LED), treated with ozone (100 ppb, 21 days) or not fumigated (control). Average values (±SD) marked with the same letters in a row do not differ significantly according to Duncan’s test, p ≤ 0,05, n = 7.
Chlorophyll a Fluorescence ParameterTreatment
YLWLRGBLWBL
ControlO3ControlO3ControlO3ControlO3
Fv/Fm0.845 a ± 0.0140.826 ab ± 0.0120.823 bc ± 0.0090.841 a ± 0.0140.819 c ± 0.0130.840 a ± 0.0090.803 d ± 0.0090.817 c ± 0.011
PIABS2.600 bc ± 0.2592.130 de ± 0.2081.781 ef ± 0.2122.773 b ± 0.2321.803 ef ± 0.1903.395 a ± 0.2661.575 f ± 0.2142.387 cd ± 0.228
RC/CSm1271 a ± 461095 c ± 411056 cd ± 331103 bc ± 421027 de ± 401166 b ± 41992 de ± 44964 e ± 38
ABS/CSm3359 a ± 842988 d ± 743092 bc ± 853114 b ± 902868 de ± 762966 d ± 802813 ef ± 792730 f ± 72
TR0/CSm2837 a ± 742492 c ± 782543 bc ± 822619 b ± 812348 d ± 842491 c ± 792261 d ± 762239 d ± 69
ET0/CSm1561 a ± 621326 b ± 701324 b ± 591553 a ± 661223 bc ± 701541 a ± 641146 c ± 681292 b ± 73
DI0/CSm521 bc ± 18495 cd ± 20549 ab ± 21494 cd ± 18519 c ± 20474 d ± 18551 a ± 14490 cd ± 19
Table 2. Gas exchange parameters of Brassica rapa subsp. pekinensis growing in a different light spectrum and treated with ozone (100 ppb, 21 days) or non-fumigated (control). YL—yellow light (sodium lamp), WL—white light (LED), RGBL—red + green + blue light (LED) and WBL—white + blue light. Average values (±SD) marked with the same letters in the row do not differ significantly according to Duncan’s test, p ≤ 0.05, n = 7.
ParameterTreatment
YLWLRGBLWBL
ControlO3ControlO3ControlO3ControlO3
PN (µmol CO2 m−2 s−1)8.73 a ± 0.807.57 b ± 0.822.99 e ± 0.775.20 cd ± 0.897.64 b ± 0.946.25 bc ± 1.734.57 c ± 0.693.77 de ± 0.85
E (mol H2O m−2 s−1)0.97 c ± 0.240.56 d ± 0.220.52 d ± 0.191.81 b ± 0.492.20 b ± 0.433.24 a ± 0.280.70 cd ± 0.272.34 b ± 0.56
gs (mmol H2O m−2 s−1)0.12 bc ± 0.020.07 d ± 0.010.02 e ± 0.000.09 cd ± 0.020.10 bc ± 0.020.20 a ± 0.030.03 e ± 0.010.15 ab ± 0.03
Ci (µmol CO2 mol)254 c ± 24171 d ± 23159 d ± 26282 bc ± 23249 c ± 20309 ab ± 26146 d ± 23333 a ± 24
Table 3. Reflectance parameters from the leaves of Brassica rapa subsp. pekinensis growing in a different light spectrum and treated with ozone (100 ppb, 21 days) or non-fumigated (control). YL—yellow light (sodium lamp), WL—white light (LED), RGBL—red + green + blue light (LED) and WBL—white + blue light. Average values (±SD) marked with the same letters in the row do not differ significantly according to Duncan’s test, p ≤ 0.05, n = 7.
Reflectance ParameterTreatment
YLWLRGBLWBL
ControlO3ControlO3ControlO3ControlO3
ARI20.555 d ± 0.0210.728 a ± 0.0020.686 b ± 0.0010.748 a ± 0.0010.628 c ± 0.0030.595 cd ± 0.0020.486 e ± 0.0050.588 d ± 0.004
SIPI0.763 a ± 0.0120.771 a ± 0.0020.767 a ± 0.0010.788 a ± 0.0220.774 a ± 0.0170.781 a ± 0.0040.772 a ± 0.0240.770 a ± 0.006
FRI0.799 d ± 0.0111.051 b ± 0.0020.393 g ± 0.0050.493 f ± 0.0030.657 e ± 0.0030.957 c ± 0.0110.725 de ± 0.0221.815 a ± 0.027
WBI1.036 a ± 0.0061.030 a ± 0.0011.032 a ± 0.0021.029 a ± 0.0111.030 a ± 0.0181.027 a ± 0.0111.031 a ± 0.0131.032 a ± 0.013
Table 4. Total chlorophyll content measured with a SPAD chlorophyll meter on the upper and lower sides of Brassica rapa subsp. pekinensis growing in different light spectrums and treated with ozone (100 ppb, 21 days) or non-fumigated (control). YL—yellow light (sodium lamp), WL—white light (LED), RGBL—red + green + blue light (LED) and WBL—white + blue light. Average values (±SD) marked with the same letters in the row do not differ significantly according to Duncan’s test, p ≤ 0.05, n = 7.
Leaf SideTreatment
YLWLRGBLWBL
ControlO3ControlO3ControlO3ControlO3
Upper36.63 ab ± 1.7235.19 b ± 1.7435.56 b ± 1.7736.75 ab ± 1.6638.50 a ± 1.7338.42 a ± 1.3535.24 b ± 1.5636.28 ab ± 1.51
Bottom37.10 abc ± 1.7634.22 d ± 1.6735.74 bcd ± 1.6536.98 abc ± 1.7038.15 ab ± 1.7838.70 a ± 1.7434.66 cd ± 1.4236.90 abc ± 1.68
Publisher’s Note: MDPI stays neutral with regard to jurisdictional claims in published maps and institutional affiliations.

