
Theoretical Investigation on the ESIPT Process and Detection Mechanism for Dual-Proton Type Fluorescent Probe


Abstract
:1. Introduction
2. Computational Details
3. Results and Discussion
3.1. Intramolecular Hydrogen Bond
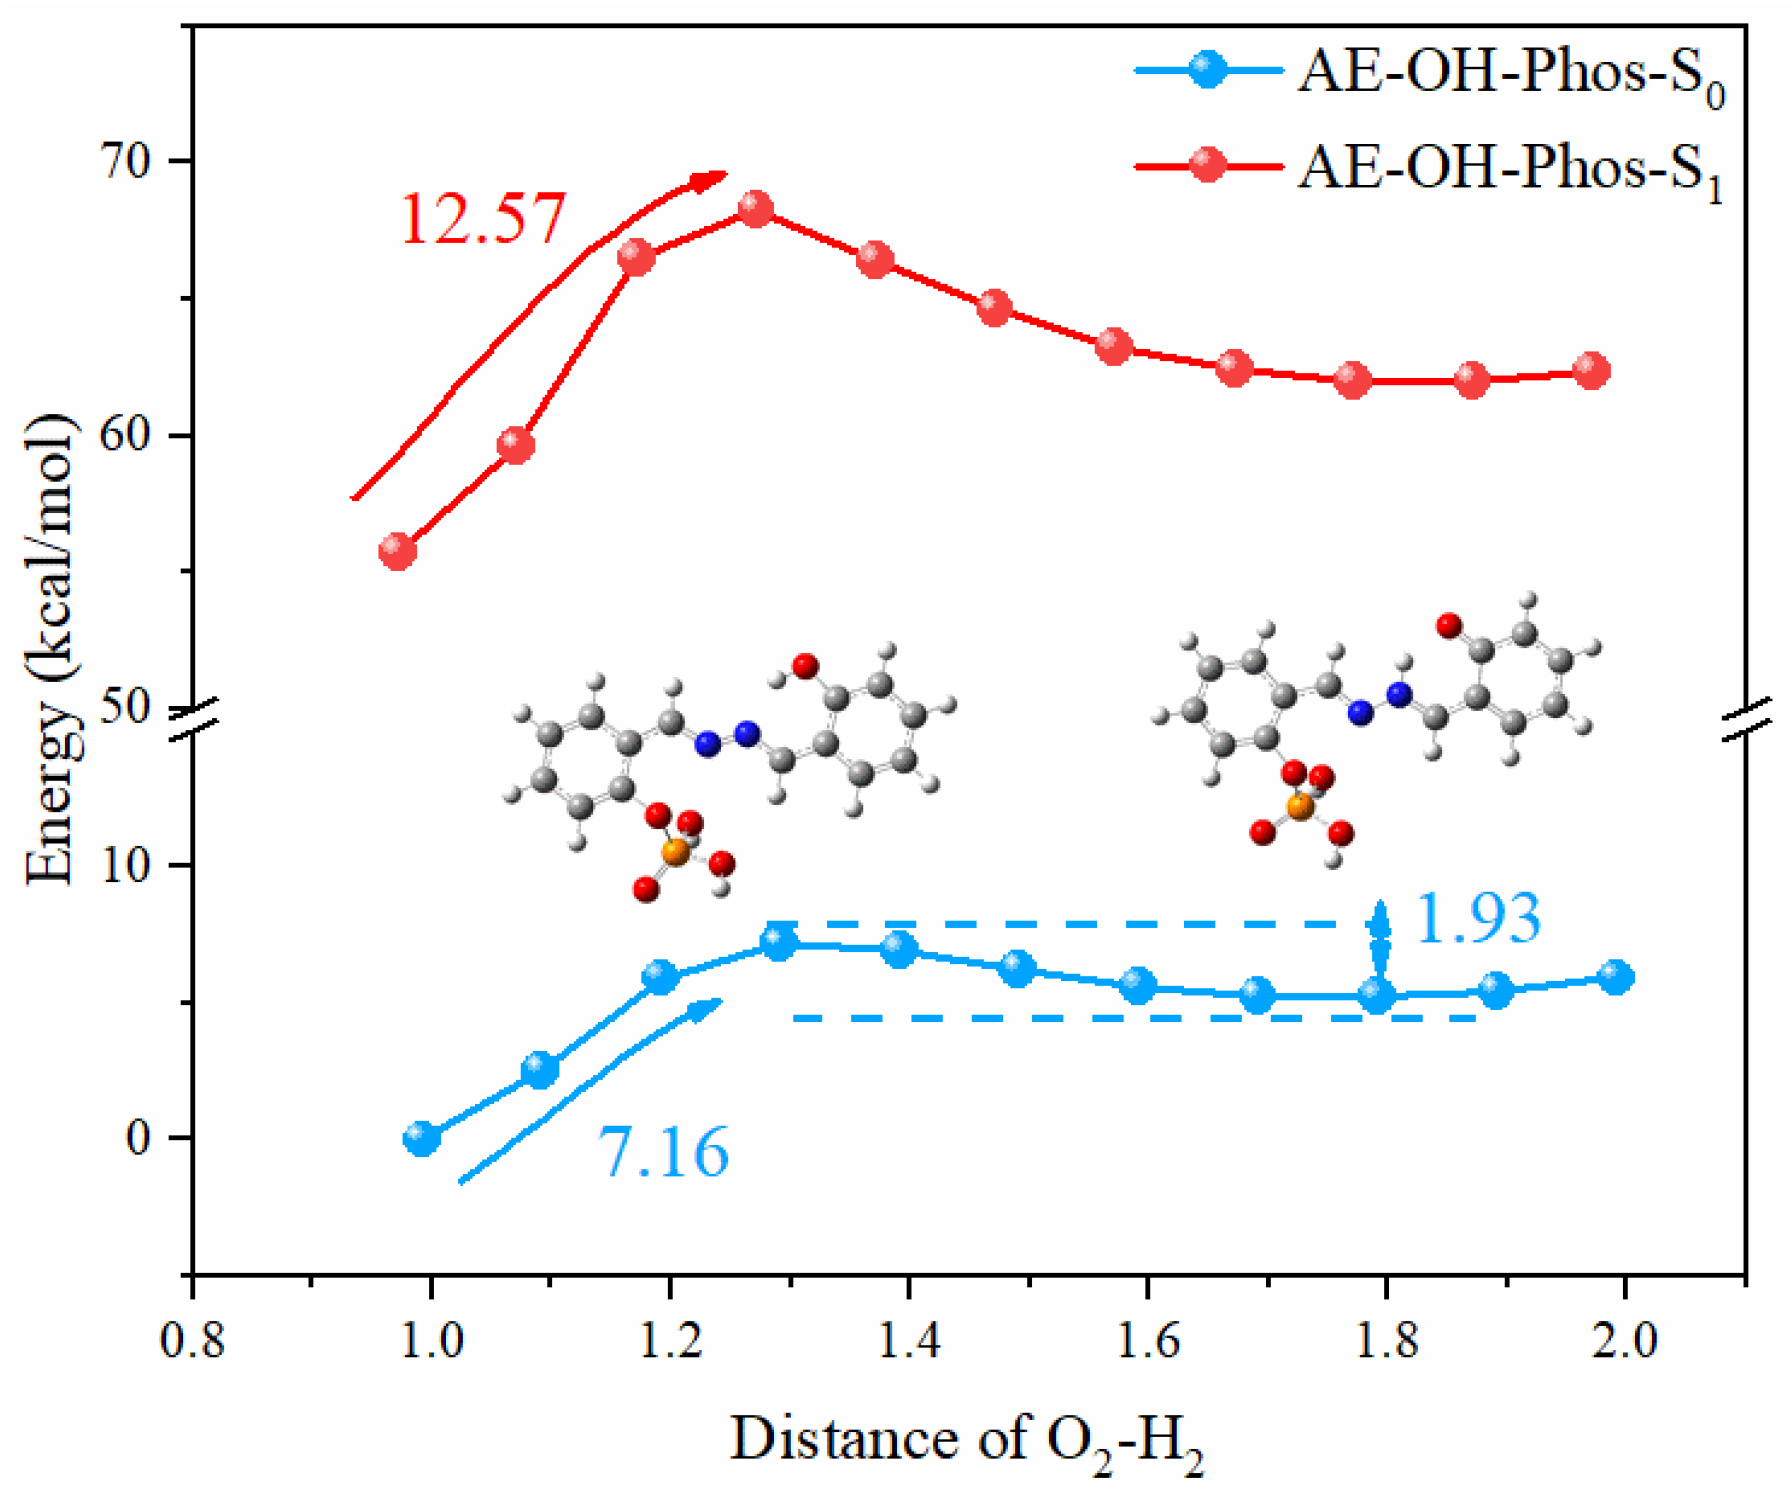
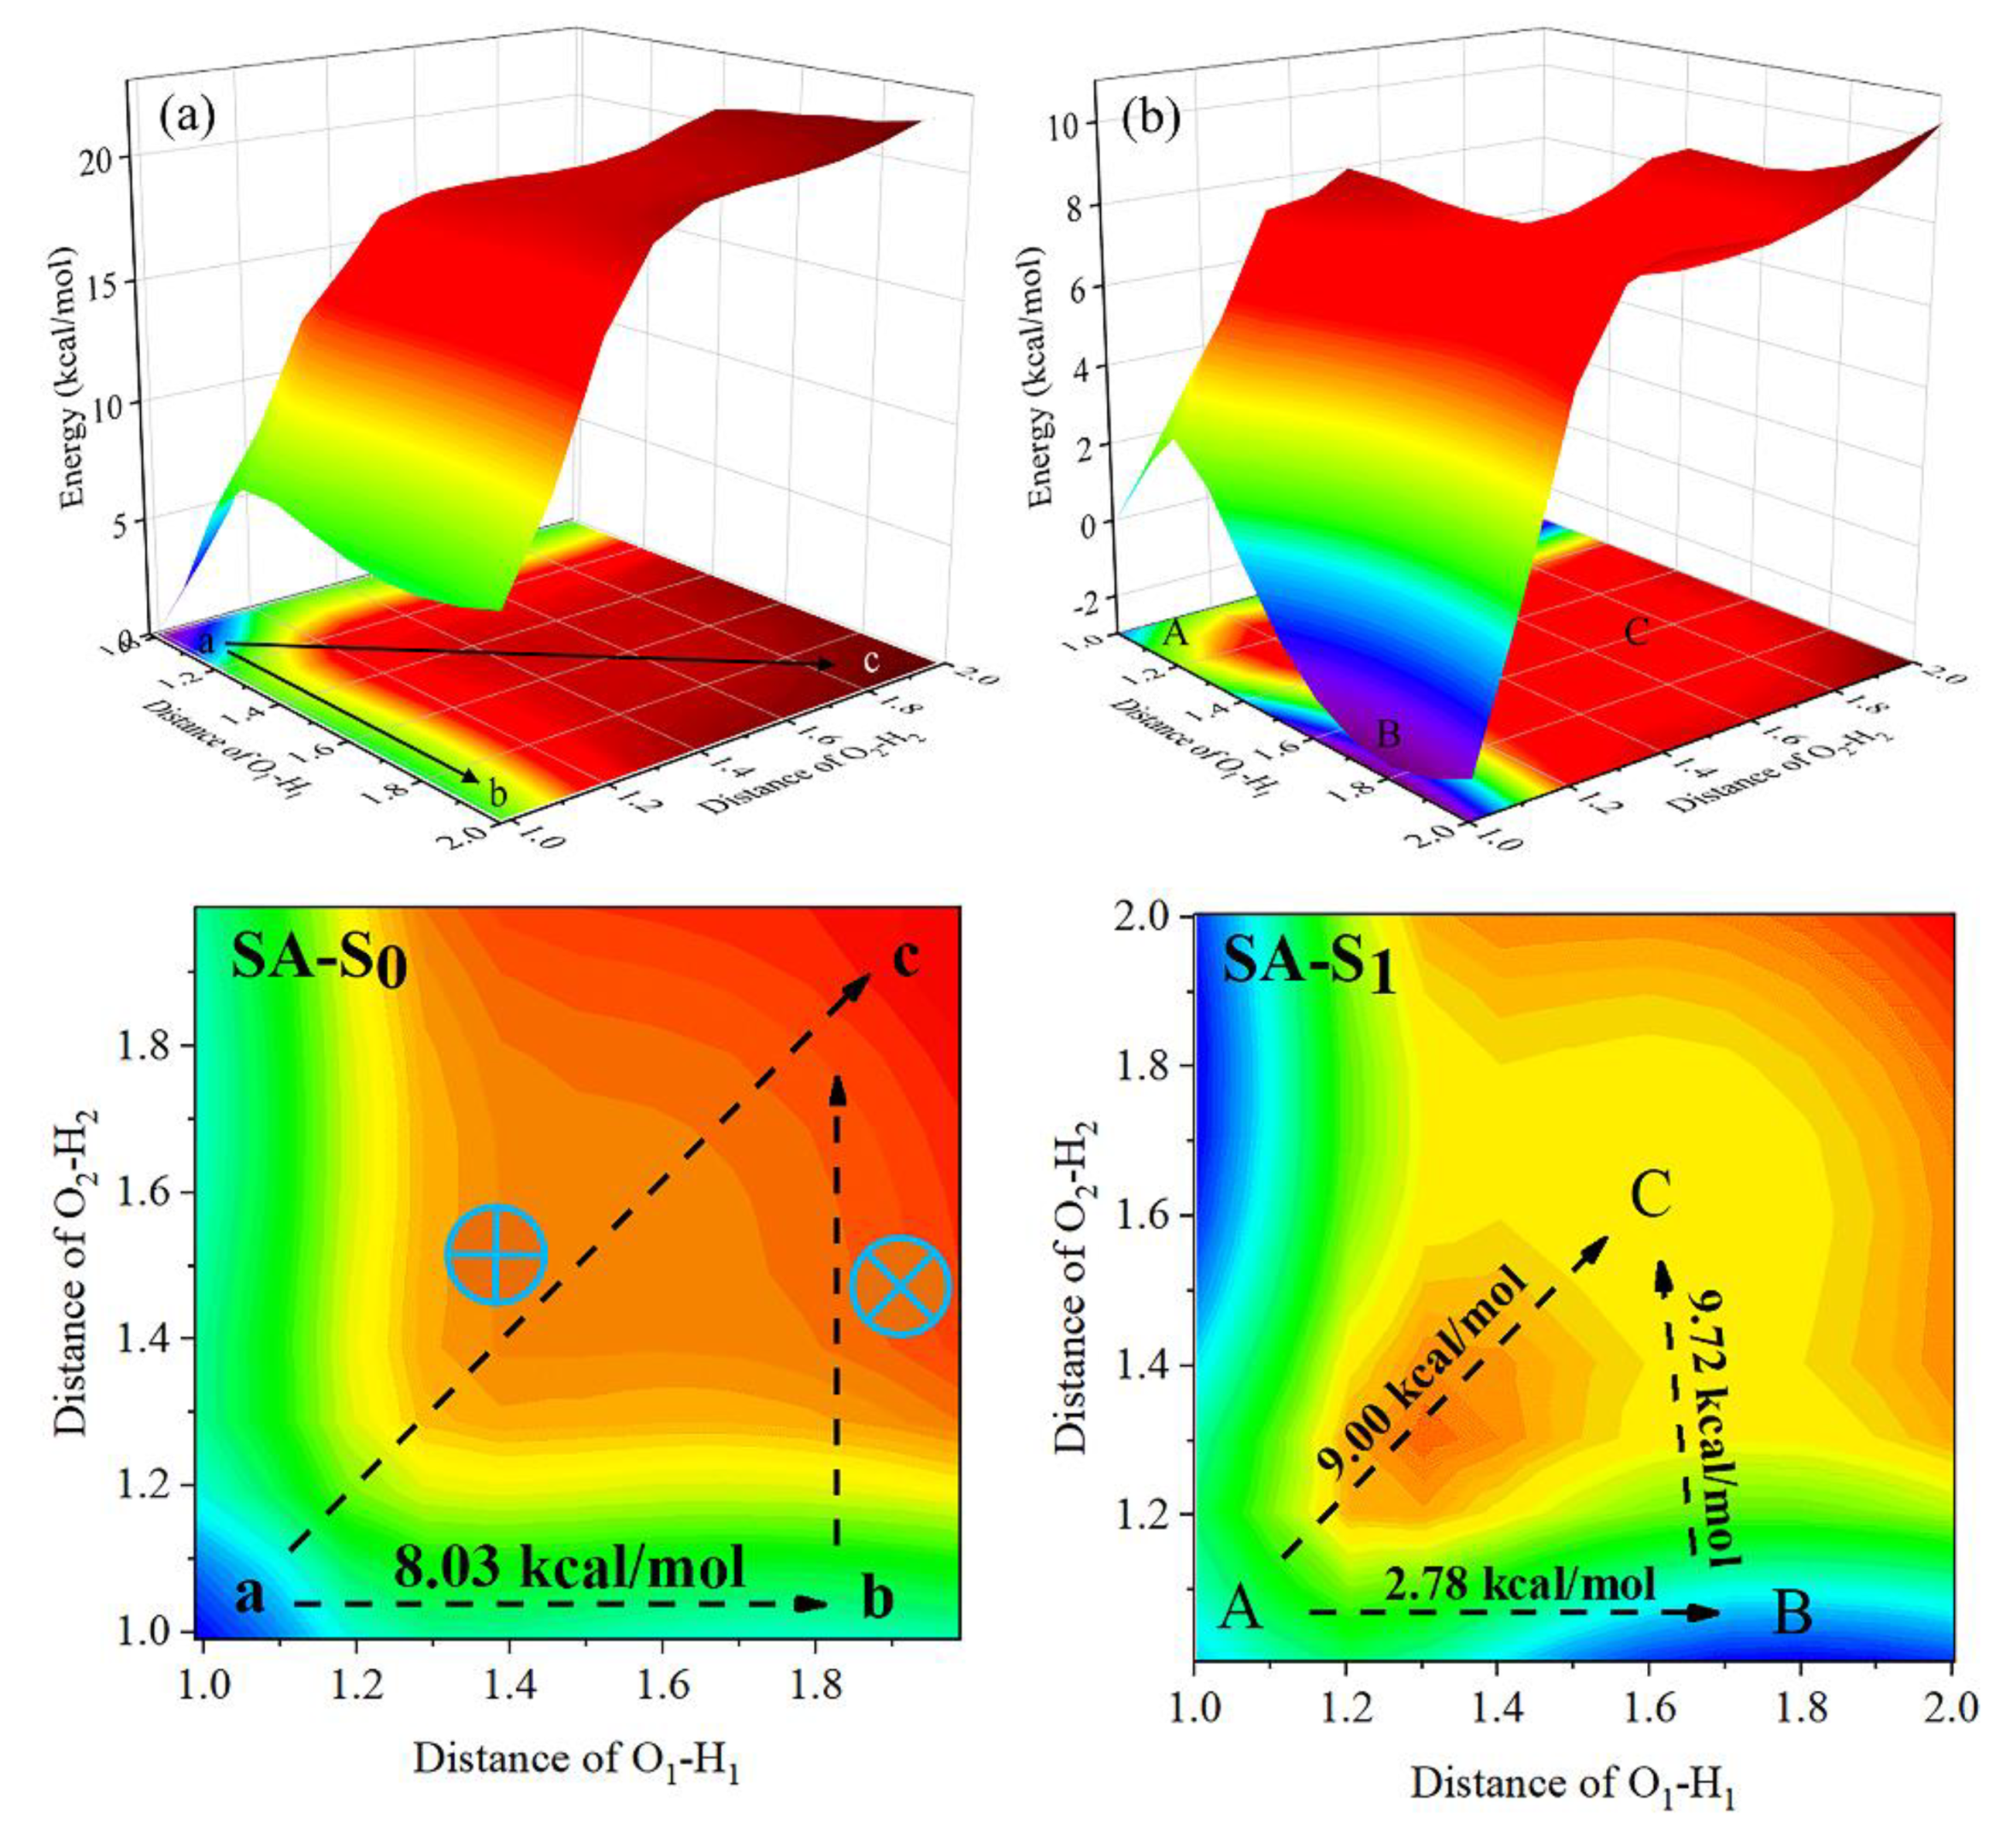
3.2. ESIPT Process Analysis
3.3. Electronic Spectra and Fluorescence Mechanism
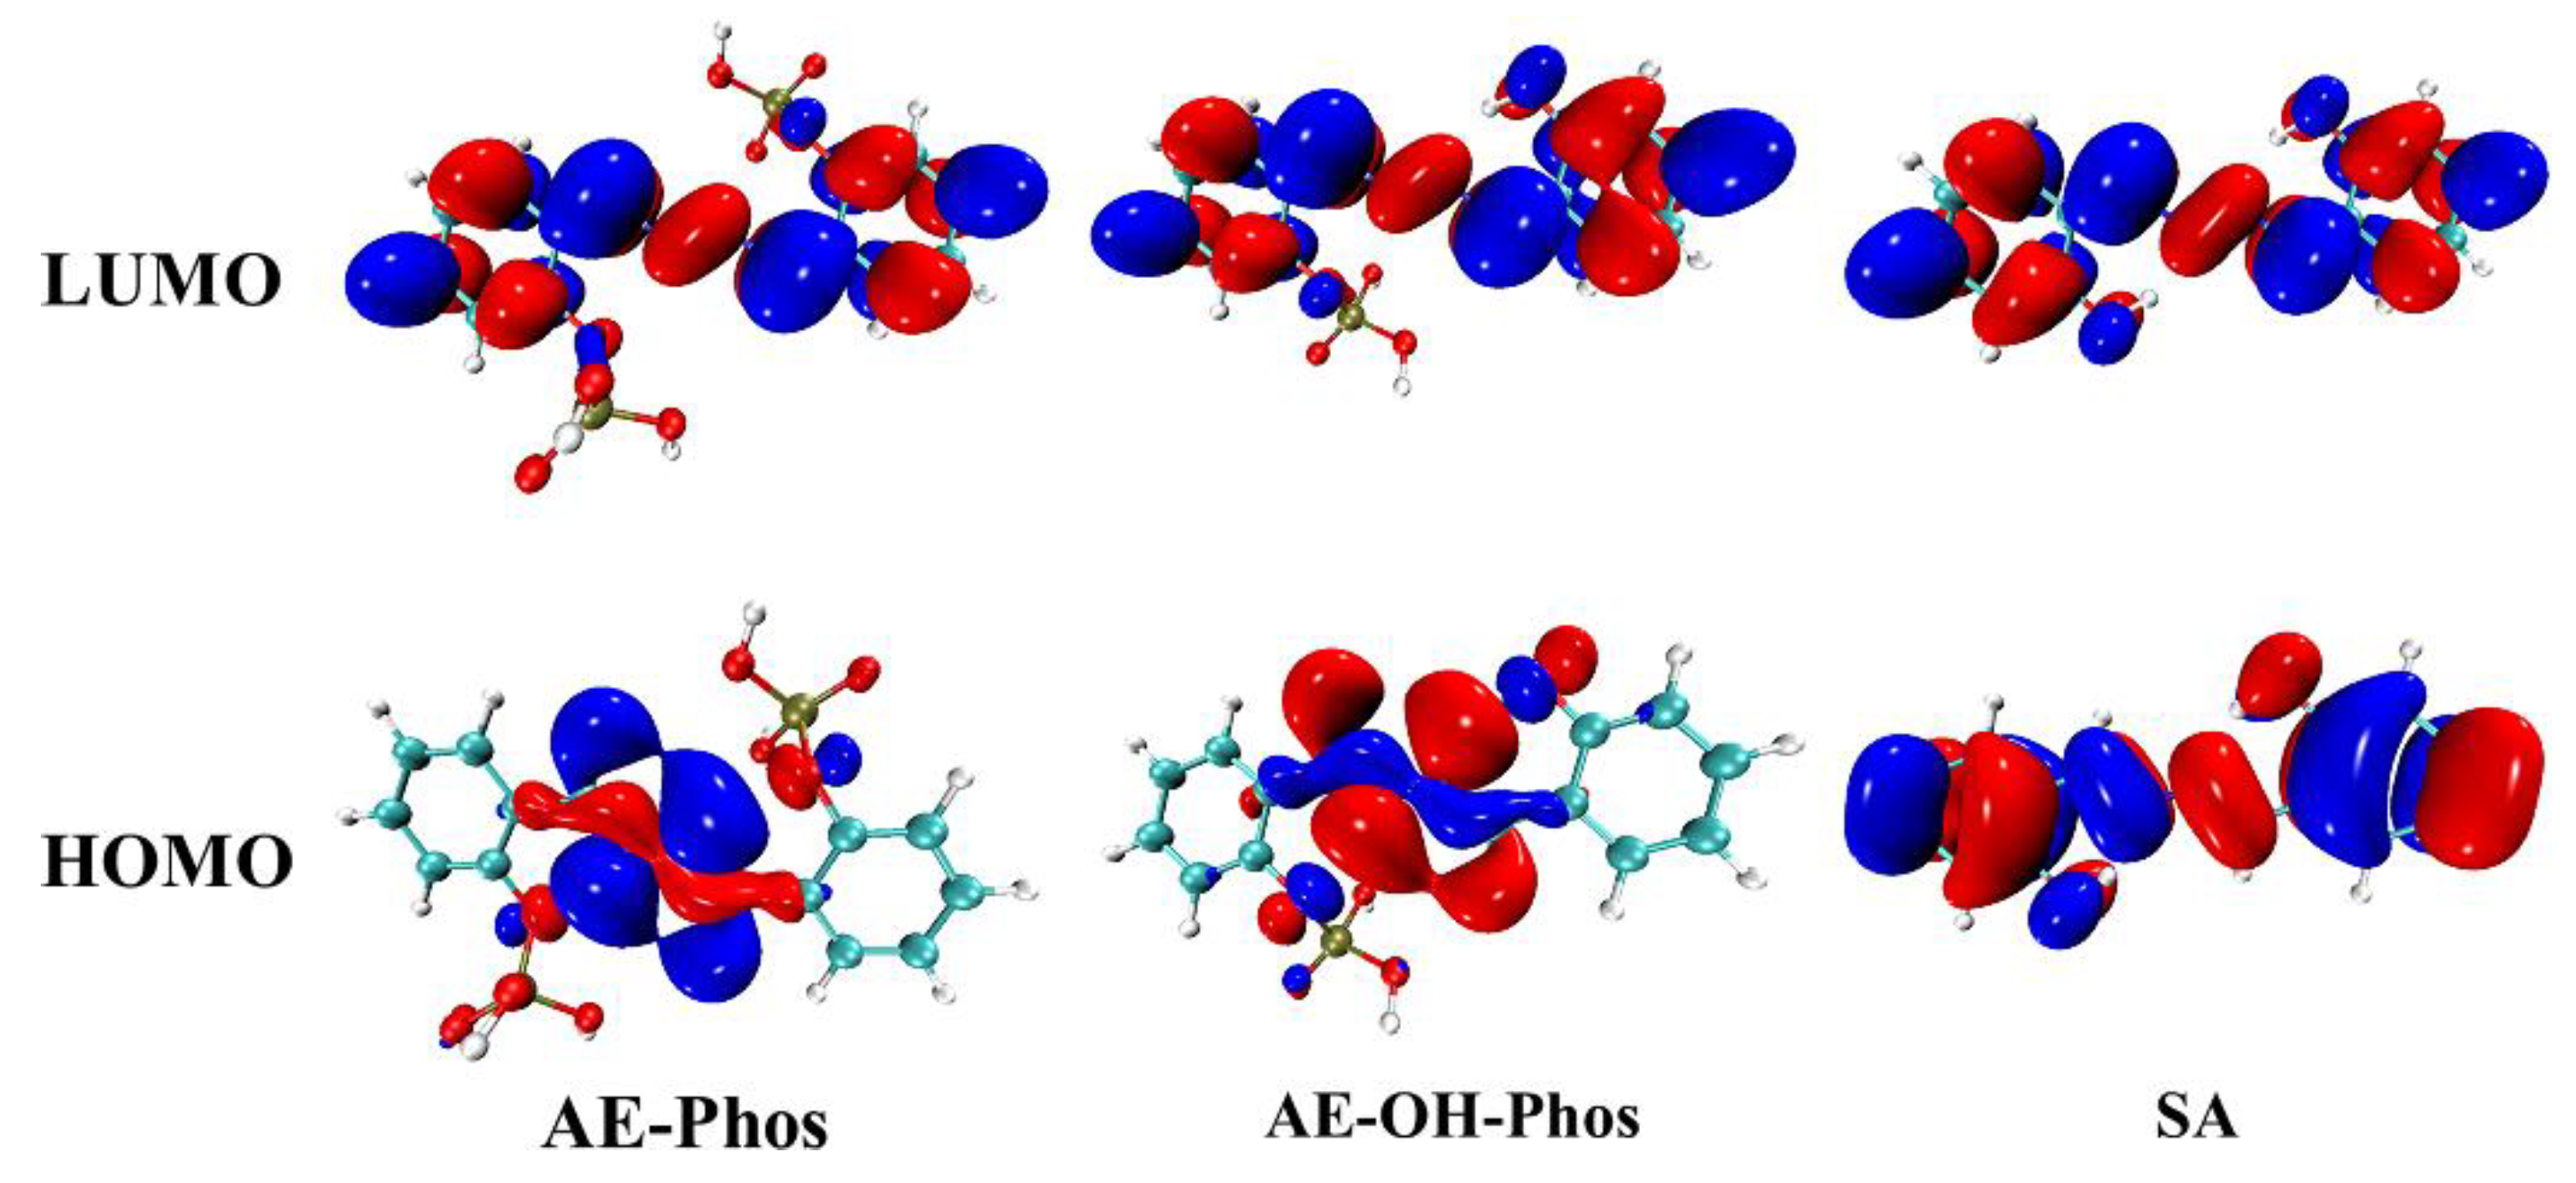
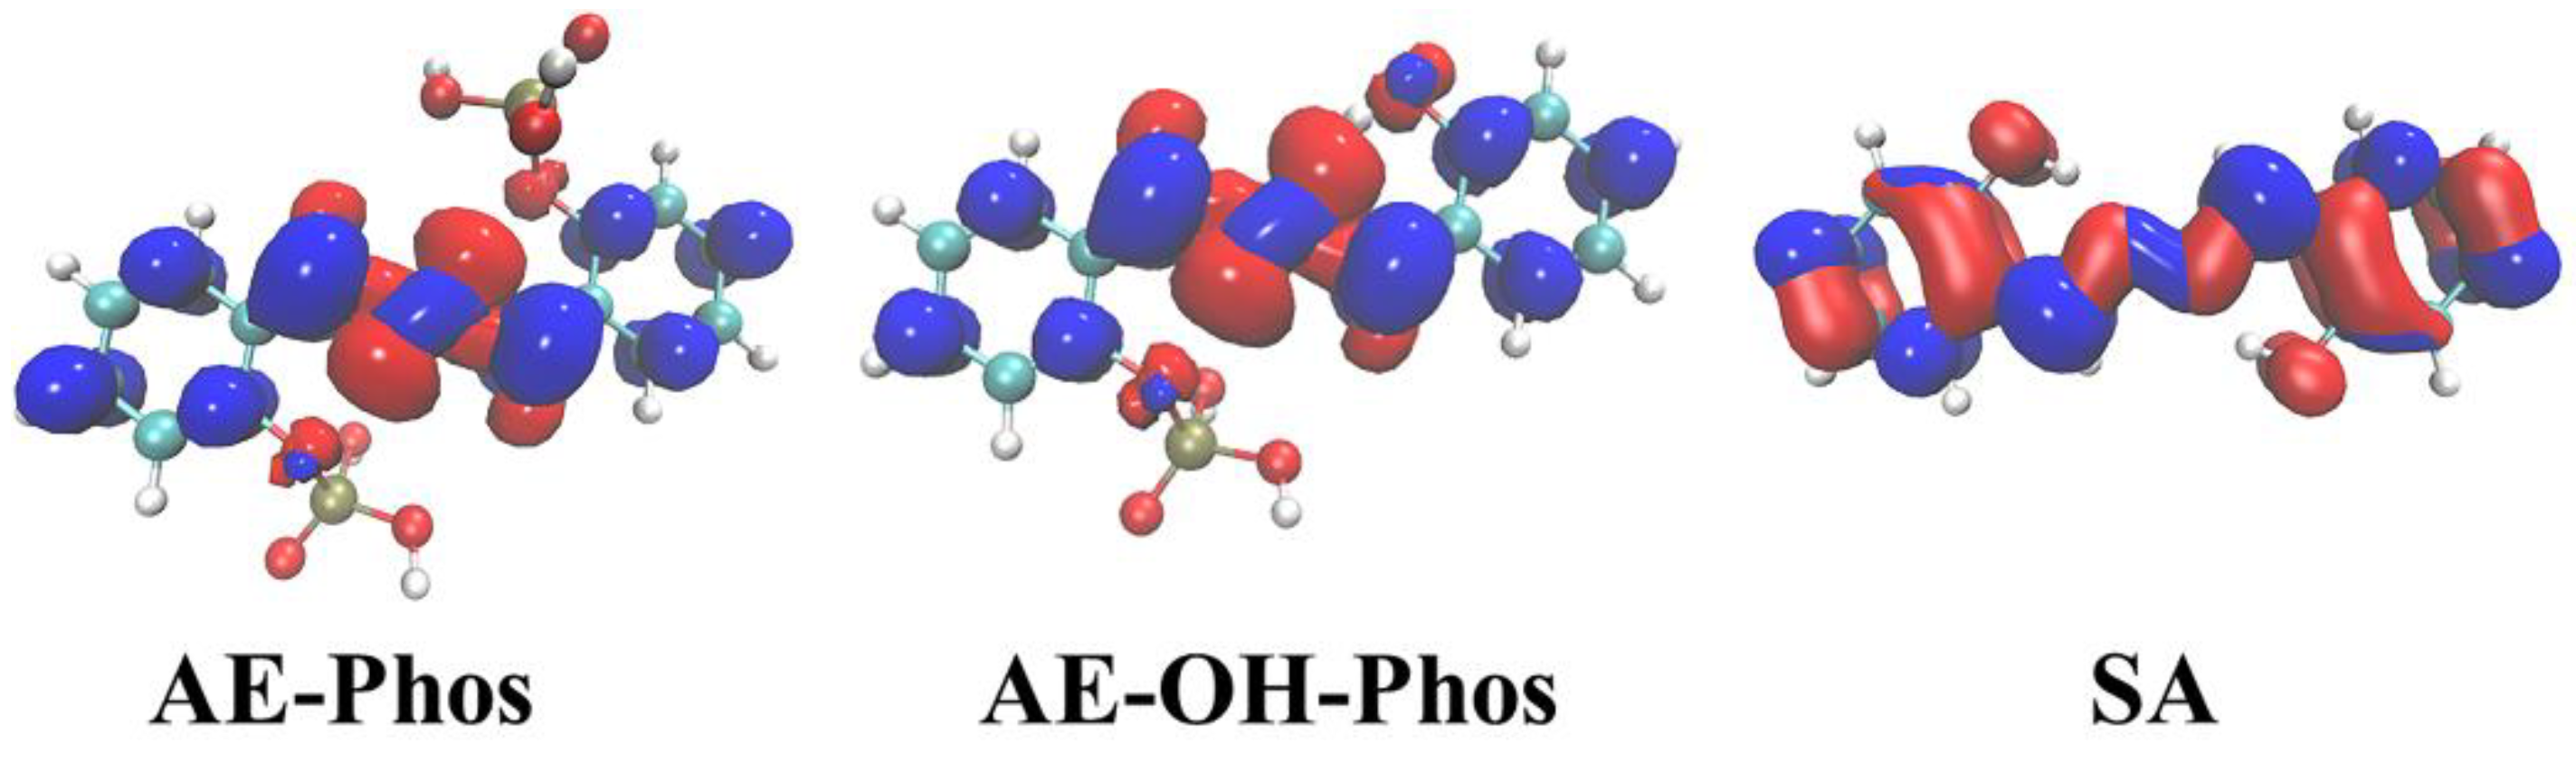
3.4. Frontier Molecular Orbitals
4. Conclusions
Author Contributions
Funding
Institutional Review Board Statement
Informed Consent Statement
Data Availability Statement
Conflicts of Interest
References
- He, L.; Dong, B.; Liu, Y.; Lin, W. Fluorescent chemosensors manipulated by dual/triple interplaying sensing mechanisms. Chem. Soc. Rev. 2016, 45, 6449–6461. [Google Scholar] [CrossRef]
- Kwon, J.E.; Park, S.Y. Advanced Organic Optoelectronic Materials: Harnessing Excited-State Intramolecular Proton Transfer (ESIPT) Process. Adv. Mater. 2011, 23, 3615–3642. [Google Scholar] [CrossRef] [PubMed]
- Wu, J.; Liu, W.; Ge, J.; Zhang, H.; Wang, P. New sensing mechanisms for design of fluorescent chemosensors emerging in recent years. Chem. Soc. Rev. 2011, 40, 3483–3495. [Google Scholar] [CrossRef] [PubMed]
- Zhao, J.; Ji, S.; Chen, Y.; Guo, H.; Yang, P. Excited state intramolecular proton transfer (ESIPT): From principal photophysics to the development of new chromophores and applications in fluorescent molecular probes and luminescent materials. Phys. Chem. Chem. Phys. 2012, 14, 8803–8817. [Google Scholar] [CrossRef]
- Kim, T.-I.; Kang, H.J.; Han, G.; Chung, S.J.; Kim, Y. A highly selective fluorescent ESIPT probe for the dual specificity phospha-tase MKP-6. Chem. Commun. 2009, 39, 5895–5897. [Google Scholar] [CrossRef] [PubMed]
- Li, Y.; Cao, B.; Zhou, Q.; Zhang, X.; Li, B.; Su, X.; Shi, Y. Enhancing fluorescence of benzimidazole derivative via solvent-regulated ESIPT and TICT process: A TDDFT study. Spectrochim. Acta Part A 2021, 258, 119862. [Google Scholar] [CrossRef] [PubMed]
- Petdee, S.; Chaiwai, C.; Benchaphanthawee, W.; Nalaoh, P.; Kungwan, N.; Namuangruk, S.; Sudyoadsuk, T. Promarak, Imid-azole-based solid-state fluorophores with combined ESIPT and AIE features as self-absorption-free non-doped emitters for electroluminescent devices. Dyes Pigm. 2021, 193, 109488. [Google Scholar] [CrossRef]
- Baranowska, K.; Monka, M.; Bojarski, P.; Jozefowicz, M. Insight into Molecular Interactions of Two Methyl Benzoate Deriva-tives with Bovine Serum Albumin. Int. J. Mol. Sci. 2021, 22, 11705. [Google Scholar] [CrossRef] [PubMed]
- Fan, K.W.; Luk, H.L.; Phillips, D.L. Anti-Kasha Behavior of 3-Hydroxyflavone and Its Derivatives. Int. J. Mol. Sci. 2021, 22, 11103. [Google Scholar] [CrossRef]
- Goswami, S.; Das, S.; Aich, K.; Pakhira, B.; Panja, S.; Mukherjee, S.K.; Sarkart, S. A Chemodosimeter for the Ratiometric Detec-tion of Hydrazine Based on Return of ESIPT and Its Application in Live-Cell Imaging. Org. Lett. 2013, 15, 5412–5415. [Google Scholar] [CrossRef]
- Liu, B.; Wang, J.; Zhang, G.; Bai, R.; Pang, Y. Flavone-Based ESIPT Ratiometric Chemodosimeter for Detection of Cysteine in Living Cells. ACS Appl. Mater. Interfaces 2014, 6, 4402–4407. [Google Scholar] [CrossRef] [PubMed]
- Wu, L.; Sedgwick, A.C.; Sun, X.; Bull, S.D.; He, X.-P.; James, T.D. Reaction-Based Fluorescent Probes for the Detection and Imag-ing of Reactive Oxygen, Nitrogen, and Sulfur Species. Acc. Chem. Res. 2019, 52, 2582–2597. [Google Scholar] [CrossRef] [PubMed] [Green Version]
- Kubota, T.; Ikeda, S.; Okamoto, A. Doubly Thiazole Orange-Labeled DNA for Live Cell RNA Imaging. Bull. Chem. Soc. Jpn. 2009, 82, 110–117. [Google Scholar] [CrossRef]
- Urano, Y. Novel live imaging techniques of cellular functions and in vivo tumors based on precise design of small mole-cule-based ‘Activatable’ fluorescence probes. Curr. Opin. Chem. Biol. 2012, 16, 602–608. [Google Scholar] [CrossRef] [PubMed]
- Wei, J.R.; Chen, H.Y.; Zhang, W.; Pan, J.X.; Dang, F.Q.; Zhang, Z.Q.; Zhang, J. Ratiometric fluorescence for sensitive and selec-tive detection of mitoxantrone using a MIP@rQDs@SiO2 fluorescence probe. Sens. Actuators B 2017, 244, 31–37. [Google Scholar] [CrossRef]
- Zhang, J.; Guo, W. A new fluorescent probe for gasotransmitter H2S: High sensitivity, excellent selectivity, and a significant fluorescence off–on response. Chem. Commun. 2014, 50, 4214–4217. [Google Scholar] [CrossRef]
- Chen, W.-H.; Xing, Y.; Pang, Y. A Highly Selective Pyrophosphate Sensor Based on ESIPT Turn-On in Water. Org. Lett. 2011, 13, 1362–1365. [Google Scholar] [CrossRef]
- Sedgwick, A.C.; Wu, L.L.; Han, H.H.; Bull, S.D.; He, X.P.; James, T.D.; Sessler, J.L.; Tang, B.Z.; Tian, H.; Yoon, J. Excited-state in-tramolecular proton-transfer (ESIPT) based fluorescence sensors and imaging agents. Chem. Soc. Rev. 2018, 47, 8842–8880. [Google Scholar] [CrossRef] [Green Version]
- Deng, B.; Ren, M.; Kong, X.; Zhou, K.; Lin, W. An ESIPT based fluorescent probe for imaging hydrogen sulfide with a large turn-on fluorescence signal. RSC Adv. 2016, 6, 62406–62410. [Google Scholar] [CrossRef]
- Lan, M.; Wu, J.; Liu, W.; Zhang, H.; Zhang, W.; Zhuang, X.; Wang, P. Highly sensitive fluorescent probe for thiols based on combination of PET and ESIPT mechanisms. Sens. Actuators B Chem. 2011, 156, 332–337. [Google Scholar] [CrossRef]
- Lv, H.-M.; Yuan, D.-H.; Liu, W.; Chen, Y.; Au, C.-T.; Yin, S.-F. A highly selective ESIPT-based fluorescent probe for cysteine sensing and its bioimaging application in living cells. Sens. Actuators B Chem. 2016, 233, 173–179. [Google Scholar] [CrossRef]
- Latha, V.; Annaraj, B.; Neelakantan, M. ESIPT inspired dual fluorescent probe (Z)-3-((4-(4-aminobenzyl) phenyl) amino)-1,3-diphenylprop-2-en-1-one: Experimental and DFT based approach to photophysical properties. Spectrochim. Acta Part A. 2014, 133, 44–53. [Google Scholar] [CrossRef] [PubMed]
- Yuan, C.X.; Li, S.Y.; Wu, Y.B.; Lu, L.P.; Zhu, M.L. Zn(II)-selective and sensitive fluorescent chemosensor based on steric con-strains and inhibition of ESIPT. Sens. Actuators B 2017, 242, 1035–1042. [Google Scholar] [CrossRef]
- He, X.; Xiong, W.; Zhang, L.; Xu, C.; Fan, J.; Qian, Y.; Wen, J.; Ding, F.; Shen, J. ESIPT-based ratiometric fluorescent probe for highly selective and sensitive sensing and bioimaging of group IIIA ions in living cancer cells and zebrafish. Dye. Pigment. 2020, 174, 108059. [Google Scholar] [CrossRef]
- Karuppiah, K.; Muniyasamy, H.; Sepperumal, M.; Ayyanar, S. Design and synthesis of new salicylhydrazone tagged indole derivative for fluorometric sensing of Zn2+ ion and colorimetric sensing of F− ion: Applications in live cell imaging. Microchem. J. 2020, 159, 105543. [Google Scholar] [CrossRef]
- Kanlayakan, N.; Kungwan, N. Theoretical study of heteroatom and substituent effects on excited-state intramolecular proton transfers and electronic properties of amino-type hydrogen bonding molecules. J. Lumin. 2021, 238, 118260. [Google Scholar] [CrossRef]
- Chansen, W.; Yu, J.-S.K.; Kunggwan, N. A TD-DFT molecular screening for fluorescence probe based on excited-state intramo-lecular proton transfer of 2’-hydroxychalcone derivatives. J. Photochem. Photobiol. A 2021, 410, 113165. [Google Scholar] [CrossRef]
- Chen, K.-Y.; Tsai, H.-Y. Synthesis, X-ray Structure, Spectroscopic Properties and DFT Studies of a Novel Schiff Base. Int. J. Mol. Sci. 2014, 15, 18706–18724. [Google Scholar] [CrossRef] [Green Version]
- Yan, L.; Zhang, S.; Xie, Y.; Lei, C. A fluorescent probe for Gallium(III) ions based on 2-hydroxy-1-naphthaldehyde and L-serine. Dyes Pigm. 2020, 175, 108190. [Google Scholar] [CrossRef]
- Gwynne, L.; Williams, G.T.; Yan, K.-C.; Patenall, B.L.; Gardiner, J.E.; He, X.-P.; Maillard, J.-Y.; James, T.D.; Sedgwick, A.C.; Jenkins, A.T.A. TCF-ALP: A fluorescent probe for the selective detection of Staphylococcus bacteria and application in “smart” wound dressings. Biomater. Sci. 2021, 9, 4433–4439. [Google Scholar] [CrossRef]
- Liu, H.S.; Ma, C.B.; Wang, J.; Wang, K.M.; Wu, K.F. A turn-on fluorescent method for determination of the activity of alkaline phosphatase based on dsDNA-templated copper nanoparticles and exonuclease based amplification. Microchim. Acta 2017, 184, 2483–2488. [Google Scholar] [CrossRef]
- Mei, Y.Q.; Hu, Q.; Zhou, B.J.; Zhang, Y.H.; He, M.H.; Xu, T.; Li, F.; Kong, J.M. Fluorescence quenching based alkaline phospha-tase activity detection. Talanta 2018, 176, 52–58. [Google Scholar] [CrossRef]
- Gao, C.C.; Zang, S.P.; Nie, L.X.; Tian, Y.; Zhang, R.B.; Jing, J.; Zhang, X.L. A sensitive ratiometric fluorescent probe for quanti-tive detection and imaging of alkaline phosphatase in living cells. Anal. Chim. Acta 2019, 1066, 131–135. [Google Scholar] [CrossRef] [PubMed]
- Li, S.-J.; Li, C.-Y.; Li, Y.-F.; Fei, J.; Wu, P.; Yang, B.; Ou-Yang, J.; Nie, S.-X. Facile and Sensitive Near-Infrared Fluorescence Probe for the Detection of Endogenous Alkaline Phosphatase Activity In Vivo. Anal. Chem. 2017, 89, 6854–6860. [Google Scholar] [CrossRef] [PubMed]
- He, Y.; Yu, J.; Hu, X.; Huang, S.; Cai, L.; Yang, L.; Zhang, H.; Jiang, Y.; Jia, Y.; Sun, H. An activity-based fluorescent probe and its application for differentiating alkaline phosphatase activity in different cell lines. Chem. Commun. 2020, 56, 13323–13326. [Google Scholar] [CrossRef]
- Atay Çiğdem, K.; Tilki, T.; Dede, B. Design and synthesis of novel ribofuranose nucleoside analogues as antiproliferative agents: A molecular docking and DFT study. J. Mol. Liq. 2018, 269, 315–326. [Google Scholar] [CrossRef]
- Swaminathan, J.; Ramalingam, M.; Sethuraman, V.; Sundaraganesan, N.; Sebastian, S. Vibrational spectroscopic studies and DFT calculations of 4-aminoantipyrine. Spectrochim. Acta Part A 2009, 73, 593–600. [Google Scholar] [CrossRef]
- Casanovas, J.; Namba, A.M.; da Silva, R.; Aleman, C. DFT-GIAO study of aryltetralin lignan lactones: Conformational anal-yses and chemical shifts calculations. Bioorg. Chem. 2005, 33, 484–492. [Google Scholar] [CrossRef]
- Makhlouf, M.M.; Radwan, A.S.; Ghazal, B. Experimental and DFT insights into molecular structure and optical properties of new chalcones as promising photosensitizers towards solar cell applications. Appl. Surf. Sci. 2018, 452, 337–351. [Google Scholar] [CrossRef]
- Ramos, J.M.; Cruz, M.T.D.; Costa, A.C.; Ondar, G.F.; Ferreira, G.B.; Raniero, L.; Martin, A.A.; Versiane, O.; Soto, C.A.T. Molecular structure, natural bond analysis, vibrational, and electronic spectra of aspartateguanidoacetatenickel (II), Ni(Asp)(GAA) cen-ter dot H2O: DFT quantum mechanical calculations. Spectrochim. Acta Part A 2012, 97, 1041–1051. [Google Scholar] [CrossRef]
- Sun, C.; Zhang, X.; Diao, L.; Cao, B.; Yin, H.; Shi, Y. How the atomic electron-accepting ability affect the double ESIPT process of 2,5-bis(benzoxazol-2-yl)thiophene-3,4-diol? J. Lumin. 2020, 225, 117329. [Google Scholar] [CrossRef]
- Zhan, H.; Tang, Z.; Li, Z.; Chen, X.; Tian, J.; Fei, X.; Wang, Y. The influence of intermolecular hydrogen bonds on single fluorescence mechanism of 1-hydroxy-11H-benzo [b]fluoren-11-one and 10-hydroxy-11H-benzo [b]fluoren-11-one. Spectrochim. Acta Part A 2021, 260, 119993. [Google Scholar] [CrossRef] [PubMed]
- Jia, X.; Yang, Y.; Zhai, H.; Zhang, Q.; He, Y.; Liu, Y.; Liu, Y. The mechanisms of a bifunctional fluorescent probe for detecting fluoride and sulfite based on excited-state intramolecular proton transfer and intramolecular charge transfer. Struct. Dyn. 2021, 8, 034103. [Google Scholar] [CrossRef]
- Shang, C.; Cao, Y.; Sun, C.; Li, Y. Tuning fluorescence behavior and ESIPT reaction of 2-(2-Hydroxy-phenyl)-4(3H)-quinazolinone by introducing different groups. J. Lumin. 2021, 235, 118059. [Google Scholar] [CrossRef]
- Liu, S.; Qin, M.; Lu, Q.; Lin, L.; Wang, C.-K.; Fan, J.; Song, Y. Sensing mechanism of fluorescent sensor to Cu2+ based on inhibiting ultra-fast intramolecular proton transfer process. Spectrochim. Acta Part A 2021, 254, 119685. [Google Scholar] [CrossRef] [PubMed]
- Lan, X.; Yang, D.; Sui, X.; Wang, D. Time-dependent density functional theory (TD-DFT) study on the excited-state intramo-lecular proton transfer (ESIPT) in 2-hydroxybenzoyl compounds: Significance of the intramolecular hydrogen bonding. Spectrochim. Acta Part A 2013, 102, 281–285. [Google Scholar] [CrossRef] [PubMed]
- Li, C.; Li, D.; Ma, C.; Liu, Y. DFT-TDDFT investigation of excited-state intramolecular proton transfer in 2-(2′-hydroxyphenyl)benzimidazole derivatives: Effects of electron acceptor and donor groups. J. Mol. Liq. 2016, 224, 83–88. [Google Scholar] [CrossRef]
- Sun, C.; Su, X.; Zhou, Q.; Shi, Y. Regular tuning of the ESIPT reaction of 3-hydroxychromone-based derivatives by substitution of functional groups. Org. Chem. Front. 2019, 6, 3093–3100. [Google Scholar] [CrossRef]
- Frisch, M.J.; Trucks, G.W.; Schlegel, H.B.; Scuseria, G.E.; Robb, M.A.; Cheeseman, J.R.; Scalmani, G.; Barone, V.; Petersson, G.A.; Nakatsuji, H. Gaussian 16; Gaussian, Inc.: Wallingford, CT, USA, 2016. [Google Scholar]
- Lu, T.; Chen, Q. Interaction Region Indicator: A Simple Real Space Function Clearly Revealing Both Chemical Bonds and Weak Interactions. Chem. Methods 2021, 1, 231–239. [Google Scholar] [CrossRef]
- Johnson, E.R.; Keinan, S.; Mori-Sánchez, P.; Contreras-García, J.; Cohen, A.J.; Yang, W. Revealing Noncovalent Interactions. J. Am. Chem. Soc. 2010, 132, 6498–6506. [Google Scholar] [CrossRef] [Green Version]
- Lu, T.; Chen, F. Multiwfn: A multifunctional wavefunction analyzer. J. Comput. Chem. 2012, 33, 580–592. [Google Scholar] [CrossRef]
- Humphrey, W.; Dalke, A.; Schulten, K. VMD: Visual molecular dynamics. J. Mol. Graph. 1996, 14, 33–38. [Google Scholar] [CrossRef]
- Rozas, I. On the nature of hydrogen bonds: An overview on computational studies and a word about patterns. Phys. Chem. Chem. Phys. 2007, 9, 2782–2790. [Google Scholar] [CrossRef] [PubMed]
- Su, S.; Liang, X.; Fang, H. The effect of ring aromaticity on ESIPT behavior and photophysical properties of 2-(2′-hydroxyphenyl)- 4-chloromethylthiazole derivatives: A TD-DFT study. J. Mol. Liq. 2021, 334, 116517. [Google Scholar] [CrossRef]
- Zhao, J.; Chen, J.; Liu, J.; Hoffmann, M.R. Competitive excited-state single or double proton transfer mechanisms for bis-2,5-(2-benzoxazolyl)-hydroquinone and its derivatives. Phys. Chem. Chem. Phys. 2015, 17, 11990–11999. [Google Scholar] [CrossRef] [PubMed]


| State | O2-H2 | H2-N2 | δ(O2-H2-N2) | |
|---|---|---|---|---|
| AE-OH-PHOs-e | S0 | 0.99 | 1.76 | 146.5 |
| S1 | 0.97 | 1.90 | 143.0 | |
| AE-OH-PHOs-k | S0 | 1.76 | 1.04 | 135.2 |
| S1 | 1.82 | 1.04 | 136.0 |
| SA | SA-SPT | SA-DPT | ||||
|---|---|---|---|---|---|---|
| State | S0 | S1 | S0 | S1 | S0 | S1 |
| O1-H1 | 0.99 | 1.00 | 0.98 | 0.99 | — | 1.64 |
| H1-N1 | 1.76 | 1.70 | 1.80 | 1.77 | — | 1.06 |
| O2-H2 | 0.99 | 1.00 | 1.73 | 1.79 | — | 1.64 |
| H2-N2 | 1.76 | 1.70 | 1.05 | 1.04 | — | 1.06 |
| δ(O1-H1-N1) | 146.1 | 148.3 | 144.7 | 146.4 | — | 140.9 |
| δ(O2-H2-N2) | 146.1 | 148.3 | 136.3 | 137.0 | — | 140.8 |
| B3PW91 | CAM-B3LYP | M06-2W | MPWPW91 | WB97XD | Exp. a | |
|---|---|---|---|---|---|---|
| SA-Abs. | 376 | 335 | 332 | 365 | 332 | 356 |
| SA-Flu. | 438 | 403 | 400 | 428 | 400 | 536 |
| SA-SPT-Flu. | 521 | 452 | 456 | 503 | 445 | |
| SA-DPT-Flu. | 519 | 461 | 468 | 504 | 456 | |
| Stokes-shifts | 145 | 117 | 124 | 138 | 113 | 180 |
| State | E (eV) | λabs (nm) | Contribution MO | f | |
|---|---|---|---|---|---|
| AE-PHOs | S1 | 3.1819 | 390 | (0.69920) H-1→L | 0.0010 |
| S2 | 3.7584 | 330 | (0.70193) H→L | 1.3290 | |
| S3 | 4.2759 | 290 | (0.67557) H-2→L | 0.0000 | |
| AE-OH-PHOs | S1 | 3.3963 | 365 | (0.69704) H→L | 0.6683 |
| S2 | 3.4735 | 357 | (0.70157) H-2→L | 0.0011 | |
| S3 | 3.9535 | 314 | (0.69131) H-1→L | 0.6960 | |
| SA | S1 | 3.2932 | 376 | (0.70025) H→L | 0.7985 |
| S2 | 3.6328 | 341 | (0.69900) H-1→L | 0.0000 | |
| S3 | 3.7808 | 328 | (0.70259) H-3→L | 0.0003 | |
| S4 | 4.0515 | 306 | (0.69207) H-2→L | 0.6351 |
| State | E (eV) | λflu (nm) | Contribution MO | f | |
|---|---|---|---|---|---|
| AE-PHOs | S1 | 0.6158 | 2013 | (0.70484) H→L | 0.0000 |
| AE-OH-PHOs | S1 | 1.1122 | 1115 | (0.70423) H→L | 0.0000 |
| AE-OH-PHOs-k | S1 | 2.3363 | 531 | (0.70719) H→L | 0.3710 |
| SA | S1 | 2.8331 | 438 | (0.70031) H→L | 1.0443 |
| SA-SPT | S1 | 2.3784 | 521 | (0.70706) H→L | 0.4243 |
| SA-DPT | S1 | 2.3882 | 519 | (0.70758) H→L | 0.6405 |
| D (Å) | t (Å) | H (Å) | Δσ (Å) | Sr (a.u.) | HDI | EDI | |
|---|---|---|---|---|---|---|---|
| AE -PHOs | 0.010 | −1.879 | 2.477 | 1.750 | 0.375 | 16.49 | 8.23 |
| AE-OH-PHOs | 0.303 | −1.537 | 2.504 | 1.696 | 0.381 | 16.48 | 8.20 |
| SA | 0.000 | −3.382 | 3.698 | −0.167 | 0.755 | 6.78 | 7.49 |
Publisher’s Note: MDPI stays neutral with regard to jurisdictional claims in published maps and institutional affiliations. |
© 2022 by the authors. Licensee MDPI, Basel, Switzerland. This article is an open access article distributed under the terms and conditions of the Creative Commons Attribution (CC BY) license (https://creativecommons.org/licenses/by/4.0/).
Share and Cite
Cao, Y.; Yu, X.; Sun, C.; Cui, J. Theoretical Investigation on the ESIPT Process and Detection Mechanism for Dual-Proton Type Fluorescent Probe. Int. J. Mol. Sci. 2022, 23, 2132. https://doi.org/10.3390/ijms23042132
Cao Y, Yu X, Sun C, Cui J. Theoretical Investigation on the ESIPT Process and Detection Mechanism for Dual-Proton Type Fluorescent Probe. International Journal of Molecular Sciences. 2022; 23(4):2132. https://doi.org/10.3390/ijms23042132
Chicago/Turabian StyleCao, Yunjian, Xiangrui Yu, Chaofan Sun, and Jingang Cui. 2022. "Theoretical Investigation on the ESIPT Process and Detection Mechanism for Dual-Proton Type Fluorescent Probe" International Journal of Molecular Sciences 23, no. 4: 2132. https://doi.org/10.3390/ijms23042132
APA StyleCao, Y., Yu, X., Sun, C., & Cui, J. (2022). Theoretical Investigation on the ESIPT Process and Detection Mechanism for Dual-Proton Type Fluorescent Probe. International Journal of Molecular Sciences, 23(4), 2132. https://doi.org/10.3390/ijms23042132