Article

Identification and Allele Combination Analysis of Rice Grain Shape-Related Genes by Genome-Wide Association Study

1
State Key Laboratory of Hybrid Rice, Hubei Lotus Engineering Center, College of Life Sciences, Wuhan University, Wuhan 430072, China
2
Institute of Food Crops, Hubei Academy of Agricultural Sciences, Wuhan 430064, China
3
Hunan Engineering Technology Research Center, Hunan Agricultural University, Changsha 410128, China
*
Authors to whom correspondence should be addressed.
Int. J. Mol. Sci. 2022, 23(3), 1065; https://doi.org/10.3390/ijms23031065
Submission received: 20 December 2021 / Revised: 14 January 2022 / Accepted: 17 January 2022 / Published: 19 January 2022
(This article belongs to the Special Issue Molecular Research in Rice: Genetics and Breeding)

Abstract

:
Grain shape is an important agronomic character of rice, which affects the appearance, processing, and the edible quality. Screening and identifying more new genes associated with grain shape is beneficial to further understanding the genetic basis of grain shape and provides more gene resources for genetic breeding. This study has a natural population containing 623 indica rice cultivars. Genome-wide association studies/GWAS of several traits related to grain shape (grain length/GL, grain width/GW, grain length to width ratio/GLWR, grain circumferences/GC, and grain size/grain area/GS) were conducted by combining phenotypic data from four environments and the second-generation resequencing data, which have identified 39 important Quantitative trait locus/QTLs. We analyzed the 39 QTLs using three methods: gene-based association analysis, haplotype analysis, and functional annotation and identified three cloned genes (GS3, GW5, OsDER1) and seven new candidate genes in the candidate interval. At the same time, to effectively utilize the genes in the grain shape-related gene bank, we have also analyzed the allelic combinations of the three cloned genes. Finally, the extreme allele combination corresponding to each trait was found through statistical analysis. This study’s novel candidate genes and allele combinations will provide a valuable reference for future breeding work.

1. Introduction

Rice is an important food crop, and its production is of great significance to global food security, social stability, and economic development. 1000-grain weight is an essential factor affecting yield, and it can be inherited stably [1]. In addition, the factors determining 1000-grain weight can be divided into three aspects of grain shape: grain length, grain width, and grain thickness, and with the increase of grain length, grain width, and grain thickness, 1000-grain weight also increased [2]. In addition, grain shape has an essential effect on rice yield. It affects the appearance, processing, and edible quality of rice, which directly affects the market demand for rice. Across the globe, rice preferences vary markedly in grain shape: People in Europe, the United States, southern China, and Southeast Asia prefer slender rice, while people in Japan, the Korean Peninsula, and northern China prefer short, round rice [3]. In addition to grain shape, other appearance qualities of rice also include chalkiness, transparency, and color. Some studies showed that grain length was negatively correlated with chalkiness rate, while grain width was positively correlated [2]. For processing quality, in general, grain width and grain thickness were positively correlated with head rice rate, while grain length was negatively correlated. Grain shape has an essential effect on rice yield and quality traits. Therefore, identifying the genes that affect rice grain shape and elucidating their mechanism is an effective way to develop high-yield and high-quality rice.
Many factors affect the grain shape of rice, including the size and shape of the glume, the process of grain filling after flowering, and the development of grains. Genes involved in these pathways can directly or indirectly regulate the development of grain shape. The classification of cloned genes affecting grain shape generally shows the following ways to control rice grain shape: 1. endogenous hormone regulation, 2. G protein signaling pathway, 3. ubiquitin-proteasome pathway, 4. transcriptional regulation, 5. epigenetic pathway, 6. other regulatory pathways. These regulatory pathways are not independent of each other but often interweave together and act together. For example, OsSCP46 interacts with ABA-induced protein DI19-1 and participates in the abscisic acid signaling pathway. OsSCP46 coding a serine peptidase is a vital control factor for grain grouting and seed germination. Knocking out OsSCP46 would reduce grain size, grain length, grain width, and 1000-grain weight [4]. GW5 protein is a novel positive regulator of brassinolide signal transduction. It regulates the expression level of the brassinolide response gene and growth response. In addition, GW5 encodes a calmodulin-binding protein and is a significant grain width gene. The grain size of GW5 overexpressed mutants was slenderer than that of the wild type [5]. GS3 encodes a γ subunit of G protein and is a significant grain length and weight gene. GS3 plays a negative regulator role in regulating grain size. GS3 does not directly restrict grain size but competes with DEP1 and GGC2 in binding G protein β subunits [6]. OsDER1 is associated with the endoplasmic reticulum-associated protein degradation pathway. Overexpression or inhibition of OsDER1 would activate the unfolded protein response, making rice more sensitive to ER stress and significantly increasing the ubiquitinated protein level. Inhibition of OsDER1 expression would reduce both grain length and grain width [7]. Both OsmiR396a and OsmiR396c are micro RNAs that regulate the expression of OsGRFs, a growth regulator. Overexpression of OsmiR396a did not affect grain size. However, downregulation of OsmiR396a expression level would increase grain length and 1000-grain weight but decrease grain width [8]. OsmiR396c overexpressed mutants’ grain length, width, and weight would fall [9]. JMJ703, an active H3K4-specific demethylase in rice, can specifically reduce the methylation level of histone H3K4. The grain length, width, and thickness of the JMJ703 mutant were reduced [10]. OsCTPS1 encodes a CTP synthase. OsCTPS1 interacts with tubulin, participates in microtubule function, promotes endosperm nuclear separation, influences endosperm early development, and positively regulates rice grain size and weight. Grain length, grain width, and grain thickness of OsCTPS1 overexpressed lines were higher than those of wild type [11]. OsARG encodes an arginase, a key enzyme in arginine metabolism. OsARG-deficient mutants had smaller grains. OsARG plays a vital role in the panicle development of rice, especially under the condition of insufficient exogenous nitrogen. Therefore, OsARG can improve the nitrogen use efficiency of rice and is a potential target gene in crop improvement [12].
In this study, we have a natural population containing 623 indica rice cultivars with rich genetic diversity for GWAS (Genome-wide association studies) analysis. We combined rich phenotypic and genotypic data and adopted a strict MLM model for GWAS analysis. We further analyzed the results of GWAS using a variety of methods. Finally, we identified three cloned genes and seven new candidate genes. In addition, we have done allele combinations research among the three cloned genes through statistical analysis. The discovery of new genes will help us better understand grain shape regulation mechanisms. In addition, the new candidate genes and allele combinations found in this experiment will provide a valuable reference for future breeding work.

2. Results

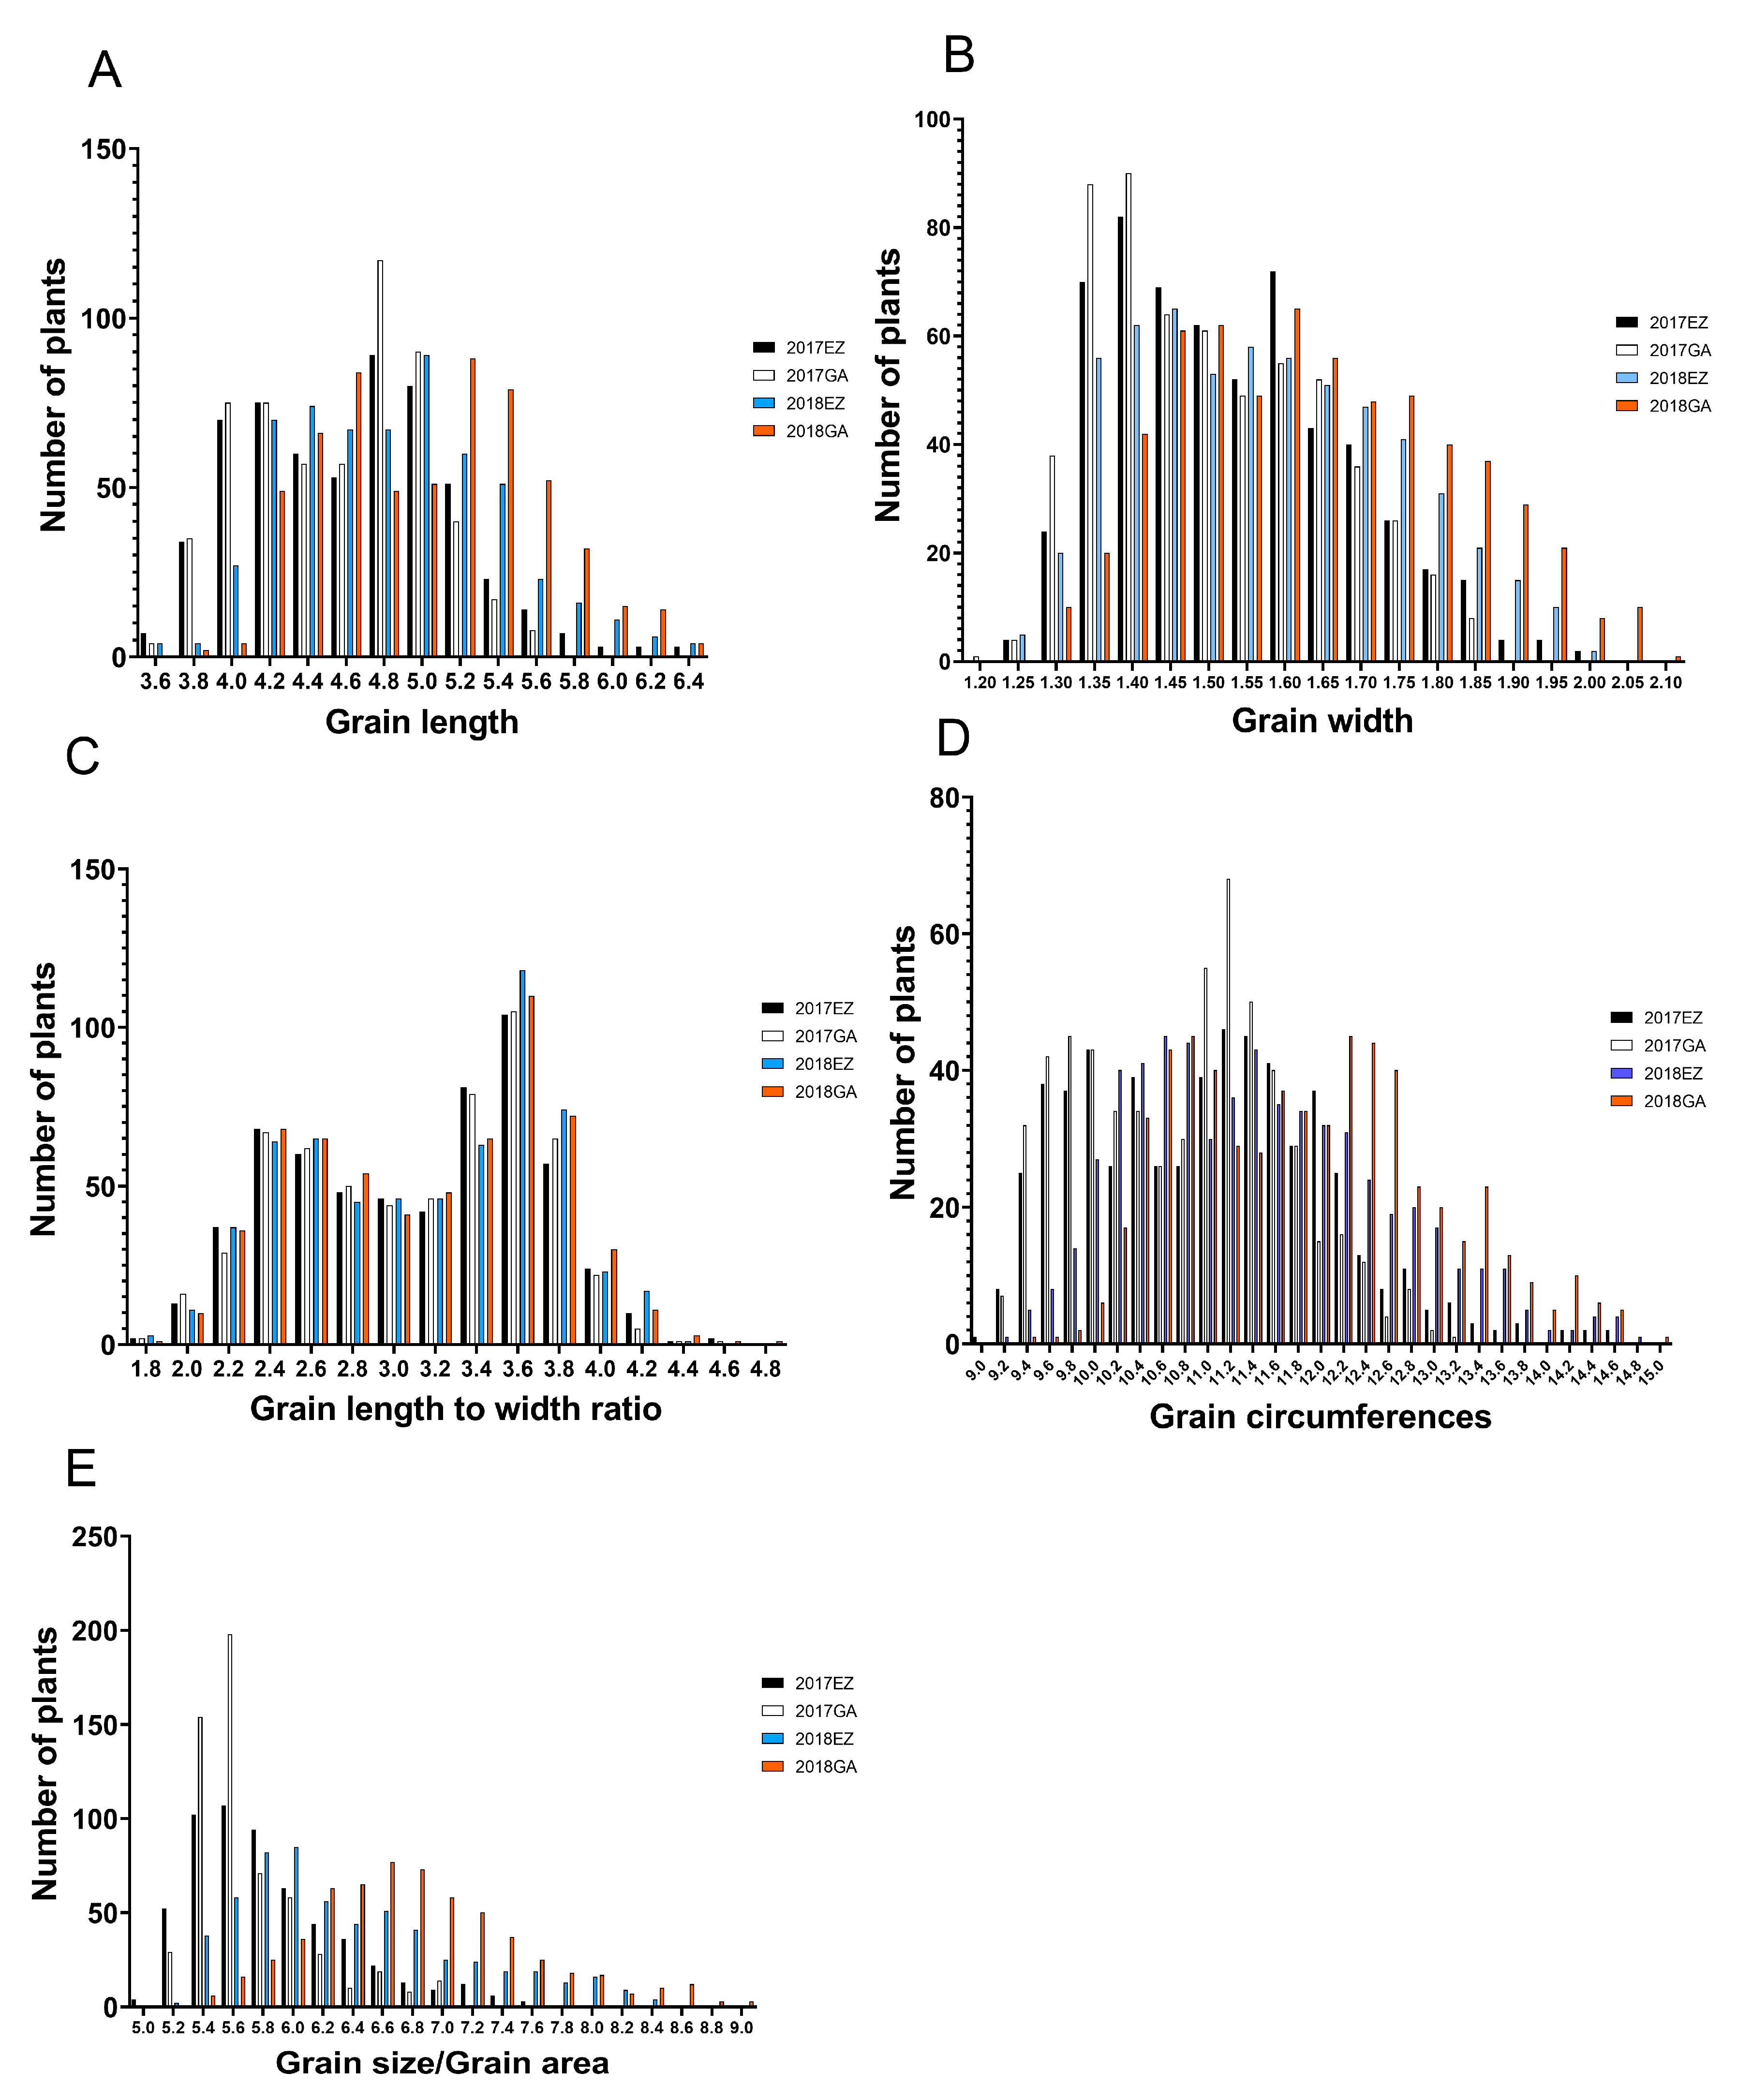
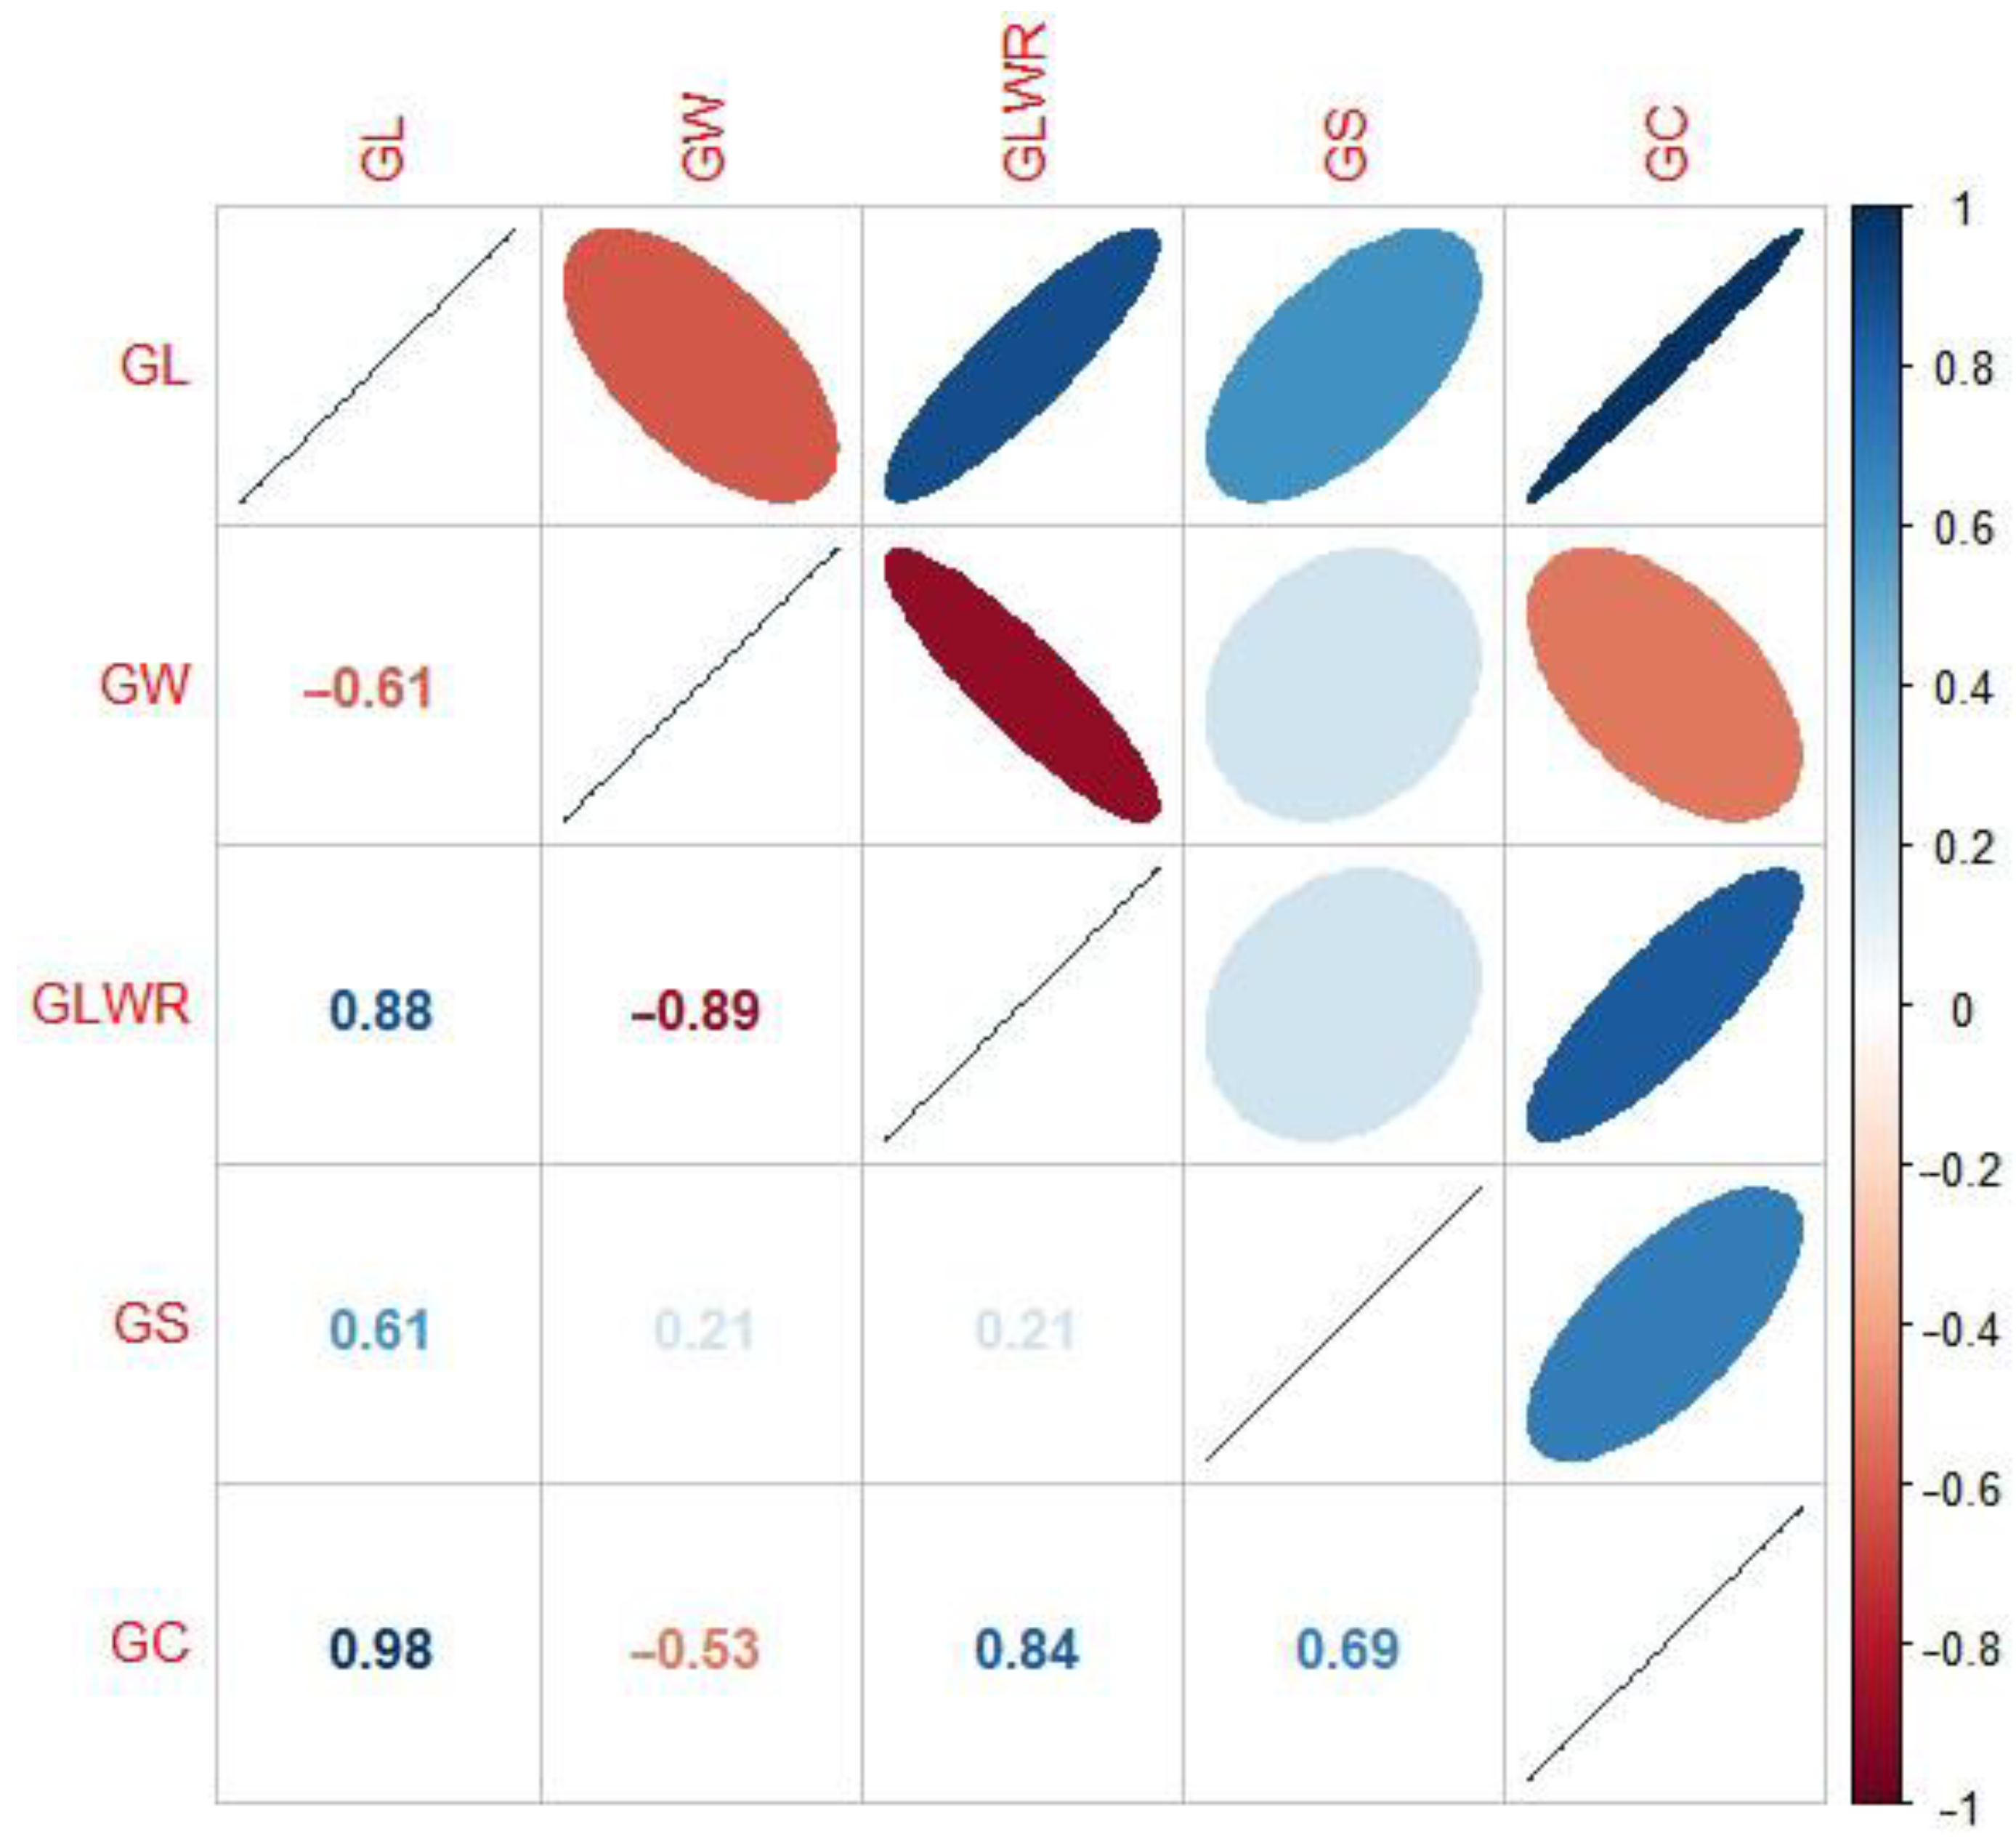
2.1. Distribution and Correlation of Phenotype and Heritability of Grain Shape

In general, the phenotype of quantitative traits is normally distributed. This is because multiple genes with minor effects mainly control quantitative characteristics. However, in this study, the phenotypic distribution of grain length, grain width, grain length to width ratio, and grain circumference showed bimodal distribution except for the normal distribution of grain area (Figure 1). The distribution of phenotypes suggested that grain length, grain width, grain length to width ratio, and grain circumference were controlled by a major effect gene [13]. In contrast, grain area was controlled by multiple minor effect genes. Moreover, the wide range of phenotypic differences also indicates the rich genetic diversity of the study population. In terms of phenotypic correlation, grain length was significantly negatively correlated with grain width, while grain length was significantly positively correlated with other traits; Grain width was negatively correlated with grain length to width ratio and grain circumference, but positively correlated with grain area; Grain length-width ratio was positively correlated with grain area and grain circumference; Grain area was positively correlated with grain circumference (Figure 2). We also carried out Mahalanobis distance calculation and canonical variables analysis (CVA) for these grain shape traits, and the results were consistent with the above analysis (Table 1, Figure 3). In terms of heritability, the grain length to width ratio had the highest heritability (0.816), and the grain area had the lowest heritability (0.311). A high heritability indicates the stability of heredity, while a low heritability indicates that the character is greatly affected by the environment (Table 2).

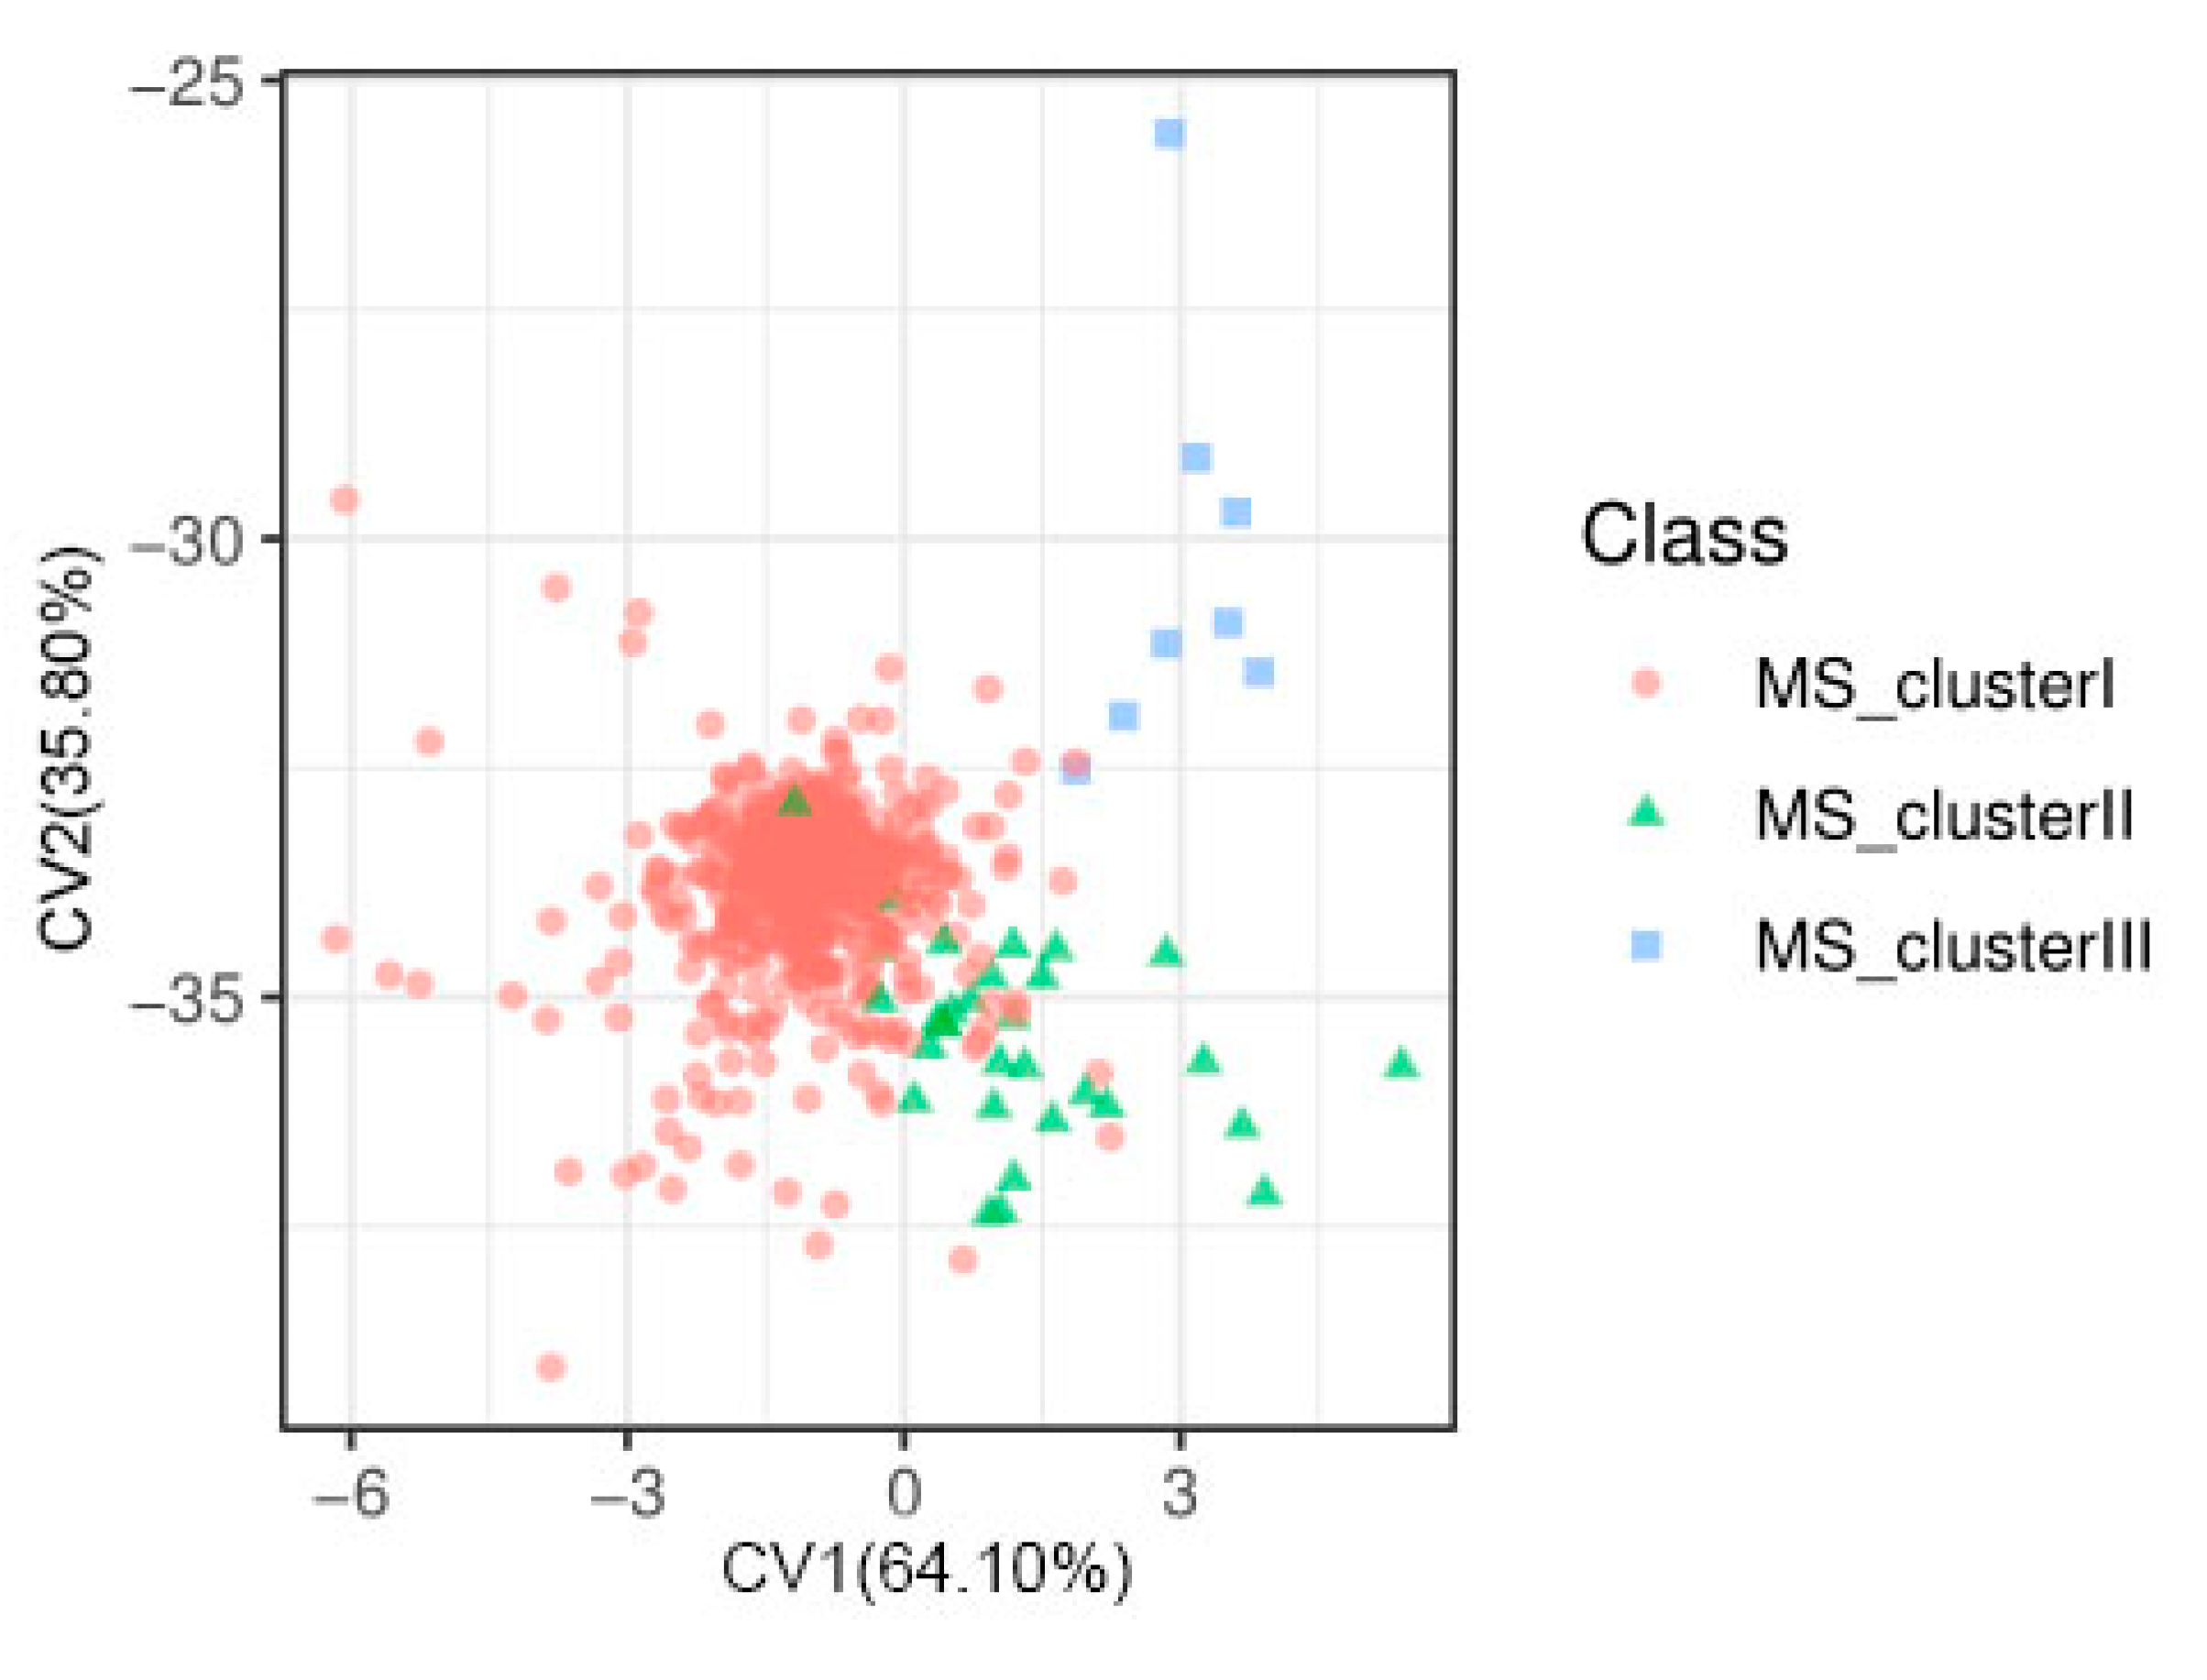
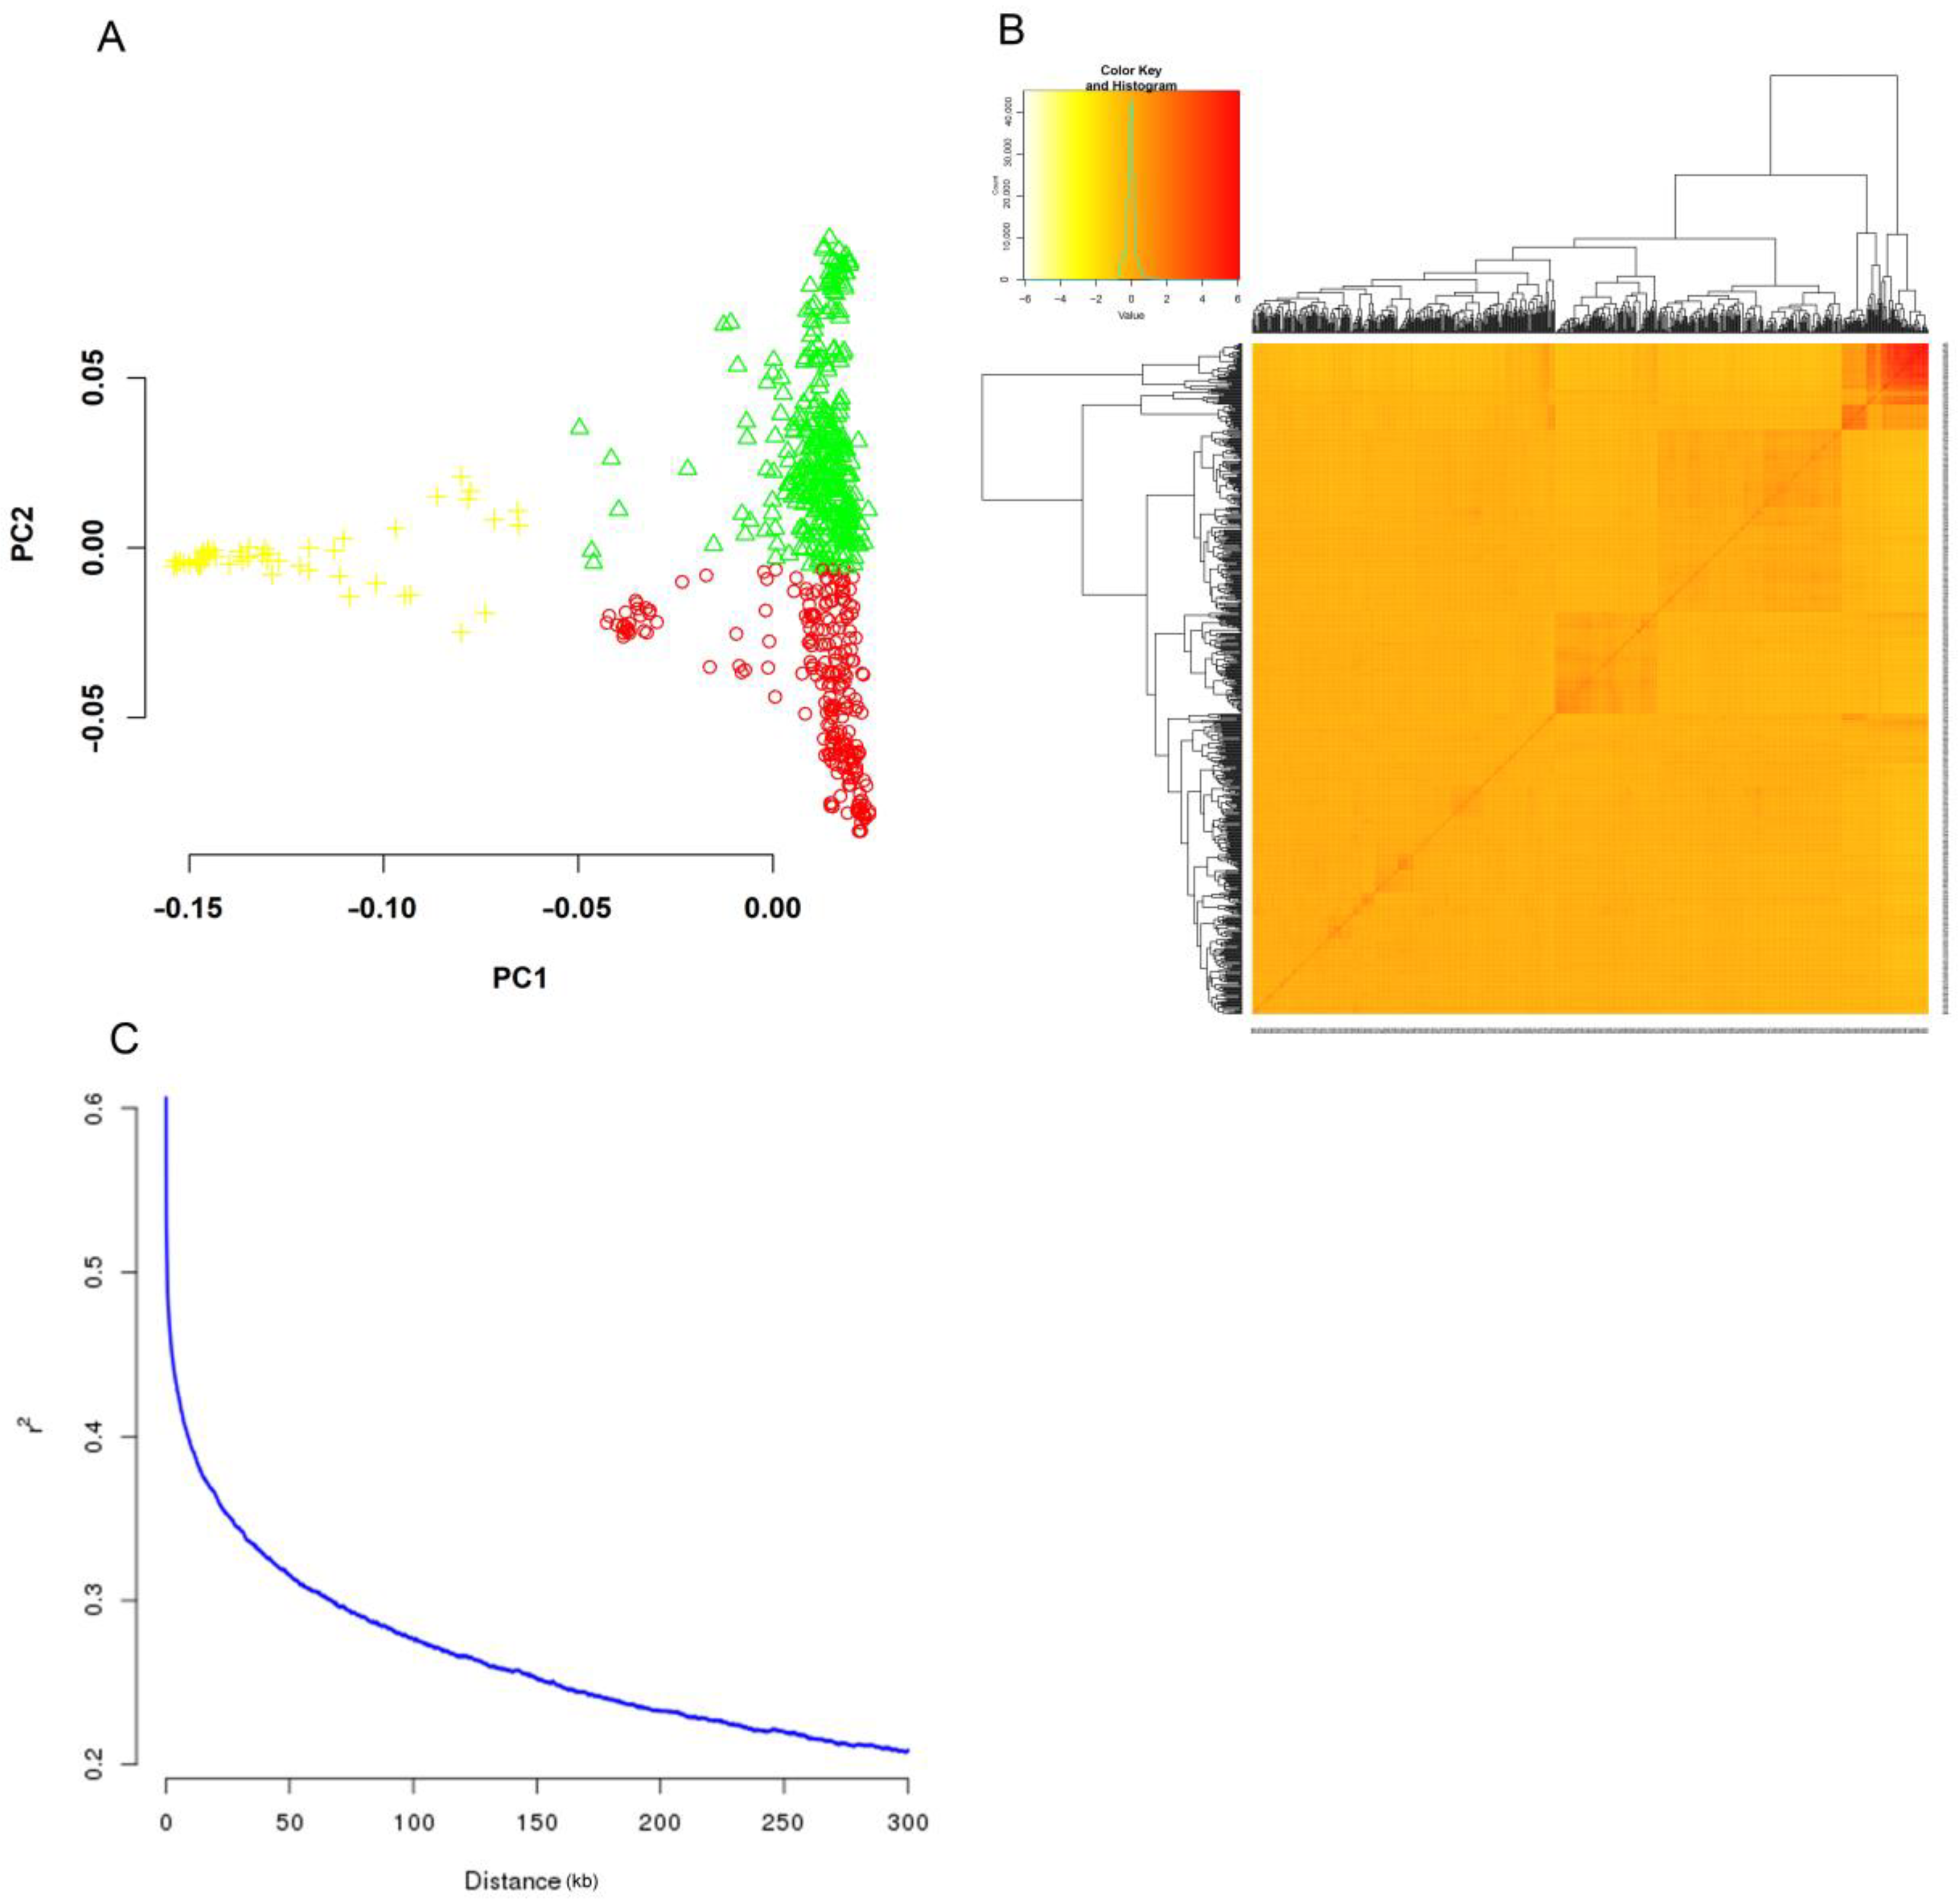
2.2. Population Structure, Kinship, and LD Decay

As can be seen from the diagram of principal component analysis, scattered points are continuously distributed without evident clustering (Figure 4A). There were also no significant hot spots on the kinship map (Figure 4B). This indicates that our experimental population has no significant genetic structure and kinship. Combined with the distribution of phenotypes, it can be said that our experimental population fully conforms to the standard of the related population.
The LD decay distance determines the minimum number of molecular markers (Minimum molecular markers = genome size /LD decay distance) required for association analysis and the resolution of association analysis. As can be seen from the LD attenuation diagram, the LD attenuation distance is about 65 kb (Figure 4C). We have 2,416,716 SNPs, which is perfectly sufficient. In general, the richer the genetic diversity of the population, the shorter the LD attenuation distance, and vice versa [14]. Previously, it was reported that the LD decay distance of rice was about 130 kb [15]. Compared with this, our LD decay distance was smaller, and the population’s genetic diversity was richer. All of these will help us identify candidate genes.

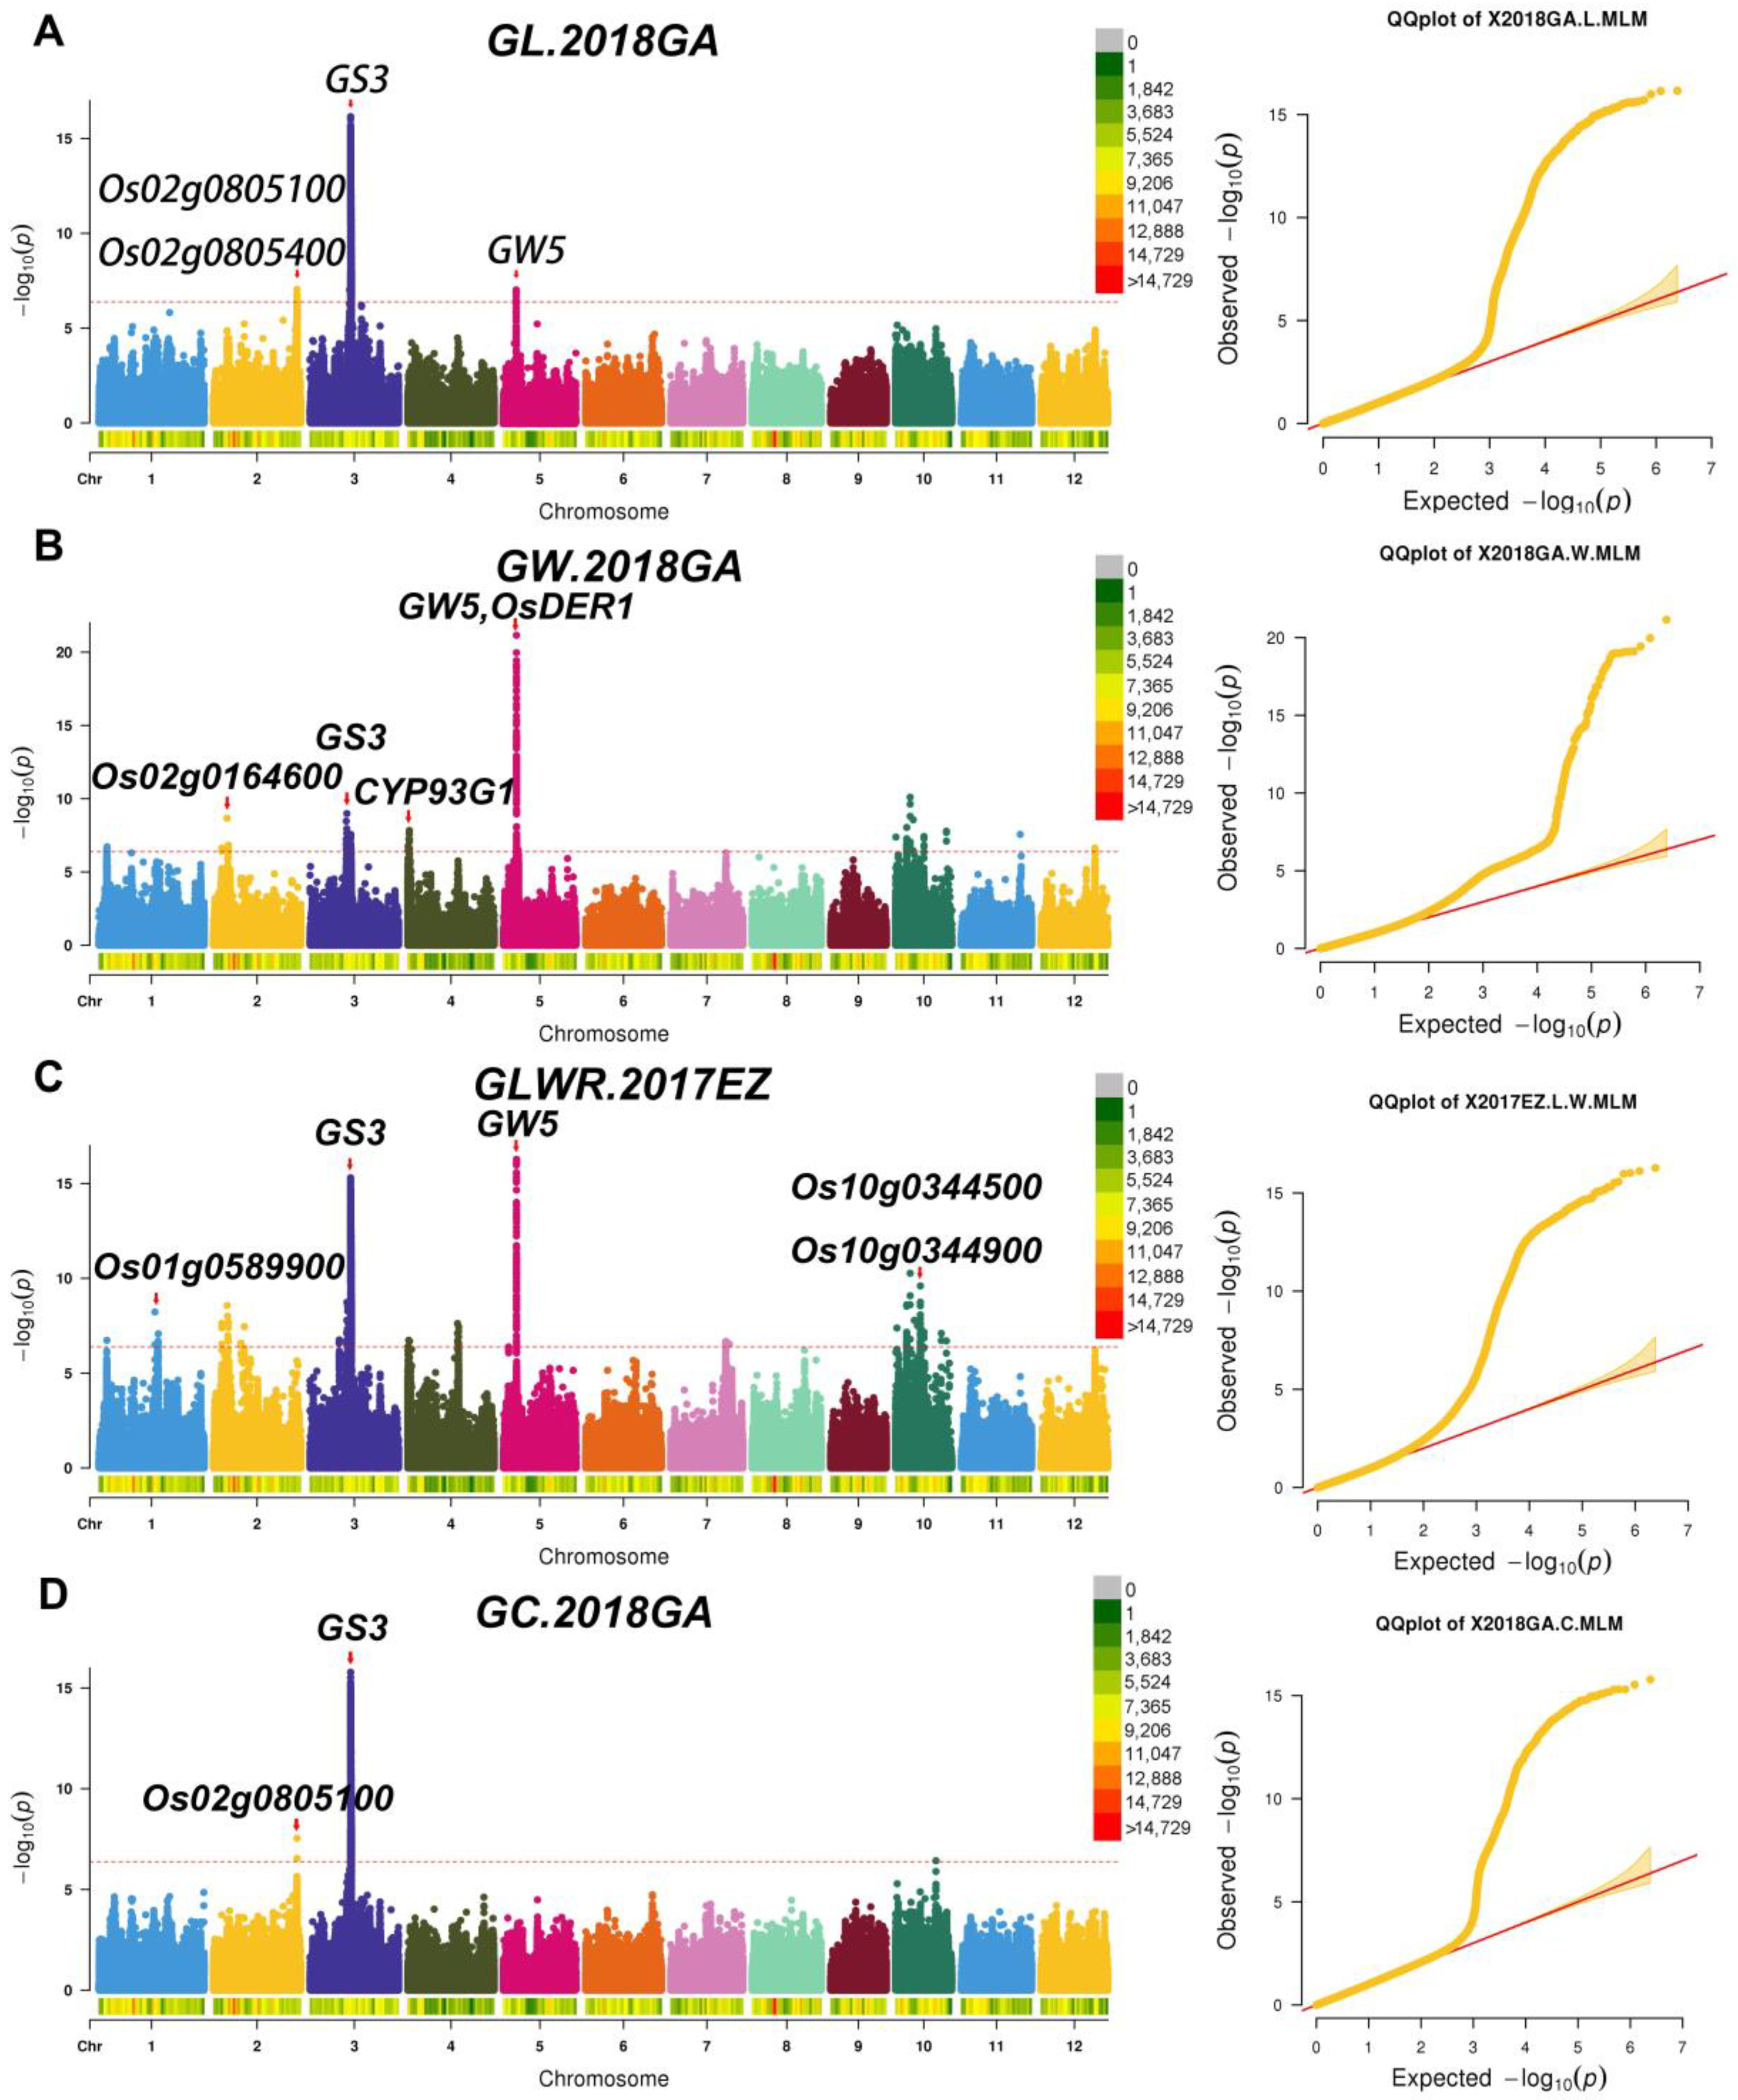
2.3. Identification of Significant Loci for Related Traits through GWAS

For two years (2017, 2018) in Gongan/GA and Ezhou/EZ, Hubei Province, China, a total of 95 QTLs were detected. QTLs for grain width were the most (38), while QTLs for grain area were the least (2). 2017GA detected the most QTLs (51), while 2018EZ detected the least QTLs (39). Among the 95 QTLs, 40 QTLs were repeatedly detected, 15 QTLs regions with cloned genes, 24 QTLs with PVE ≥ 10% (Table S1). Finally, 39 important QTLs were selected for further analysis (Table 3).

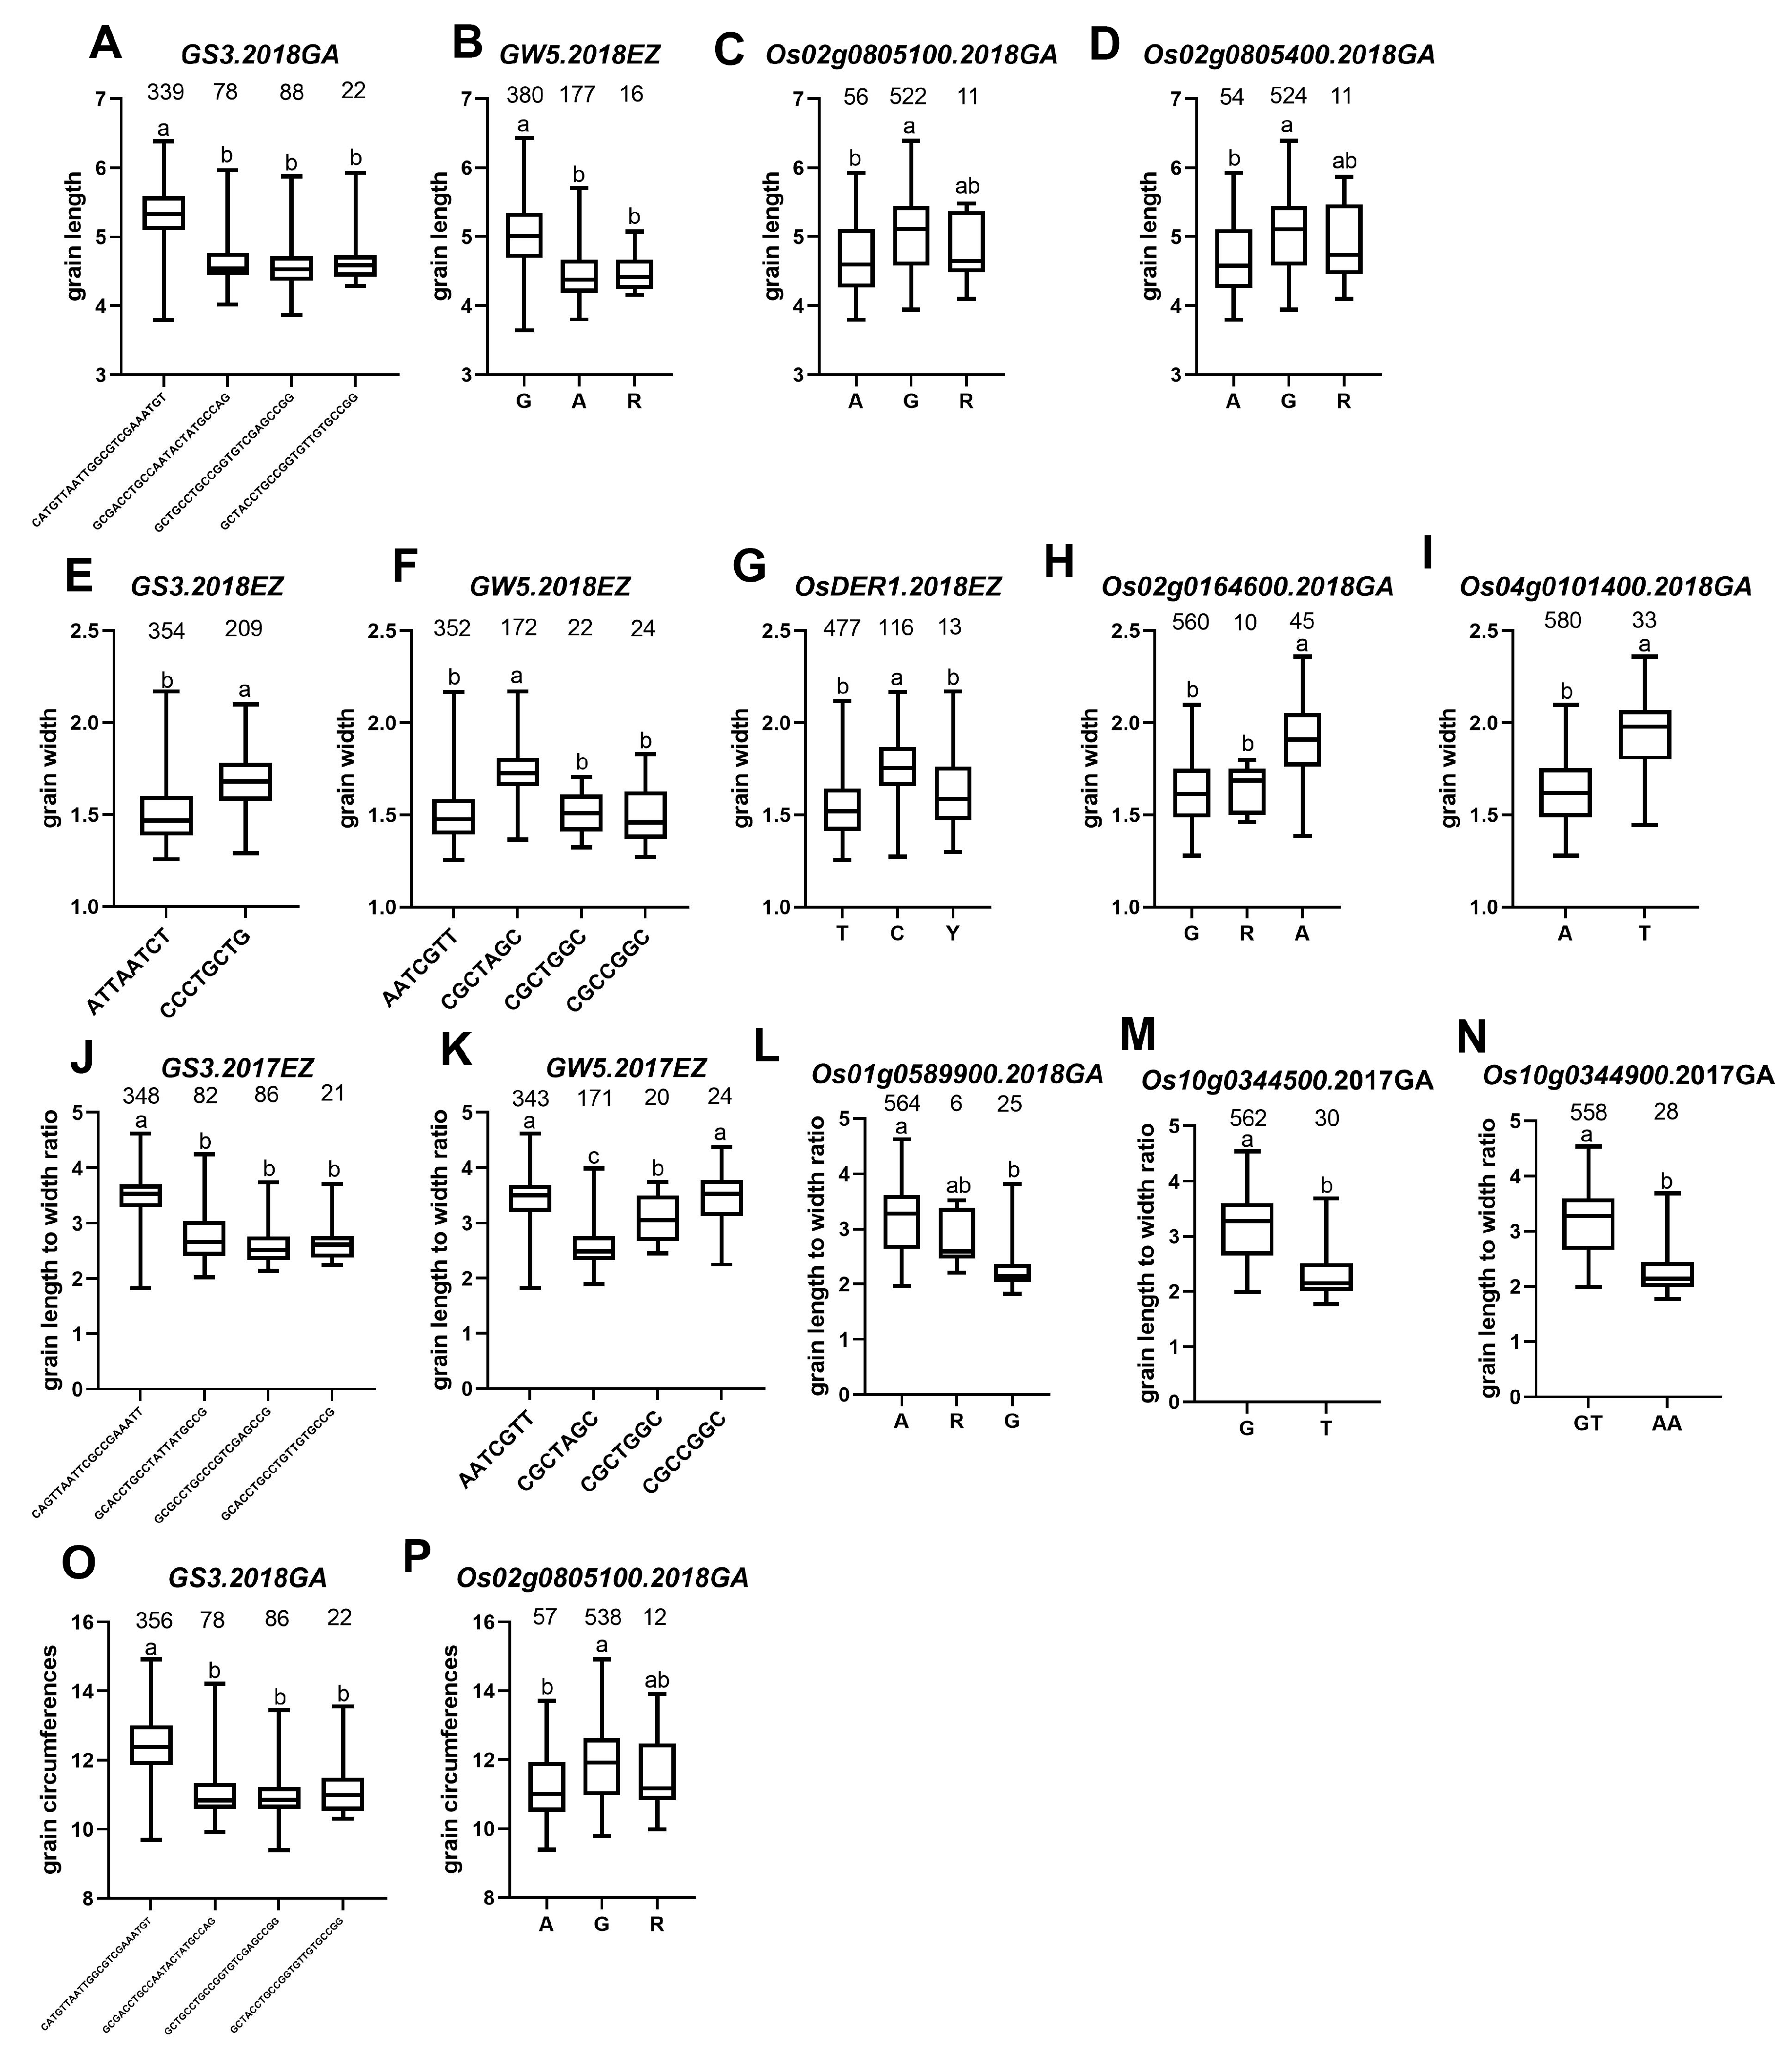
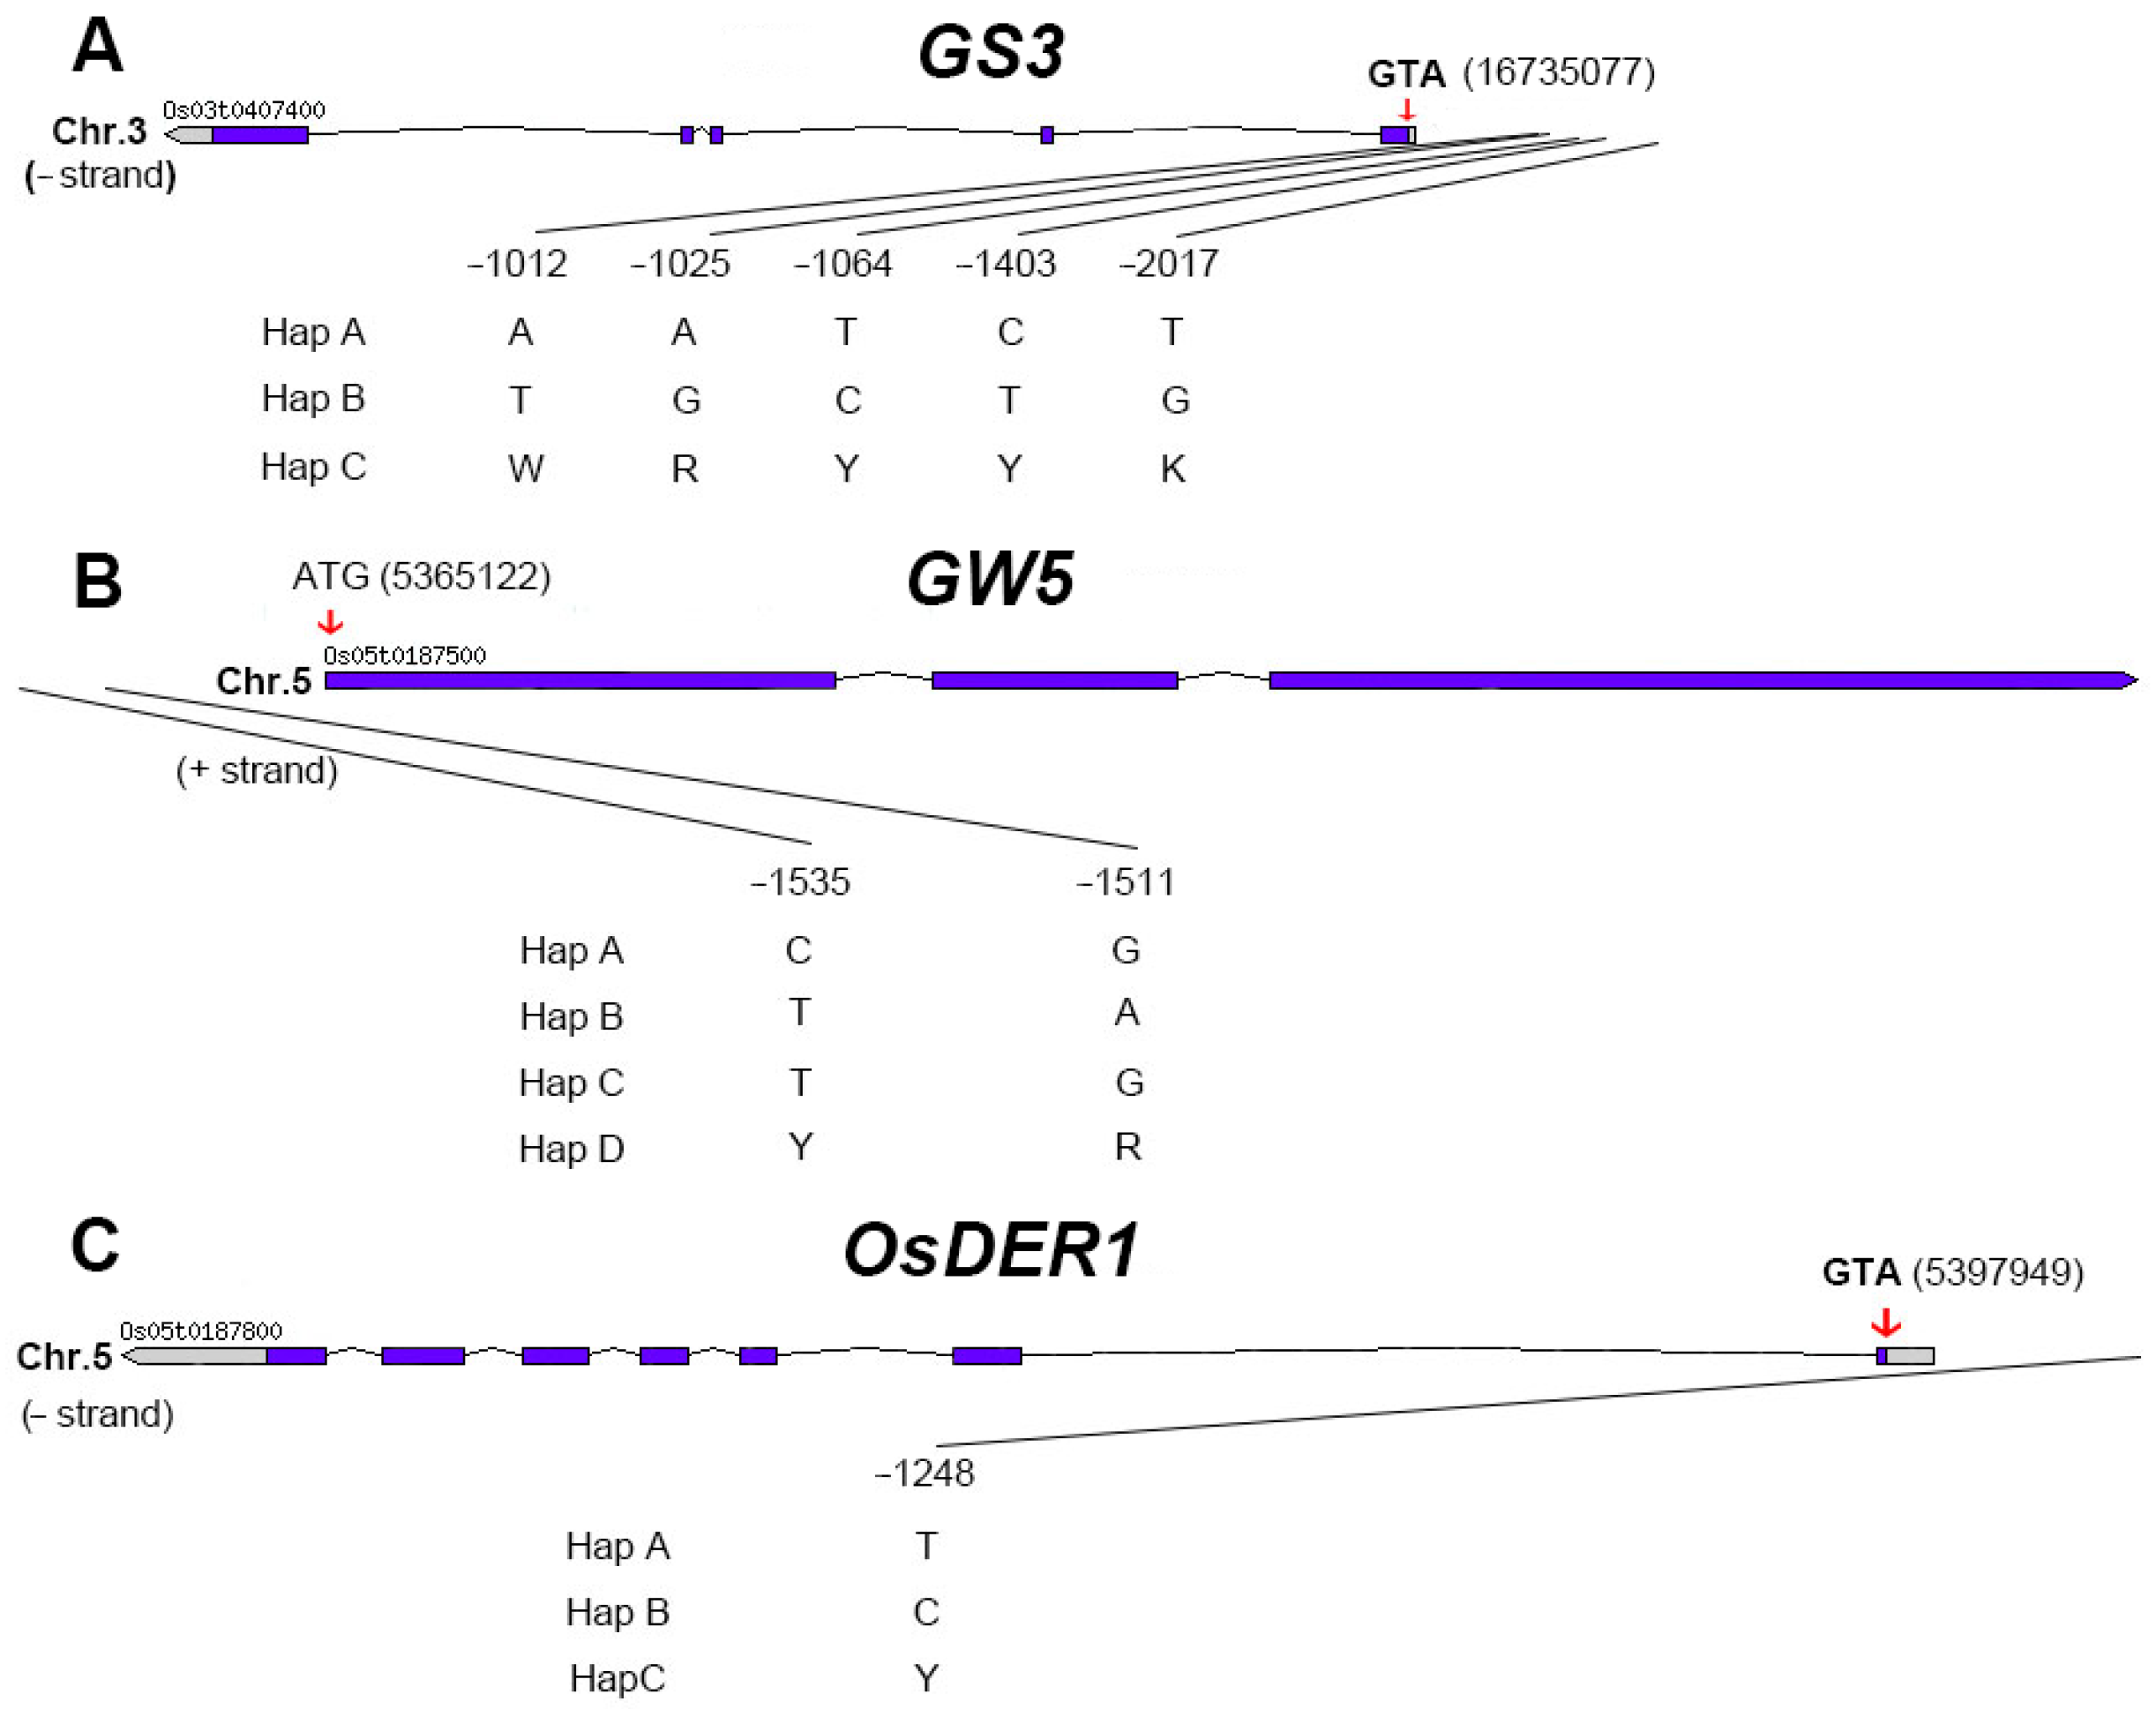
2.4. Candidate Genes Screen in Important QTL Regions

We have selected 39 important QTLs for further analysis involving four-grain shape traits: grain length, grain width, grain length to width ratio, and grain circumference. Through analysis, three cloned genes were identified: GS3, GW5, and OsDER1, seven novel candidate genes were identified: Os02g0805100, Os02g0805400, Os02g0164600, CYP93G1, Os10g0344500, Os10g0344900, and Os02g0805100 (Figure 5). Most of these genes are pleiotropic and affect multiple traits.
In terms of grain length/GL, we have screened 4 QTLs (qGL2, qGL3.2, qGL3.3, qGL5) for analysis. Moreover, three (qGL2, qGL3.3, qGL5) of the four QTL intervals contained reported genes, 2 QTLs: qGL3.3 and qGL5 were detected repeatedly (Table 3). According to the functional annotation, there are 147 genes in these 4 QTLs intervals. In addition, according to the haplotype analysis, 15 genes belong to group I, 32 belong to group II. In the two groups, 15 genes were repeatedly detected, and, in total, 32 genes were detected, including two cloned genes: GS3 and GW5 (Figure 6A,B). GS3 was detected in all environments, and GW5 was detected except for 2018GA. Moreover, GS3 also has a greater PVE value than GW5 (Table 3), which coincides with previously reported that GS3 has a major effect on grain length, while GW5 has a minor impact on grain length. However, in the qGL2 interval, we have not identified OsmiR396a and OsmiR396c (Table 3). In qGL2, four genes (Os02g0804900, Os02g0805100, Os02g0805300, and Os02g0805400) belong to group II. According to the functional annotation, Os02g0804900 is identical to RNRL2 [16]. RNRL2 encodes a large ribonucleic acid reductase subunit involved in chlorophyll metabolism and regulates leaf color. Os02g0805100 is an auxin/IAA gene (Figure 6C), Os02g0805300 encodes an expressed protein, and Os02g0805400 encodes a kelch repeat protein (Figure 6D). In the previous study, we know that auxin/IAA plays a vital role in regulating rice grain shape; Furthermore, one gene, OsPPKL2, encodes a protein phosphatase containing the kelch repeat domain and plays a positive regulator role in rice grain length regulation [17]. Therefore, we selected Os02g0805100 and Os02g0805400 as candidate genes based on their function correlation with cloned grain shape genes. Although qGL3.2 had a large PVE value (20.37%, Table 3), only one gene, Os03g0400600, with the unknown function, was found in this interval.
In terms of grain width/GW, we have screened 10 QTLs (qGW1.3, qGW2.1, qGW3.4, qGW4.1, qGW5.1, qGW5.2, qGW10.1, qGW10.7, qGW10.8, qGW10.12) for analysis. Among the 10 QTLs, 6 QTLs (qGW1.3, qGW3.4, qGW4.1, qGW5.1, qGW5.2, qGW10.1) intervals contained cloned genes. Except for qGW1.3 and qGW5.2, the other eight QTLs were repeatedly detected (Table 3). There were 343 genes in the 10 QTLs intervals, including four genes belonging to group I and 42 belonging to group II. A total of 42 genes were found between the two groups, including three cloned genes: GS3, GW5, and OsDER1 (Figure 6E–G). GS3 was detected in all environments, GW5 was detected except for 2018GA, and OsDER1 was detected only in 2018EZ. Furthermore, GW5 had the highest mean PVE values (36.48%) (Table 3) among these genes, confirming that GW5 was the dominant gene for grain width. However, for the remaining four cloned genes (OsCTPS1, OsARG, JMJ703, and OsSCP46) in the interval, through analysis, we have not identified them. In the gap of qGW2.1, we found five genes Os02g0162000 (Cytochrome c oxidase), Os02g0162500 (a ribosomal protein), Os02g0162600 (Conserved hypothetical protein), Os02g0164300 (galactosyltransferase), and Os02g0164600 (Pentatricopeptide repeat domain-containing protein) belonging to group II. At the same time, we know that OsSMK1 also encodes a pentatricopeptide repeat protein, OS_smk1-1 homozygous mutant seeds were shriveled [18]. Therefore, we selected Os02g0164600 (Figure 6H) as the candidate gene. During the interval of qGW4.1, we found 21 genes belonging to group II. Os04g0101400 is identical CYP93G1, encoding cytochrome P450. But, in previous reports, it was not stated that Os04g0101400 affects grain shape [19]. However, our analysis showed a significant correlation with grain width. In addition, we also found that there are three genes, GL3.2, CYP78A13, and CYP724B1 [20,21] that encode cytochrome P450, all of which significantly affect grain shape. Finally, after haplotype analysis and functional annotation, we selected Os04g0101400 (Figure 6I) as a candidate gene.
In terms of grain length to width ratio/GLWR, we have screened 22 QTLs for analysis. Among the 22 QTLs, 2 QTLs (qGLWR3.3 and qGLWR5.2) contained cloned genes; Except for qGLWR2.4, qGLWR2.6, qGLWR2.7, qGLWR10.2, and qGLWR10.4, the other 17 QTLs were repeatedly detected (Table 3). There were 770 genes in the 22 QTLs intervals, including 15 genes belonging to group I and 51 genes belonging to group II. A total of 51 genes were found between the two groups, including two cloned genes: GS3 and GW5 (Figure 6J,K). Both GS3 and GW5 were detected in all environments, and both GS3 and GW5 had large PVE (39.32% and 41.66%, respectively) (Table 3) values and had important effects on grain length to width ratio. At the same time, we have not screened the cloned gene OsDER1 within the interval of qGLWR5.2. In qLWR1.2, only one gene, Os01g0589900 (Figure 6L), encodes a pentatricopeptide repeat protein. We selected Os01g0589900 as the candidate gene. In the interval of qGLWR10.10, we found six genes Os10g0343050 (expressed protein), Os10g0343200 (membrane-associated DUF588 domain-containing protein), Os10g0343400 (CSLF7 - cellulose synthase-like family F), Os10g0343951 (Hypothetical conserved gene), Os10g0344500 (MATE efflux family protein), and Os10g0344900 (MATE efflux family protein) belonging to group II. At the same time, we know that BIRG1 also encodes a MATE efflux family protein and functions as a chloride efflux transporter involved in mediating grain size [22]. Therefore, we selected Os10g0344500 and Os10g0344900 (Figure 6M,N) as candidate genes.
In terms of grain circumferences/GC, we have screened 3 QTLs: qGC2, qGC3, and qGC5 for analysis. These three QTLs intervals all contain cloned genes associated with grain shape. While only one QTL qGC3 was repeatedly detected (Table 3). There were 116 genes in the three QTLs intervals, including 15 genes belonging to group I and 27 genes belonging to group II. And a total of 27 genes were found between the two groups, including one cloned gene: GS3 (Figure 6O). GS3 was detected in all environments except for 2018GA. MicroRNA OsmiR396a and OsmiR396c, and the genes GW5 and OsDER1, were not identified by screening. In qGC2, there is only one gene, Os02g0805100 (Figure 6P); We already knew that Os02g0805100, which encodes auxin/IAA, was a candidate gene for grain length, and now we found that it pleiotropic, and it also a candidate gene for grain circumference.

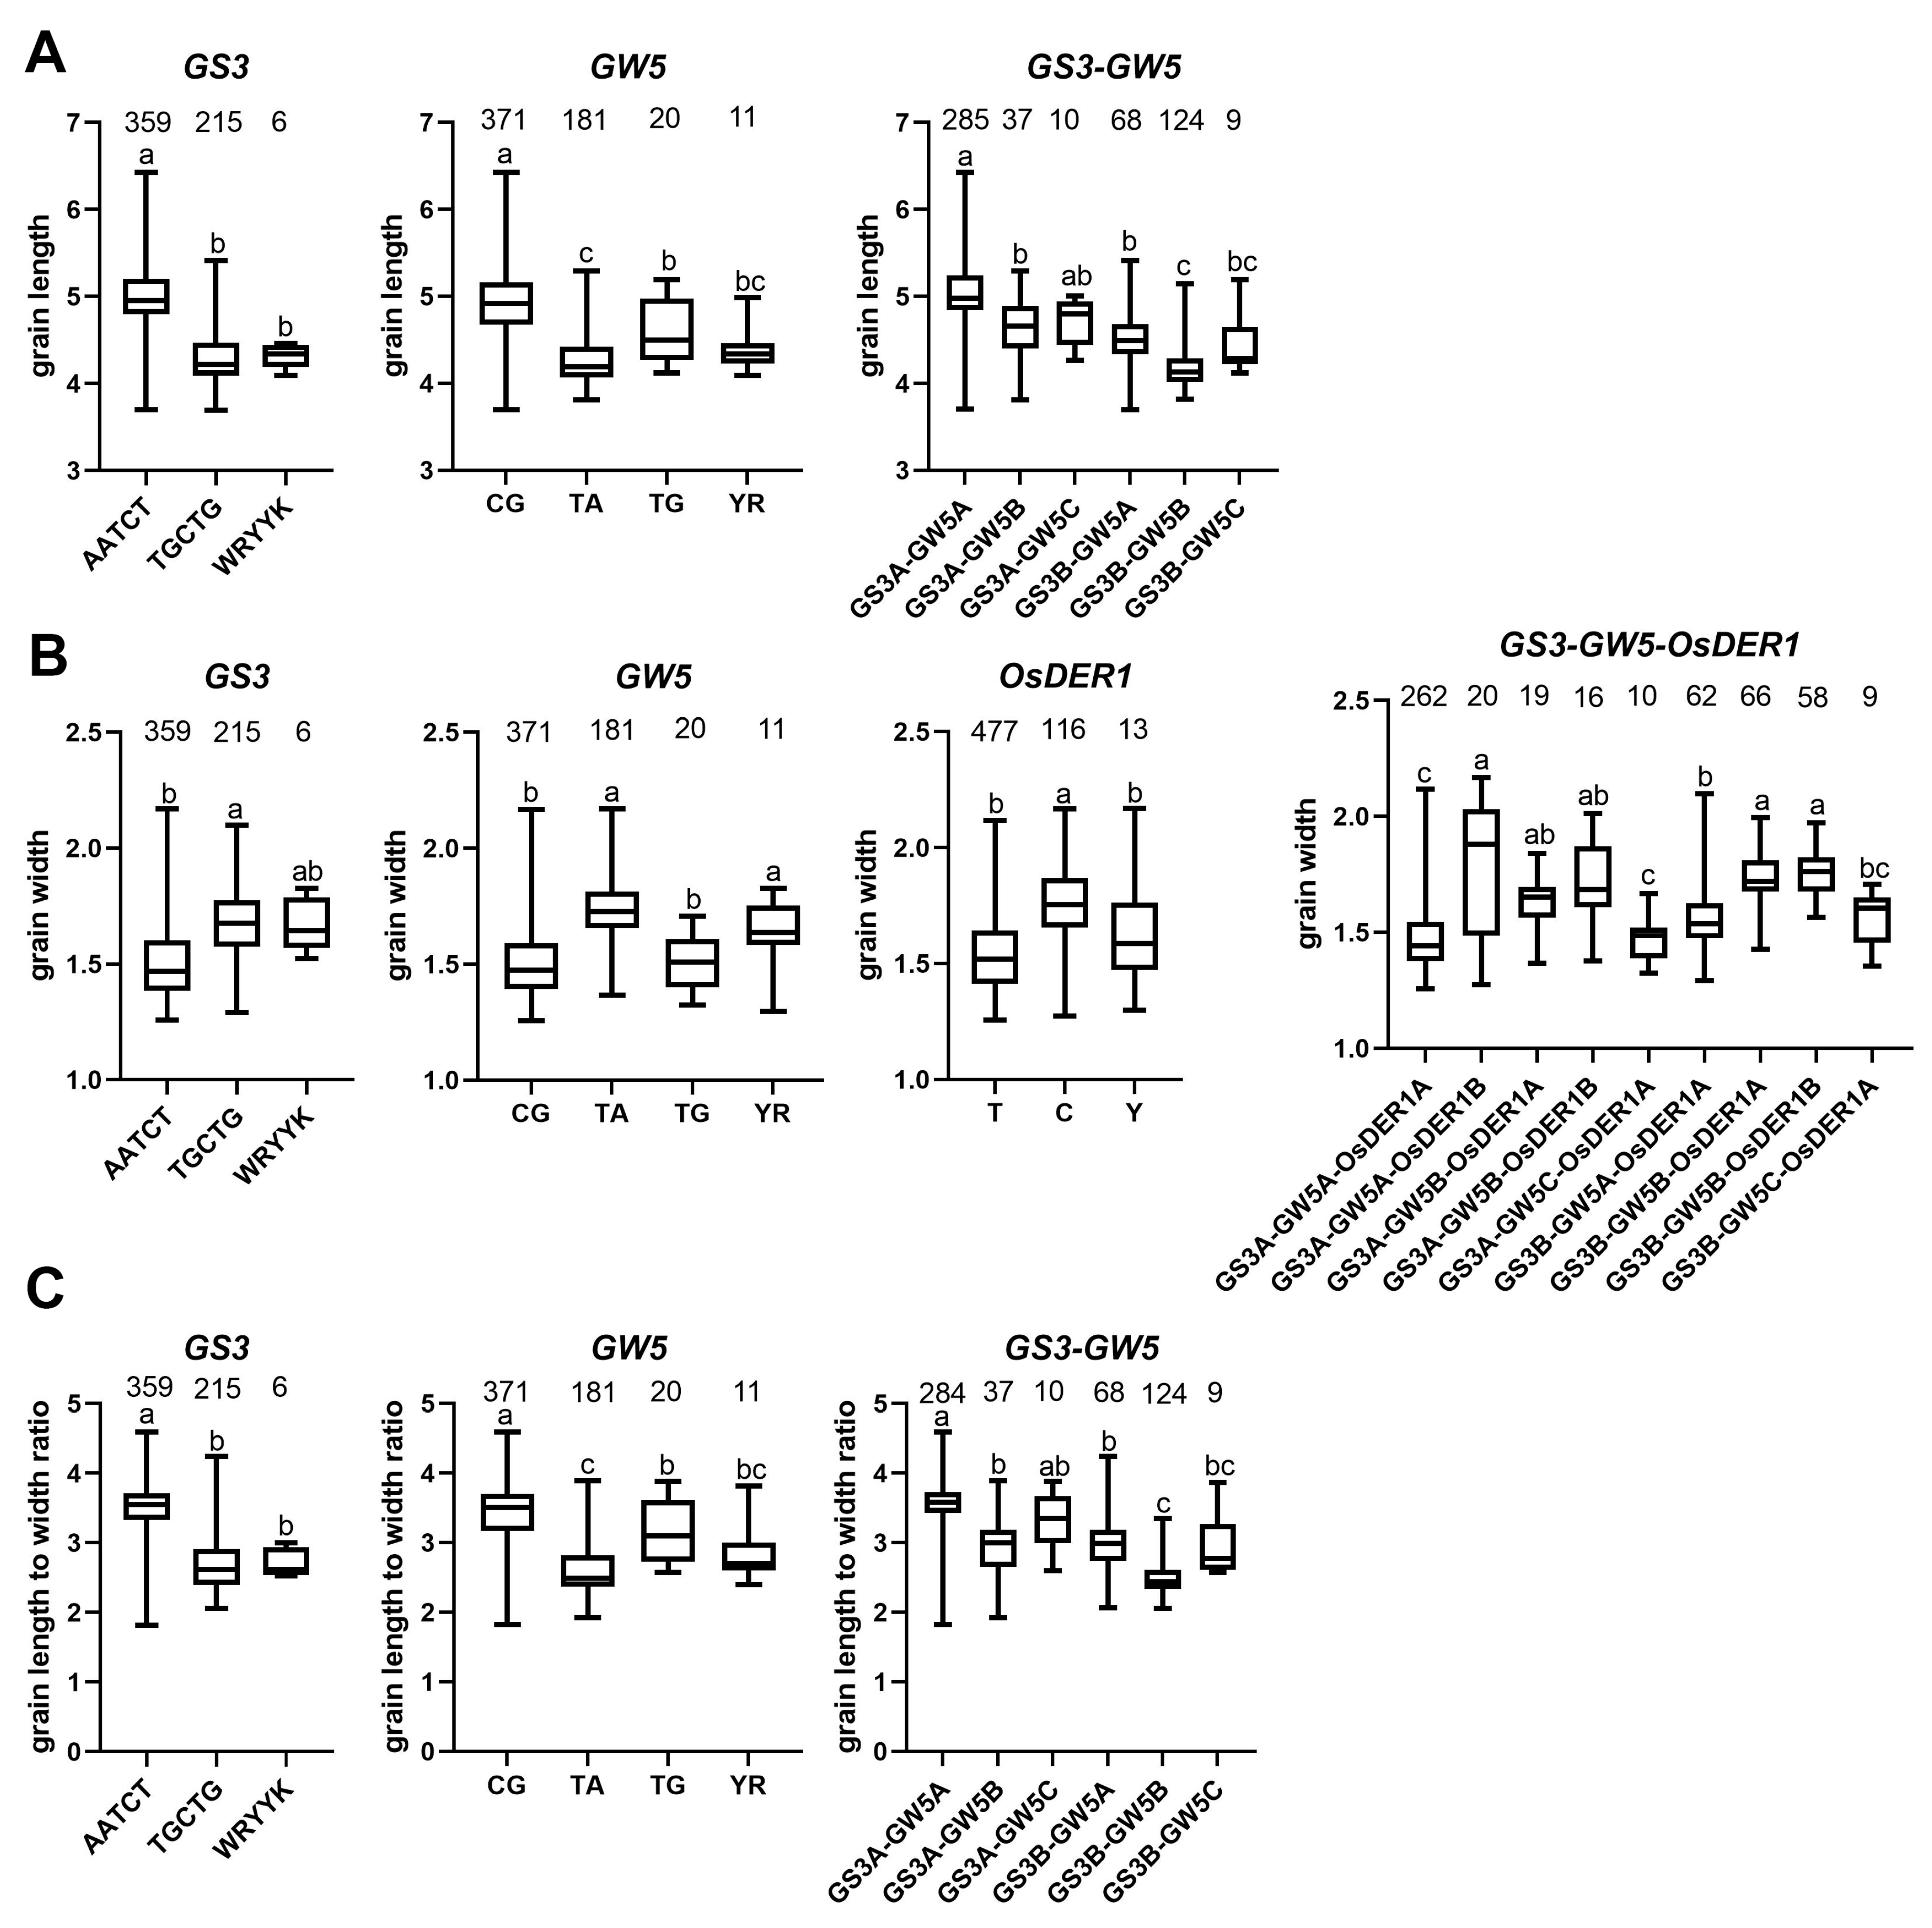
2.5. Extreme Combination of Alleles for Each Trait

Due to the limitations of detected cloned genes, only allelic combinations of grain length/GL, grain width/GW, and grain length to width ratio/GLWR were analyzed; For GL and GLWR, we will explore the combination between the GS3 and GW5 alleles. And, for GW, we will examine the cross between the GS3, GW5, and OsDER1 alleles.
Through allele analysis, we found that GS3 had three alleles: Hap A (AATCT), Hap B (TGCTG), and Hap C (WRYYK) (Figure 7A). GW5 has four alleles: Hap A (CG), Hap B (TA), Hap C (TG), and Hap D (YR) (Figure 7B). OsDER1 also has three alleles: Hap A (T), Hap B (C), and Hap C (Y) (Figure 7C).
For grain length, Hap A (AATCT) has the most extended grain length in terms of GS3, Hap B (TGCTG), and Hap C (WRYYK) have nearly the same short-grain length. For GW5, Hap A (CG) has the most extended grain length, Hap B (TA) and Hap D (YR) have the shortest grain length. In our material, 6 of the 12 allelic combinations of GS3 and GW5 are included. The allele combination GS3A-GW5A of Hap A of GS3 and Hap A of GW5 has the most extended grain length. On the other hand, GS3B-GW5B has the shortest grain length (Figure 8A). Therefore, we hypothesized that the genetic effects of GS3 and GW5 on grain length were mainly additive.
For grain width, Hap B (TGCTG) has the maximum grain width in terms of GS3, Hap A (AATCT) has the minimum grain width. For GW5, Hap B (TA) has the maximum grain width, Hap A (CG) and Hap C (TG) have the minimum grain width. In OsDER1, Hap B (C) has the maximum grain width, Hap A (T) has the minimum grain width. Our material contains 9 of 36 allelic combinations of GS3, GW5, and OsDER1. The allele combination GS3B-GW5B-GW5B of Hap B of GS3, Hap B of GW5, and Hap B of OsDER1 has the maximum grain width. On the other hand, GS3A-GW5C-GW5A has the minimum grain width (Figure 8B). The inheritance of grain width also showed the additive effect.
For grain length to width ratio, Hap A (AATCT) has the maximum GLWR in terms of GS3, Hap B (TGCTG) has the minimum GLWR. For GW5, Hap A (CG) has the maximum GLWR, Hap B (TA) has the minimum GLWR. Our material contains 6 of 12 allelic combinations of GS3 and GW5. The allele combination GS3A-GW5A of Hap A of GS3 and Hap A of GW5 has the maximum GLWR. GS3B-GW5B has the minimum GLWR (Figure 8C). The inheritance of grain length to width ratio also showed the additive effect.

3. Discussion

Grain shape is an essential agronomic character of rice, which affects the yield and appearance, processing, and edible quality. What’s more, on a global scale, there is a marked difference in the grain shape of preferred rice. Therefore, grain shape also directly affects the market demand for rice. So far, many genes related to grain shape have been cloned, and their regulatory pathways have been classified, which provides an essential theoretical basis for breeding high-yield and good-quality rice. However, additional genes controlling grain shape remain to be identified, and the effective use of the cloned genes is still lacking.
The phenotypic distribution of GL, GW, GLWR, and GC showed bimodal distribution except for the normal distribution of GS (Figure 1). Therefore, we hypothesized that GL, GW, and GC have major effect genes [13]. As expected, we detected two cloned genes, GS3 and GW5, which were the major genes affecting grain length and width, respectively [5,6]. As previously reported, GS3, GW5, and OsDER1 regulate the grain shape through changes in expression level, and, in our haplotype analysis, they were mainly detected in group II. Therefore, it proves that our findings are consistent with previous reports [7,23,24]. Furthermore, we also found a significant negative correlation between GL and GW in the alleles of GS3 and GW5. For example, GS3 Hap A (AATCT) had the most extensive grain length but the smallest grain width, while GW5 Hap B (TA) had the largest grain width but the most petite grain length (Figure 8). This finding fits well with the correlation between phenotypes (Figure 2).
After completing GWAS, we found that many QTL intervals contained cloned grain shape-related genes. Still, they were not detected through significance analysis, perhaps because the PVE of these QTL intervals was too small (Table 3). However, in some QTL intervals with large PVE, we still did not detect candidate genes. Even on the Manhattan plot, this region has a distinct peak, which we suspect is due to the type II error (false negative) caused by the MLM model. Compared with the GLM model, the accuracy of the MLM model is improved, but the detection efficiency is reduced. Using multiple detection models may effectively enhance detecting genes with minor effects. Due to environmental influences and gene-to-gene interactions, although many genes related to grain shape have been cloned, these genes still lack effective use. Next, to effectively utilize the genes in the grain shape-related gene bank, allelic combination analysis was performed. As it turns out, the inheritance of GL, GW, and GLWR mainly showed additive effects (Figure 8). Therefore, it is promising to design high-quality rice by pyramiding alleles of different genes. The seven new candidate genes were only obtained by genome-wide association study, gene-based association analysis, haplotype analysis, and functional annotation. However, their actual functions need to be further verified. Unfortunately, so far, validation work such as RT-PCR, transcriptome analysis, and transgenic experiments has not been completed.

4. Materials and Methods

4.1. Materials

The natural population used in this study consisted of 623 varieties collected worldwide. Among them, 323 accessions were selected from the 3K Rice Genome Project (3K R.G.P.) [25] (Table S2).

4.2. Field Trials and Trait Measurements

From mid-May to the end of September in 2017 and 2018, we planted seeds in experimental fields in Gongan/GA Jingzhou and Ezhou/EZ, Hubei Province, China, respectively. Each variety was planted in 5 rows and 10 columns, and the distance between individual plants was 17 cm × 20 cm, with three replications. Field management methods are consistent with local management standards. When the rice was fully mature, seeds of 5 individual plants were collected. Wanshen SC-G seed copying apparatus was used to take photos and measure the related traits. The measured characteristics include grain length/GL, grain width/GW, grain length to width ratio/GLWR, grain circumferences/GC, and grain size/grain area/GS. For each trait, the mean value is used for GWAS analysis.

4.3. Statistical Analysis

We have used the software Graphpad Prism 9 to analyze the phenotypic data as follows: (1) Normal distribution test and (2) One-way analysis of variance. The analysis methods were the “Kolmogorov-Smirnov test” and “Brown-Forsythe and Welch ANOVA tests” respectively. At the same time, we also used canonical variables analysis and Mahalanobis distance analysis to analyze phenotypes.

4.4. Genome-Wide Association Study

4.4.1. Genotyping

We extracted DNA from the leaves. Then, Covaris S2 (Covaris) breaks the DNA into ~500 bp fragments. NEBNext DNA Library Prep Reagent Set for Illumina (BioLabs) constructs the DNA library. Illumina Hiseq X10 platform was used to sequence the library. The reference genome was Os-Nipponbare-Reference-IRGSP-1.0 [26]. GATK was used to call single-nucleotide polymorphisms/SNPs [27]. SNPs with MAF ≥ 5% and missing rate ≤ 20% were retained. IMPUTE2 [28] is used for imputing missing genotypes, and 2,416,716 high-quality SNPs were finally obtained.

4.4.2. Population Structure and Kinship Analysis

We used the R package “rMVP” [29] to calculate population structure (Q) and kinship (K). All SNPs are used in the calculation. The principal component analysis/PCA is used to evaluate population structure. The principal component analysis score and relationship matrix will be used in the mixed linear model (MLM) [30] below.

4.4.3. Linkage Disequilibrium Analysis

We use the software “PopLDdecay” to calculate the linkage disequilibrium (LD) between pairs of markers [31]. Command: r2, which squared the Pearson’s correlation coefficient (r2). When the correlation coefficient (r2) drops to half of its maximum value, the distance across the chromosome is called the LD decay distance [15].

4.4.4. Genome-Wide Association Study and Candidate Genes Identification

GWAS is based on linkage disequilibrium (LD). It uses a large number of single nucleotide polymorphisms (SNPs) in the genome of the mapped population as molecular markers and combines with phenotypic variation of the population to analyze the correlation between target traits and molecular markers or candidate genes at the genome-wide level. GWAS analysis was performed using the R package “rMVP”. The operation steps of “rMVP” are as follows: (1) Data Preparation. Prepare phenotype and genotype data files and calculate population structure (Q) and kinship (K) based on the genotype files. (2) Data Input. Import the above four files into the operation. (3) Start GWAS. Important option parameters are model (“rMVP” offers three models: GLM, MLM, and FarmCPU.) and threshold (0.05 or 0.1, We chose 0.1). (4) Output. Here we have SNPs that are significantly correlated. We used a mixed linear model (MLM) to reduce false positives. MLM uses the Q and K matrix to adjust for cryptic relationships and other fixed effects.
Next, considering LD decay distance, we defined the interval of significantly associated SNP ± LD decay distance as a QTL. Here, referring to the previous report, we use the LD decay distance of 125 kb [15]. To reduce QTL redundancy, if there is overlap between QTL areas, they are combined into one QTL [32,33,34]. Next, we will select some important QTLs for further analysis, which must meet at least one of the following conditions: 1. They have been detected repeatedly in different environments. 2. Close to related genes that have been reported. 3. it contains successive distinct peaks. 4. Have large values of phenotypic variance explained /PVE (PVE ≥ 10%) [35]. For these important QTL regions, haplotype analysis and functional annotation of the genes within the regions were performed to screen candidate genes. The method of haplotype analysis was as follows: Firstly, the SNP was classified, the SNP that caused amino acid and splicing changes and had significant p value was classified into group I; SNPs with significant p values in the promoter region were assigned to the group II [36]. Then, these SNPs will be used for haplotype analysis (A gene haplotype with corresponding materials ≥ 6 will be retained), and genes with significant differences between haplotypes and functional correlation will be screened as candidate genes.

4.5. Allele Combination Analysis

4.5.1. Allele Analysis of Different Genes

The definition of alleles is similar to that of haplotypes. Still, the difference is that the significant SNPs detected in different environments and different grain shape traits are different, so the haplotypes of the same gene may differ in different environments and other grain shape traits. However, alleles were different from haplotypes. If a gene affected multiple grain traits, SNPs of the gene that were significant in different environments and other characteristics were selected for allele analysis, and the materials were classified accordingly. Therefore, alleles of a gene are the same in different environments and for different characteristics [37]. Next, we matched the material with the mean phenotypic values of the relevant grain shape traits. Finally, through statistical analysis, find the extreme allele of each gene.

4.5.2. Extreme Combination of Alleles for Each Trait

Each gene has an allele for an extreme phenotype for different grain traits; however, due to environmental influences and gene-to-gene interactions, the genotype of the optimal material is not necessarily a combination of the extreme allele of each gene. We use allelic combinations to classify materials, and if a combination has less than six materials, we discard the combination. Next, we matched the material with the phenotypic values of the relevant grain shape traits. And, through statistical analysis, find an extreme combination of alleles for each trait.

5. Conclusions

In 2017 and 2018, grain shape-related traits (grain length/GL, grain width/GW, grain length to width ratio/GLWR, grain circumferences/GC, and grain size/grain area/GS) of 623 indica rice cultivars were measured in Gongan/GA and Ezhou/EZ. And, in 2017, 623 rice were genotyped using second-generation resequencing technology. A genome-wide association study was performed based on the above genotypic and phenotypic data. A total of 39 important QTLs were screened out based on genome-wide association studies. In addition, haplotype difference analysis and functional annotation were performed on the genes in these candidate intervals. Finally, three cloned genes, GS3, GW5, and OsDER1, and seven new candidate genes Os02g0805100, Os02g0805400, Os02g0164600, CYP93G1, Os10g0344500, Os10g0344900, and Os02g0805100 were found. We have also analyzed the allelic combinations of the three cloned genes GS3, GW5, and OsDER1. The results of this study will enrich the gene pool of grain shape, deepen the understanding of the regulation mechanism of grain shape, and provide a valuable reference for future molecular breeding work.

Supplementary Materials

The following are available online at https://www.mdpi.com/article/10.3390/ijms23031065/s1.

Author Contributions

Z.H., X.Z. and Z.G. designed the experiment. B.M. and Y.L. performed all the phenotypic evaluations. D.X., L.L., Y.G., J.Z., Y.D. and X.Z. developed the population. B.M., T.W. and C.L. performed analysis and interpretation of the data. B.M. drafted the manuscript. All authors have read and agreed to the published version of the manuscript.

Funding

This work was supported by the Key Research and Development Program of Hubei Province (2020BBB053), the National Natural Science Funds of China (32101806), and the Youth Science Foundation Project of Hubei Academy of Agricultural Sciences (2020NKYJJ01).

Data Availability Statement

The raw data for this study can be found in the BioProject ID PRJNA321462 (2016-05-13), PRJNA331215 (2016-07-25), and PRJNA734973 (2021-05-22) on NCBI and 3k RGP. The URL is https://www.ncbi.nlm.nih.gov/sra and https://registry.opendata.aws/3kricegenome/.

Acknowledgments

We would like to thank Hai Xie for his help in the phenotypic evaluation.

Conflicts of Interest

The authors declare no conflict of interest.

References

  1. Sakamoto, T.; Matsuoka, M. Identifying and exploiting grain yield genes in rice. Curr. Opin. Plant Biol. 2008, 11, 209–214. [Google Scholar] [CrossRef] [PubMed]
  2. Tan, Y.F.; Xing, Y.Z.; Li, J.X.; Yu, S.B.; Xu, C.G.; Zhang, Q. Genetic bases of appearance quality of rice grains in Shanyou 63, an elite rice hybrid. Theor. Appl. Genet. 2000, 101, 823–829. [Google Scholar] [CrossRef]
  3. Redoña, E.D.; Mackill, D.J. Quantitative trait locus analysis for rice panicle and grain characteristics. Theor. Appl. Genet. 1998, 96, 957–963. [Google Scholar] [CrossRef]
  4. Li, Z.; Tang, L.; Qiu, J.; Zhang, W.; Wang, Y.; Tong, X.; Wei, X.; Hou, Y.; Zhang, J. Serine carboxypeptidase 46 Regulates Grain Filling and Seed Germination in Rice (Oryza sativa L.). PLoS ONE 2016, 11, e0159737. [Google Scholar] [CrossRef] [Green Version]
  5. Liu, J.; Chen, J.; Zheng, X.; Wu, F.; Lin, Q.; Heng, Y.; Tian, P.; Cheng, Z.; Yu, X.; Zhou, K.; et al. GW5 acts in the brassinosteroid signalling pathway to regulate grain width and weight in rice. Nat. Plants 2017, 3, 17043. [Google Scholar] [CrossRef] [PubMed]
  6. Sun, S.; Wang, L.; Mao, H.; Shao, L.; Li, X.; Xiao, J.; Ouyang, Y.; Zhang, Q. A G-protein pathway determines grain size in rice. Nat. Commun. 2018, 9, 851. [Google Scholar] [CrossRef] [Green Version]
  7. Qian, D.; Chen, G.; Tian, L.; Qu, L.Q. OsDER1 Is an ER-Associated Protein Degradation Factor That Responds to ER Stress. Plant Physiol. 2018, 178, 402–412. [Google Scholar] [CrossRef] [PubMed] [Green Version]
  8. Yang, X.; Zhao, X.; Dai, Z.; Ma, F.; Miao, X.; Shi, Z. OsmiR396/growth regulating factor modulate rice grain size through direct regulation of embryo-specific miR408. Plant Physiol. 2021, 186, 519–533. [Google Scholar] [CrossRef]
  9. Li, S.; Gao, F.; Xie, K.; Zeng, X.; Cao, Y.; Zeng, J.; He, Z.; Ren, Y.; Li, W.; Deng, Q.; et al. The OsmiR396c-OsGRF4-OsGIF1 regulatory module determines grain size and yield in rice. Plant Biotechnol. J. 2016, 14, 2134–2146. [Google Scholar] [CrossRef]
  10. Cui, X.; Jin, P.; Cui, X.; Gu, L.; Lu, Z.; Xue, Y.; Wei, L.; Qi, J.; Song, X.; Luo, M.; et al. Control of transposon activity by a histone H3K4 demethylase in rice. Proc. Natl. Acad. Sci. USA 2013, 110, 1953–1958. [Google Scholar] [CrossRef] [PubMed] [Green Version]
  11. Yoon, J.; Cho, L.H.; Kim, S.R.; Tun, W.; Peng, X.; Pasriga, R.; Moon, S.; Hong, W.J.; Ji, H.; Jung, K.H.; et al. CTP synthase is essential for early endosperm development by regulating nuclei spacing. Plant Biotechnol. J. 2021, 19, 2177–2191. [Google Scholar] [CrossRef]
  12. Ma, X.; Cheng, Z.; Qin, R.; Qiu, Y.; Heng, Y.; Yang, H.; Ren, Y.; Wang, X.; Bi, J.; Ma, X.; et al. OsARG encodes an arginase that plays critical roles in panicle development and grain production in rice. Plant J. 2013, 73, 190–200. [Google Scholar] [CrossRef]
  13. Guo, Z.; Liu, X.; Zhang, B.; Yuan, X.; Xing, Y.; Liu, H.; Luo, L.; Chen, G.; Xiong, L. Genetic analyses of lodging resistance and yield provide insights into post-Green-Revolution breeding in rice. Plant Biotechnol. J. 2021, 19, 814–829. [Google Scholar] [CrossRef] [PubMed]
  14. Tenaillon, M.I.; Sawkins, M.C.; Long, A.D.; Gaut, R.L.; Doebley, J.F.; Gaut, B.S. Patterns of DNA sequence polymorphism along chromosome 1 of maize (Zea mays ssp. mays L.). Proc. Natl. Acad. Sci. USA 2001, 98, 9161–9166. [Google Scholar] [CrossRef] [PubMed] [Green Version]
  15. Huang, X.; Wei, X.; Sang, T.; Zhao, Q.; Feng, Q.; Zhao, Y.; Li, C.; Zhu, C.; Lu, T.; Zhang, Z.; et al. Genome-wide association studies of 14 agronomic traits in rice landraces. Nat. Genet. 2010, 42, 961–967. [Google Scholar] [CrossRef]
  16. Yoo, S.; Cho, S.; Sugimoto, H.; Li, J.; Kusumi, K.; Koh, H.; Iba, K.; Paek, N. Rice Virescent3 and Stripe1 Encoding the Large and Small Subunits of Ribonucleotide Reductase Are Required for Chloroplast Biogenesis during Early Leaf Development. Plant Physiol. 2009, 150, 388–401. [Google Scholar] [CrossRef] [PubMed] [Green Version]
  17. Zhang, X.; Wang, J.; Huang, J.; Lan, H.; Wang, C.; Yin, C.; Wu, Y.; Tang, H.; Qian, Q.; Li, J.; et al. Rare allele of OsPPKL1 associated with grain length causes extra-large grain and a significant yield increase in rice. Proc. Natl. Acad. Sci. USA 2012, 109, 21534–21539. [Google Scholar] [CrossRef] [Green Version]
  18. Li, X.; Zhang, Y.; Hou, M.; Sun, F.; Shen, Y.; Xiu, Z.; Wang, X.; Chen, Z.; Sun, S.S.M.; Small, I.; et al. Small kernel 1 encodes a pentatricopeptide repeat protein required for mitochondrial nad7 transcript editing and seed development in maize (Zea mays) and rice (Oryza sativa). Plant J. 2014, 79, 797–809. [Google Scholar] [CrossRef]
  19. Lam, P.Y.; Zhu, F.; Chan, W.L.; Liu, H.; Lo, C. Cytochrome P450 93G1 Is a Flavone Synthase II That Channels Flavanones to the Biosynthesis of TricinO-Linked Conjugates in Rice. Plant Physiol. 2014, 165, 1315–1327. [Google Scholar] [CrossRef] [Green Version]
  20. Xu, F.; Fang, J.; Ou, S.; Gao, S.; Zhang, F.; Du, L.; Xiao, Y.; Wang, H.; Sun, X.; Chu, J.; et al. Variations in CYP78A13 coding region influence grain size and yield in rice. Plant Cell Environ. 2015, 38, 800–811. [Google Scholar] [CrossRef] [PubMed]
  21. Wu, Y.; Fu, Y.; Zhao, S.; Gu, P.; Zhu, Z.; Sun, C.; Tan, L. CLUSTERED PRIMARY BRANCH 1, a new allele of DWARF11, controls panicle architecture and seed size in rice. Plant Biotechnol. J. 2016, 14, 377–386. [Google Scholar] [CrossRef] [PubMed]
  22. Ren, Z.; Bai, F.; Xu, J.; Wang, L.; Wang, X.; Zhang, Q.; Feng, C.; Niu, Q.; Zhang, L.; Song, J.; et al. A chloride efflux transporter, BIG RICE GRAIN 1, is involved in mediating grain size and salt tolerance in rice. J. Integr. Plant Biol. 2021. [Google Scholar] [CrossRef] [PubMed]
  23. Fan, C.; Xing, Y.; Mao, H.; Lu, T.; Han, B.; Xu, C.; Li, X.; Zhang, Q. GS3, a major QTL for grain length and weight and minor QTL for grain width and thickness in rice, encodes a putative transmembrane protein. Theor. Appl. Genet. 2006, 112, 1164–1171. [Google Scholar] [CrossRef] [PubMed]
  24. Tian, P.; Liu, J.; Mou, C.; Shi, C.; Zhang, H.; Zhao, Z.; Lin, Q.; Wang, J.; Wang, J.; Zhang, X.; et al. GW5-Like, a homolog of GW5, negatively regulates grain width, weight and salt resistance in rice. J. Integr. Plant Biol. 2019, 61, 1171–1185. [Google Scholar] [CrossRef] [PubMed]
  25. The 3000 rice genomes project. Gigascience 2014, 3, 7.
  26. Li, H.; Durbin, R. Fast and accurate long-read alignment with Burrows-Wheeler transform. Bioinformatics 2010, 26, 589–595. [Google Scholar] [CrossRef] [PubMed] [Green Version]
  27. DePristo, M.A.; Banks, E.; Poplin, R.; Garimella, K.V.; Maguire, J.R.; Hartl, C.; Philippakis, A.A.; Del Angel, G.; Rivas, M.A.; Hanna, M.; et al. A framework for variation discovery and genotyping using next-generation DNA sequencing data. Nat. Genet. 2011, 43, 491–498. [Google Scholar] [CrossRef] [PubMed]
  28. Howie, B.N.; Donnelly, P.; Marchini, J. A Flexible and Accurate Genotype Imputation Method for the Next Generation of Genome-Wide Association Studies. PLoS Genet. 2009, 5, e1000529. [Google Scholar] [CrossRef] [Green Version]
  29. Yin, L.; Zhang, H.; Tang, Z.; Xu, J.; Yin, D.; Zhang, Z.; Yuan, X.; Zhu, M.; Zhao, S.; Li, X.; et al. rMVP: A Memory-efficient, Visualization-enhanced, and Parallel-accelerated tool for Genome-Wide Association Study. Genom. Proteom. Bioinform. 2021, in press. [Google Scholar] [CrossRef] [PubMed]
  30. Price, A.L.; Patterson, N.J.; Plenge, R.M.; Weinblatt, M.E.; Shadick, N.A.; Reich, D. Principal components analysis corrects for stratification in genome-wide association studies. Nat. Genet. 2006, 38, 904–909. [Google Scholar] [CrossRef]
  31. Zhang, C.; Dong, S.; Xu, J.; He, W.; Yang, T. PopLDdecay: A fast and effective tool for linkage disequilibrium decay analysis based on variant call format files. Bioinformatics 2019, 35, 1786–1788. [Google Scholar] [CrossRef] [PubMed]
  32. Chen, W.; Gao, Y.; Xie, W.; Gong, L.; Lu, K.; Wang, W.; Li, Y.; Liu, X.; Zhang, H.; Dong, H.; et al. Genome-wide association analyses provide genetic and biochemical insights into natural variation in rice metabolism. Nat. Genet. 2014, 46, 714–721. [Google Scholar] [CrossRef] [PubMed]
  33. Wang, Q.; Xie, W.; Xing, H.; Yan, J.; Meng, X.; Li, X.; Fu, X.; Xu, J.; Lian, X.; Yu, S.; et al. Genetic Architecture of Natural Variation in Rice Chlorophyll Content Revealed by a Genome-Wide Association Study. Mol. Plant 2015, 8, 946–957. [Google Scholar] [CrossRef] [PubMed] [Green Version]
  34. Guo, Z.; Yang, W.; Chang, Y.; Ma, X.; Tu, H.; Xiong, F.; Jiang, N.; Feng, H.; Huang, C.; Yang, P.; et al. Genome-Wide Association Studies of Image Traits Reveal Genetic Architecture of Drought Resistance in Rice. Mol. Plant 2018, 11, 789–805. [Google Scholar] [CrossRef] [PubMed] [Green Version]
  35. Wang, X.; Pang, Y.; Wang, C.; Chen, K.; Zhu, Y.; Shen, C.; Ali, J.; Xu, J.; Li, Z. New Candidate Genes Affecting Rice Grain Appearance and Milling Quality Detected by Genome-Wide and Gene-Based Association Analyses. Front. Plant Sci. 2017, 7, 1998. [Google Scholar] [CrossRef] [PubMed] [Green Version]
  36. Yano, K.; Yamamoto, E.; Aya, K.; Takeuchi, H.; Lo, P.; Hu, L.; Yamasaki, M.; Yoshida, S.; Kitano, H.; Hirano, K.; et al. Genome-wide association study using whole-genome sequencing rapidly identifies new genes influencing agronomic traits in rice. Nat. Genet. 2016, 48, 927–934. [Google Scholar] [CrossRef] [PubMed]
  37. Chen, Z.; Lu, Y.; Feng, L.; Hao, W.; Li, C.; Yang, Y.; Fan, X.; Li, Q.; Zhang, C.; Liu, Q. Genetic Dissection and Functional Differentiation of ALKa and ALKb, Two Natural Alleles of the ALK/SSIIa Gene, Responding to Low Gelatinization Temperature in Rice. Rice 2020, 13, 39. [Google Scholar] [CrossRef]
Figure 1. The phenotypic distribution. Phenotypic distribution of five-grain shape traits: (A) grain length/GL, (B) grain width/GW, (C) grain length to width ratio/GLWR, (D) grain circumferences/GC, and (E) grain size/grain area/GS) in 2017EZ, 2017GA, 2018EZ, and 2018GA. Gongan/GA, Ezhou/EZ.
Ijms 23 01065 g001
Figure 2. Phenotypic correlation matrix. Grain length/GL, grain width/GW, grain length to width ratio/GLWR, grain size/grain area/GS, grain circumferences/GC. The areas of ellipses showed the absolute value of corresponding correlation coefficients (r) (upper triangular). Right and left oblique ellipses and colors indicated positive and negative correlations, respectively. The values were corresponding r between the traits (lower triangular).
Ijms 23 01065 g002
Figure 3. Graphic dispersion of scores in relation to axes representing the canonical variables for five traits related to grain shape (GL, GW, GLWR, GC, GS). Cluster I, cluster II, and cluster III are groups based on Mahalanobis distance between samples. Different colors represent different groups.
Ijms 23 01065 g003
Figure 4. Population Structure, Kinship, and LD decay plot. (A) PCA plot for the 623 varieties. PC1 and PC2 indicate the score of principal components 1 and 2, respectively. Different colors represent different principal component score groups. (B) Heat map of kinship from R Package “pheatmap” shows the tree on the top and left. (C) LD decay. Y-axis was the average r2 value of each 5 kb region, and X-axis was the physical distance between markers.
Ijms 23 01065 g004
Figure 5. Manhattan plot and Q-Q plot. (A) 2018 GA’s GL Manhattan and Q-Q images. (B) 2018 GA’s GW Manhattan and Q-Q images. (C) 2017 EZ’s GLWR Manhattan and Q-Q images. (D) 2018 GA’s GC Manhattan and Q-Q images. The red arrow indicates the location of the gene. In the upper right corner is the SNP density indicator band, and different colors represent different SNP distribution densities. Gongan/GA, Ezhou/EZ.
Ijms 23 01065 g005
Figure 6. Haplotype box plot. (AD) For grain length, haplotype box plot of (A) GS3, (B) GW5, (C) Os02g0805100 and (D) Os02g0805400. (EI) For grain width, haplotype box plot of (E) GS3, (F) GW5, (G) OsDER1, (H) Os02g0164600, and (I) Os04g0101400. (JN) For grain length to width ratio, haplotype box plot of (J) GS3, (K) GW5, (L) Os01g0589900, (M) Os10g0344500 and (N) Os10g0344900. (O,P) For grain circumferences, haplotype box plots of (O) GS3 and (P) Os02g0805100. The letter (a, b, and c) suggested significance of ANOVA (for ≥three haplotypes) or t-test (for two haplotypes) at p < 0.01. The value on the box was the number of individuals of each haplotype. X-axis coordinates are the corresponding significant SNPs. Gongan/GA, Ezhou/EZ.
Ijms 23 01065 g006
Figure 7. Gene structure, Significant SNP locus, and alleles. (A) GS3, Hap A (AATCT), Hap B (TGCTG) and Hap C (WRYYK). (B) GW5, Hap A (CG), Hap B (TA), Hap C (TG) and Hap D (YR). (C) OsDER1, Hap A (T), Hap B (C) and Hap C (Y). The red arrow indicates the location of the start codon “ATG”. The number after “ATG” is its position on the chromosome. The number on the significant SNP is its position relative to “ATG”.
Ijms 23 01065 g007
Figure 8. Box plot of alleles and allelic combinations. (A) grain length/GL, (B) grain width/GW, (C) grain length to width ratio/GLWR. The letter (a, b, and c) suggested significance of ANOVA at p < 0.01. The value on the box was the number of individuals of each allele. X-axis coordinates are the corresponding significant SNPs.
Ijms 23 01065 g008
Table 1. Mahalanobis distances for phenotypic traits.
GLGWGLWRGCGS
GL
GW−111,507.80
GLWR6039.21−19,306.47
GC49,771.01−588,205.4078,805.02
GS7704.96754,904.5081,783.1540,385.27
Table 2. Phenotypic heritability.
Env\TraitGLGWGLWRGCGS
2017EZ0.5611980.5872320.8167840.4351940.102882
2017GA0.7902640.8425330.8635570.7506320.403186
2018EZ0.4179420.5939730.7803370.4391320.220128
2018GA0.6825060.7557470.8027260.6514860.519685
mean0.61297750.694871250.8158510.5691110.31147025
Table 3. 39 important QTLs for GL, GW, GLWR, and GC detected in 2017GA, 2017EZ, 2018GA, and 2018EZ.
QTLEnvTraitCHROPositionPeak-SNPRef/AltEffectSEPPVE(%)Cloned Gene
qGC22018GAGC234214439-34472981chr02_34347981G/A−0.5550.0992.88316 × 10−82.96OsmiR396a; OsmiR396c
qGC32017GAGC316538239-17145970chr03_16707611T/C−0.3920.0474.618 × 101642.07GS3
2017EZGC316538239-17145970chr03_16707611T/C−0.4290.0551.98333 × 10−1441.50GS3
2018GAGC316538239-17145970chr03_16692834A/G−0.4880.0571.64375 × 10−1638.46GS3
2018EZGC316538239-17145970chr03_16669223T/C−0.5180.0604.16047 × 10−1736.18GS3
qGC52017GAGC55233756-5486894chr05_5361894G/A−0.2150.0394.55499 × 10−833.45GW5; OsDER1
qGL22018GAGL234202268-34492940chr02_34339439G/A−0.2390.0449.10759 × 10−84.34OsmiR396a; OsmiR396c
qGL3.22018GAGL316121544-16371544chr03_16246544G/A0.1100.0209.6657 × 10−820.37
qGL3.32017EZGL316538239-17145970chr03_16692706C/T−0.2150.0283.9741 × 10−1441.52GS3
2018GAGL316538239-17145970chr03_16692834A/G−0.2360.0277.18544 × 10−1440.03GS3
2017GAGL316538239-17145970chr03_16727804G/A−0.1870.0231.00333 × 10−1539.81GS3
2018EZGL316538239-17145970chr03_16669223T/C−0.2420.0293.25938 × 10−1635.72GS3
qGL52017GAGL55233629-5496042chr05_5361894G/A−0.1320.0203.72538 × 10−1135.53GW5; OsDER1
2017EZGL55233629-5496042chr05_5361894G/A−0.1450.0241.49047 × 10−934.90GW5; OsDER1
2018EZGL55233629-5488611chr05_5359598G/A−0.1380.0269.59975 × 10−824.92GW5; OsDER1
2018GAGL55234598-5484598chr05_5359598G/A−0.1210.0244.07439 × 10−727.56GW5; OsDER1
qGLWR1.12017GAGLWR13182916-3432916chr01_3307916A/G0.2220.0391.93411 × 10−80.57
2018EZGLWR13182916-3432916chr01_3307916A/G0.2140.0412.85427 × 10−70.38
2017EZGLWR13182916-3432916chr01_3307916A/G0.2130.0401.86665 × 10−70.32
qGLWR1.22018EZGLWR122885450-23135450chr01_23010450A/G−0.2870.0524.5957 × 10−89.95
2018GAGLWR122885450-23135450chr01_23010450A/G−0.2760.0521.61289 × 10−79.36
2017EZGLWR122885450-23137896chr01_23010450A/G−0.3010.0515.90519 × 10−99.03
qGLWR2.12018EZGLWR23328503-3578511chr02_3453511C/A−0.1800.0352.76336 × 10−77.68
2017EZGLWR23328503-3578581chr02_3453511C/A−0.1920.0342.33924 × 10−87.39
2018GAGLWR23328511-3578511chr02_3453511C/A−0.1790.0353.7586 × 10−77.16
qGLWR2.22017GAGLWR25535710-5785710chr02_5660710T/A−0.3300.0565.91233 × 10−96.60
2018GAGLWR25535710-5999873chr02_5660710T/A−0.3240.0608.1989 × 10−86.34
2018EZGLWR25535710-5999873chr02_5874873C/T−0.3730.0712.23701 × 10−76.08
2017EZGLWR25535710-6323430chr02_5660710T/A−0.3470.0572.70846 × 10−95.92
2018EZGLWR26073121-6323430chr02_6198419G/T−0.3380.0641.90726 × 10−76.22
2018GAGLWR26073121-6323430chr02_6198419G/T−0.3580.0654.58012 × 10−85.76
qGLWR2.42017GAGLWR212281126-12531126chr02_12406126C/T−0.3130.0581.20528 × 10−711.47
qGLWR2.52018EZGLWR212581170-12854381chr02_12706170G/A−0.3750.0673.83638 × 10−812.35
2017GAGLWR212581170-12854381chr02_12706170G/A−0.3560.0655.90344 × 10−812.21
2018GAGLWR212581170-12831170chr02_12706170G/A−0.3670.0681.02856 × 10−711.60
2017EZGLWR212581170-12854381chr02_12729381C/T−0.3770.0673.44126 × 10−810.28
qGLWR2.62018EZGLWR213775664-14025664chr02_13900664A/G−0.3410.0663.74571 × 10−711.84
qGLWR2.72017GAGLWR215065202-15315202chr02_15190202C/T−0.2530.0492.83929 × 10−710.74
qGLWR3.12017GAGLWR311862123-12195220chr03_12040893G/A−0.2380.0422.0198 × 10−810.29
qGLWR3.22017GAGLWR314887077-15259083chr03_15097804T/C−0.3790.0661.73085 × 10−811.94
2018EZGLWR314972804-15262319chr03_15137319G/C−0.3700.0638.16489 × 10−910.84
2017EZGLWR314972804-15775796chr03_15137319G/C−0.3770.0621.86381 × 10−99.87
2018GAGLWR315007020-15499312chr03_15137319G/C−0.3770.0646.37505 × 10−910.27
2018GAGLWR315525398-15798206chr03_15650795C/T−0.2610.0488.10411 × 10−89.26
2018EZGLWR315525795-15798182chr03_15673182T/A−0.2530.0492.89611 × 10−79.09
qGLWR3.32018EZGLWR316384313-17145970chr03_16665078G/A−0.2530.0305.54904 × 10−1638.74GS3
2017EZGLWR316538239-17145970chr03_16667236A/C−0.2470.0304.99029 × 10−1640.92GS3
2017GAGLWR316538239-17144509chr03_16665078G/A−0.2420.0301.84033 × 10−1538.89GS3
2018GAGLWR316538239-17145970chr03_16665078G/A−0.2490.0312.87413 × 10−1538.73GS3
qGLWR4.42018EZGLWR420288335-20541326chr04_20416326G/A−0.2290.0413.2422 × 10−87.48
2017EZGLWR420288335-21006646chr04_20416326G/A−0.2260.0402.42506 × 10−86.86
2018GAGLWR420291326-20541326chr04_20416326G/A−0.2200.0411.22254 × 10−76.94
2018EZGLWR420593177-21006646chr04_20718177G/A−0.2150.0412.54712 × 10−75.45
2017GAGLWR420638861-21006958chr04_20881646G/A−0.2540.0423.01979 × 10−95.45
qGLWR5.22017EZGLWR55231448-5561924chr05_5361894G/A−0.2140.0255.32542 × 10−1742.53GW5; OsDER1
2018GAGLWR55231448-5561924chr05_5361894G/A−0.2310.0251.41282 × 10−1841.88GW5; OsDER1
2017GAGLWR55231448-5503981chr05_5359598G/A−0.2100.0245.38154 × 10−1741.49GW5; OsDER1
2018EZGLWR55231448-5561924chr05_5359598G/A−0.2320.0251.19804 × 10−1840.73GW5; OsDER1
qGLWR7.22017GAGLWR723874546-24124546chr07_23999546G/T−0.2730.0511.32149 × 10−710.23
qGLWR10.12018EZGLWR10461202-711202chr10_586202A/T−0.2410.0451.11028 × 10−712.01
2018GAGLWR10461202-711202chr10_586202A/T−0.2370.0451.8842 × 10−711.28
2017EZGLWR10461202-711202chr10_586202A/T−0.2530.0454.17056 × 10−810.75
qGLWR10.22017GAGLWR10981239-1231239chr10_1106239G/T−0.2510.0493.35516 × 10−710.74
qGLWR10.42017GAGLWR103451996-3701996chr10_3576996G/A−0.2560.0481.5324 × 10−710.03
qGLWR10.52017EZGLWR104480128-4738419chr10_4612011A/G−0.2760.0462.50401 × 10−911.20
2017GAGLWR104487011-4737058chr10_4612058T/G−0.2830.0461.62479 × 10−911.26
2018EZGLWR104487011-4737058chr10_4612058T/G−0.2540.0482.08188 × 10−710.79
2018GAGLWR104487011-4737058chr10_4612058T/G−0.2630.0499.96257 × 10−810.62
qGLWR10.62018EZGLWR105900422-6150495chr10_6025464G/A−0.3040.0531.57353 × 10−89.73
2017EZGLWR105900422-6150524chr10_6025464G/A−0.3460.0525.39359 × 10−119.46
2018GAGLWR105900422-6150495chr10_6025464G/A−0.3150.0535.45461 × 10−99.25
qGLWR10.72018EZGLWR107593442-7843442chr10_7718442T/C−0.3130.0588.71587 × 10−89.06
2018GAGLWR107593442-7843442chr10_7718442T/C−0.3110.0581.33752 × 10−78.50
2017EZGLWR107593442-7843442chr10_7718442T/C−0.3210.0561.63274 × 10−88.11
qGLWR10.82018EZGLWR108856195-9106195chr10_8981195G/T−0.3320.0621.05397 × 10−710.16
2018GAGLWR108856195-9106195chr10_8981195G/T−0.3320.0621.42668 × 10−79.51
2017EZGLWR108856195-9106195chr10_8981195G/T−0.3360.0603.12832 × 10−89.06
qGLWR10.92017EZGLWR1010025822-10458283chr10_10223273C/T−0.3810.0592.51359 × 10−108.23
2017GAGLWR1010042380-10458283chr10_10272029G/A−0.3630.0614.73434 × 10−99.43
2018EZGLWR1010042380-10397029chr10_10223273C/T−0.3630.0602.98474 × 10−99.16
2018GAGLWR1010042380-10397029chr10_10223273C/T−0.3720.0611.97669 × 10−98.79
qGW1.32018EZGW123933241-24512660chr01_24304654A/G0.1130.0222.42535 × 10−76.23OsCTPS1
qGW2.12017EZGW23328503-3578511chr02_3453511C/A0.0690.0121.13817 × 10−86.07
2018EZGW23328503-3578511chr02_3453511C/A0.0650.0122.15744 × 10−74.81
2018GAGW23328503-3578511chr02_3453511C/A0.0670.0132.35387 × 10−74.12
qGW3.42017GAGW316538324-17028634chr03_16706516T/C0.0530.0085.96404 × 10−1141.78GS3
2018EZGW316540072-17040318chr03_16706516T/C0.0620.0105.44229 × 10−1030.86GS3
2017EZGW316540424-16926472chr03_16706516T/C0.0560.0093.95865 × 10−930.65GS3
2018GAGW316570517-16998965chr03_16746142A/G0.0590.0112.73991 × 10−825.80GS3
qGW4.12018GAGW411108-800893chr04_628540C/A0.1110.0191.47095 × 10−88.52OsARG
2017EZGW411113-261113chr04_136113G/A0.0910.0171.77411 × 10−78.98
2018EZGW4263820-769400chr04_644395A/G0.1080.0192.30805 × 10−87.48OsARG
2017EZGW4546523-796523chr04_671523C/T0.0990.0193.60601 × 10−79.04OsARG
qGW5.12017GAGW55231448-5561924chr05_5359246G/A0.0650.0072.13646 × 10−2042.12GW5; OsDER1
2018GAGW55231448-5585712chr05_5359246G/A0.0910.0097.09101 × 10−2236.43GW5; OsDER1
2018EZGW55231448-5574689chr05_5359681C/T0.0820.0095.765 × 10−1936.22GW5; OsDER1
2017EZGW55231448-5581997chr05_5359246G/A0.0710.0087.27903 × 10−1731.13GW5; OsDER1
qGW5.22018GAGW55917480-6167480chr05_6042480C/T0.0430.0083.08835 × 10−712.62JMJ703
qGW10.12018GAGW1052079-302079chr10_177079T/A0.1240.0224.17434 × 10−88.97OsSCP46
2018EZGW1052079-302079chr10_177079T/A0.1200.0225.35845 × 10−88.72OsSCP46
qGW10.72017EZGW105900422-6150495chr10_6025464G/A0.1260.0191.49782 × 10−1010.32
2018GAGW105900422-6150524chr10_6025464G/A0.1420.0217.97234 × 10−118.94
2018EZGW105900464-6150464chr10_6025464G/A0.1120.0223.22894 × 10−77.82
qGW10.82017EZGW106986882-7439539chr10_7297872A/C0.1210.0204.16284 × 10−910.05
2018GAGW107154870-7422872chr10_7279870C/G0.1080.0182.7638 × 10−911.54
qGW10.122017EZGW1010078190-10459267chr10_10223273C/T0.1220.0219.81178 × 10−98.84
2018EZGW1010078190-10405532chr10_10203190A/G0.1270.0221.04852 × 10−87.51
2017GAGW1010147029-10418094chr10_10272029G/A0.0950.0181.02675 × 10−77.89
Publisher’s Note: MDPI stays neutral with regard to jurisdictional claims in published maps and institutional affiliations.

