
Combined Micellar Liquid Chromatography Technique and QSARs Modeling in Predicting the Blood–Brain Barrier Permeation of Heterocyclic Drug-like Compounds


Abstract
1. Introduction
2. Results
3. Discussion
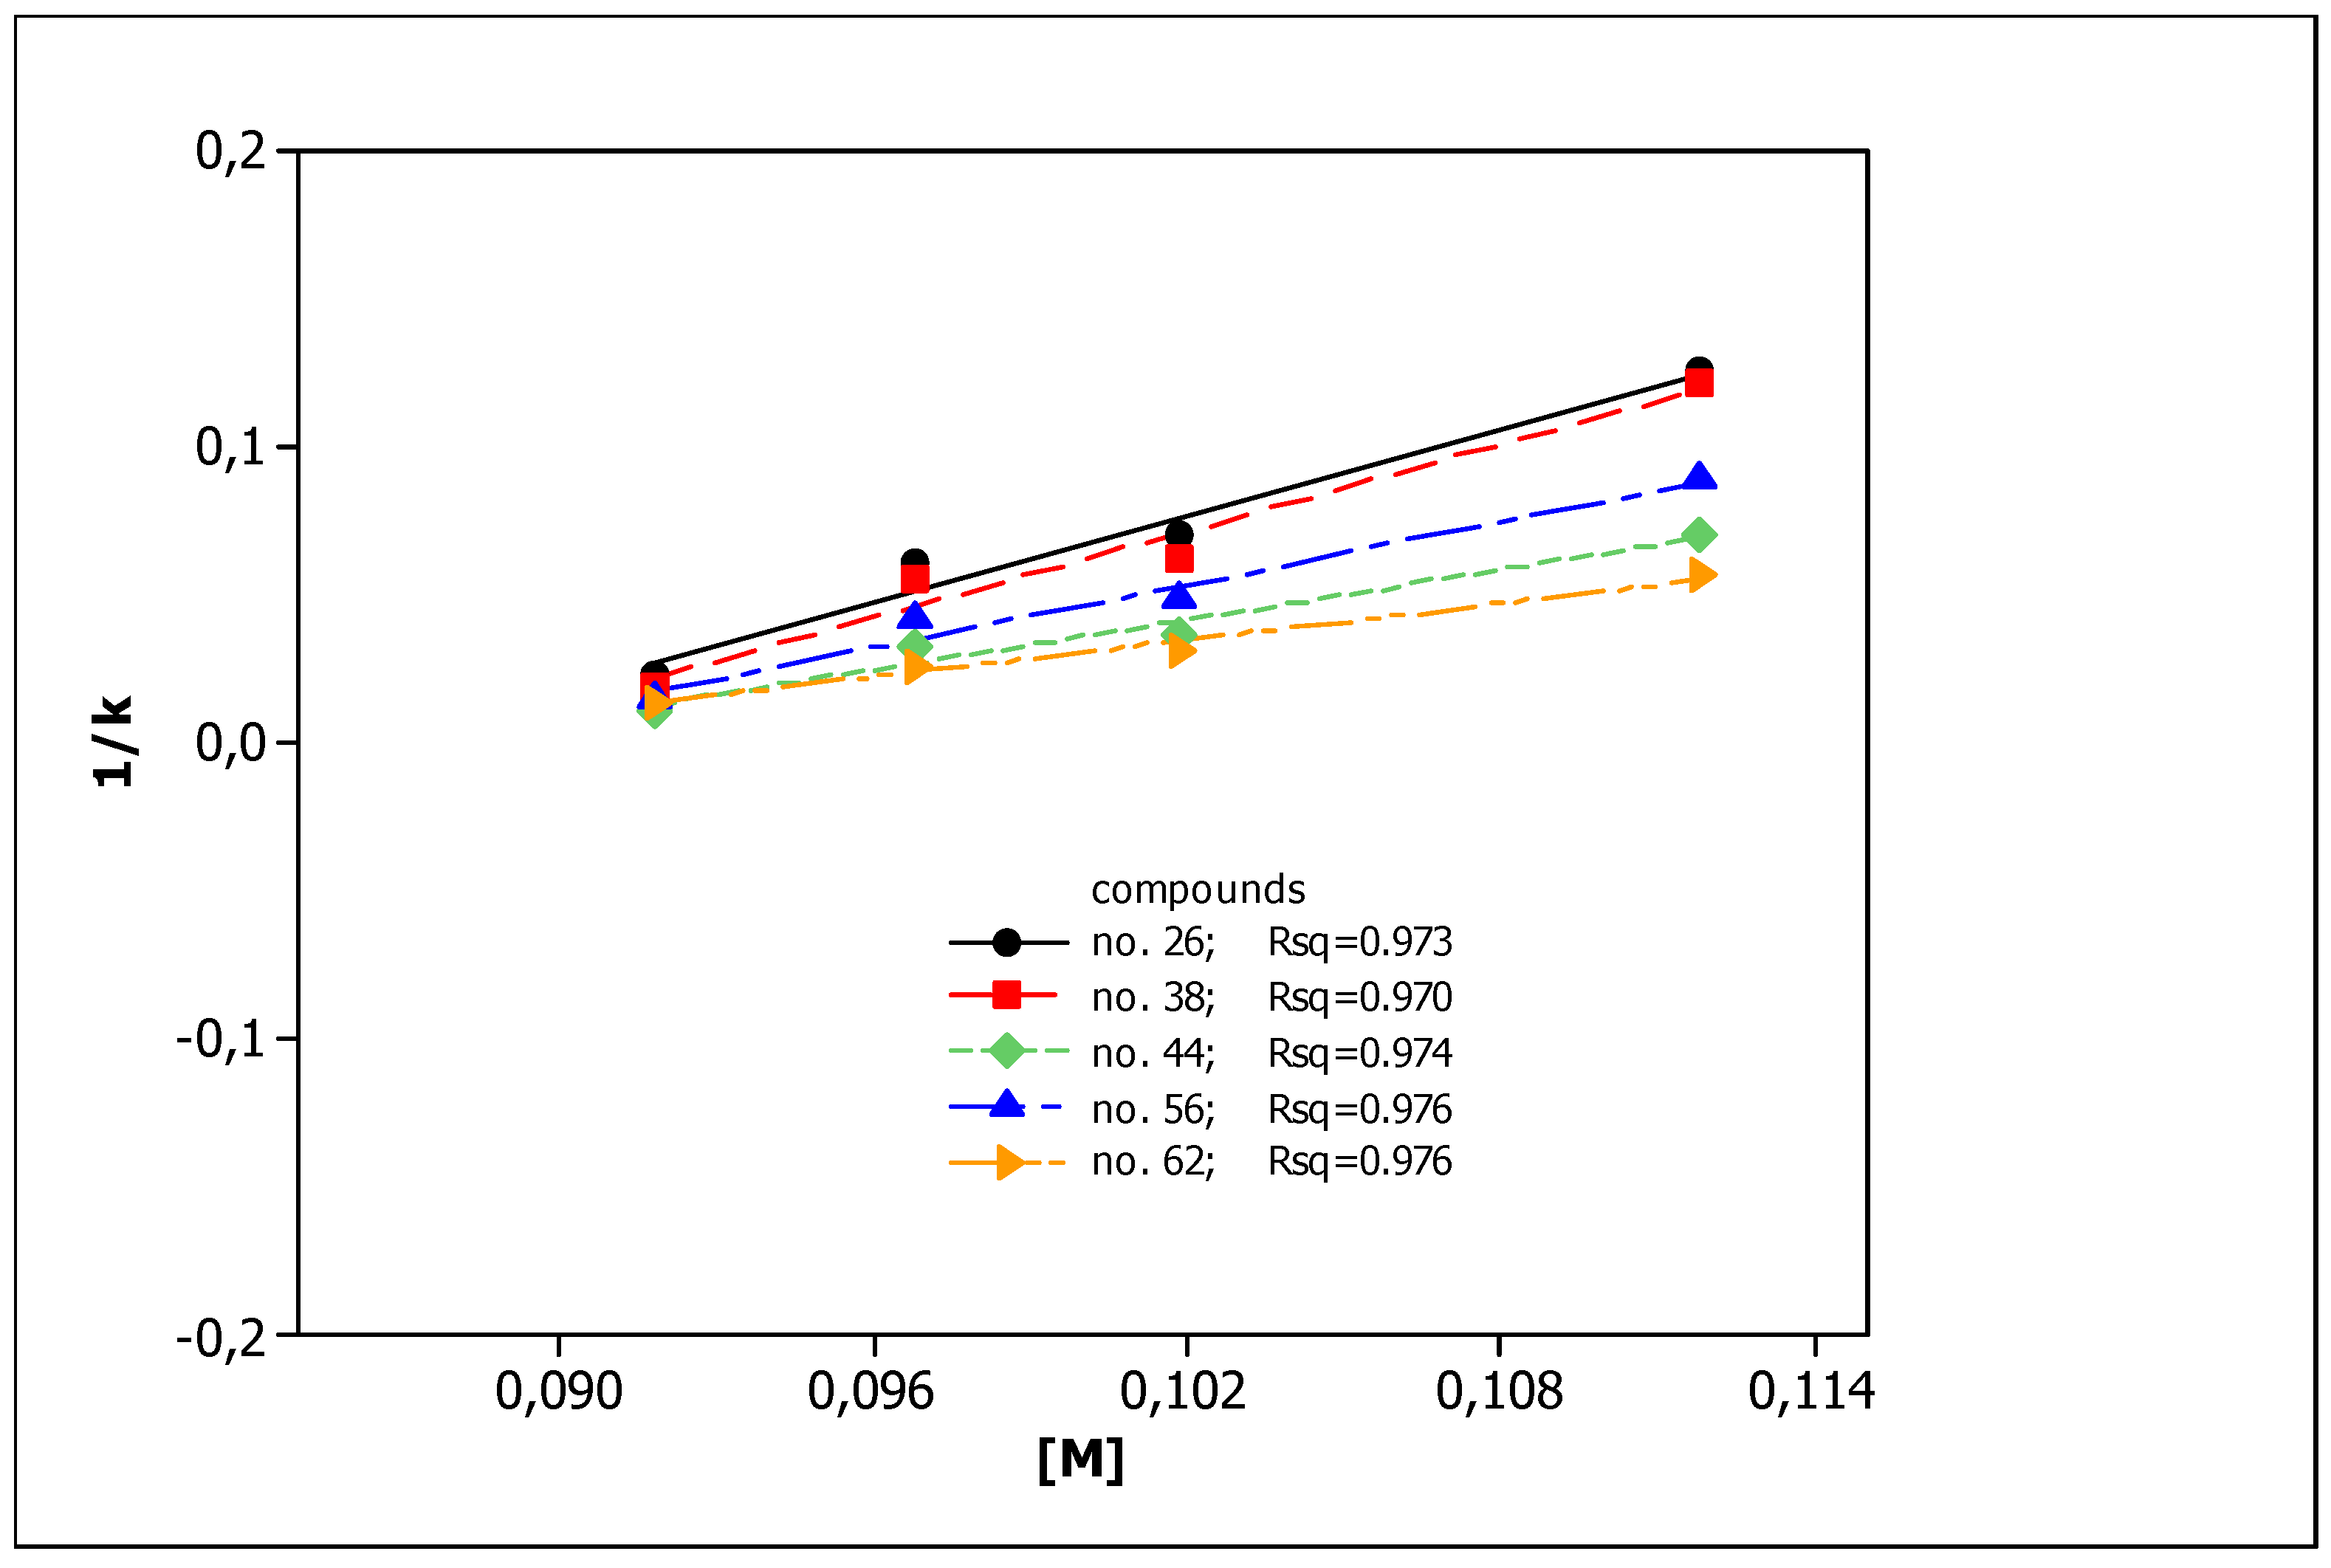
3.1. Chromatographic Data
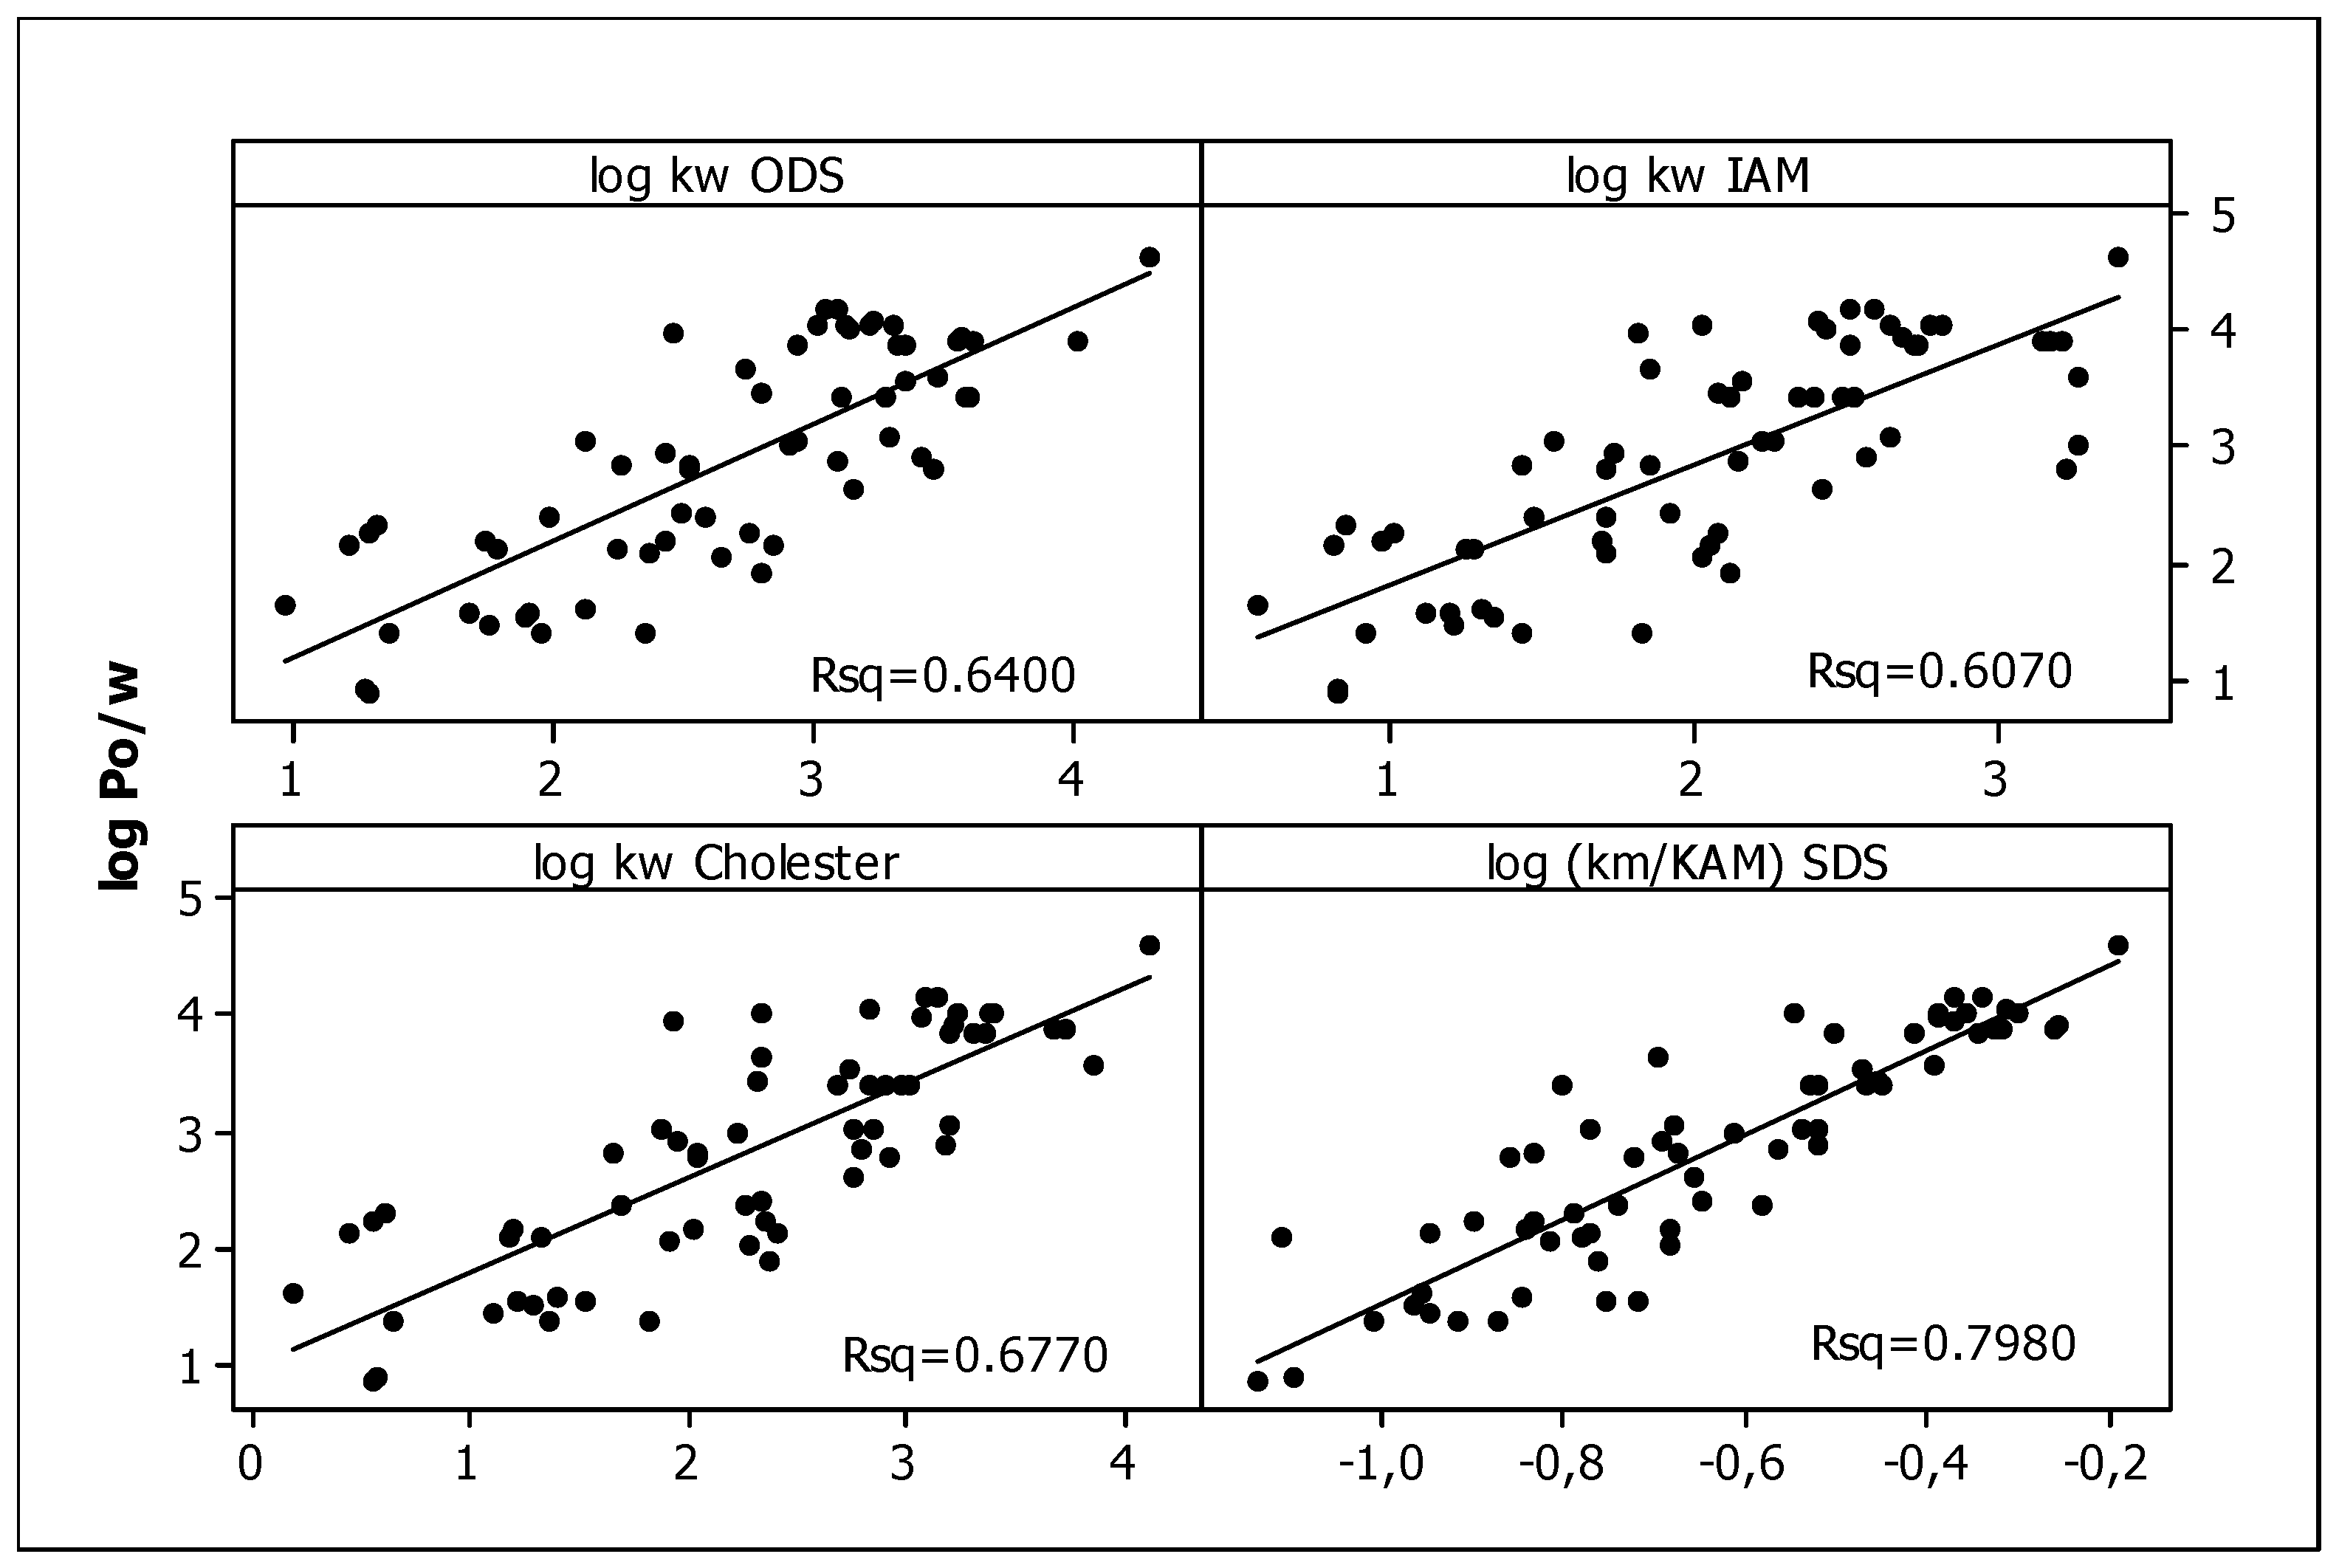
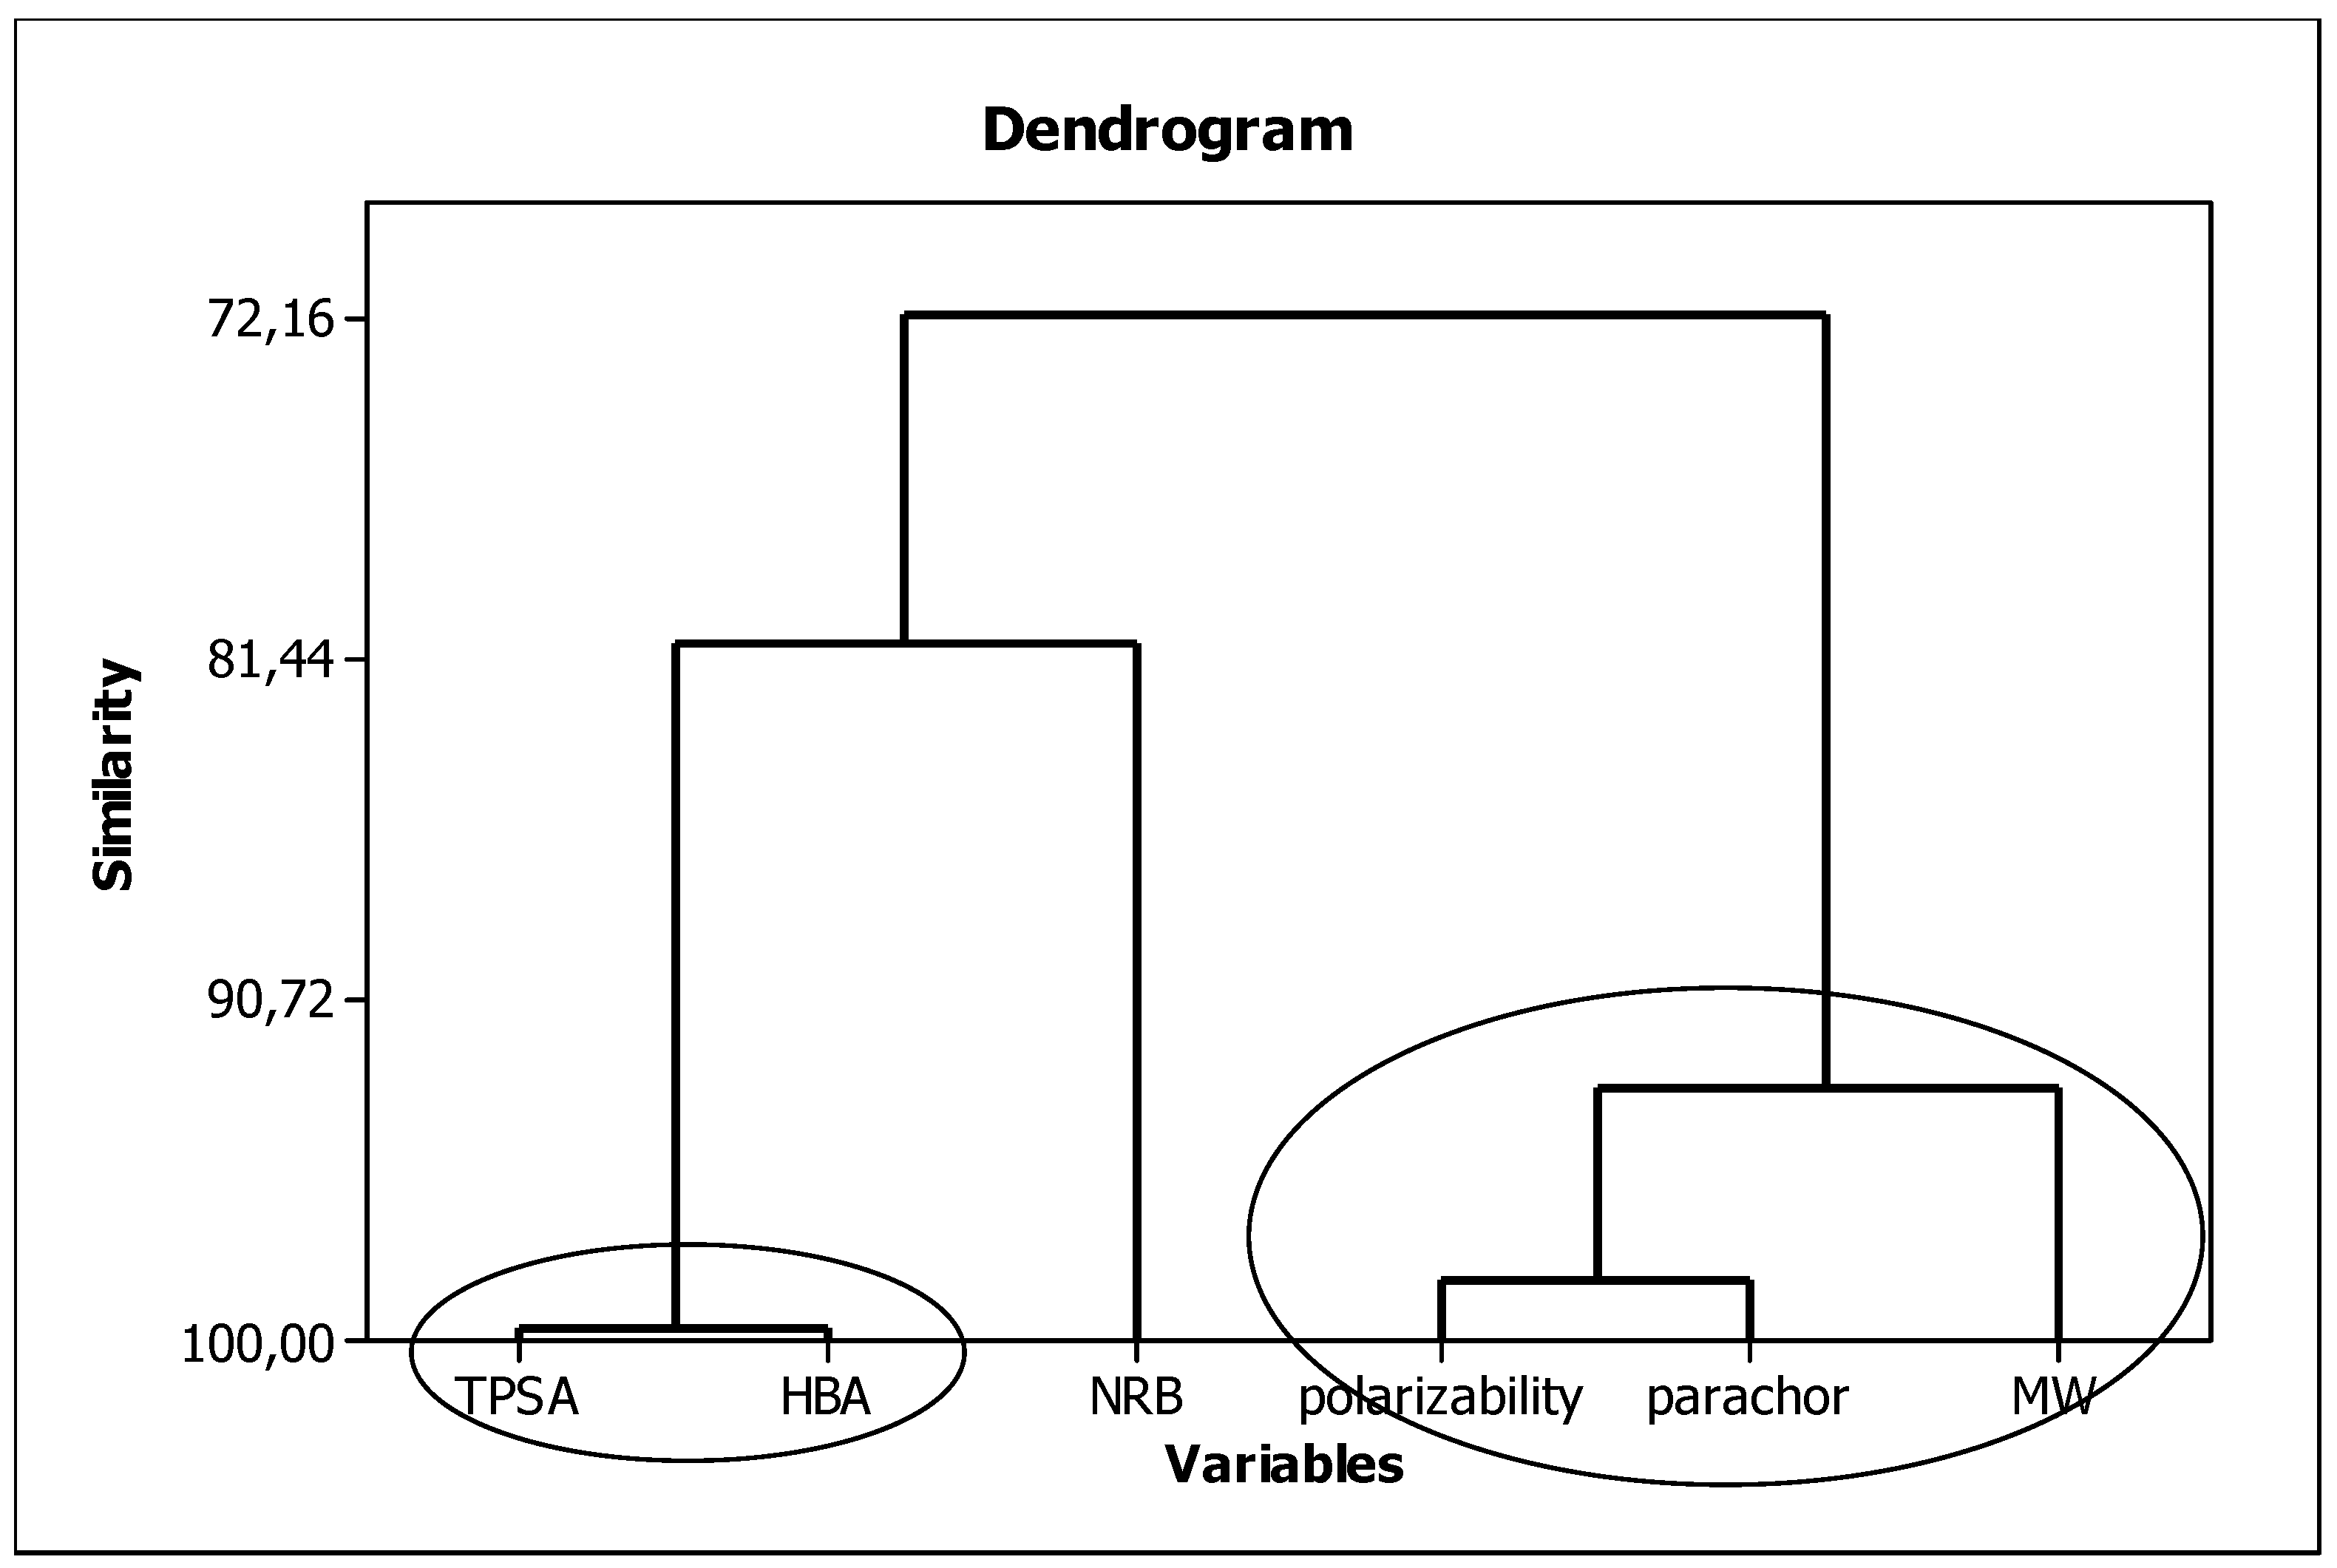
3.2. In Silico Data
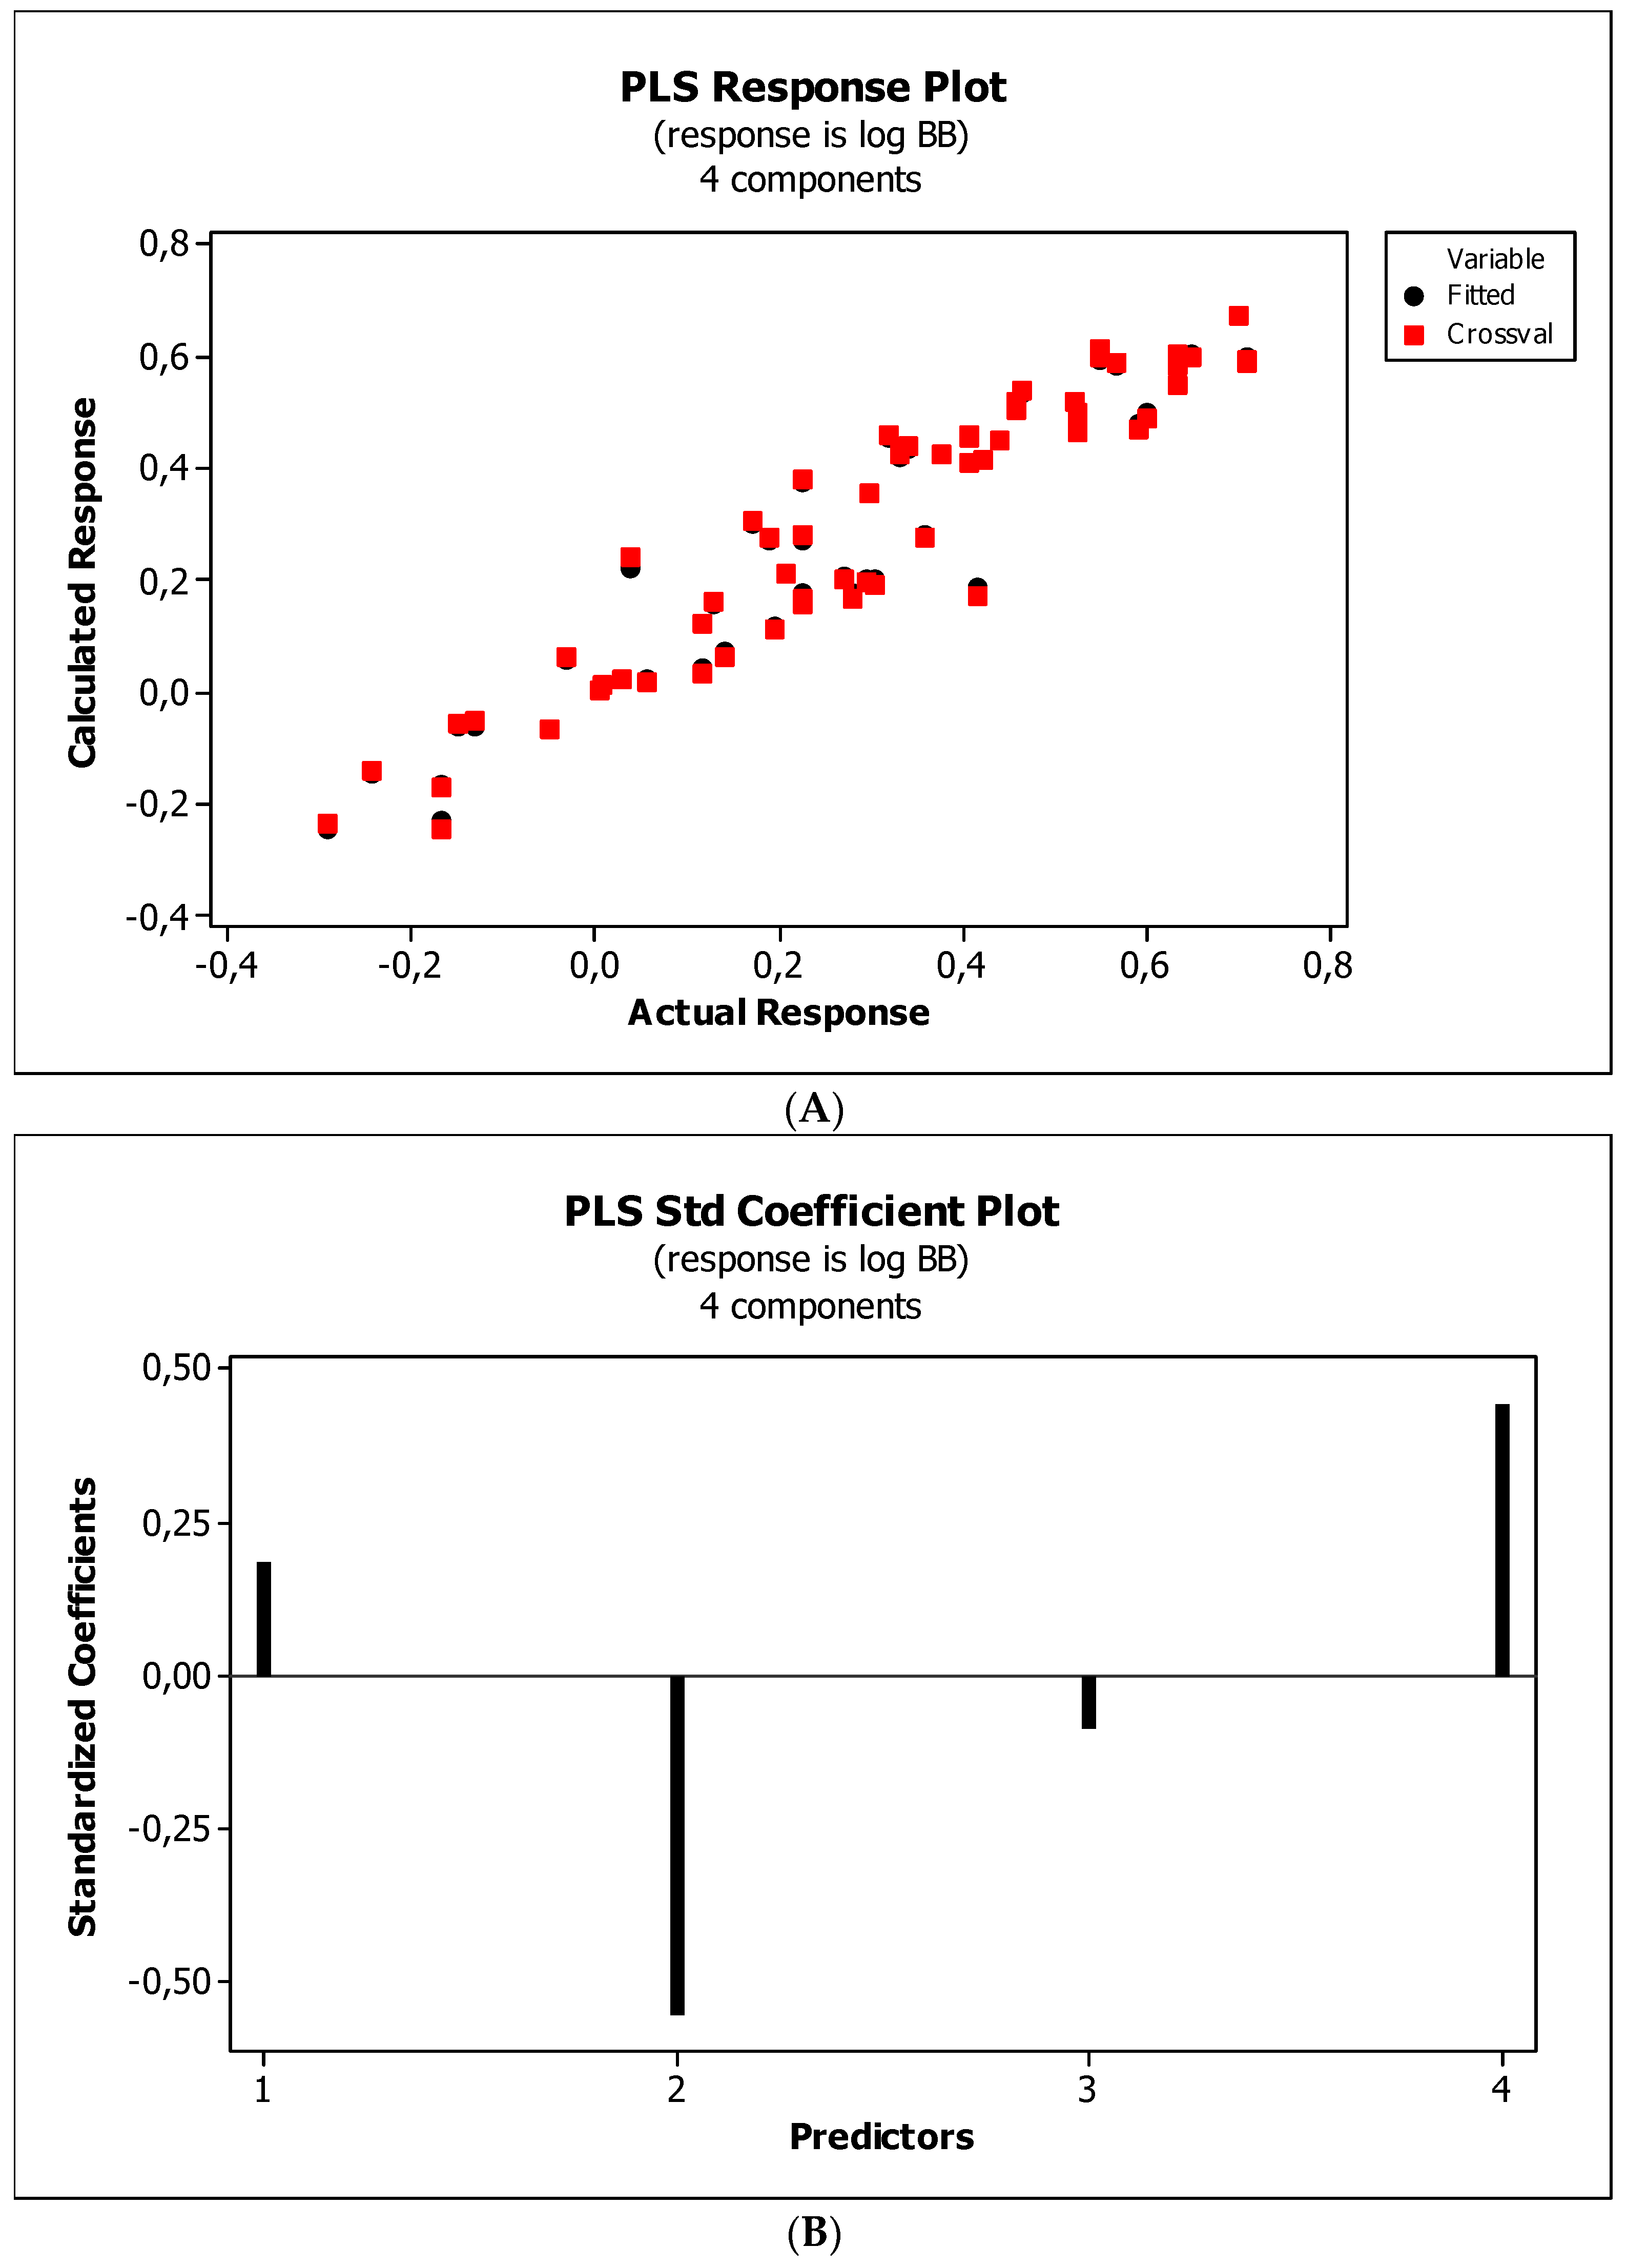
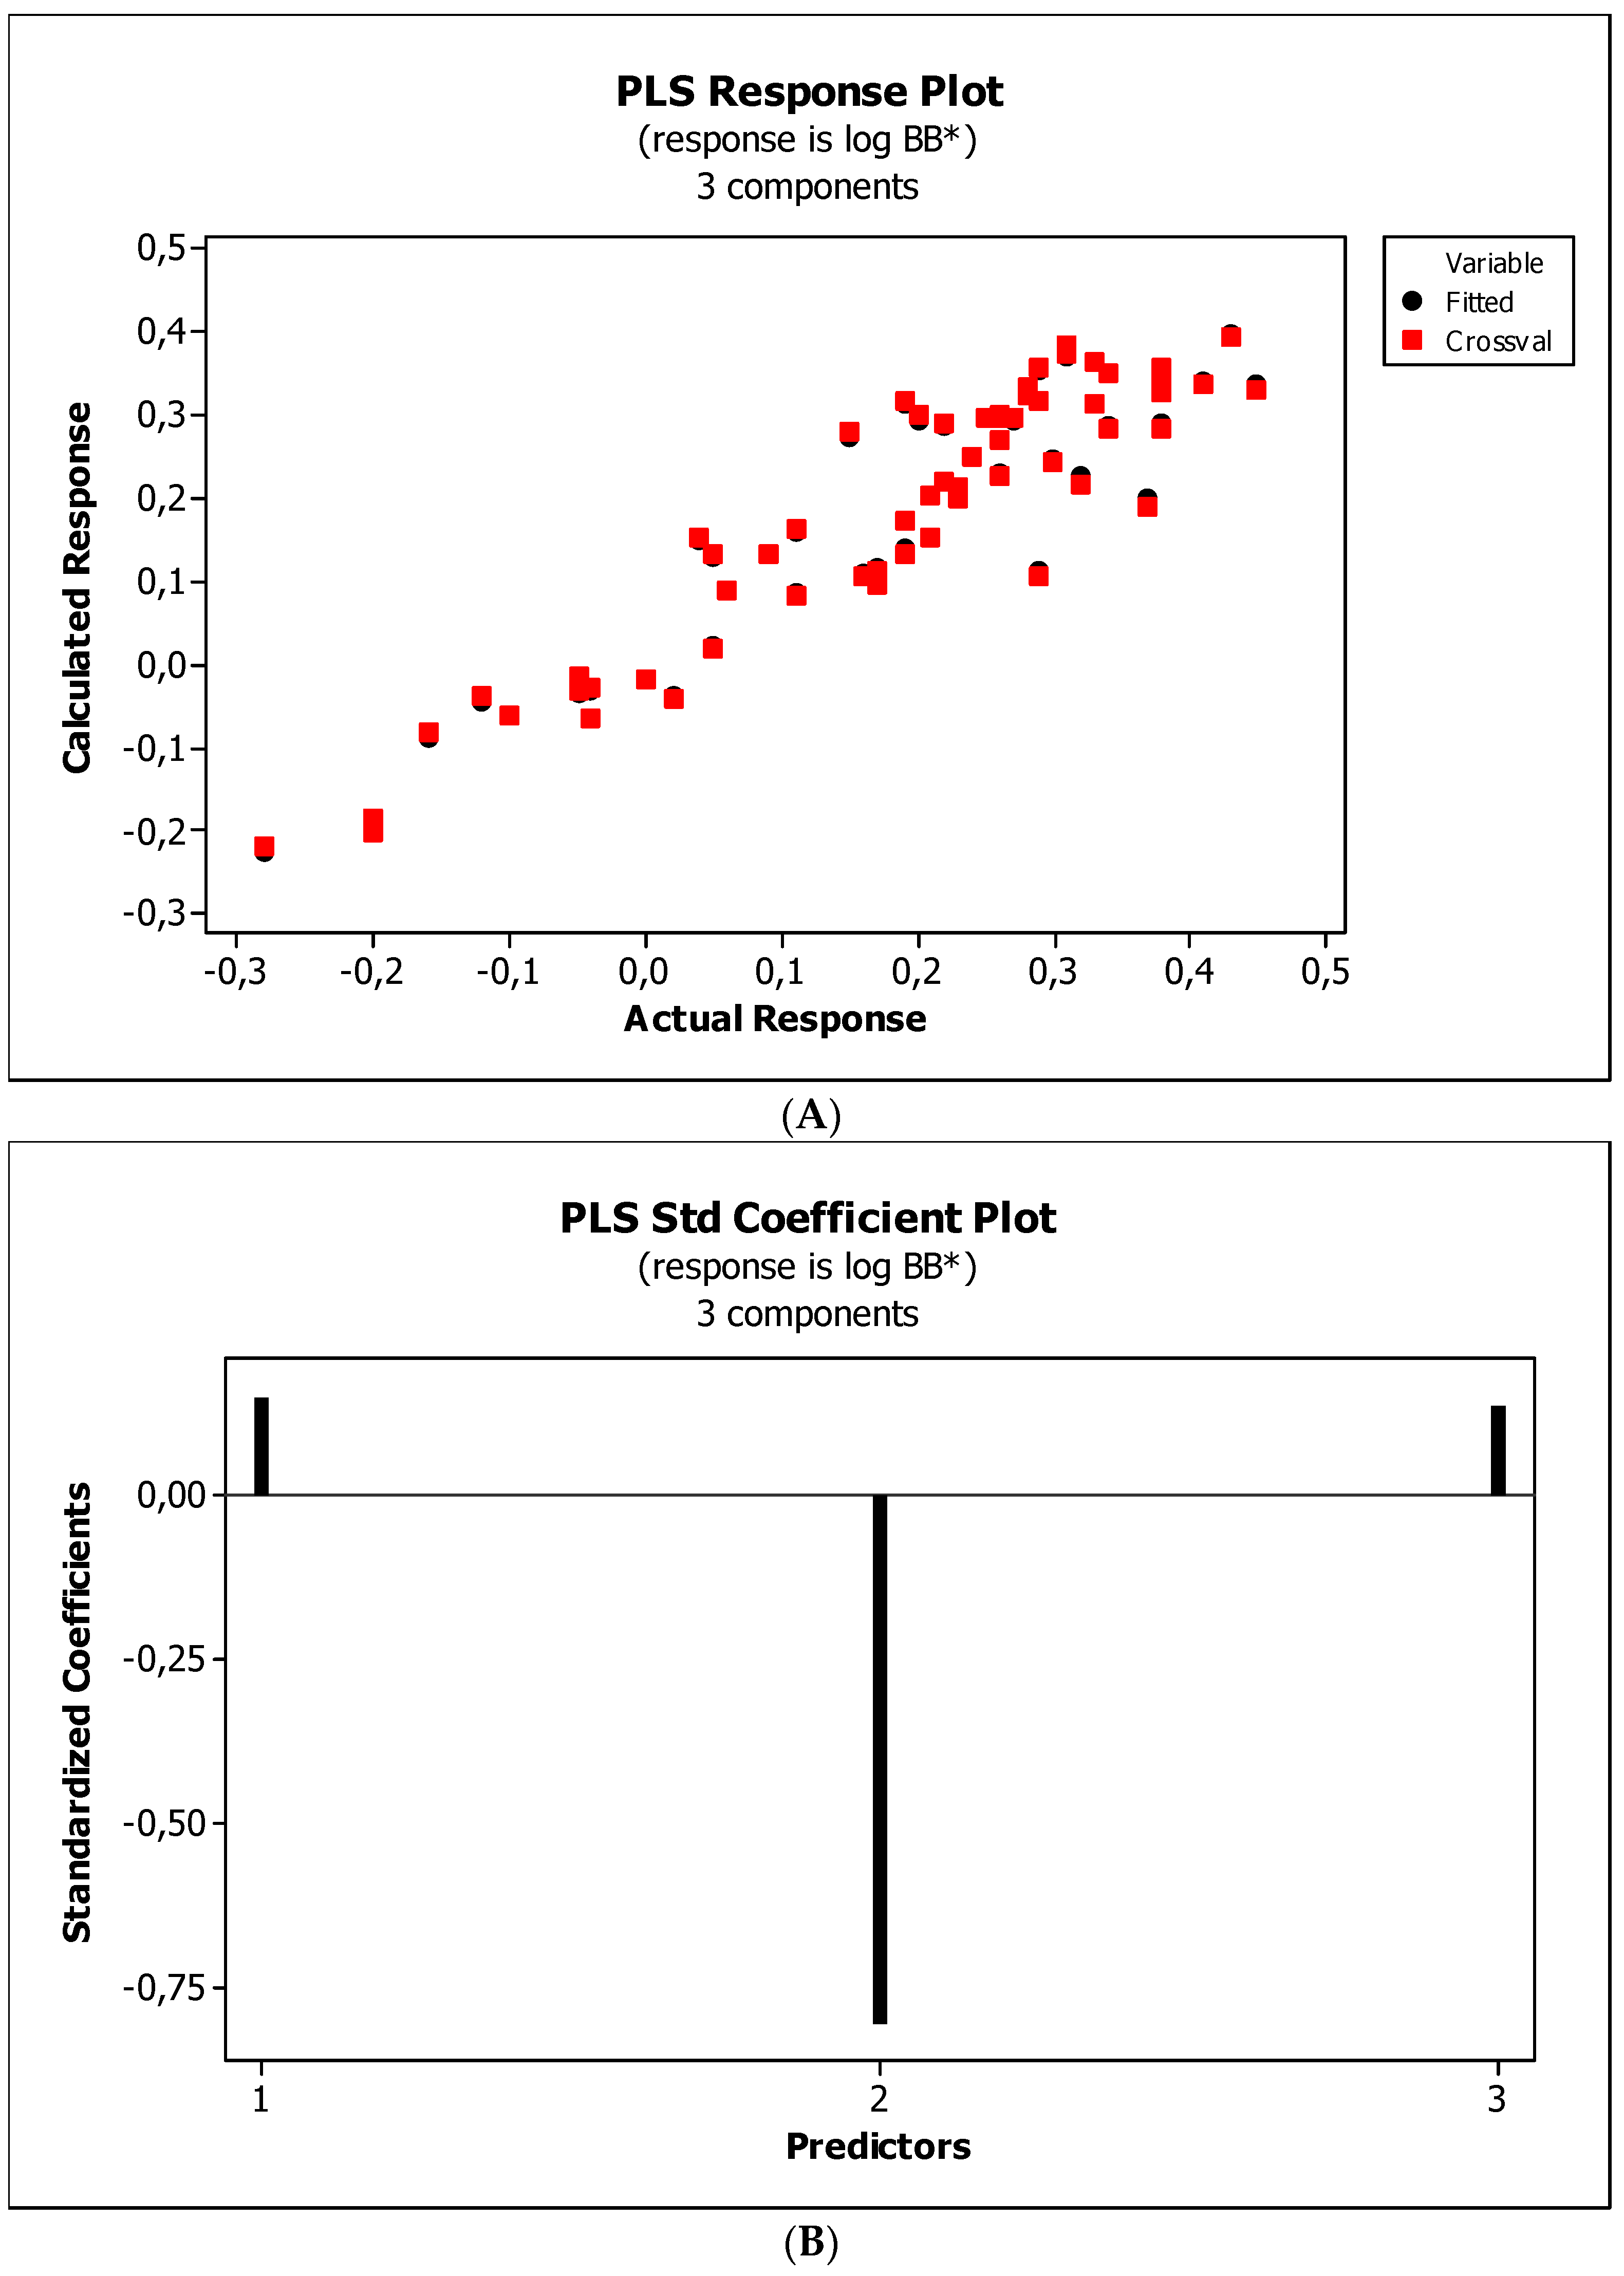
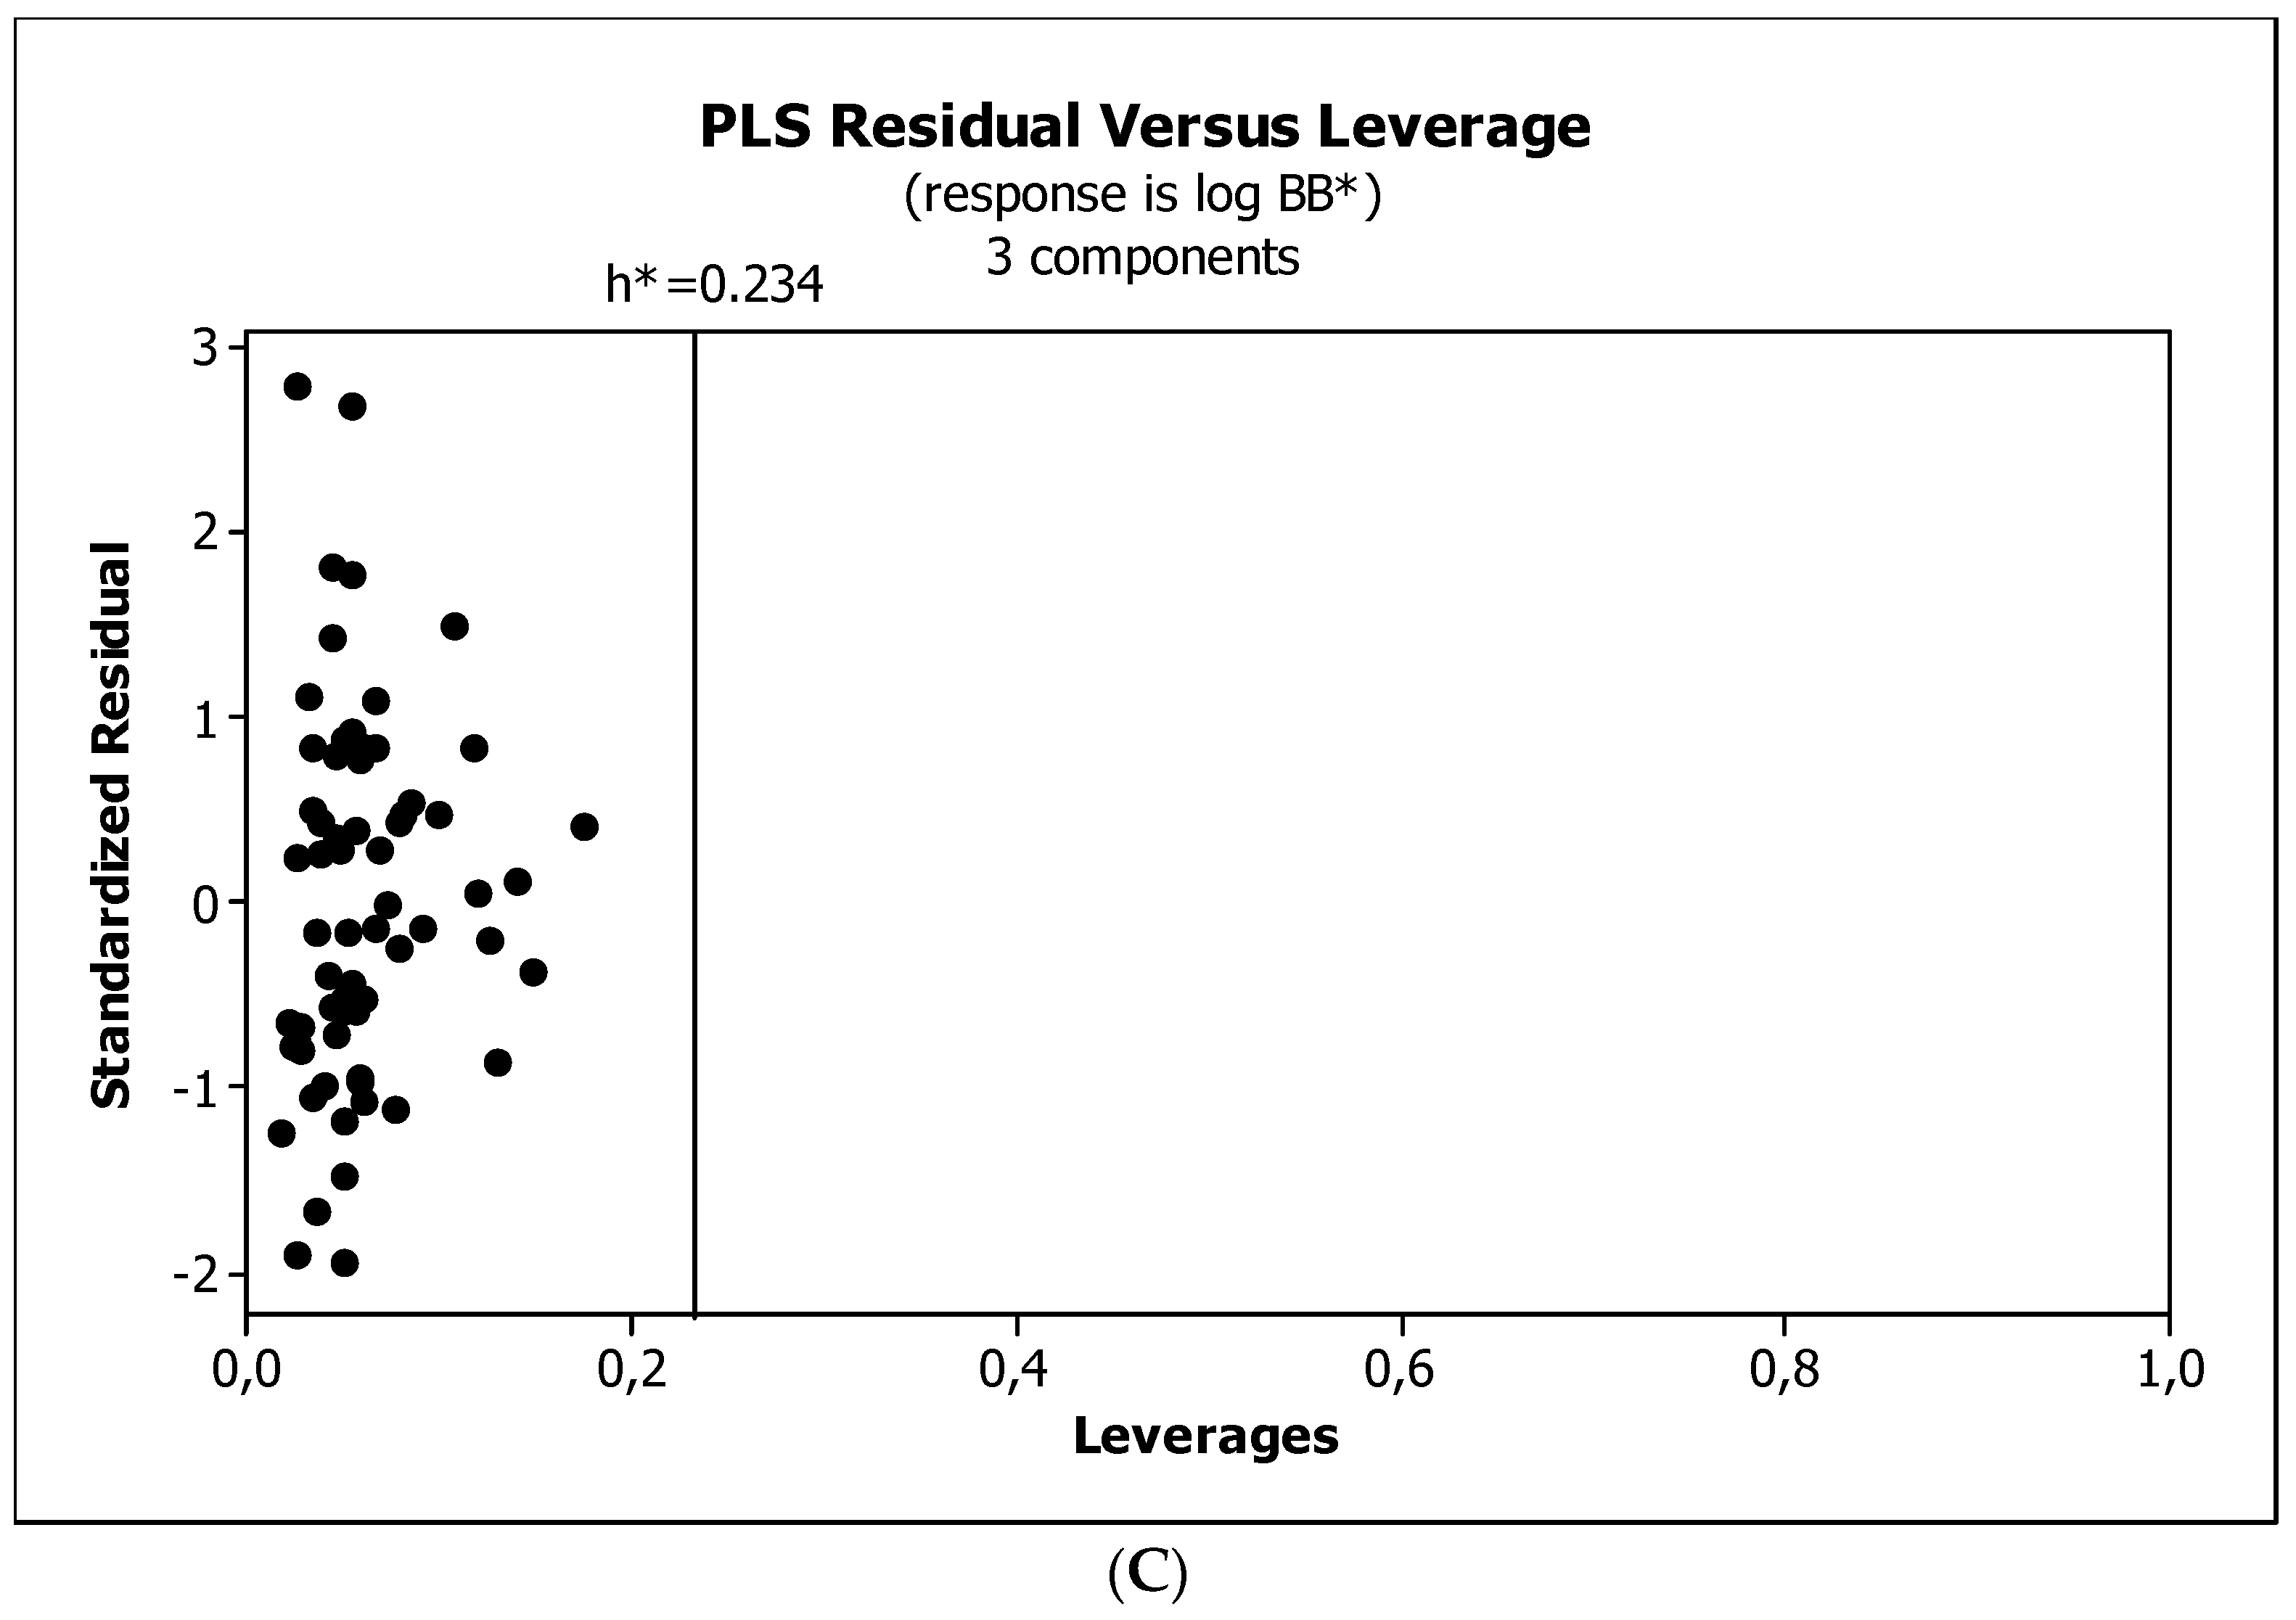
3.3. Establishment of Quantitative Structure–Activity Relationships
3.4. Interpretation of Descriptors
3.4.1. Lipophilicity
3.4.2. HBA
3.4.3. Molecular Size
3.4.4. Flexibility
4. Materials and Methods
4.1. Reagents and Materials
4.2. Instrumental
4.3. Chromatographic Conditions
4.4. In Silico Calculations
4.5. Statistical Analysis
5. Conclusions
Author Contributions
Funding
Institutional Review Board Statement
Informed Consent Statement
Data Availability Statement
Conflicts of Interest
References
- Eriksson, L.; Jaworska, J.; Worth, A.P.; Cronin, M.T.; McDowell, R.M.; Gramatica, P. Methods for reliability and uncertainty assessment and for applicability evaluations of classification and regression based QSARs. Environ. Health Perspect. 2003, 111, 1361–1375. [Google Scholar] [CrossRef] [PubMed]
- Liu, P.; Long, W. Current mathematical methods used in QSAR/QSPR studies. Int. J. Mol. Sci. 2009, 10, 1978–1998. [Google Scholar] [CrossRef] [PubMed]
- Iyer, M.; Mishra, R.; Han, Y.; Hopfinger, A.J. Predicting blood-brain barrier partitioning of organic molecules using membrane-interaction QSAR analysis. Pharm. Res. 2002, 19, 1612–1621. [Google Scholar] [CrossRef] [PubMed]
- Adenot, M.; Lahana, R. Blood-brain barrier permeation models: Discriminating between potential CNS and non-CNS drugs including P-glycoprotein substrates. J. Chem. Inf. Comput. Sci. 2004, 44, 239–248. [Google Scholar] [CrossRef] [PubMed]
- de Campos, L.J.; de Melo, E.B. Modeling structure–activity relationships of prodiginines with antimalarial activity using GA/MLR and OPS/PLS. J. Mol. Graph. Model. 2014, 54, 19–31. [Google Scholar] [CrossRef]
- Kimani, N.M.; Matasyoh, J.C.; Kaiser, M.; Nogueira, M.S.; Trossini, G.H.G.; Schmidt, T.J. Complementary quantitative structure–activity relationship models for the antitrypanosomal activity of sesquiterpene lactones. Int. J. Mol. Sci. 2018, 19, 3721. [Google Scholar] [CrossRef]
- Pourbasheer, E.; Riahi, S.; Ganjali, M.R.; Norouzi, P. Quantitative structure–activity relationship (QSAR) study of interleukin-1 receptor associated kinase 4 (IRAK-4) inhibitor activity by the genetic algorithm and multiple linear regression (GA-MLR) method. J. Enzyme Inhib. Med. Chem. 2010, 25, 844–853. [Google Scholar] [CrossRef]
- Tugcu, G.; Saçan, M.T.; Vračko, M.; Novič, M.; Minovski, N. QSTR modelling of the acute toxicity of pharmaceuticals to fish. SAR QSAR Environ. Res. 2012, 23, 297–310. [Google Scholar] [CrossRef]
- Ciura, K.; Belka, M.; Kawczak, P.; Bączek, T.; Markuszewski, M.J.; Nowakowska, J. Combined computational-experimental approach to predict blood–brain barrier (BBB) permeation based on “green” salting-out thin layer chromatography supported by simple molecular descriptors. J. Pharm. Biomed. Anal. 2017, 143, 214–221. [Google Scholar] [CrossRef]
- Liu, R.; Sun, H.; So, S.-S. Development of quantitative structure-property relationship models for early ADME evaluation in drug discovery. 2. Blood-brain barrier penetration. J. Chem. Inf. Comput. Sci. 2001, 41, 1623–1632. [Google Scholar] [CrossRef]
- Ajay; Bemis, G.W.; Murcko, M.A. Designing libraries with CNS activity. J. Med. Chem. 1999, 42, 4942–4951. [Google Scholar] [CrossRef] [PubMed]
- Kouskoura, M.G.; Piteni, A.I.; Markopoulou, C.K. A new descriptor via bio-mimetic chromatography and modeling for the blood brain barrier (Part II). J. Pharm. Biomed. Anal. 2019, 164, 808–817. [Google Scholar] [CrossRef] [PubMed]
- Goldstein, G.W.; Betz, A.L. The blood-brain barrier. Sci. Am. 1986, 255, 74–83. [Google Scholar] [CrossRef] [PubMed]
- Pardridge, W.M. CNS drug design based on principles of blood brain barrier transport. J. Neurochem. 1998, 70, 1781–1792. [Google Scholar] [CrossRef]
- Begley, D.J. The blood-brain barrier: Principles for targeting peptides and drugs to the central nervous system. J. Pharm. Pharmacol. 1996, 48, 136–140. [Google Scholar] [CrossRef]
- Mouritsen, O.G.; Jorgensen, K. A new look at lipid membrane structure in relation to drug research. Pharm. Res. 1998, 15, 1507–1519. [Google Scholar] [CrossRef]
- Sugano, K.; Kansy, M.; Artursson, P.; Avdeef, A.; Bendels, S.; Di, L.; Ecker, G.F.; Faller, B.; Fischer, H.; Gerebtzoff, G.; et al. Coexistence of passive and carrier-mediated processes in drug transport. Nat. Rev. Drug Discov. 2010, 9, 597–614. [Google Scholar] [CrossRef]
- Sugiyama, Y.; Kusuhara, H.; Suzuki, H. Kinetic and biochemical analysis of carrier-mediated efflux of drugs through the blood-brain and blood-cerebrospinal fluid barriers: Importance in the drug delivery to the brain. J. Cont. Rel. 1999, 62, 179–186. [Google Scholar] [CrossRef]
- Seddon, A.M.; Casey, D.; Law, R.V.; Gee, A.; Templera, R.H.; Cesab, O. Drug interactions with lipid membranes. Chem. Soc. Rev. 2009, 38, 2509–2519. [Google Scholar] [CrossRef]
- Wolak, D.J.; Thorne, R.G. Diffusion of macromolecules in the brain: Implications for drug delivery. Mol. Pharm. 2013, 10, 1492–1504. [Google Scholar] [CrossRef]
- Banks, W.A. Characteristics of compounds that cross the blood-brain barrier. BMC Neurol. 2009, 9 (Suppl. 1), S3. [Google Scholar] [CrossRef] [PubMed]
- Hemmateenejad, B.; Miri, R.; Safarpour, M.A.; Mehdipour, A.R. Accurate prediction of the blood-brain partitioning of a large set of solutes using ab initio calculations and genetic neural network modeling. J. Comput. Chem. 2006, 27, 1125–1135. [Google Scholar] [CrossRef] [PubMed]
- Winkler, D.A.; Burden, F.R. Modeling blood–brain barrier partitioning using Bayesian neural nets. J. Mol. Graphics Model. 2004, 22, 499–505. [Google Scholar] [CrossRef] [PubMed]
- Luco, M. Prediction of the brain–blood distribution of a large set of drugs from structurally derived descriptors using partial least-squares (PLS) modeling. J. Chem. Inf. Comput. Sci. 1999, 39, 396–404. [Google Scholar] [CrossRef]
- Liu, X.; Tu, M.; Kelly, R.S.; Chen, C.; Smith, B.J. Development of a computational approach to predict blood-brain barrier permeability. Drug Metab. Dispos. 2004, 32, 132–139. [Google Scholar] [CrossRef]
- Lombardo, F.; Blake, J.F.; Curatolo, W. Computation of brain-blood partitioning of organic solutes via free-energy calculations. J. Med. Chem. 1996, 39, 4750–4755. [Google Scholar] [CrossRef]
- Keserü, G.M.; Molnar, L. High-throughput prediction of blood-brain partitioning: A thermodynamic approach. J. Chem. Inf. Comput. Sci. 2001, 41, 120–128. [Google Scholar] [CrossRef]
- Norinder, U.; Sjőberg, P.; Osterberg, T. Theoretical calculations and prediction of brain-blood partitioning of organic solutes using MolSurf parametrization and PLS statistics. J. Pharm. Sci. 1998, 88, 815–821. [Google Scholar] [CrossRef]
- Crivori, P.; Cruciani, G.; Carrupt, P.-A.; Testa, B. Predicting blood-brain permeation from three-dimensional molecular structure. J. Med. Chem. 2000, 43, 2204–2216. [Google Scholar] [CrossRef]
- Osterberg, T.; Norinder, U. Prediction of polar surface area and drug transport processes using simple parameters and PLS statistics. J. Chem. Inf. Comput. Sci. 2000, 40, 1408–1411. [Google Scholar] [CrossRef]
- Rose, K.; Hall, L.H.; Kier, L.B. Modeling blood-brain barrier partitioning using the electrotopological state. J. Chem. Inf. Comput. Sci. 2002, 42, 651–666. [Google Scholar] [CrossRef] [PubMed]
- Basak, S.C.; Gute, B.D.; Drewes, L.R. Predicting blood brain transport of drugs: A computational approach. Pharm. Res. 1996, 13, 775–778. [Google Scholar] [CrossRef] [PubMed]
- Kelder, J.; Grootenhuis, P.D.; Bayada, D.M.; Delbressine, L.P.C.; Ploemen, J.P. Polar molecular surface as dominating determinant for oral absorption and brain penetration of drugs. Pharm. Res. 1999, 16, 1514–1519. [Google Scholar] [CrossRef] [PubMed]
- Ertl, P.; Rohde, B.; Selzer, P. Fast calculation of molecular polar surface area as a sum of fragment based contributions and its application to the prediction of drug transport properties. J. Med. Chem. 2000, 43, 3714–3717. [Google Scholar] [CrossRef]
- Abraham, M.H.; Chadha, H.S.; Mitchell, R.C. Hydrogen bonding. 33. Factors that influence the distribution of solutes between blood and brain. J. Pharm. Sci. 1994, 83, 1257–1268. [Google Scholar] [CrossRef]
- van de Waterbeemd, H.; Camenish, G.; Folkers, G.; Chretien, J.R.; Raevsky, O.A. Estimation of blood-brain barrier crossing of drugs using molecular size and shape, and H-bonding descriptors. J. Drugs Target. 1998, 6, 151–165. [Google Scholar] [CrossRef]
- Kaliszan, R. QSRR Quantitative structure—(chromatographic) retention relationships. Chem. Rev. 2007, 107, 3212–3246. [Google Scholar] [CrossRef]
- Dąbrowska, M.; Komsta, Ł.; Krzek, J.; Kokoszka, K. Lipophilicity study of eight cephalosporins by reversed-phase thin-layer chromatographic method. Biomed. Chromatogr. 2015, 29, 1759–1768. [Google Scholar] [CrossRef]
- Kempińska, D.; Chmiel, T.; Kot-Wasik, A.; Mróz, A.; Mazerska, Z.; Namieśnik, J. State of the art and prospects of methods for determination of lipophilicity of chemical compounds. TrAC Trends Anal. Chem. 2019, 113, 54–73. [Google Scholar] [CrossRef]
- Kurbatova, S.V.; Saifutdinov, B.R.; Larionov, O.G.; Meshkovaya, V.V. The influence of the structure of some aromatic heterocyclic derivatives on their retention in reversed-phase high-performance liquid chromatography. Russ. J. Phys. Chem. 2009, 83, 471–477. [Google Scholar] [CrossRef]
- Sagandykova, G.N.; Pomastowski, P.P.; Kaliszan, R.; Buszewski, B. Modern analytical methods for consideration of natural biological activity. TrAC Trends Anal. Chem. 2018, 109, 198–213. [Google Scholar] [CrossRef]
- Milošević, N.P.; Stojanović, S.Z.; Penov-Gaši, K.; Perišić-Janjić, N.; Kaliszan, R. Reversed- and normal-phase liquid chromatography in quantitative structure retention-property relationships of newly synthesized seco-androstene derivatives. J. Pharm. Biomed. Anal. 2014, 88, 636–642. [Google Scholar] [CrossRef] [PubMed]
- Héberger, K. Quantitative structure-(chromatographic) retention relationships. J. Chromatogr. A 2007, 1158, 273–305. [Google Scholar] [CrossRef] [PubMed]
- Andrić, F.; Héberger, K. Towards better understanding of lipophilicity: Assessment of in silico and chromatographic log P measures for pharmaceutically important compounds by nonparametric rankings. J. Pharm. Biomed. Anal. 2015, 115, 183–191. [Google Scholar] [CrossRef]
- Valko, K.; Nunhuck, S.; Bevan, C.; Abraham, M.H.; Reynolds, D.P. Fast gradient HPLC method to determine compounds binding to human serum albumin. Relationships with octanol/water and immobilized artificial membrane lipophilicity. J. Pharm. Sci. 2003, 92, 2236–2248. [Google Scholar]
- Valko, K. Lipophilicity and biomimetic properties measured by HPLC to support drug discovery. J. Pharm. Biomed. Anal. 2016, 130, 35–54. [Google Scholar] [CrossRef]
- Ciura, K.; Dziomba, S. Application of separation methods for in vitro prediction of blood–brain barrier permeability—The state of the art. J. Pharm. Biomed. Anal. 2020, 177, 112891. [Google Scholar] [CrossRef]
- Milošević, N.; Janjić, N.; Milić, N.; Milanović, M.; Popović, J.; Antonowić, D. Pharmacokinetics and toxicity predictors of new s-triazines, herbicide candidates, in correlation with chromatographic retention constants. J. Agric. Food Chem. 2014, 62, 8579–8585. [Google Scholar] [CrossRef]
- Tsopelas, F.; Giaginis, C.; Tsantili-Kakoulidou, A. Lipophilicity and biomimetic properties to support drug discovery. Expert Opin. Drug Discov. 2017, 12, 885–896. [Google Scholar] [CrossRef]
- Russo, G.; Grumetto, L.; Szucs, R.; Barbato, F.; Lynen, F. Screening therapeutics according to their uptake across the blood-brain barrier: A high throughput method based on immobilized artificial membrane liquid chromatography-diode-array-detection coupled to electrospray-time-of-flight mass spectrometry. Eur. J. Pharm. Biopharm. 2018, 127, 72–84. [Google Scholar] [CrossRef]
- Stergiopoulos, C.; Tsopelas, F.; Valko, K.; Ochsenkühn-Petropoulou, M. The use of biomimetic chromatography to predict acute aquatic toxicity of pharmaceutical compounds. Toxicol. Environ. Chem. 2022, 104, 1–19. [Google Scholar] [CrossRef]
- Escuder-Gilabert, L.; Molero-Monfort, M.; Villanueva- Camañas, R.M.; Sagrado, S.; Medina-Hernández, M.J. Potential of biopartitioning micellar chromatography as an in vitro technique for predicting drug penetration across the blood-brain barrier. J. Chromatogr. B Analyt. Technol. Biomed. Life Sci. 2004, 807, 193–201. [Google Scholar] [CrossRef] [PubMed]
- Ruiz-Ángel, M.; Garcia-Álvarez-Coque, M.; Berthod, A. New insights and recent developments in micellar liquid chromatography. Sep. Pur. Rev. 2009, 38, 45–96. [Google Scholar] [CrossRef]
- Rambla-Alegre, M. Basic principles of MLC. Chromatogr. Res. Int. 2012, 2012, 898520. [Google Scholar] [CrossRef]
- Kalyankar, T.M.; Kulkarni, P.D.; Wadher, S.J.; Pekamwar, S.S. Applications of micellar liquid chromatography in bioanalysis: A review. J. Appl. Pharm. Sci. 2014, 4, 128–134. [Google Scholar]
- Tsopelas, F.; Danias, P.; Pappa, A.; Tsantili-Kakoulidou, A. Biopartitioning micellar chromatography under different conditions: Insight into the retention mechanism and the potential to model biological processes. J. Chromatogr. A 2020, 1621, 461027. [Google Scholar] [CrossRef]
- Foley, J.P. Critical compilation of solute-micelle binding constants and related parameters from micellar liquid chromatographic measurements. Anal. Chim. Acta 1990, 231, 237–247. [Google Scholar] [CrossRef]
- Janicka, M.; Sztanke, M.; Sztanke, K. Reversed-phase liquid chromatography with octadecylsilyl, immobilized artificial membrane and cholesterol columns in correlation studies with in silico biological descriptors of newly synthesized antiproliferative and analgesic active compounds. J. Chromatogr. A 2013, 1318, 92–101. [Google Scholar] [CrossRef]
- Sztanke, M.; Tuzimski, T.; Janicka, M.; Sztanke, K. Structure-retention behaviour of biologically active fused 1,2,4-triazinones—Comparison with in silico molecular properties. Eur. J. Pharm. Sci. 2015, 68, 114–126. [Google Scholar] [CrossRef]
- Sztanke, M.; Rzymowska, J.; Janicka, M.; Sztanke, K. Synthesis, structure confirmation, identification of in vitro antiproliferative activities and correlation of determined lipophilicity parameters with in silico bioactivity descriptors of two novel classes of fused azaisocytosine-like congeners. Arabian J. Chem. 2019, 12, 5302–5324. [Google Scholar] [CrossRef]
- Sztanke, M.; Sztanke, K. 3-(2-Phenylethyl)-8-aryl-7,8-dihydroimidazo[2,1-c][1,2,4]triazin-4(6H)-ones, Method for Obtaining Them and Medical Application. Polish Patent PL 224678, 31 January 2017. [Google Scholar]
- Sztanke, M.; Sztanke, K. 3-Ethyl-8-aryl-7,8-dihydroimidazo[2,1-c][1,2,4]triazin-4(6H)-ones, Method for Obtaining Them and Medical Application. Polish Patent PL 224679, 31 January 2017. [Google Scholar]
- Sztanke, K.; Sztanke, M. Ethyl 2-(4-oxo-4,6,7,8-tetrahydroimidazo[2,1-c][1,2,4]triazin-3-yl)acetates, Method for Obtaining Them and Medical Application. Polish Patent PL 219424, 30 April 2015. [Google Scholar]
- Sztanke, M.; Rzymowska, J.; Sztanke, K. Synthesis, structure elucidation and in vitro anticancer activities of novel derivatives of diethyl (2E)-2-[(2E)-(1-arylimidazolidin-2-ylidene)hydrazono]succinate and ethyl(4-oxo-8-aryl-4,6,7,8-tetrahydroimidazo[2,1-c][1,2,4]triazin-3-yl)acetate. Bioorg. Med. Chem. 2013, 21, 7465–7480. [Google Scholar] [CrossRef] [PubMed]
- Sztanke, M.; Sztanke, K.; Rajtar, B.; Świątek, Ł.; Boguszewska, A.; Polz-Dacewicz, M. The influence of some promising fused azaisocytosine-containing congeners on zebrafish (Danio rerio) embryos/larvae and their antihaemolytic, antitumour and antiviral activities. Eur. J. Pharm. Sci. 2019, 132, 34–43. [Google Scholar] [CrossRef] [PubMed]
- Sztanke, K.; Tuzimski, T.; Sztanke, M.; Rzymowska, J.; Pasternak, K. Synthesis, structure elucidation, determination of the lipophilicity and identification of antitumour activities in vitro of novel 3-(2-furanyl)-8-aryl-7,8-dihydroimidazo[2,1-c][1,2,4]triazin-4(6H)-ones with a low cytotoxicity towards normal human skin fibroblast cells. Bioorg. Med. Chem. 2011, 19, 5103–5116. [Google Scholar] [PubMed]
- Sztanke, K.; Sztanke, M.; Pasternak, K. 3-(2-Furanyl)-7,8-dihydroimidazo[2,1-c][1,2,4]triazin-4(6H)-ones Substituted with Mono- or Dichlorophenyl and Process for the Preparation Thereof. Polish Patent PL 212442, 31 October 2012. [Google Scholar]
- Sztanke, K.; Sztanke, M.; Pasternak, K. Derivatives of 3-(2-furanyl)-7,8-dihydroimidazo[2,1-c][1,2,4]triazin-4(6H)-one Substituted with Phenyl, Alkylphenyl, Alkoxyphenyl and Process for the Preparation Thereof. Polish Patent PL 212447, 31 October 2012. [Google Scholar]
- Sztanke, K. New 8-aryl-3-phenyl-6,7-dihydro-4H-imidazo[2,1-c][1,2,4]triazine-4-ones and Methods for Their Manufacture. Polish Patent PL 199750, 31 October 2008. [Google Scholar]
- Sztanke, K.; Pasternak, K.; Sztanke, M.; Kandefer-Szerszeń, M.; Kozioł, A.E.; Dybała, I. Crystal structure, antitumour and antimetastatic activities of disubstituted fused 1,2,4-triazinones. Bioorg. Med. Chem. Lett. 2009, 19, 5095–5100. [Google Scholar] [CrossRef] [PubMed]
- Tuzimski, T.; Sztanke, K. Retention data for some carbonyl derivatives of imidazo[2,1-c][1,2,4]triazine in reversed-phase systems in TLC and HPLC and their use for determination of lipophilicity. Part 1. Lipophilicity of 8-aryl-3-phenyl-6,7-dihydro-4H-imidazo[2,1-c][1,2,4]triazin-4-ones. J. Planar Chromatogr. 2005, 18, 274–281. [Google Scholar]
- Bartyzel, A.; Sztanke, M.; Sztanke, K. Thermal behaviour of antiproliferative active 3-(2-furanyl)-8-aryl-7,8-dihydroimidazo[2,1-c][1,2,4]triazin-4(6H)-ones. J. Therm. Anal. Calorim. 2017, 130, 1541–1551. [Google Scholar] [CrossRef][Green Version]
- Stępniowska, A.; Sztanke, M.; Tuzimski, T.; Korolczuk, M.; Sztanke, K. A simple stripping voltammetric method for the determination of a new anticancer prodrug in serum. Biosens. Bioelectron. 2017, 94, 584–588. [Google Scholar] [CrossRef]
- Kozak, J.; Tyszczuk-Rotko, K.; Sadok, I.; Sztanke, K.; Sztanke, M. Application of screen-printed sensor modified with carbon nanofibers for the voltammetric analysis of an anticancer disubstituted fused triazinone. Int. J. Mol. Sci. 2022, 23, 2429. [Google Scholar] [CrossRef]
- Janicka, M.; Sztanke, M.; Sztanke, K. Predicting the blood-brain barrier permeability of new drug-like compounds via HPLC with various stationary phases. Molecules 2020, 25, 487. [Google Scholar] [CrossRef]
- Janicka, M.; Śliwińska, A. Quantitative retention (structure)—Activity relationships in predicting the pharmaceutical and toxic properties of potential pesticides. Molecules 2022, 27, 3599. [Google Scholar] [CrossRef]
- Lipinski, C.A.; Lombardo, F.; Dominy, B.W.; Feeney, P.J. Experimental and computational approaches to estimate solubility and permeability in drug discovery and development settings. Adv. Drug Deliv. Rev. 1997, 23, 3–25. [Google Scholar] [CrossRef]
- Clark, D.E. In silico prediction of blood−brain barrier permeation. Drug Discov. Today 2003, 15, 927–933. [Google Scholar] [CrossRef] [PubMed]
- Roy, K.; Kar, S.; Das, R.N. A Primer on QSAR/QSPR Modeling: Fundamental Concepts; Springer Briefs in Molecular Science; Springer: Berlin/Heidelberg, Germany, 2015; pp. 1–35. [Google Scholar]
- Roy, K.; Kar, S.; Das, R.N. Understanding the Basics of QSAR for Applications in Pharmaceutical Sciences and Risk Assessment; Academic Press: Cambridge, MA, USA, 2015; pp. 1–46. [Google Scholar]
- Hamadache, M.; Benkortbi, O.; Hanini, S.; Amrane, A. QSAR modeling in ecotoxicological risk assessment: Application to the prediction of acute contact toxicity of pesticides on bees (Apis mellifera L.). Environ. Sci. Pollut. Res. 2018, 25, 896–907. [Google Scholar] [CrossRef] [PubMed]
- Hamadache, M.; Benkortbi, O.; Hanini, H.; Amrane, A.; Khaouane, L.; Si Moussa, C. A quantitative structure activity relationship for acute oral toxicity of pesticides on rats: Validation, domain of application and prediction. J. Hazard. Mater. 2016, 303, 28–40. [Google Scholar] [CrossRef] [PubMed]
- Sawant, S.D.; Nerkar, A.G.; Pawar, N.D.; Velapure, A.V. Design, synthesis, QSAR studies and biological evaluation of novel triazolopiperazine based β-amino amides as dipeptidyl peptidase-IV (DPP-IV) inhibitors: Part-II. Int. J. Pharm. Pharm. Sci. 2014, 6, 812–817. [Google Scholar]
- Clementi, M.; Clementi, S.; Fornaciari, M.; Orlandi, F.; Romano, B. The GOLPE procedure for predicting olive crop production from climatic parameters. J. Chemom. 2001, 15, 397–404. [Google Scholar] [CrossRef]
- Chen, J.W.; Li, X.H.; Yu, H.Y.; Wang, Y.N.; Qiao, X.L. Progress and perspectives of quantitative structure–activity relationships used for ecological risk assessment of toxic organic compounds. Sci. China Ser. B-Chem. 2008, 51, 593–606. [Google Scholar] [CrossRef]
- Organization for Economic Co-Operation and Development, Guidance Document on the Validation of (Quantitative) Structure–Activity Relationship[(Q)SAR] Models. March 2007. Available online: https://www.oecd.org/env/guidance-document-on-the-validation-of-quantitative-structure-activity-relationship-q-sar-models-9789264085442-en.htm (accessed on 13 April 2022).
- Saaidpour, S.; Bahmani, A.; Rostami, A. Prediction the normal boiling points of primary, secondary and tertiary liquid amines from their molecular structure descriptors. CMST 2015, 21, 201–210. [Google Scholar] [CrossRef]
- Kaliszan, R.; Markuszewski, M. Brain-blood distribution described by a combination of partition coefficients and molecular mass. Int. J. Pharm. 1996, 45, 9–16. [Google Scholar] [CrossRef]
- Testa, B.; Crivori, P.; Reist, M.; Carrupt, P.A. The influence of lipophilicity on the pharmacokinetic behavior of drugs: Concepts and examples. Persp. Drug Discov. Des. 2000, 19, 179–211. [Google Scholar] [CrossRef]
- Levin, V.A. Relationship of octanol/water partition coefficient and molecular weight to rat brain capillary permeability. J. Med. Chem. 1980, 23, 682–684. [Google Scholar] [CrossRef] [PubMed]
- Platts, J.A.; Abraham, M.H.; Hersey, A.; Butina, D. Estimation of molecular linear free energy relationship descriptors. 4. Correlation and prediction of cell permeation. Pharm. Res. 2000, 17, 1013–1018. [Google Scholar] [CrossRef] [PubMed]
- Janicka, M.; Mycka, A.; Sztanke, M.; Sztanke, K. Predicting pharmacokinetic properties of potential anticancer agents via their chromatographic behavior on different reversed phase materials. Int. J. Mol. Sci. 2021, 22, 4257. [Google Scholar] [CrossRef] [PubMed]
- Pan, D.; Iyer, M.; Liu, J.; Li, Y.; Hopfinger, A.J. Constructing optimum blood brain barrier QSAR models using a combination of 4D-molecular similarity measures and cluster analysis. J. Chem. Inf. Comput. Sci. 2004, 44, 2083–2098. [Google Scholar] [CrossRef]
- Veber, D.F.; Johnson, S.R.; Cheng, H.-Y.; Smith, B.R.; Ward, K.W.; Kopple, K.D. Molecular properties that influence the oral bioavailability of drug candidates. J. Med. Chem. 2002, 45, 2615–2623. [Google Scholar] [CrossRef] [PubMed]


| Class | General Structure | No | R1 | R2 |
|---|---|---|---|---|
| I |  | 1 | R1 = H | — |
| 2 | R1 = 4-CH3 | — | ||
| 3 | R1 = 2-Cl | — | ||
| 4 | R1 = 3-Cl | — | ||
| 5 | R1 = 4-Cl | — | ||
| 6 | R1 = 3,4-Cl2 | — | ||
| II |  | 7 | R1 = H | — |
| 8 | R1 = 4-CH3 | — | ||
| 9 | R1 = 4-OCH3 | — | ||
| 10 | R1 = 4-OC2H5 | — | ||
| 11 | R1 = 4-Cl | — | ||
| III |  | 12 | R1 = H | — |
| 13 | R1 = 4-CH3 | — | ||
| 14 | R1 = 4-OCH3 | — | ||
| 15 | R1 = 3-Cl | — | ||
| 16 | R1 = 4-Cl | — | ||
| 17 | R1 = 3,4-Cl2 | — | ||
| IV |  | 18 | R1 = H | — |
| 19 | R1 = 2-CH3 | — | ||
| 20 | R1 = 4-CH3 | — | ||
| 21 | R1 = 2,3-(CH3)2 | — | ||
| 22 | R1 = 2-OCH3 | — | ||
| 23 | R1 = 4-OCH3 | — | ||
| 24 | R1 = 2-Cl | — | ||
| 25 | R1 = 3-Cl | — | ||
| 26 | R1 = 4-Cl | — | ||
| 27 | R1 = 3,4-Cl2 | — | ||
| 28 | R1 = 2,6-Cl2 | — | ||
| V |  | 29 | R1 = H | — |
| 30 | R1 = 2-CH3 | — | ||
| 31 | R1 = 3-CH3 | — | ||
| 32 | R1 = 4-CH3 | — | ||
| 33 | R1 = 2-OCH3 | — | ||
| 34 | R1 = 4-OCH3 | — | ||
| 35 | R1 = 4-OC2H5 | — | ||
| 36 | R1 = 2,3-(CH3)2 | — | ||
| 37 | R1 = 2-Cl | — | ||
| 38 | R1 = 3-Cl | — | ||
| 39 | R1 = 4-Cl | — | ||
| 40 | R1 = 3,4-Cl2 | — | ||
| VI |  | 41 | R1 = H | R2 = H |
| 42 | R1 = H | R2 = 2-Cl | ||
| 43 | R1 = H | R2 = 3-Cl | ||
| 44 | R1 = H | R2 = 4-Cl | ||
| 45 | R1 = 4-CH3 | R2 = H | ||
| 46 | R1 = 4-CH3 | R2 = 4-CH3 | ||
| 47 | R1 = 4-CH3 | R2 = 3-CH3 | ||
| 48 | R1 = 4-CH3 | R2 = 2-Cl | ||
| 49 | R1 = 4-CH3 | R2 = 3-Cl | ||
| 50 | R1 = 4-CH3 | R2 = 4-Cl | ||
| 51 | R1 = 4-OC2H5 | R2 = H | ||
| 52 | R1 = 4-OC2H5 | R2 = 4-CH3 | ||
| 53 | R1 = 4-OC2H5 | R2 = 2-Cl | ||
| 54 | R1 = 4-OC2H5 | R2 = 3-Cl | ||
| 55 | R1 = 4-OC2H5 | R2 = 4-Cl | ||
| 56 | R1 = 2-CH3 | R2 = 2-Cl | ||
| 57 | R1 = 4-Cl | R2 = H | ||
| 58 | R1 = 4-Cl | R2 = 2-Cl | ||
| 59 | R1 = 4-Cl | R2 = 3-Cl | ||
| 60 | R1 = 4-Cl | R2 = 4-Cl | ||
| VII |  | 61 | R1 = H | — |
| 62 | R1 = 4-CH3 | — | ||
| 63 | R1 = 2-Cl | — | ||
| 64 | R1 = 4-Cl | — | ||
| 65 | R1 = 3,4-Cl2 | — |
| No | 1/km | KAM/km | R2 | No | 1/km | KAM/km | R2 |
|---|---|---|---|---|---|---|---|
| 1 | −0.765 | 9.066 | 0.9178 | 34 | −0.329 | 3.829 | 0.9615 |
| 2 | −0.586 | 6.826 | 0.9530 | 35 | −0.321 | 3.685 | 0.9604 |
| 3 | −0.758 | 8.907 | 0.9110 | 36 | −0.432 | 5.006 | 0.9593 |
| 4 | −0.528 | 6.157 | 0.9700 | 37 | −0.425 | 4.933 | 0.9442 |
| 5 | −0.518 | 6.028 | 0.9553 | 38 | −0.425 | 4.870 | 0.9606 |
| 6 | −0.406 | 4.722 | 0.9748 | 39 | −0.288 | 3.326 | 0.9717 |
| 7 | −1.046 | 12.573 | 0.9124 | 40 | −0.214 | 2.470 | 0.9692 |
| 8 | −0.785 | 9.294 | 0.9592 | 41 | −0.354 | 4.119 | 0.9753 |
| 9 | −1.163 | 13.801 | 0.9618 | 42 | −0.289 | 3.322 | 0.9764 |
| 10 | −0.876 | 10.274 | 0.9477 | 43 | −0.225 | 2.944 | 0.9724 |
| 11 | −0.707 | 8.316 | 0.9759 | 44 | −0.246 | 2.822 | 0.9741 |
| 12 | −0.760 | 8.902 | 0.9302 | 45 | −0.257 | 2.976 | 0.9378 |
| 13 | −0.568 | 6.593 | 0.9592 | 46 | −0.206 | 2.361 | 0.9705 |
| 14 | −0.565 | 7.520 | 0.9932 | 47 | −0.190 | 2.198 | 0.9728 |
| 15 | −0.509 | 5.898 | 0.9696 | 48 | −0.199 | 2.272 | 0.9694 |
| 16 | −0.503 | 5.825 | 0.9732 | 49 | −0.213 | 2.448 | 0.9695 |
| 17 | −0.395 | 4.569 | 0.9734 | 50 | −0.174 | 2.001 | 0.9666 |
| 18 | −0.599 | 7.079 | 0.9622 | 51 | −0.295 | 3.399 | 0.9704 |
| 19 | −0.597 | 6.995 | 0.9375 | 52 | −0.211 | 2.441 | 0.9718 |
| 20 | −0.410 | 4.836 | 0.9776 | 53 | −0.227 | 2.606 | 0.9684 |
| 21 | −0.594 | 6.814 | 0.9473 | 54 | −0.285 | 3.202 | 0.9441 |
| 22 | −0.458 | 5.274 | 0.9638 | 55 | −0.191 | 2.203 | 0.9636 |
| 23 | −0.474 | 5.694 | 0.9695 | 56 | −0.309 | 3.549 | 0.9763 |
| 24 | −1.131 | 12.985 | 0.9193 | 57 | −0.540 | 6.358 | 0.9690 |
| 25 | −0.692 | 7.917 | 0.9672 | 58 | −0.180 | 2.073 | 0.9521 |
| 26 | −0.420 | 4.868 | 0.9733 | 59 | −0.185 | 2.118 | 0.9609 |
| 27 | −0.639 | 7.247 | 0.9662 | 60 | −0.157 | 1.820 | 0.9465 |
| 28 | −0.461 | 5.307 | 0.9593 | 61 | −0.241 | 2.856 | 0.9792 |
| 29 | −0.382 | 4.464 | 0.9659 | 62 | −0.175 | 2.051 | 0.9765 |
| 30 | −0.451 | 5.916 | 0.9656 | 63 | −0.193 | 2.343 | 0.9682 |
| 31 | −0.301 | 3.477 | 0.9657 | 64 | −0.151 | 1.802 | 0.9488 |
| 32 | −0.287 | 3.322 | 0.9707 | 65 | −0.132 | 1.550 | 0.9358 |
| 33 | −0.479 | 5.531 | 0.9187 |
| No | log (km/KAM) | log BB | log BB* [75] | TPSA Å2 | HBD | HBA | NRB | MW g mol−1 | α Å3 | Ƥ m3 mol−1 |
|---|---|---|---|---|---|---|---|---|---|---|
| 1 | −0.957 | 0.117 | 0.21 | 48.27 | 0 | 5 | 2 | 242.28 | 27.55 | 497.81 |
| 2 | −0.834 | 0.305 | 0.32 | 48.27 | 0 | 5 | 2 | 256.30 | 29.30 | 528.90 |
| 3 | −0.950 | 0.226 | 0.26 | 48.27 | 0 | 5 | 2 | 276.72 | 29.37 | 526.66 |
| 4 | −0.789 | 0.270 | 0.30 | 48.27 | 0 | 5 | 2 | 276.72 | 29.37 | 526.66 |
| 5 | −0.780 | 0.209 | 0.24 | 48.27 | 0 | 5 | 2 | 276.72 | 29.37 | 526.66 |
| 6 | −0.674 | 0.360 | 0.34 | 48.27 | 0 | 5 | 2 | 311.17 | 31.20 | 555.51 |
| 7 | −1.099 | −0.243 | −0.16 | 74.57 | 0 | 7 | 4 | 286.29 | 30.27 | 561.26 |
| 8 | −0.968 | −0.051 | −0.04 | 74.57 | 0 | 7 | 4 | 300.31 | 32.02 | 592.35 |
| 9 | −1.140 | −0.293 | −0.28 | 83.80 | 0 | 8 | 5 | 316.31 | 32.57 | 611.52 |
| 10 | −1.012 | −0.167 | −0.20 | 83.80 | 0 | 8 | 6 | 330.34 | 34.40 | 650.13 |
| 11 | −0.920 | −0.151 | −0.12 | 74.57 | 0 | 7 | 4 | 320.73 | 32.09 | 590.11 |
| 12 | −0.949 | −0.132 | −0.10 | 74.57 | 0 | 7 | 5 | 300.31 | 32.09 | 604.35 |
| 13 | −0.819 | 0.055 | 0.02 | 74.57 | 0 | 7 | 5 | 314.38 | 33.85 | 635.45 |
| 14 | −0.876 | −0.167 | −0.20 | 83.80 | 0 | 8 | 6 | 330.34 | 34.40 | 599.87 |
| 15 | −0.771 | 0.029 | 0.00 | 74.57 | 0 | 7 | 5 | 334.76 | 33.92 | 630.96 |
| 16 | −0.766 | −0.033 | −0.05 | 74.57 | 0 | 7 | 5 | 334.76 | 33.92 | 650.13 |
| 17 | −0.660 | 0.117 | 0.05 | 74.57 | 0 | 7 | 5 | 369.20 | 35.74 | 628.72 |
| 18 | −0.850 | 0.038 | 0.06 | 61.41 | 0 | 6 | 2 | 280.31 | 30.82 | 628.72 |
| 19 | −0.845 | 0.225 | 0.17 | 61.41 | 0 | 6 | 2 | 294.34 | 33.57 | 657.57 |
| 20 | −0.684 | 0.225 | 0.17 | 61.41 | 0 | 6 | 2 | 294.34 | 32.57 | 578.01 |
| 21 | −0.833 | 0.417 | 0.29 | 61.41 | 0 | 6 | 2 | 308.37 | 34.33 | 609.11 |
| 22 | −0.722 | 0.006 | −0.04 | 70.64 | 0 | 7 | 3 | 310.34 | 33.12 | 597.18 |
| 23 | −0.755 | 0.003 | −0.05 | 70.64 | 0 | 7 | 3 | 310.34 | 33.12 | 597.18 |
| 24 | −1.113 | 0.141 | 0.11 | 61.41 | 0 | 6 | 2 | 314.75 | 32.64 | 575.77 |
| 25 | −0.899 | 0.194 | 0.16 | 61.41 | 0 | 6 | 2 | 314.75 | 32.64 | 575.77 |
| 26 | −0.687 | 0.130 | 0.09 | 61.41 | 0 | 6 | 2 | 314.75 | 32.64 | 575.77 |
| 27 | −0.860 | 0.281 | 0.19 | 61.41 | 0 | 6 | 2 | 349.20 | 34.47 | 604.62 |
| 28 | −0.725 | 0.297 | 0.21 | 61.41 | 0 | 6 | 2 | 349.20 | 34.47 | 604.62 |
| 29 | −0.650 | 0.227 | 0.15 | 48.27 | 0 | 5 | 2 | 290.32 | 33.92 | 604.97 |
| 30 | −0.772 | 0.407 | 0.26 | 48.27 | 0 | 5 | 2 | 304.35 | 35.68 | 636.07 |
| 31 | −0.541 | 0.407 | 0.26 | 48.27 | 0 | 5 | 2 | 304.35 | 35.68 | 636.07 |
| 32 | −0.521 | 0.407 | 0.26 | 48.27 | 0 | 5 | 2 | 304.35 | 35.68 | 636.07 |
| 33 | −0.743 | 0.188 | 0.05 | 57.50 | 0 | 6 | 3 | 320.35 | 36.23 | 655.23 |
| 34 | −0.583 | 0.172 | 0.04 | 57.50 | 0 | 6 | 3 | 320.35 | 36.23 | 655.23 |
| 35 | −0.566 | 0.298 | 0.11 | 57.50 | 0 | 6 | 4 | 334.41 | 38.05 | 693.84 |
| 36 | −0.699 | 0.594 | 0.38 | 48.27 | 0 | 5 | 2 | 318.37 | 37.43 | 667.16 |
| 37 | −0.693 | 0.331 | 0.20 | 48.27 | 0 | 5 | 2 | 324.76 | 35.75 | 633.82 |
| 38 | −0.682 | 0.376 | 0.25 | 48.27 | 0 | 5 | 2 | 324.76 | 35.75 | 633.82 |
| 39 | −0.522 | 0.319 | 0.19 | 48.27 | 0 | 5 | 2 | 324.76 | 35.75 | 633.82 |
| 40 | −0.393 | 0.465 | 0.29 | 48.27 | 0 | 5 | 2 | 359.21 | 37.57 | 662.67 |
| 41 | −0.615 | 0.341 | 0.22 | 48.27 | 0 | 5 | 3 | 304.35 | 35.75 | 643.58 |
| 42 | −0.521 | 0.459 | 0.28 | 48.27 | 0 | 5 | 3 | 338.82 | 37.57 | 672.43 |
| 43 | −0.469 | 0.459 | 0.28 | 48.27 | 0 | 5 | 3 | 338.82 | 37.57 | 672.43 |
| 44 | −0.451 | 0.459 | 0.28 | 48.27 | 0 | 5 | 3 | 338.82 | 37.57 | 672.43 |
| 45 | −0.474 | 0.524 | 0.33 | 48.27 | 0 | 5 | 3 | 318.41 | 37.57 | 674.68 |
| 46 | −0.373 | 0.712 | 0.45 | 48.27 | 0 | 5 | 3 | 332.44 | 39.26 | 705.77 |
| 47 | −0.342 | 0.712 | 0.45 | 48.27 | 0 | 5 | 3 | 332.44 | 39.26 | 705.77 |
| 48 | −0.356 | 0.635 | 0.38 | 48.27 | 0 | 5 | 3 | 352.85 | 39.26 | 703.53 |
| 49 | −0.389 | 0.635 | 0.38 | 48.27 | 0 | 5 | 3 | 352.85 | 39.33 | 703.53 |
| 50 | −0.302 | 0.635 | 0.38 | 48.27 | 0 | 5 | 3 | 352.85 | 39.33 | 703.53 |
| 51 | −0.531 | 0.424 | 0.19 | 57.50 | 0 | 6 | 5 | 348.44 | 39.88 | 732.46 |
| 52 | −0.387 | 0.602 | 0.37 | 57.50 | 0 | 6 | 5 | 362.47 | 41.63 | 763.55 |
| 53 | −0.416 | 0.526 | 0.23 | 57.50 | 0 | 6 | 5 | 382.88 | 41.70 | 761.31 |
| 54 | −0.505 | 0.526 | 0.23 | 57.50 | 0 | 6 | 5 | 382.88 | 41.70 | 761.31 |
| 55 | −0.343 | 0.526 | 0.22 | 57.50 | 0 | 6 | 5 | 382.88 | 41.70 | 761.31 |
| 56 | −0.550 | 0.635 | 0.38 | 48.27 | 0 | 5 | 3 | 352.85 | 39.33 | 703.53 |
| 57 | −0.803 | 0.440 | 0.27 | 48.27 | 0 | 5 | 3 | 338.82 | 37.57 | 672.43 |
| 58 | −0.317 | 0.551 | 0.31 | 48.27 | 0 | 5 | 3 | 373.27 | 39.40 | 701.28 |
| 59 | −0.326 | 0.551 | 0.31 | 48.27 | 0 | 5 | 3 | 373.27 | 39.40 | 701.28 |
| 60 | −0.260 | 0.551 | 0.31 | 48.27 | 0 | 5 | 3 | 373.27 | 39.40 | 701.28 |
| 61 | −0.456 | 0.459 | 0.29 | 48.27 | 0 | 5 | 4 | 318.37 | 37.58 | 682.19 |
| 62 | −0.312 | 0.651 | 0.41 | 48.27 | 0 | 5 | 4 | 332.40 | 39.33 | 713.29 |
| 63 | −0.370 | 0.567 | 0.34 | 48.27 | 0 | 5 | 4 | 352.82 | 39.40 | 711.04 |
| 64 | −0.256 | 0.551 | 0.33 | 48.27 | 0 | 5 | 4 | 352.82 | 39.40 | 711.04 |
| 65 | −0.190 | 0.701 | 0.43 | 48.27 | 0 | 5 | 4 | 387.26 | 41.22 | 739.89 |
| Model | R2 | R2adj | R2pred | PRESS | VIF* | SS | MSE | F | p | Q2LOO | PRESSLOO |
|---|---|---|---|---|---|---|---|---|---|---|---|
| M1: log BB vs. (log (km/KAM), TPSA, NRB, α) | 0.9202 | 0.9149 | 0.9088 | 0.3889 | 5.3 | 4.2636 | 0.0057 | 173.0 | 0.00000 | – | – |
| M2: log BB vs. (log (km/KAM), TPSA, NRB, Ƥ) | 0.9070 | 0.9008 | 0.8931 | 0.4556 | 4.7 | 4.2636 | 0.0066 | 146.3 | 0.00000 | – | – |
| M3: log BB vs. (log (km/KAM), TPSA, NRB, MW) | 0.8943 | 0.8873 | 0.8799 | 0.5119 | 5.0 | 4.2636 | 0.0075 | 129.9 | 0.00000 | – | – |
| M4: log BB vs. (log (km/KAM), HBA, NRB, α) | 0.9260 | 0.9210 | 0.9150 | 0.3625 | 5.4 | 4.2636 | 0.2774 | 187.6 | 0.00000 | – | – |
| M5: log BB vs. (log (km/KAM), HBA, NRB, Ƥ) | 0.9109 | 0.9049 | 0.8971 | 0.4385 | 4.7 | 4.2636 | 0.0063 | 153.3 | 0.00000 | 0.9109 | 0.4385 |
| M6: log BB vs. (log (km/KAM), HBA, NRB, MW) | 0.8914 | 0.8841 | 0.8764 | 0.5268 | 4.8 | 4.2636 | 0.0077 | 123.1 | 0.00000 | – | – |
| M7: log BB* vs. (log (km/KAM), TPSA, NRB, α) | 0.8523 | 0.8425 | 0.8310 | 0.3247 | 5.3 | 1.9212 | 0.0047 | 86.6 | 0.00000 | – | – |
| M8: log BB* vs. (log (km/KAM), TPSA, NRB, Ƥ) | 0.8508 | 0.8409 | 0.8297 | 0.3271 | 4.7 | 1.9212 | 0.0048 | 85.5 | 0.00000 | – | – |
| M9: log BB* vs. (log (km/KAM), TPSA, NRB, MW) | 0.8529 | 0.8430 | 0.8324 | 0.3219 | 5.0 | 1.9212 | 0.0047 | 86.9 | 0.00000 | – | – |
| M10: log BB* vs. (log (km/KAM), HBA, NRB, α) | 0.8682 | 0.8595 | 0.8489 | 0.2904 | 5.4 | 1.9212 | 0.0042 | 98.8 | 0.00000 | – | – |
| M11: log BB* vs. (log (km/KAM), HBA, NRB, Ƥ) | 0.8659 | 0.8569 | 0.8466 | 0.2941 | 4.7 | 1.9212 | 0.0043 | 96.8 | 0.00000 | 0.8659 | 0.2947 |
| M12: log BB* vs. (log (km/KAM), HBA, NRB, MW) | 0.8662 | 0.8572 | 0.8473 | 0.2933 | 4.8 | 1.9211 | 0.0043 | 97.1 | 0.00000 | 0.8662 | 0.2933 |
| M5*: log BB vs. (log (km/KAM), HBA, Ƥ) | 0.9087 | 0.9042 | 0.8994 | 0.4290 | 4.7 | 4.2636 | 0.2178 | 202.4 | 0.00000 | 0.9087 | 0.4290 |
| M11*: log BB* vs. (log (km/KAM), HBA, Ƥ) | 0.8656 | 0.8590 | 0.8513 | 0.2858 | 4.7 | 1.9212 | 0.0042 | 131.0 | 0.00000 | 0.8656 | 0.2858 |
| M12*: log BB* vs. (log (km/KAM), HBA, MW) | 0.8661 | 0.8595 | 0.8516 | 0.2852 | 4.1 | 1.9212 | 0.0042 | 131.5 | 0.00000 | 0.8515 | 0.2852 |
Publisher’s Note: MDPI stays neutral with regard to jurisdictional claims in published maps and institutional affiliations. |
© 2022 by the authors. Licensee MDPI, Basel, Switzerland. This article is an open access article distributed under the terms and conditions of the Creative Commons Attribution (CC BY) license (https://creativecommons.org/licenses/by/4.0/).
Share and Cite
Janicka, M.; Śliwińska, A.; Sztanke, M.; Sztanke, K. Combined Micellar Liquid Chromatography Technique and QSARs Modeling in Predicting the Blood–Brain Barrier Permeation of Heterocyclic Drug-like Compounds. Int. J. Mol. Sci. 2022, 23, 15887. https://doi.org/10.3390/ijms232415887
Janicka M, Śliwińska A, Sztanke M, Sztanke K. Combined Micellar Liquid Chromatography Technique and QSARs Modeling in Predicting the Blood–Brain Barrier Permeation of Heterocyclic Drug-like Compounds. International Journal of Molecular Sciences. 2022; 23(24):15887. https://doi.org/10.3390/ijms232415887
Chicago/Turabian StyleJanicka, Małgorzata, Anna Śliwińska, Małgorzata Sztanke, and Krzysztof Sztanke. 2022. "Combined Micellar Liquid Chromatography Technique and QSARs Modeling in Predicting the Blood–Brain Barrier Permeation of Heterocyclic Drug-like Compounds" International Journal of Molecular Sciences 23, no. 24: 15887. https://doi.org/10.3390/ijms232415887
APA StyleJanicka, M., Śliwińska, A., Sztanke, M., & Sztanke, K. (2022). Combined Micellar Liquid Chromatography Technique and QSARs Modeling in Predicting the Blood–Brain Barrier Permeation of Heterocyclic Drug-like Compounds. International Journal of Molecular Sciences, 23(24), 15887. https://doi.org/10.3390/ijms232415887