Article

OSCA Genes in Bread Wheat: Molecular Characterization, Expression Profiling, and Interaction Analyses Indicated Their Diverse Roles during Development and Stress Response

1
Department of Botany, Panjab University, Chandigarh 160014, India
2
Department of Biology, The University of Western Ontario, London, ON N6A 3K7, Canada
3
Department of Biotechnology, Panjab University, Chandigarh 160014, India
*
Author to whom correspondence should be addressed.
Current Address: National Institute of Plant Genome Research, New Delhi 110067, India.
Int. J. Mol. Sci. 2022, 23(23), 14867; https://doi.org/10.3390/ijms232314867
Submission received: 24 October 2022 / Revised: 20 November 2022 / Accepted: 25 November 2022 / Published: 28 November 2022
(This article belongs to the Special Issue Molecular Mechanisms of Plant Defense against Abiotic Stress)

Abstract

:
The hyperosmolality-gated calcium-permeable channels (OSCA) are pore-forming transmembrane proteins that function as osmosensors during various plant developmental processes and stress responses. In our analysis, through in silico approaches, a total of 42 OSCA genes are identified in the Triticum aestivum genome. A phylogenetic analysis reveals the close clustering of the OSCA proteins of Arabidopsis thaliana, Oryza sativa, and T. aestivum in all the clades, suggesting their origin before the divergence of dicots and monocots. Furthermore, evolutionary analyses suggest the role of segmental and tandem duplication events (Des) and purifying selection pressure in the expansion of the OSCA gene family in T. aestivum. Expression profiling in various tissue developmental stages and under abiotic and biotic stress treatments reveals the probable functioning of OSCA genes in plant development and the stress response in T. aestivum. In addition, protein–protein and protein–chemical interactions reveal that OSCA proteins might play a putative role in Ca2+-mediated developmental processes and adaptive responses. The miRNA interaction analysis strengthens the evidence for their functioning in various biological processes and stress-induced signaling cascades. The current study could provide a foundation for the functional characterization of TaOSCA genes in future studies.

1. Introduction

Plants on Earth face several adverse environmental conditions throughout their lives and respond to them by adopting various strategies, such as the sensing and decoding of signals, which in turn initiate the downstream signaling cascades and expression of several stress-responsive genes [1,2]. Calcium signaling is one of the important phenomena that occur in plants and coordinates numerous developmental processes and stress responses. Cytosolic calcium ion (Ca2+) concentration levels usually remain in the range of 100–200 nanomolar (nM) during normal conditions [3]. However, they undergo a signal-specific transient rise during antagonistic environmental circumstances, including osmotic stress, which is known as the “Ca2+ signature” [2]. This Ca2+ signature is usually decoded by specific Ca2+ binding or sensor proteins that ultimately initiate the stress-related signaling pathways [4]. The cytosolic Ca2+ concentration is maintained by the simultaneous functions of three types of Ca2+ transporters, known as channels, exchangers, and pumps [5,6].
The hyperosmolality-gated calcium-permeable channels (OSCAs) are the membrane-localized Ca2+-permeable channels involved in the influx of Ca2+ from the apoplast to the cytoplasm. They are usually activated in response to hyper-osmotic conditions, dehydration, and mechanical stress in plants [7,8,9]. Similar Ca2+-permeable channels work as osmosensors in animals and bacteria [10,11]. The structural configuration has exhibited the occurrence of a conserved functional domain, i.e., DUF221 (Pfam accession: 02714) in OSCA proteins, which plays an important role in osmotic adjustment [12,13].
OSCA genes have been identified in various plant species, including Arabidopsis thaliana (15 genes); Oryza sativa L. Japonica, Oryza sativa L. ssp. Indica, and Oryza brachyantha (11 genes); Oryza glaberrima (12 genes); Pyrus bretschneideri (16 genes); Vigna radiata (13 genes); Zea mays (12 genes); Gossypium hirsutum (35 genes); Gossypium arboretum (21 genes); Gossypium raimondii (22 genes); and Glycine max (21 genes) [14,15,16,17,18,19,20]. Several studies have suggested the role of OSCA genes in various plant developmental processes and stress responses. For instance, Yaun et al. characterized OSCA1 in A. thaliana and revealed that it mediates an osmotic-stress-evoked Ca2+ concentration increase and plays a crucial role in osmosensing [14]. ZmOSCA2.4 in Z. mays provided drought stress tolerance in A. thaliana [21]. Another report suggested that the OsOSCA genes of O. sativa performed redundant functioning in Ca2+ signaling induced in response to hyperosmolality and salt stresses [22,23]. The GhOSCA1.1 of G. hirsutum enhances salt and drought resistance by modulating the activity of antioxidant enzymes [19]. Further, the role of OSCA1.3 and OSCA1.7 in Arabidopsis has been established in pathogen-associated molecular patterns (PAMPs)-triggered stomatal immunity [24,25]. These studies revealed the importance of OSCA channels in plants.
Due to the immense importance of OSCA genes in plants, there was a grave need for an inclusive characterization of the genes in an important staple food crop, T. aestivum L. Herein, a total of 42 TaOSCA genes were identified following various in silico approaches in the T. aestivum genome, which were used for further analyses, including duplication event, Ka/Ks, phylogenetic, gene, and protein structure analysis, using various bioinformatic approaches. To gain insight into the roles of TaOSCA genes, an expression analysis was carried out in various tissue developmental stages and biotic and abiotic stress conditions using high-throughput RNA seq data and qRT-PCR. Furthermore, protein–protein, protein–chemical interaction, and miRNA interaction analyses were performed to explore their diverse roles. This work could provide new directions for the functional characterization of TaOSCA proteins in future studies.

2. Results

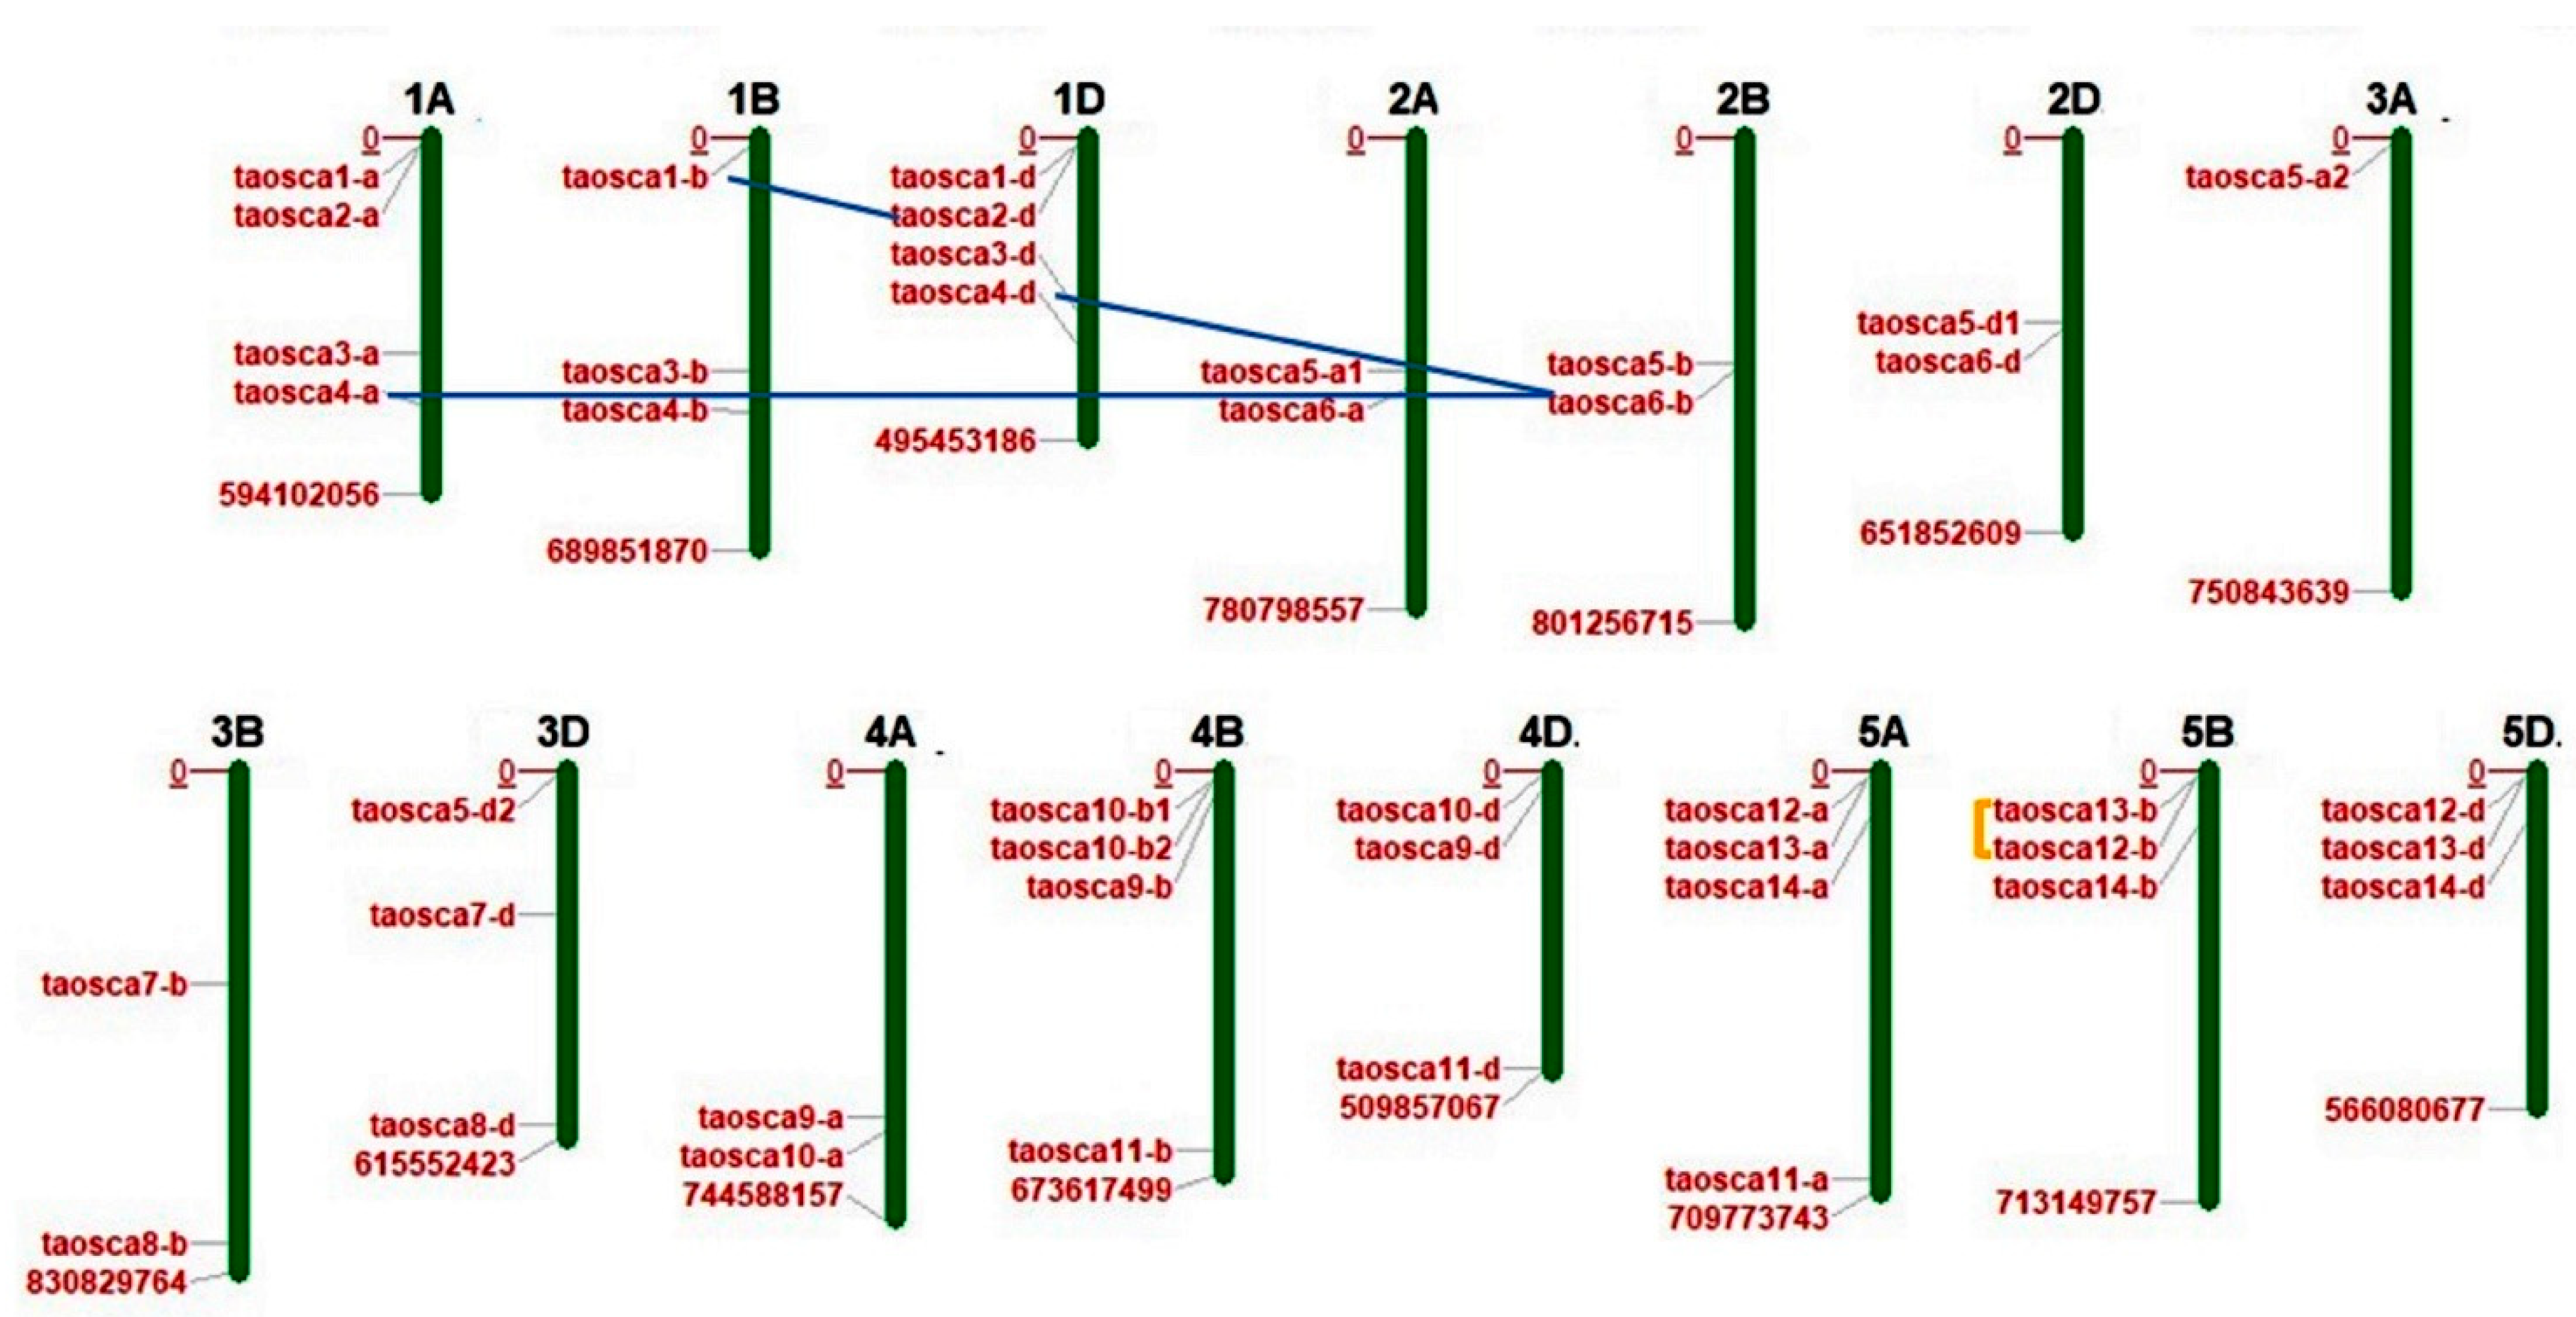
2.1. In Silico Identification, Chromosomal Distribution, and Protein Characterization

A total of 42 TaOSCA genes were identified in the T. aestivum genome by performing a BLAST search using the already reported 15 and 11 OSCA sequences of A. thaliana and O. sativa, respectively. The identified TaOSCA genes could assemble into 14 homoeologous groups based on sequence similarity (≥90%) among them and their subgenomic (A, B and D) locations. Then, their nomenclature was conducted following the standard wheat symbolization protocol (Table S1). The 11 homoeologous groups, including OSCA1, OSCA3-6, and OSCA9-14, consisted of genes from each A, B, and D subgenome. However, three homoeologous groups carried genes from only two subgenomes. For instance, the homoeologous group OSCA2 consisted of genes from the A and D subgenomes, while the OSCA7 and OSCA8 homoeologous groups consisted of genes from the B and D subgenomes. The highest number of TaOSCA genes were derived from subgenome D (15), followed by subgenome B (14) and subgenome A (13). A chromosomal distribution analysis showed that all the identified TaOSCA genes were scattered on 15/21 chromosomes, including 1A, 1B, 1D, 2A, 2B, 2D, 3A, 3B, 3D, 4A, 4B, 4D, 5A, 5B, and 5D. A maximum number of four genes were found on chromosomes 1A, 1D, 4B, and 5A each, while a minimum of one gene was found on chromosome 3A (Table S2; Figure 1).
The in silico protein characterizations revealed the various important features of TaOSCA proteins. The peptide length of TaOSCA proteins varied from 469 to 804 amino acid (aa) residues (Table S2). The longest protein was TaOSCA12-A, while the shortest was TaOSCA10-B2. Moreover, the molecular weight and isoelectric point of TaOSCA proteins ranged from 53.7 to 93.4 kDa and 6.59 to 9.77, respectively (Table S2). Among all the TaOSCA proteins, the heaviest and lightest proteins were TaOSCA3-A and TaOSCA10-B2, respectively. Out of 42 OSCA proteins, the pI of 40 proteins was more than 7, while two proteins, TaOSCA6-B and TaOSCA6-D, had less than 7. The subcellular localization for all the TaOSCA proteins was predicted on the plasma membrane. None of the TaOSCA proteins consisted of any kind of signal peptide. However, the number of transmembrane helices ranged from five to eleven (Table S2).

2.2. Prediction of Duplication Events and Ka/Ks Analysis

The paralogous genes originated at the time of duplication events led to the expansion of gene families. To understand the expanded progression of the TaOSCA gene family, the duplication events were analyzed. A total of three duplication events were predicted, which were segregated into two segmental duplication events (SDEs) (TaOSCA4-A-TaOSCA6-B and TaOSCA1-B-TaOSCA2-D) and one tandem duplication event (TDE) (TaOSCA12-B-TaOSCA13-B) in T. aestivum (Table S3; Figure 1).
The Ka/Ks ratio was calculated to examine the type of selection pressure which affected the duplicated gene pairs during the evolution. A Ka/Ks ratio of less than one value suggests a negative selection (purifying), while a value of more than one shows the presence of positive selection pressure. In our analysis, the Ka/Ks ratio of all the identified duplicated gene pairs was less than one, which suggested that they had endured negative or purifying selection pressure. In addition to this, the time of divergence was also estimated, which was in a range from 13.0 to 32.9 MYA (Table 1).
By performing Tajima’s relative rate test, it was analyzed that all the duplicated gene pairs had a non-significant χ2-value at p > 0.05 (Table 2). According to Tajima, p-values of more than 0.05 point towards the acceptance of the molecular clock hypothesis, which signifies the equal rate of evolution among all the duplicated gene pairs [26].

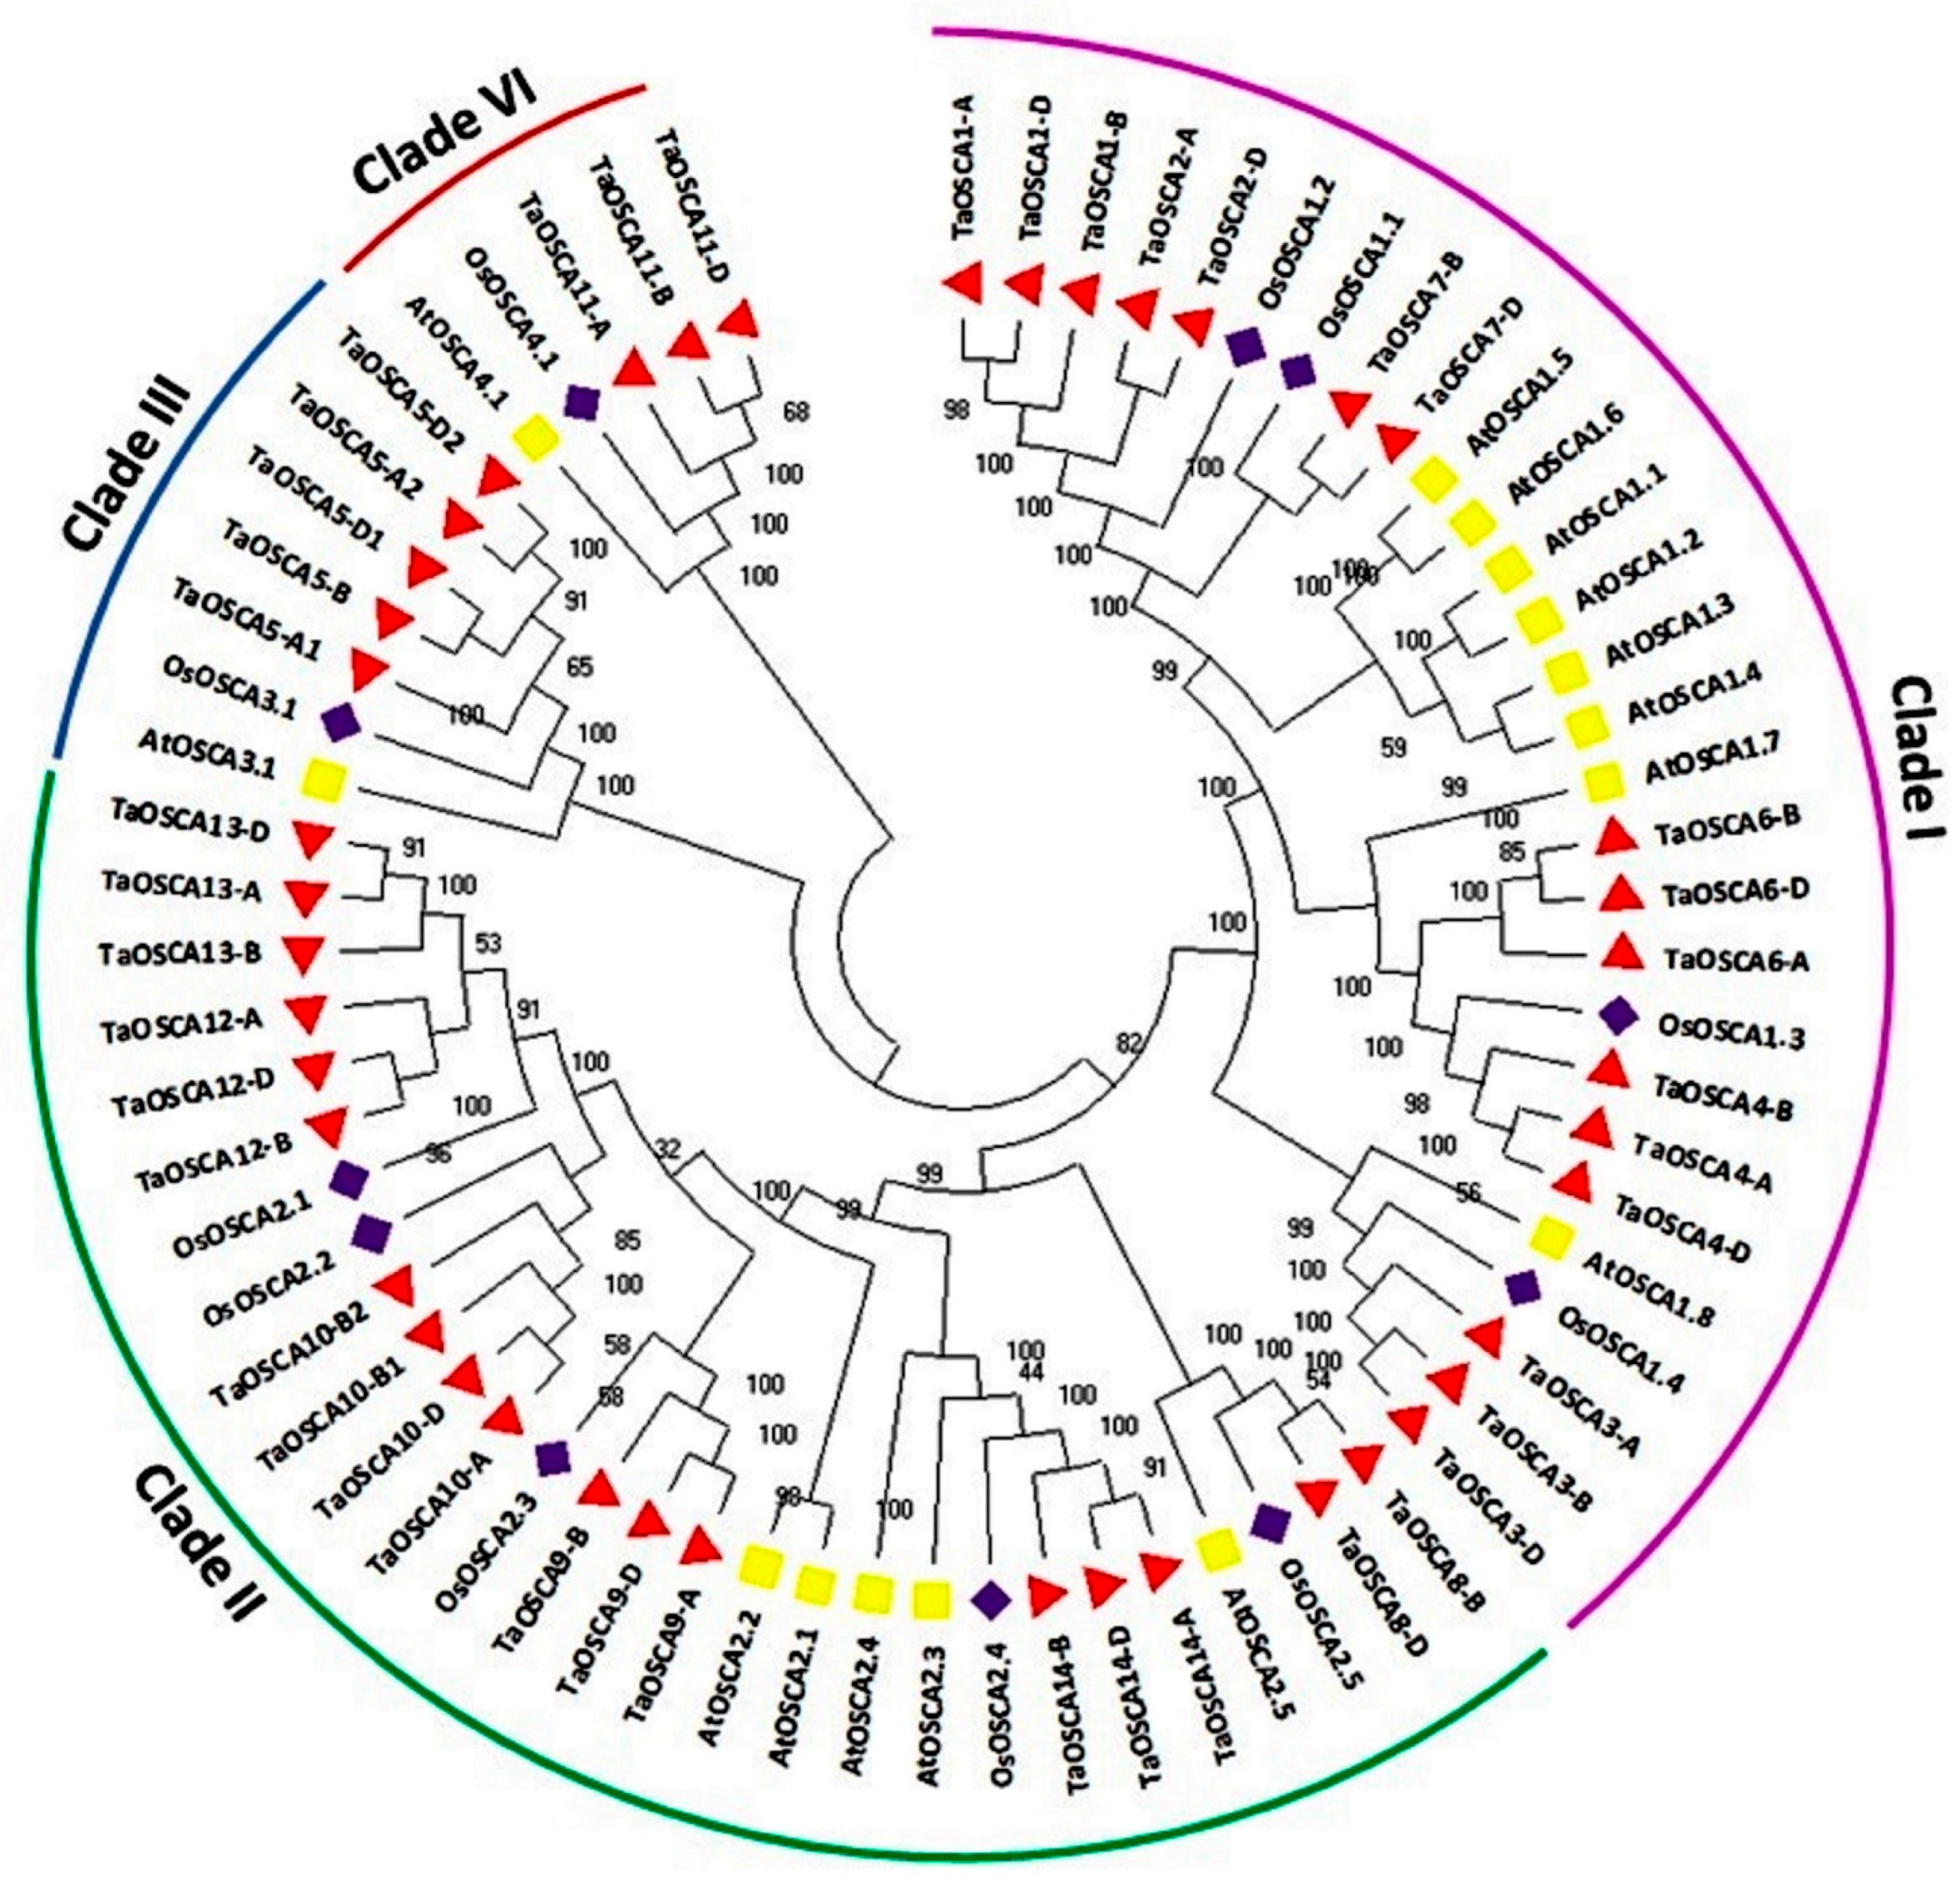
2.3. Phylogenetic Analysis

To gain insight into the evolutionary connections of the OSCA proteins among A. thaliana, O. sativa, and T. aestivum, the phylogenetic tree was generated using full-length OSCA protein sequences. In the phylogenetic tree, these OSCA proteins were tightly clustered into four clades named I, II, III, and IV. Clade I and clade II consisted of 28 OSCA proteins, while clade III and clade IV consisted of 7 and 5 OSCA proteins, respectively (Figure 2). A total of eight AtOSCAs, four OsOSCAs, and sixteen TaOSCAs were clustered in clade I, while clade II consisted of five OSCA proteins each from A. thaliana and O. sativa and eighteen OSCA proteins from T. aestivum. One AtOSCA and one OsOSCA were present in each of the clades III and IV, while a total of five and three TaOSCA proteins were clustered in clades III and IV, respectively (Figure 2).
All the homologous genes of T. aestivum, for example, TaOSCA13-A, TaOSCA13-B, and TaOSCA13-D; TaOSCA1-A, TaOSCA1-B, and TaOSCA1-D, etc., were closely clustered to each other in the phylogenetic tree. In addition to this, all the identified paralogous genes of T. aestivum were also clustered nearby, for instance, TaOSCA4-A-TaOSCA6B, TaOSCA12-B-TaOSCA13, and TaOSCA1-B-TaOSCA2-D, etc. (Figure 2).

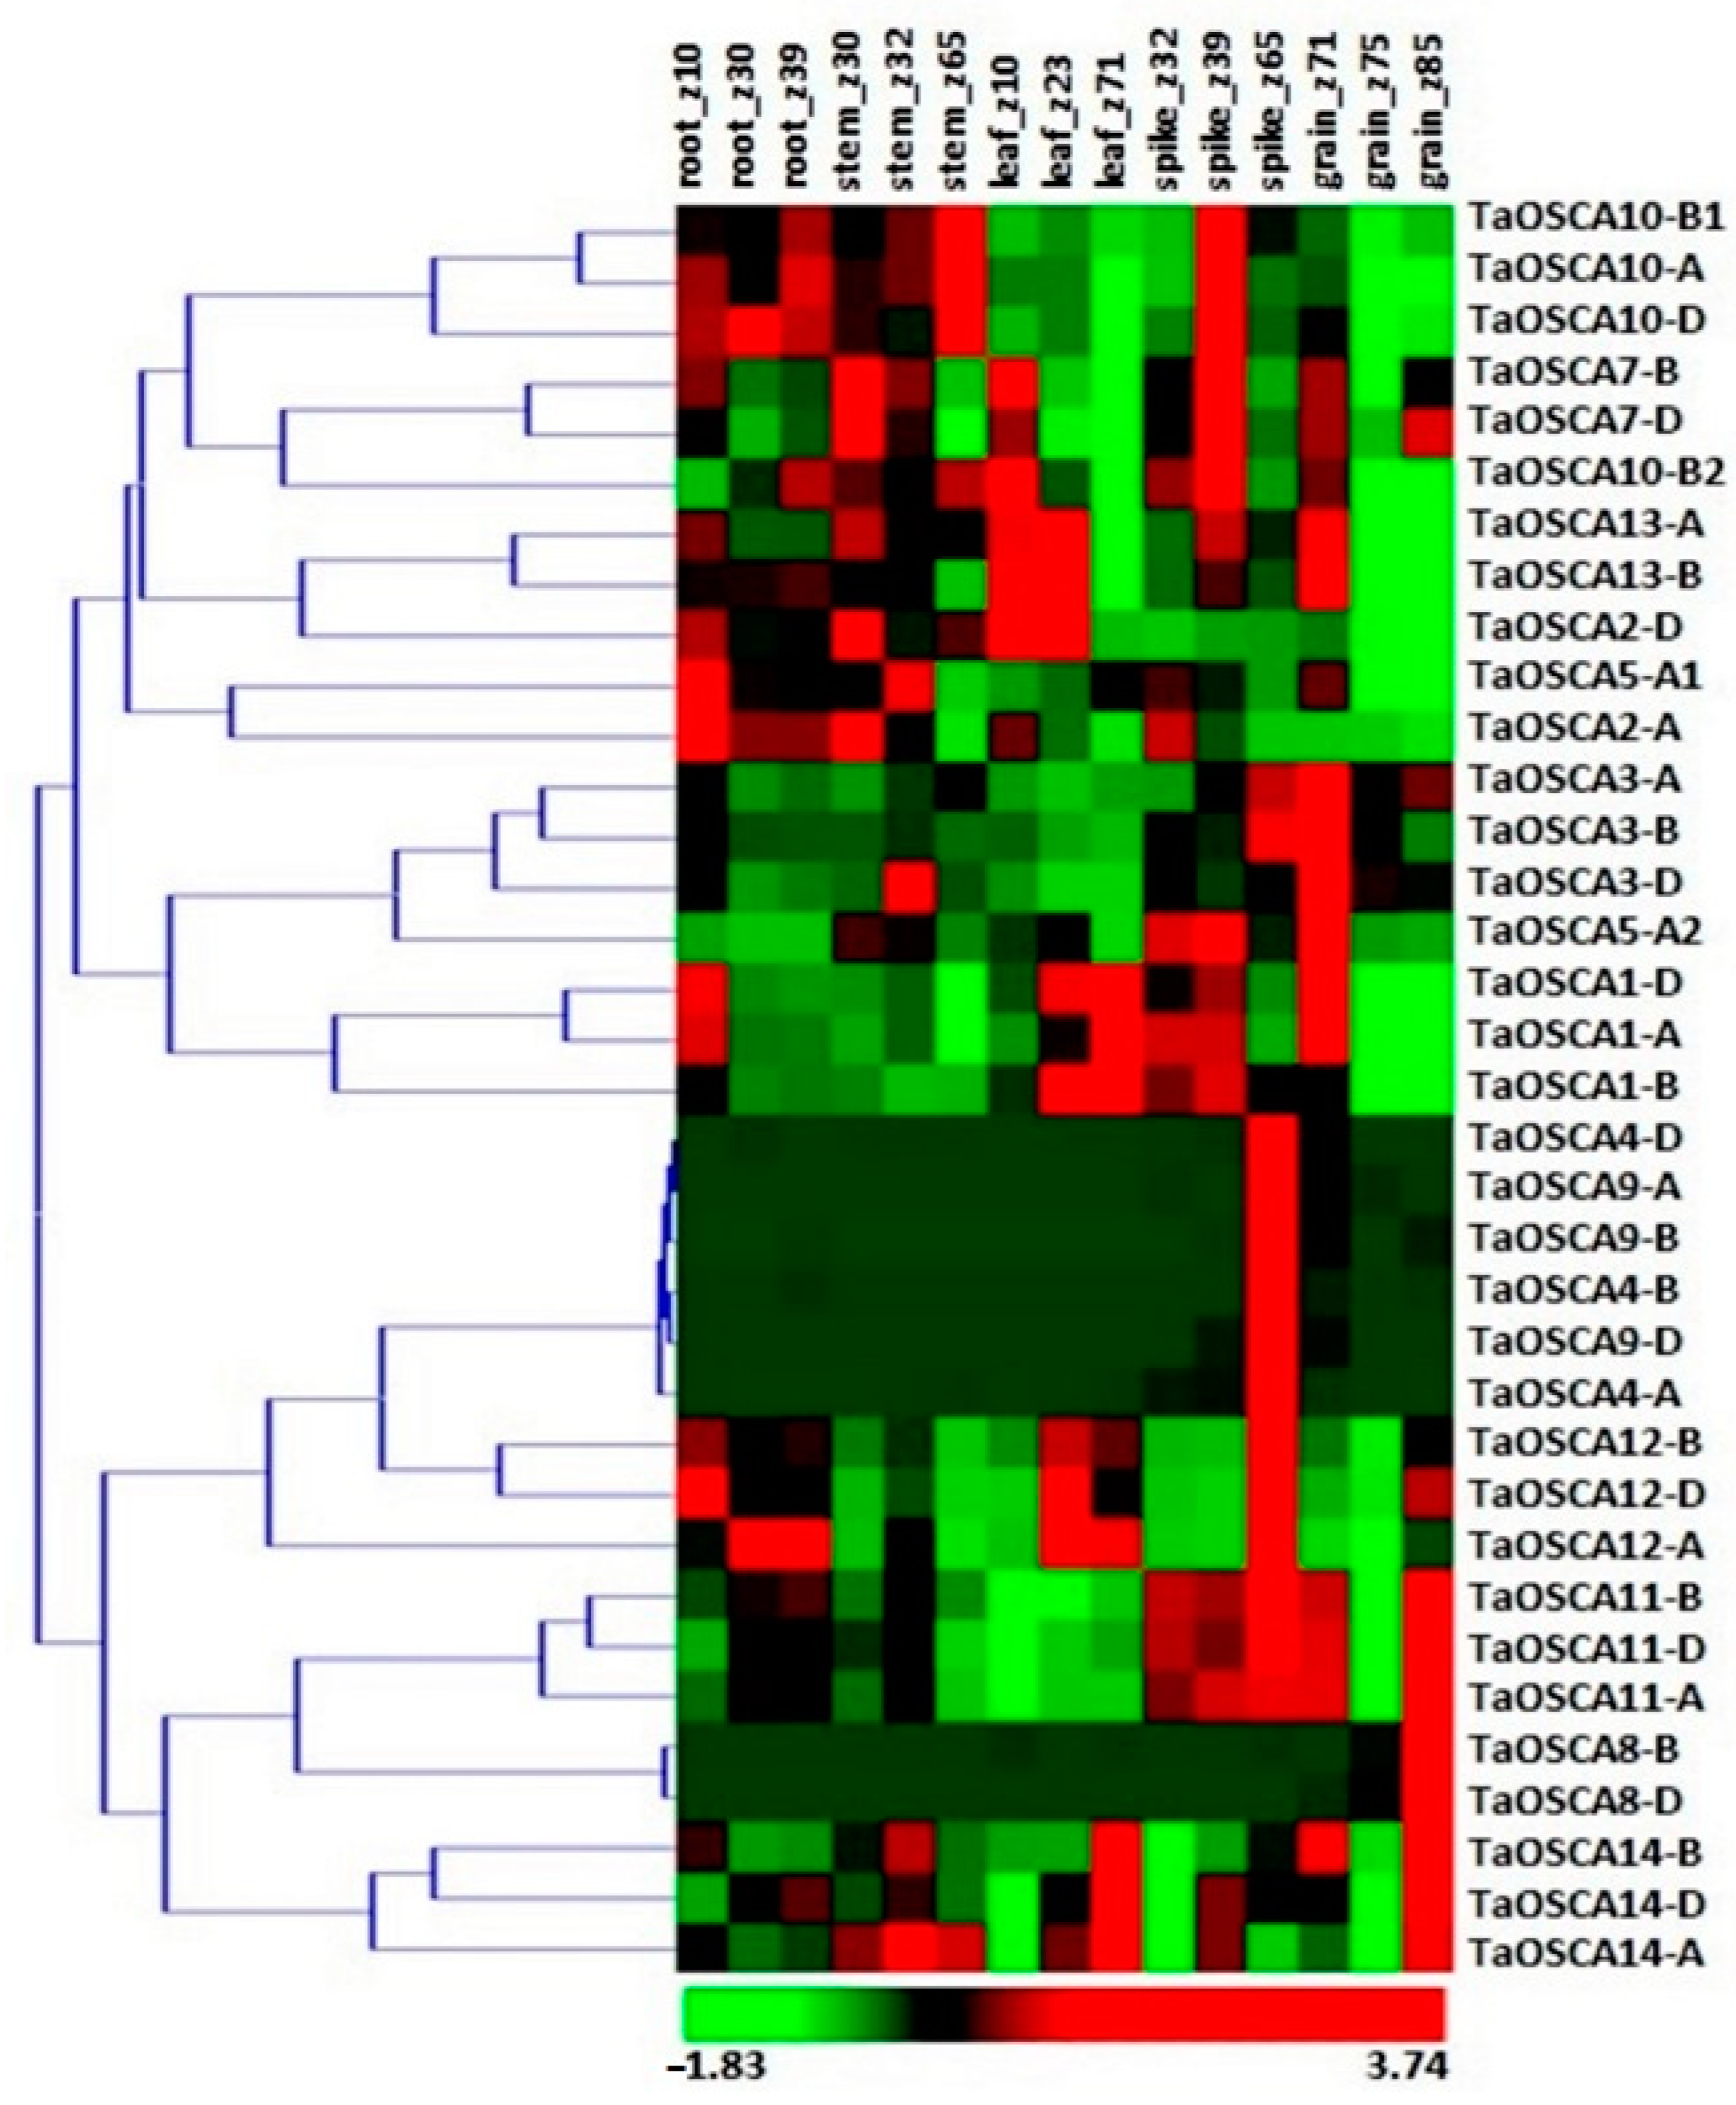
2.4. Expression Profiling of TaOSCA Genes in Tissue Developmental Stages

We analyzed the expression patterns of TaOSCA genes in three developmental stages of five tissues, including root_z10, root_z30, root_z39, stem_z30, stem_z32, stem_z65, leaf_z10, leaf_z23, leaf_z71, spike_z32, spike_z39, spike_z65, grain_z71, grain_z75, and grain_z85, using available high-throughput RNA-seq data [27,28]. Only those TaOSCA genes were chosen for further analysis which exhibited ≥2 FPKM values in at least one tissue development stage. Some of the TaOSCA genes showed specifically higher expression in the specific developmental stages of root, shoot, leaf, spike, and grain tissues (Figure 3). For instance, TaOSCA1-A, TaOSCA1-D, TaOSCA7-B, and TaOSCA7-D exhibited significant expression levels in almost all the tissue developmental stages. TaOSCA1-A and TaOSCA1-D were found to be highly expressed in grain_z71; leaf_z71; root_z10; leaf_z23; spike_z32 and spike_z39; and stem_z32. TaOSCA7-B and TaOSCA7-D showed higher expression levels in the early stages of roots, stems, leaves, spikes, and all the stages of grains. Moreover, some genes, such as TaOSCA4-D, TaOSCA4-A, TaOSCA4-B, and TaOSCA8-B, etc., exhibited no or less expression in tissue developmental stages (Figure 3).

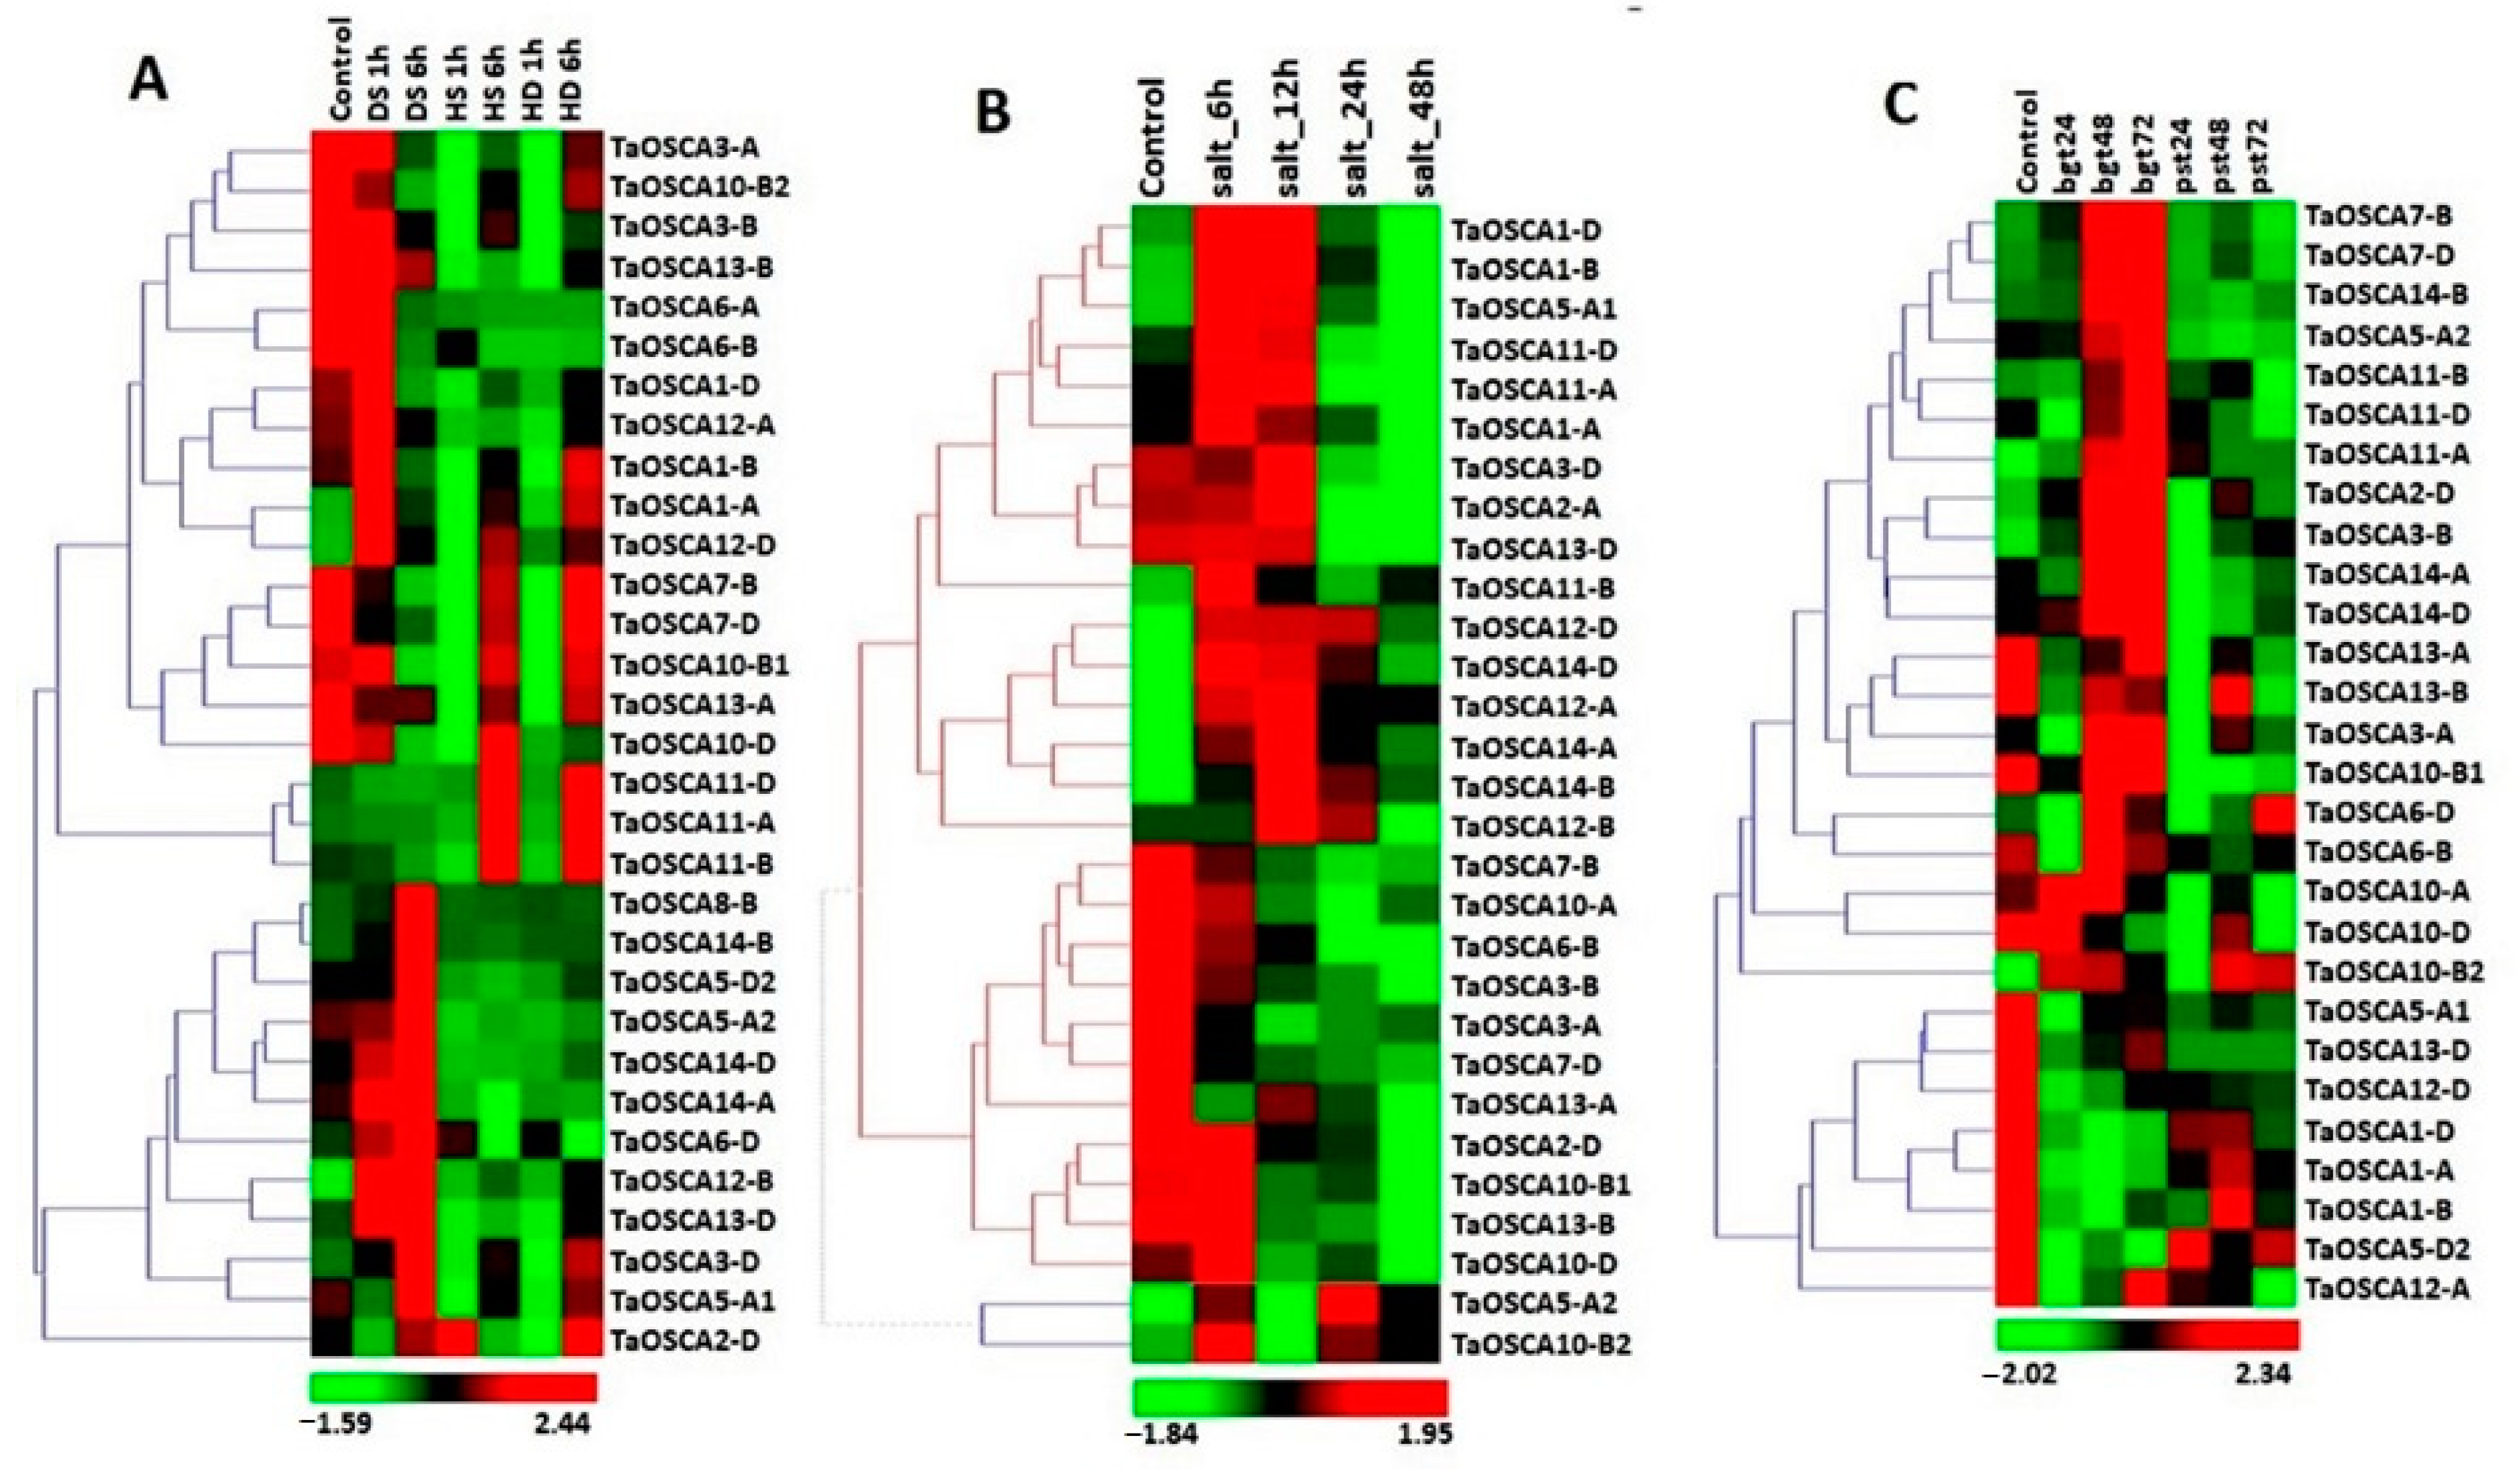
2.5. Expression Profiling of TaOSCA Genes in Abiotic Stresses

To understand the putative role of TaOSCA genes in abiotic stress responses, their expression patterns were analyzed under heat (HS), drought (DS), combined heat–drought (HD), and salt stress using available high-throughput RNA sequence data [29,30]. Those TaOSCA genes were selected for analysis which showed more than two-fold down- or upregulation in at least one of the abiotic stress conditions. This criterion led to the identification of a total of 31 TaOSCA genes, which displayed differential expression in response to the DS, HS, and HD stress conditions (Figure 4A). The majority of TaOSCA genes were found to be upregulated after DS treatments, especially after DS 1 h. However, some genes, such as TaOSCA3-D, TaOSCA11-B, TaOSCA11-D, TaOSCA10-B1, etc., showed upregulation at the later stage (6 h) of HS and HD. However, only a few TaOSCA genes, such as TaOSCA6-D and TaOSCA12-B, etc., exhibited upregulation at an early hour (1 h) of the HS and HD conditions. TaOSCA12-B displayed significant upregulation after every hour of the DS, HS, and HD treatments (Figure 4A) and showed maximum expression (6-fold) after 6 h of DS. Furthermore, TaOSCA8-B was highly upregulated (69-fold) at DS 6 h as compared to the rest of the genes. The genes TaOSCA3-A, TaOSCA3-B, TaOSCA7-B, TaOSCA10-B2, TaOSCA10-D, and TaOSCA13-A were downregulated after each hour of the DS, HS, and HD treatments (Figure 4A).
Out of 42 genes, 29 TaOSCA genes showed differential expression in response to salt stress. The majority of the TaOSCA genes were found to be upregulated in the early hours of salt stress (Figure 4B). However, some genes, such as TaOSCA11-B, TaOSCA12-A, TaOSCA12-D, TaOSCA14-A, TaOSCA14-B, and TaOSCA14-D, were upregulated after 6, 12, 24, and 48 h of salt stress. Moreover, it was predicted that at 6, 24, and 48 h of salt stress, TaOSCA5-A2 would be highly upregulated (11, 18, and 9-fold), and at 12 h of salt stress, TaOSCA14-B would be highly upregulated (10-fold) as compared to other genes (Figure 4B). Some genes, such as TaOSCA2-D, TaOSCA3-A, TaOSCA3-B, TaOSCA6-B, TaOSCA7-B, TaOSCA7-D, TaOSCA10-A, TaOSCA13-A, and TaOSCA13-B, were down-regulated at each hour of salt stress.

2.6. Expression Profiling of TaOSCA Genes in Biotic Stresses

To determine whether the expression of TaOSCA genes was responsive to biotic stress, their expression was analyzed against two fungal pathogens, i.e., Blumeria graminis (bgt) and Puccinia striiformis (Pst), using high-throughput RNA seq data [31]. Out of 42, a total of 28 OSCA genes were differentially expressed after Bgt and Pst infestation (Figure 4C). The majority of OSCA genes were significantly upregulated after Bgt infestation, for instance, TaOSCA14-B, TaOSCA14-D, TaOSCA11-D, TaOSCA10-A, and TaOSCA10-B2, etc. However, a few genes, such as TaOSCA2-D, TaOSCA3-B, TaOSCA11-B, TaOSCA7-B, and TaOSCA7-D, etc., also exhibited upregulation at different hours of Pst infestation. The gene TaOSCA11-A was found to be differentially expressed at each hour of Bgt and Pst inoculation (Figure 4C). Furthermore, it was analyzed that some genes, such as TaOSCA1-A, TaOSCA1-B, TaOSCA1-D, TaOSCA5-A1, TaOSCA10-B1, TaOSCA10-D, TaOSCA12-D, TaOSAC13-B, and TaOSCA13-D, were downregulated after each hour of Bgt and Pst infestation.

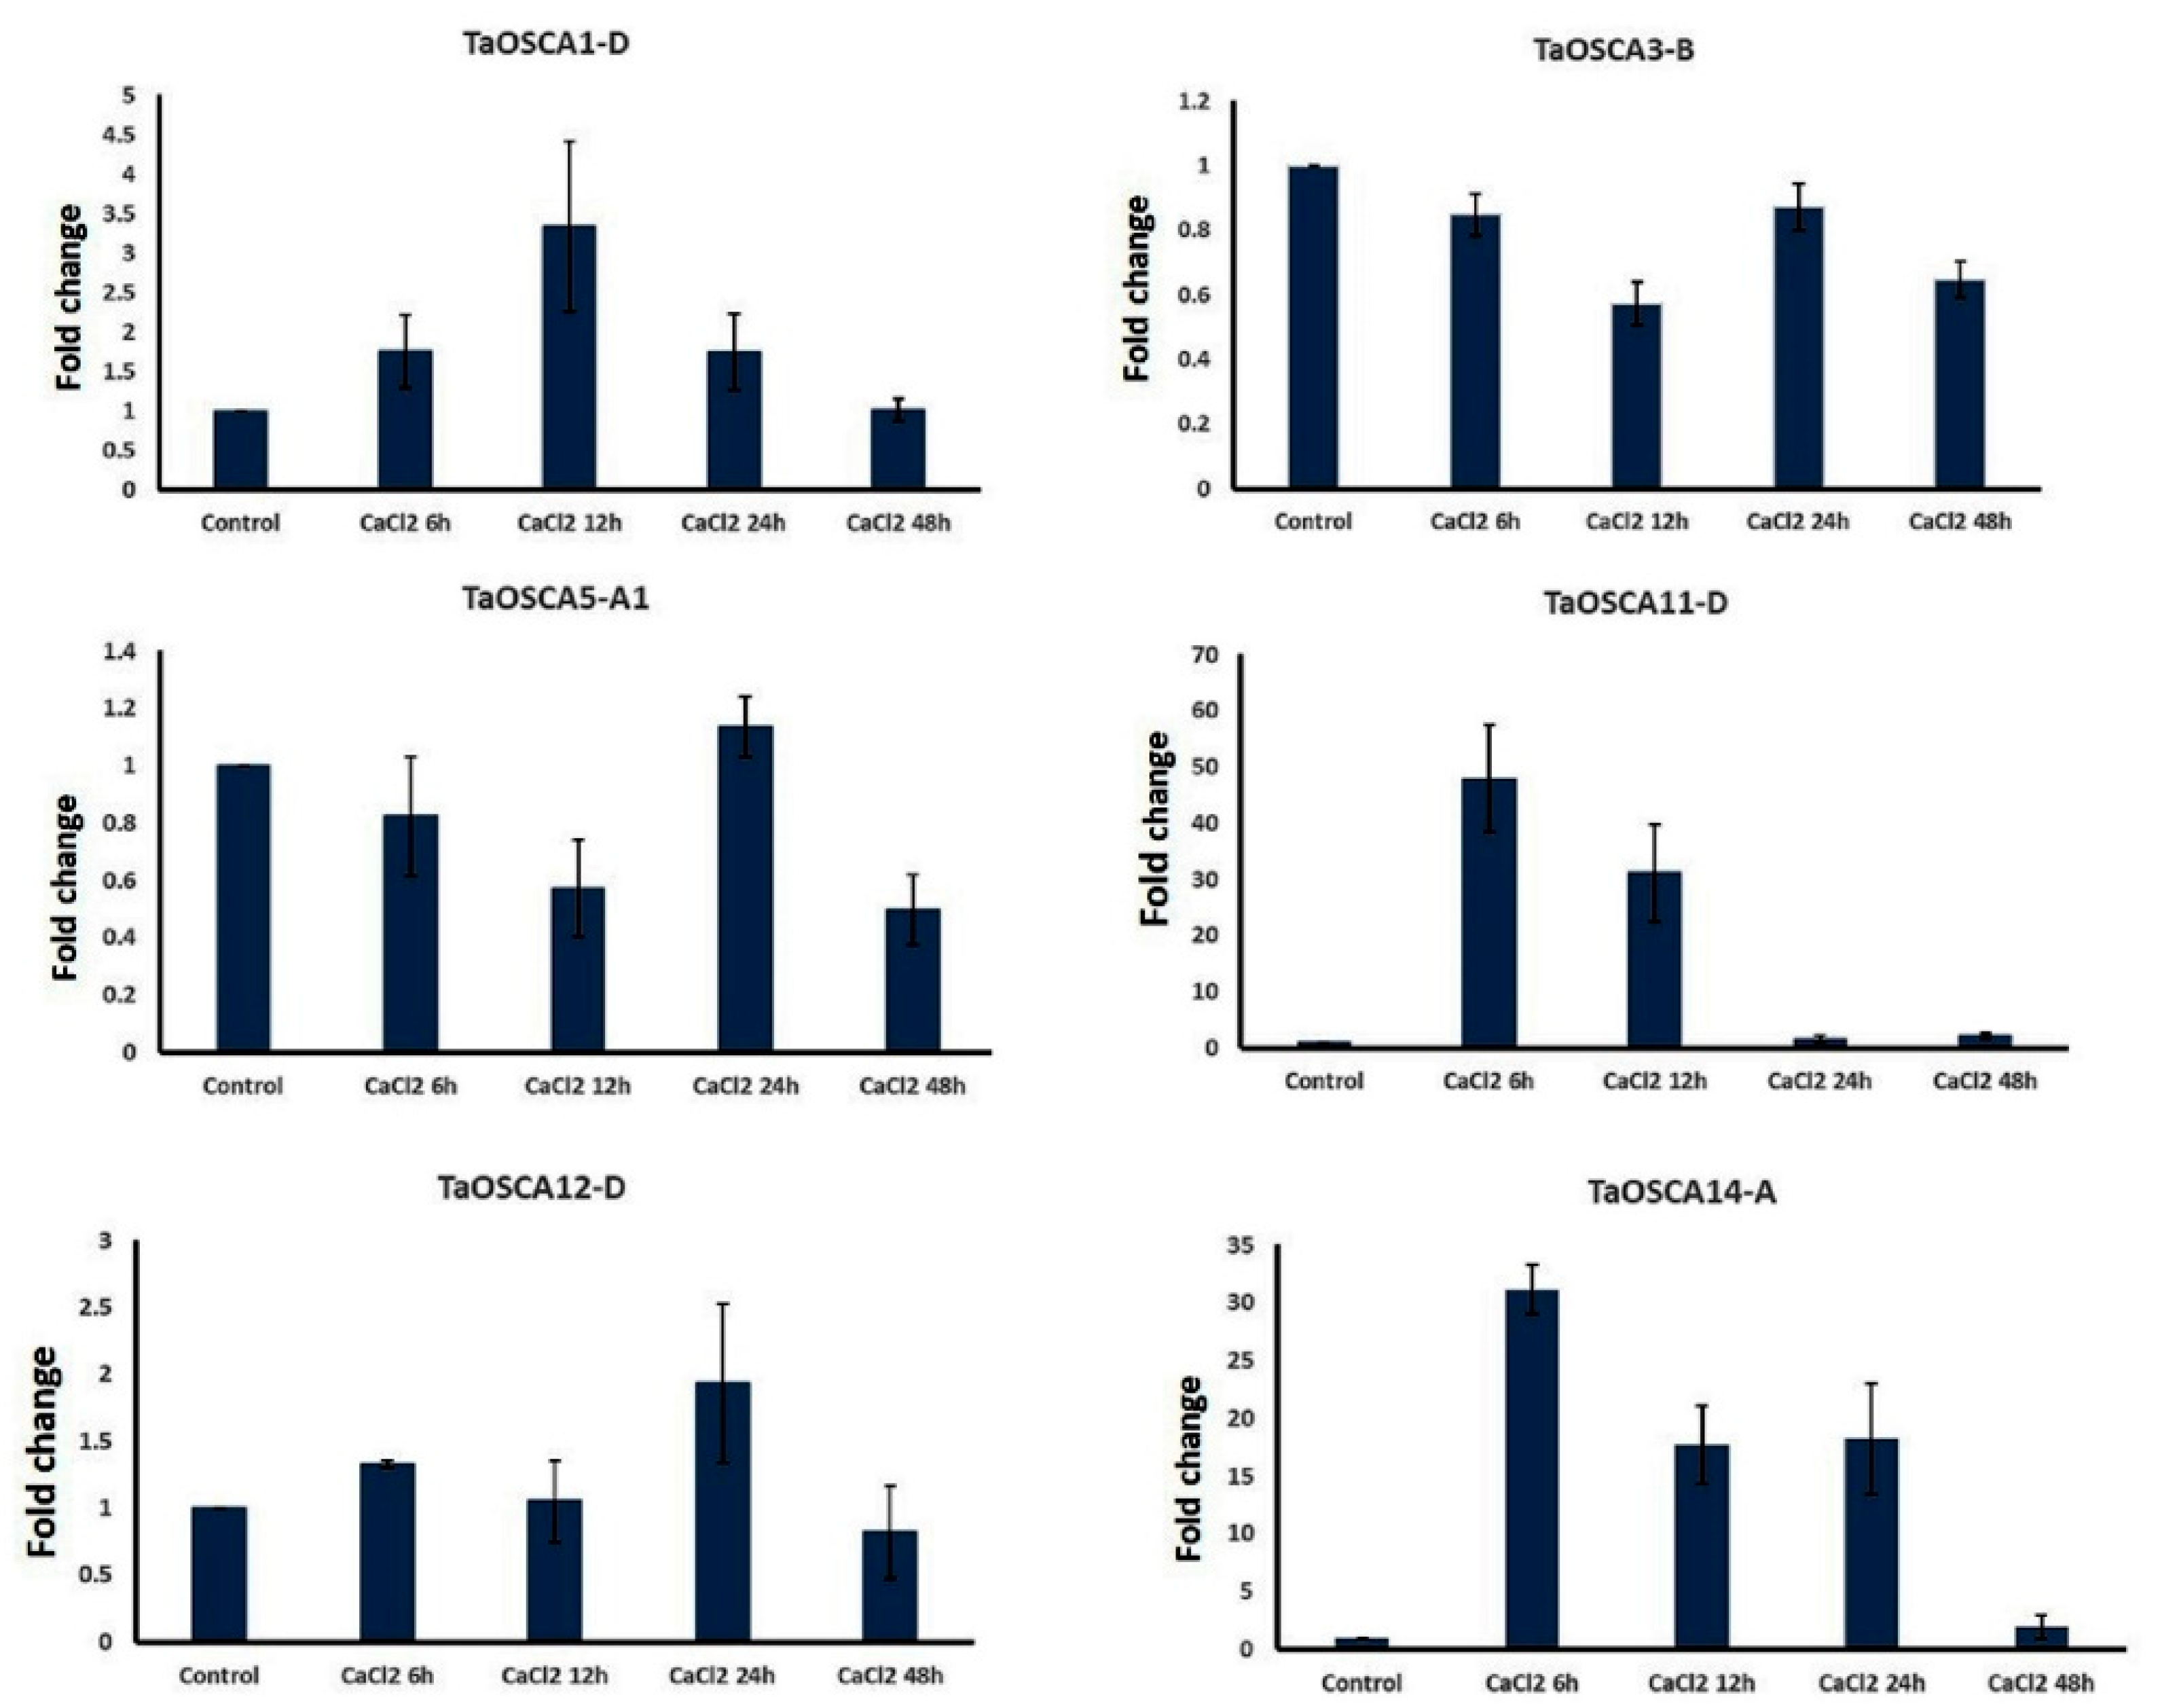
2.7. qRT-PCR Analysis under CaCl2 Treatment

Since the OSCAs are Ca2+-permeable channels and are involved in the import of Ca2+ in the cytoplasm of plant cells that ultimately leads to Ca2+ signaling [24,25], an expression analysis of six TaOSCA genes representing each phylogenetic clade (i.e., TaOSCA1-D, TaOSCA3-B, TaOSCA5-A1, TaOSCA11-D, TaOSCA12-D, and TaOSCA14-A) was performed after CaCl2 treatment using qRT-PCR (Table S4). The gene TaOSCA1-D showed upregulated expression at 12 h of CaCl2 treatment, and afterwards expression decreased (Figure 5). The gene TaOSCA3-B exhibited negligible expression at each hour of CaCl2 treatment. However, TaOSCA5-A1 and TaOSCA12-D were found to be upregulated at 24 h of CaCl2 treatment, while two genes, TaOSCA11-D and TaOSCA14-A, showed significant expression at the initial hour of CaCl2 treatment (Figure 5).

2.8. Co-Expression Analysis and Gene Ontology Mapping

To reveal the putative mechanisms of action of TaOSCAs, we performed the co-expression of TaOSCAs with other genes of T. aestivum using the expression data of tissue developmental stages and under biotic and abiotic stresses. During tissue development, a total of ten TaOSCA genes were found to be co-expressed with 49 transcripts (Table S5; Figure 6A). These co-expressed transcripts encoded serine/threonine-protein kinase, peroxidase 4-like, embryogenesis-associated protein, cyclin-dependent kinase, UDP-glucose 6-dehydrogenase 4-like, GATA transcription factor 20-like, and meiotic recombination protein, etc. The gene ontology (GO) mapping of the identified co-expressed transcripts revealed their putative roles in several biological processes, such as the oxidative photosynthetic carbon pathway (GO:0009854), glycosaminoglycan biosynthetic process (GO:0006024), diterpenoid biosynthetic process (GO:0016102), cellular lipid metabolic process (GO:0044255), pollen development (GO:0009555), seed development (GO:0048316), integral component of membrane (GO:0016021), and UDP-glucuronate biosynthetic process (GO:0006065), etc.
During drought and heat stresses, a total of 11 TaOSCA genes were co-expressed with 120 transcripts of T. aestivum (Table S5; Figure 6B). These transcripts encoded rho GTPase-activating protein 7-like isoform X3, calcium-dependent protein kinase 17, universal stress protein YxiE-like, probable aquaporin TIP3-2, auxin response factor 4, WRKY transcription factor 3, calcium uptake protein, and ABC transporter E family member 2, etc. The GO mapping of these transcripts showed that they are mainly involved in defense response (GO:0006952), response to stimulus (GO:0050896), protein kinase activity (GO:0004672), water transport (GO:0006833), water channel activity (GO:0015250), oxidoreductase activity (GO:0016491), signal transduction (GO:0007165), peptidyl-serine phosphorylation (GO:0018105), calcium ion binding (GO:0005509), and dGTPase activity (GO:0006203), etc.
In the presence of salt stress, a total of 26 TaOSCA genes showed co-expression with 116 transcripts of T. aestivum (Table S5; Figure 6C). These transcripts encoded ABC transporter G family member 16-like, calcium-transporting ATPase 5, serine/threonine protein phosphatase 2A, transcription factor SRM1-like, trans-cinnamate 4-monooxygenase, chaperone protein dnaJ 20, and ribulose-1,5 bisphosphate carboxylase/oxygenase large subunit N-methyltransferase, etc. The GO mapping suggested their role in the lignin metabolic process (GO:0009808), salicylate 1-monooxygenase activity (GO:0018658), L-glutamate transmembrane transport (GO:0015813), calcium ion transmembrane transport (GO:0070588), iron ion binding (GO:0005506), the response to photooxidative stress (GO:0080183), defense response (GO:0006952), ABC-type transporter activity (GO:0140359), electron transport chain (GO:0022900), and the cell surface receptor signaling pathway (GO:0007166), etc.
In the presence of biotic stress, a total of 11 TaOSCA genes were found to be co-expressed with the 84 transcripts of T. aestivum (Table S5; Figure 6D), which encoded disease resistance RPP13-like protein 4, chitinase CLP-like, disease resistance protein PIK6-NP-like, pathogenesis-related thaumatin-like protein 3.5, wall-associated receptor kinase 2-like isoform X1, calcium-binding protein 39-like, myb-related protein MYBAS1-like isoform X2, and E3 ubiquitin-protein ligase AIRP2-like, etc. The GO mapping suggested their probable functioning as hydrolase activity (GO:0016787), ncRNA processing (GO:0034470), catalytic complex (GO:1902494), intracellular signal transduction (GO:0035556), protein phosphorylation (GO:0006468), polysaccharide binding (GO:0030247), defence response to fungus (GO:0008843), metal ion binding (GO:0046872), and ubiquitin-protein ligase activity (GO:0061630), etc.

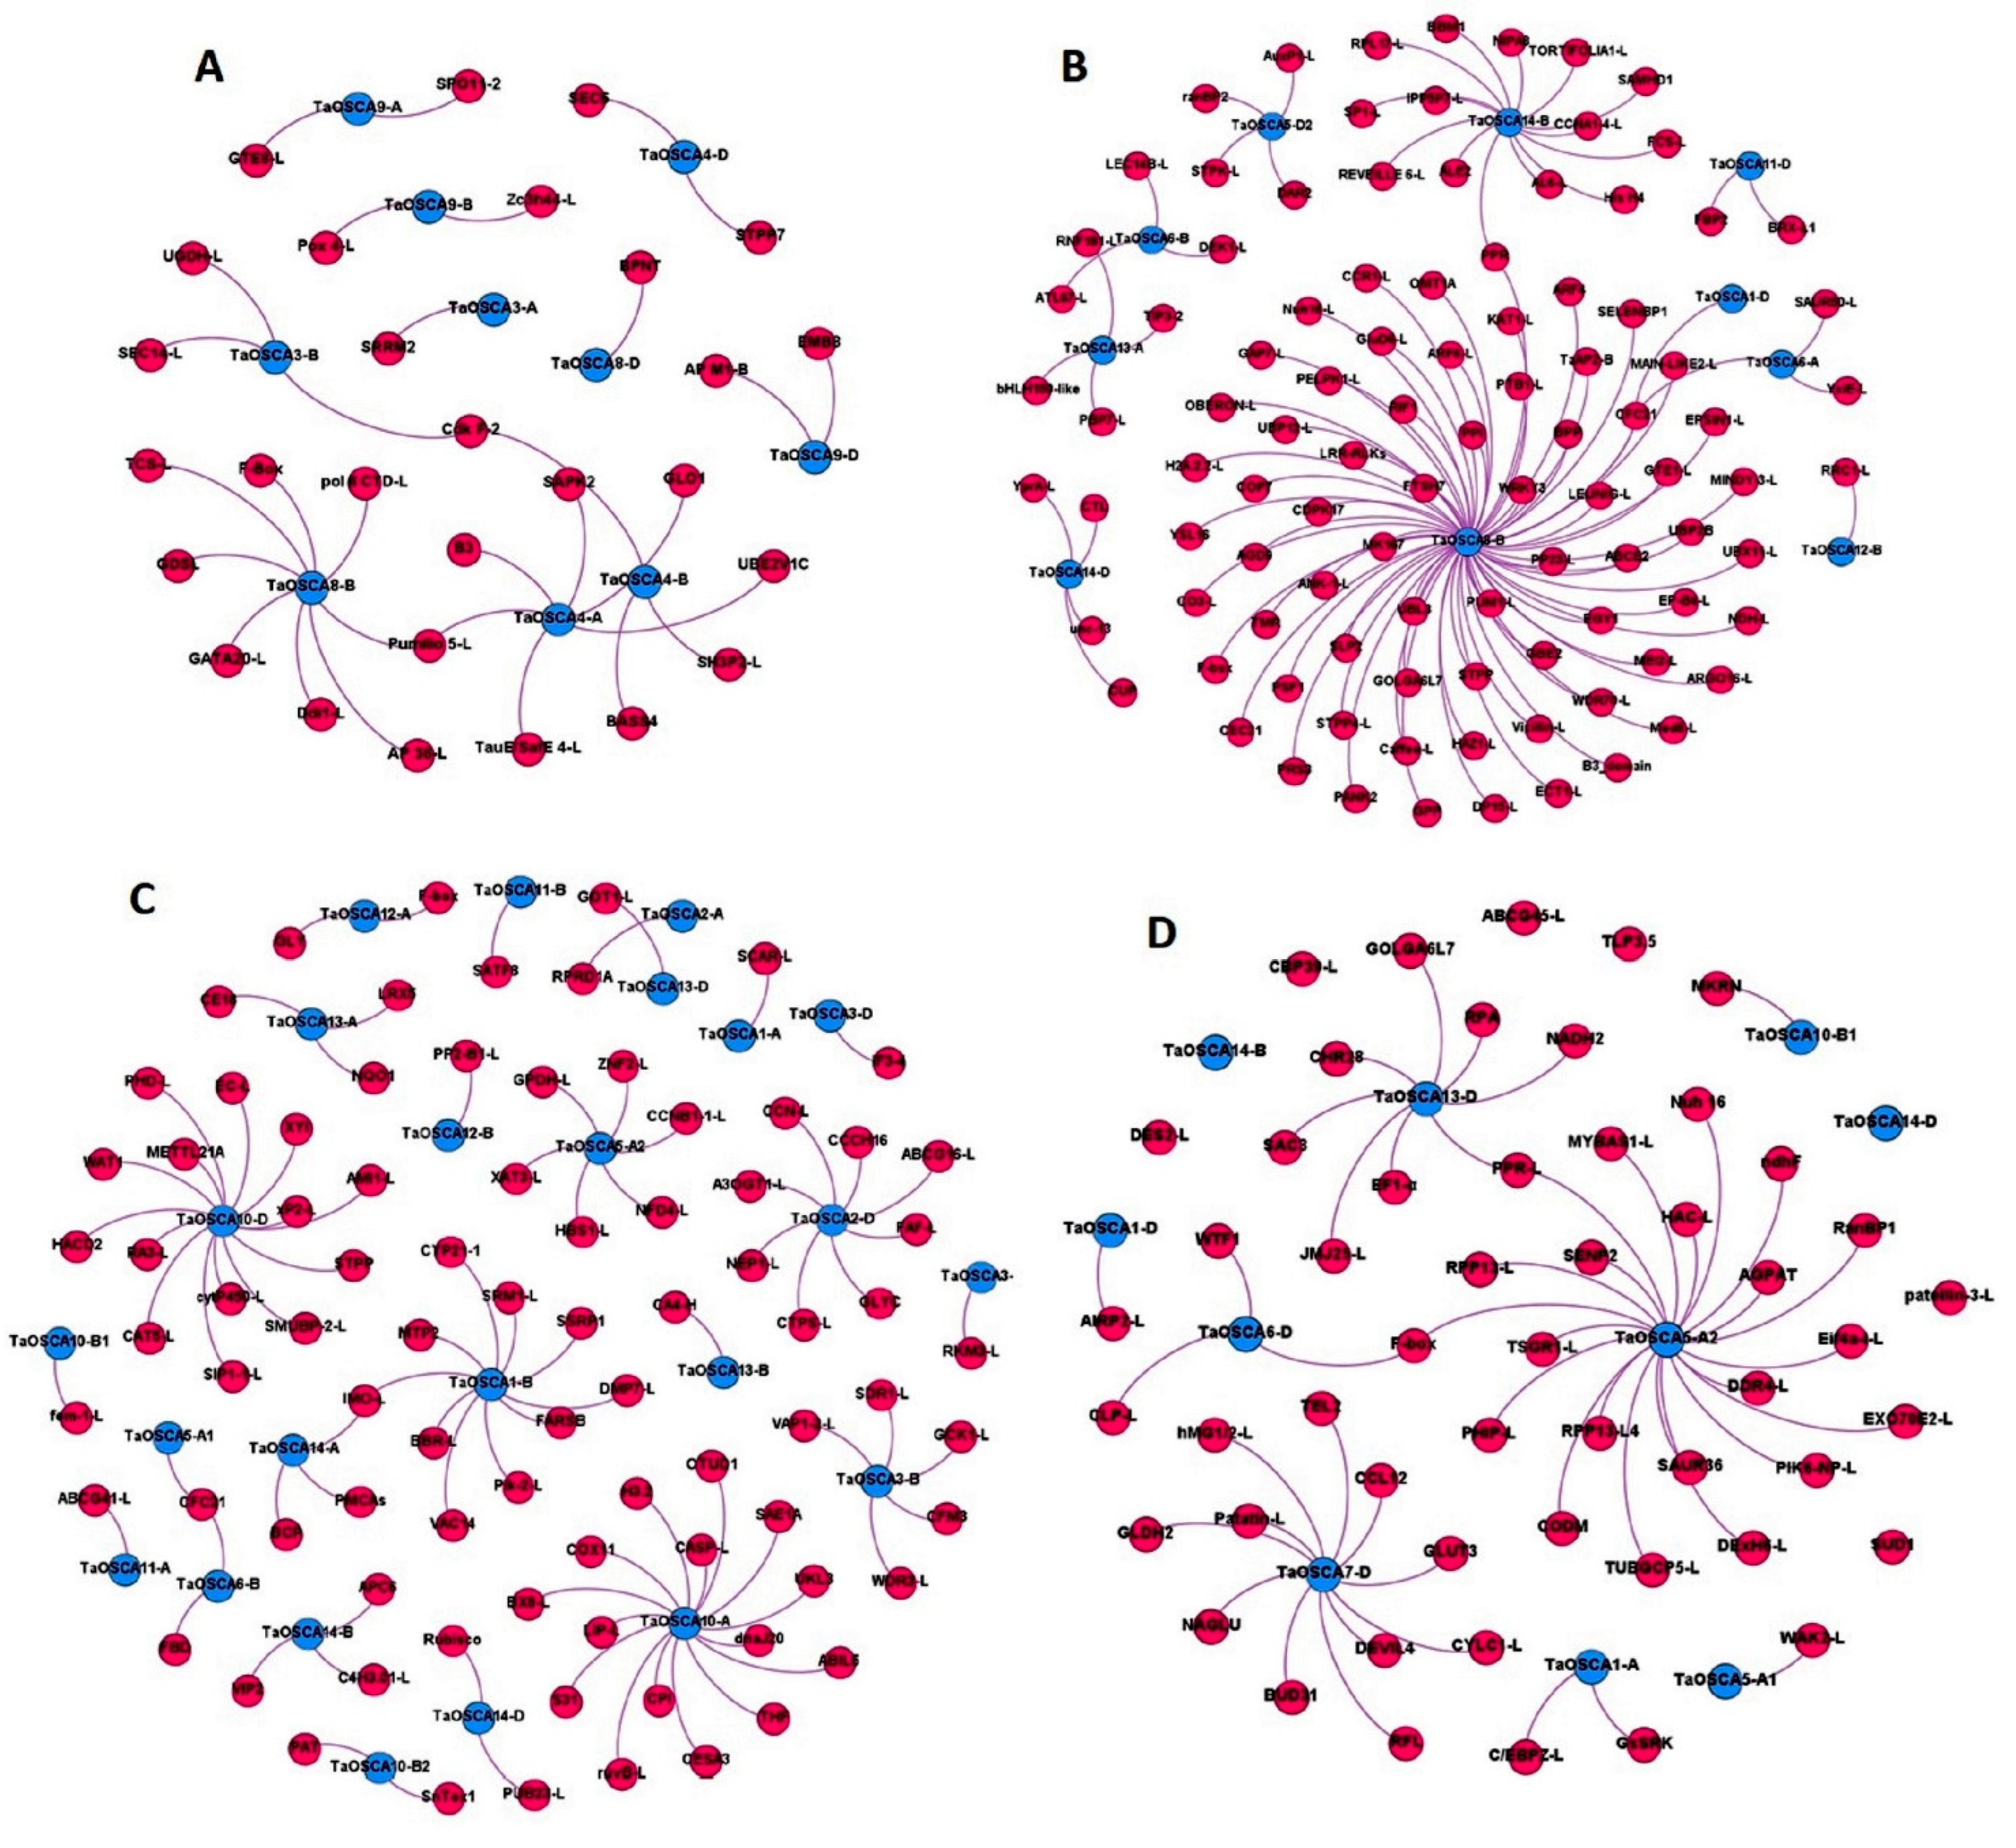
2.9. Protein–Protein Interaction Analysis

The protein–protein interaction analysis using the STRING server suggested the interaction of TaOSCAs with 13 different proteins: AIR3 (subtilisin-like serine endopeptidase), ARFC1 (ADP-ribosylation factor C1), LEA4-1 (late embryogenesis abundant 4-1), C/VIF2 (cell wall/vacuolar inhibitor of fructosidase 2), CYP71B5 (cytochrome p450 71b5), FLA6 (fasciclin-like arabinogalactan protein 6), GLR2.3 (glutamate receptor 2.3), GRV2 (gravitropism defective 2), NiaP (organic cation/carnitine transporter 7), PLP4 (patatin-like protein 4), UPS4 (ureide permease 4), VSR1 (vacuolar-sorting receptor 1), and YLMG1-2 (YGGT family protein) (Table S6; Figure 7A). Moreover, it was found that a total of 29, 28, and 26 TaOSCAs interacted with C/VIF2, AIR3, and UPS4 protein, respectively. Six TaOSCA proteins, TaOSCA4-A, TaOSCA4-B, TaOSCA4-D, TaOSCA6-A, TaOSCA6-B, and TaOSCA6-D, showed interactions with CYP71B5, FLA6, GLR2.3, NiaP, and PLP4. The five OSCA proteins TaOSCA5-A1, TaOSCA5-B, TaOSCA5-D1, TaOSCA5-A2, and TaOSCA5-D2 were found to have interacted with LEA4-1 and YLMG1-2, while three TaOSCA proteins, TaOSCA11-A, TaOSCA11-B, and TaOSCA11-D, showed interaction with ARFC1, GRV2, and VSR1 proteins (Table S6; Figure 7A).

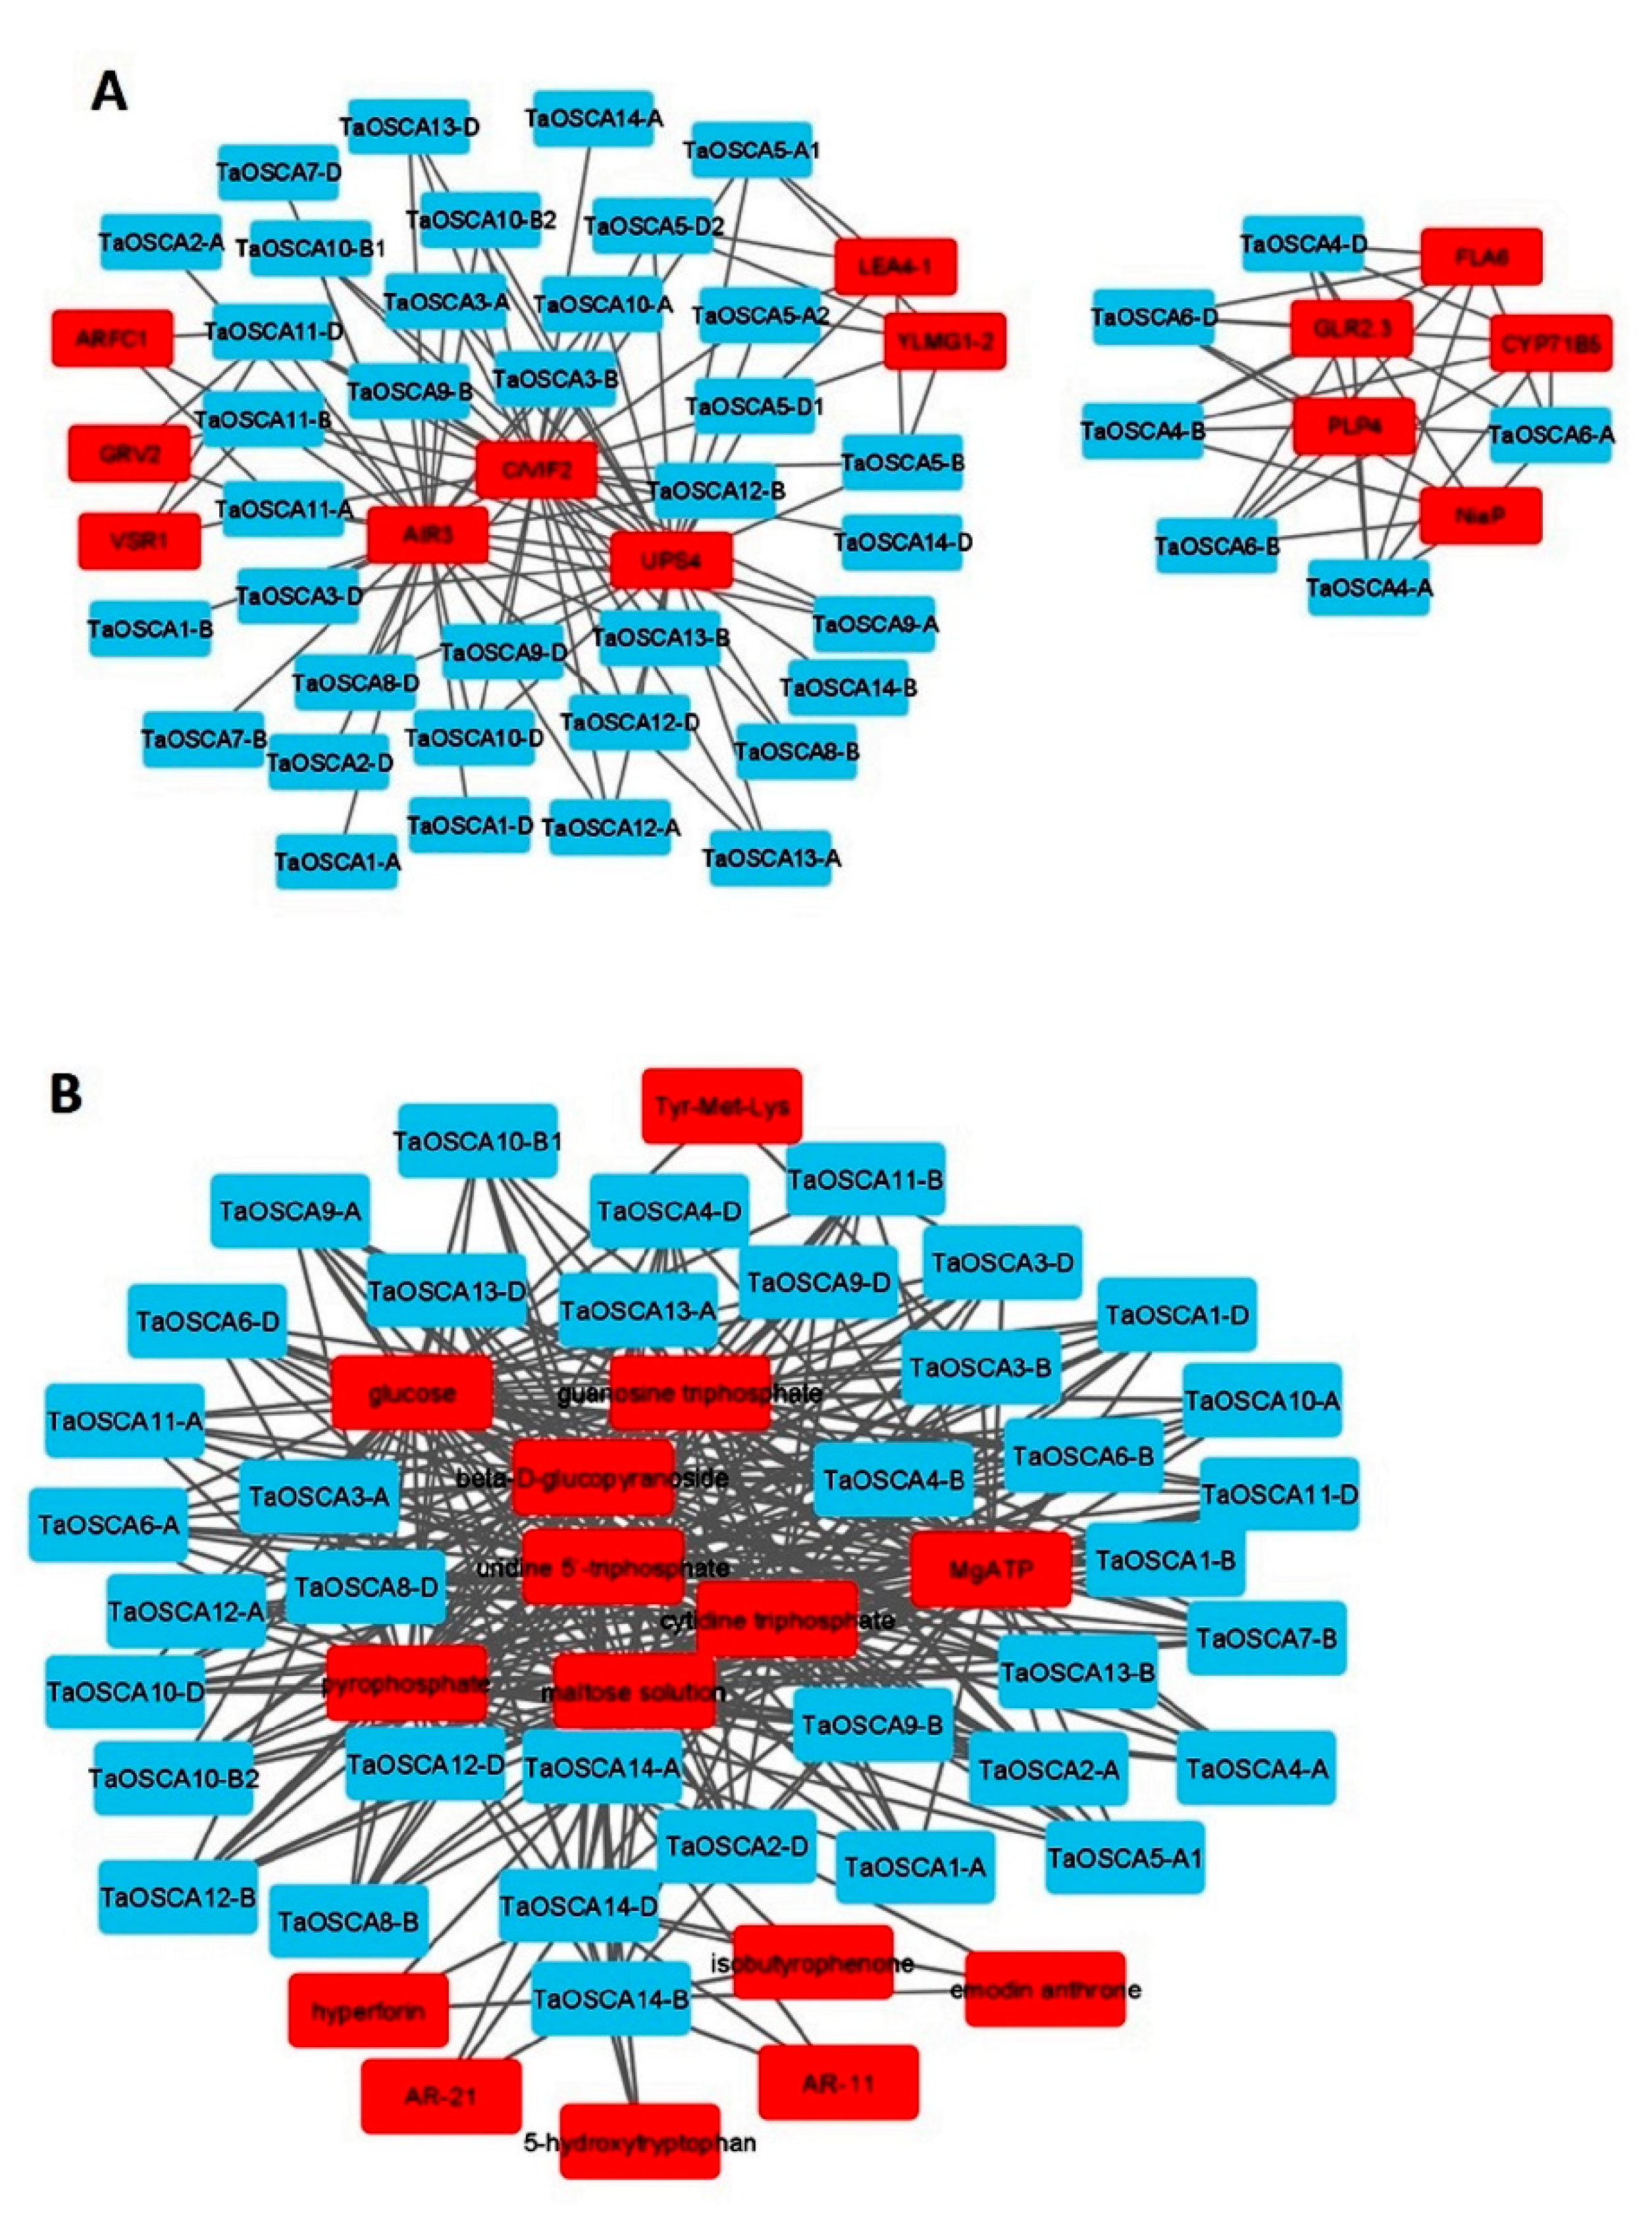
2.10. Protein–Chemical Interaction Analysis

A protein–chemical interaction analysis suggested the interaction of 37 TaOSCA proteins with 15 different chemicals: 5-hydroxytryptophan, beta-D-glucopyranoside, AR-11, AR-21, cytidine triphosphate, emodin anthrone, glucose, guanosine triphosphate, hyperforin, isobutyrophenone, maltose solution, MgATP, pyrophosphate, Tyr-Met-Lys, and uridine 5′-triphosphate (Table S6; Figure 7B). Furthermore, it was analysed that 31 TaOSCA proteins interacted with beta-D-glucopyranoside, cytidine triphosphate, glucose, guanosine triphosphate, maltose solution, MgATP, pyrophosphate, and uridine 5′-triphosphate. The three proteins TaOSCA14-A, TaOSCA14-B, and TaOSCA14-D showed interaction with 5-hydroxytryptophan, AR-11, AR-21, emodin anthrone, hyperforin, and isobutyrophenone, while the three proteins TaOSCA3-A, TaOSCA3-B, and TaOSCA3-D were found to have interacted with Tyr-Met-Lys (Table S6; Figure 7B).

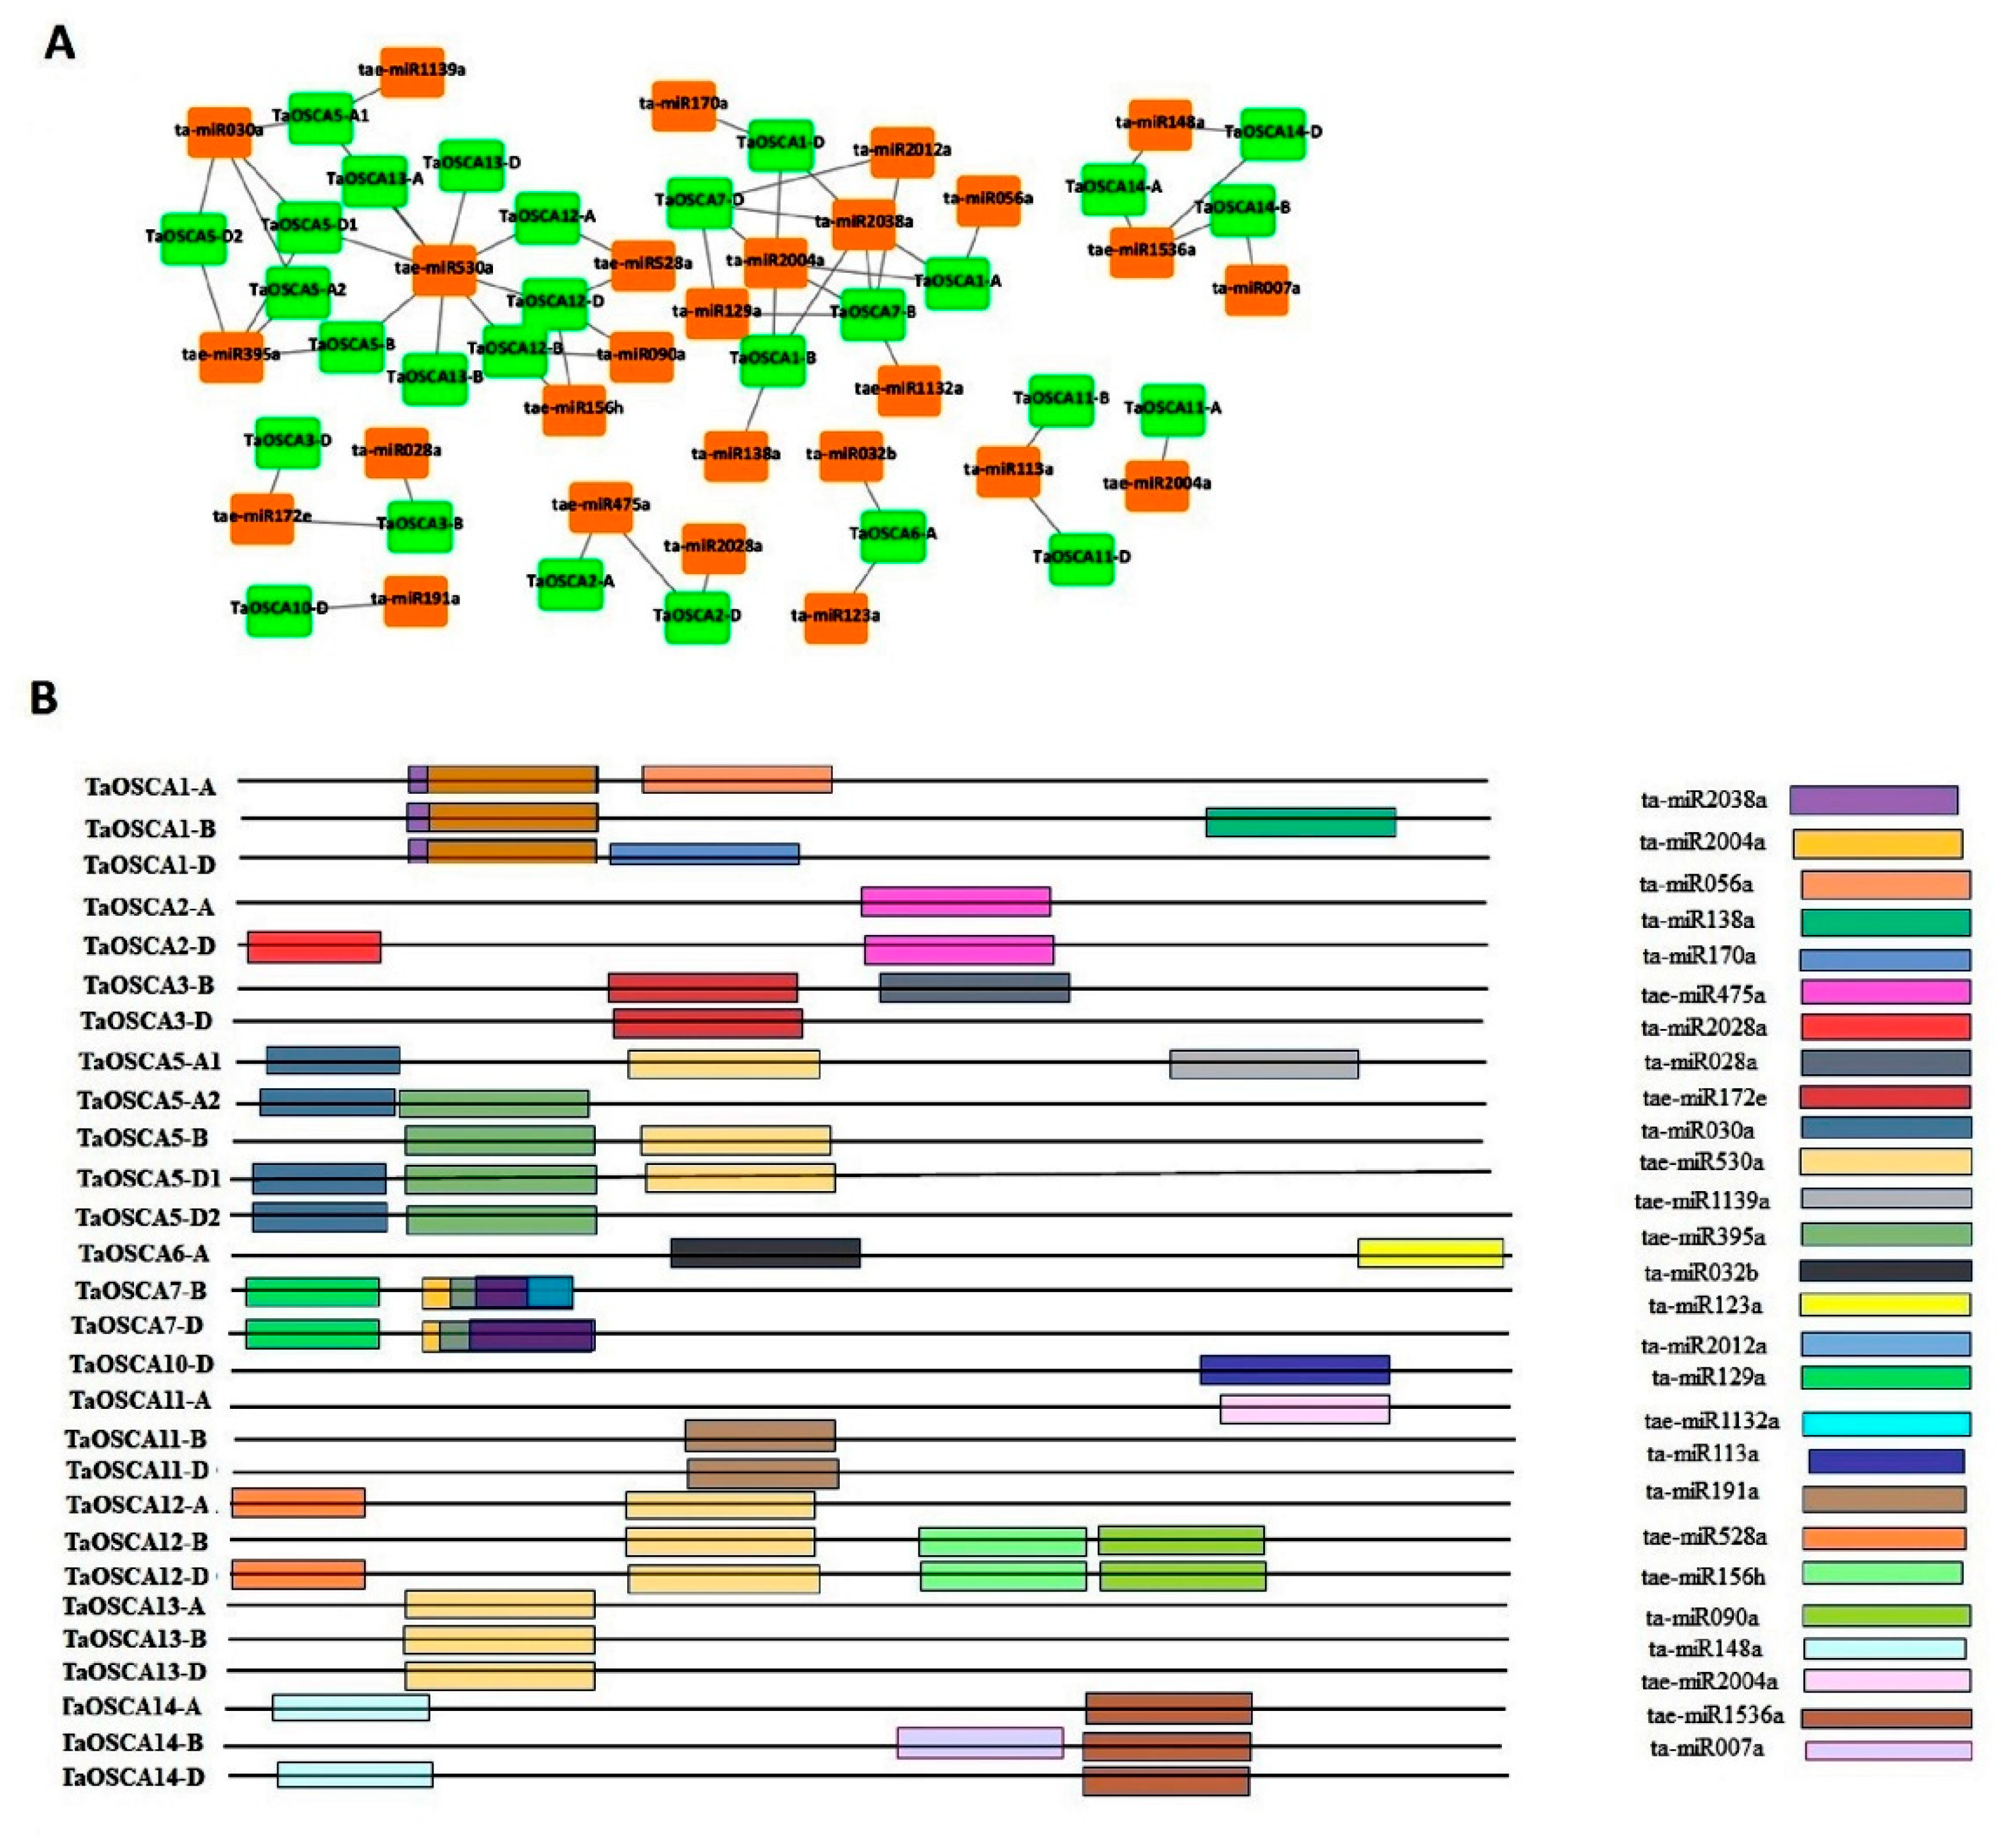
2.11. miRNAs Interaction Analysis

A total of 27 miRNAs were found to interact with 28 OSCA transcripts of T. aestivum (Table S7; Figure 8A,B). Out of these 27 identified miRNAs, 22 miRNAs acted via cleavage and 4 miRNAs acted via translation inhibition with their targeted transcripts. Moreover, it was analyzed that only one miRNA, i.e., ta-miR2038a, acted via both translation inhibition and the cleavage mode of their target transcripts. Furthermore, it was predicted that a single TaOSCA transcript would be targeted by multiple miRNAs, for instance, TaOSCA7-B by ta-miR2004a, ta-miR2012a, ta-miR129a, ta-miR2038a, and tae-miR1132a, and TaOSCA12-D by tae-miR156h, tae-miR528a, tae-miR530a, and ta-miR090a. In addition to this, we observed that multiple TaOSCA transcripts were targeted by the same miRNA; for instance, TaOSCA12-A, TaOSCA12-B, TaOSCA12-D, TaOSCA13-A, TaOSCA13-B, TaOSCA13-D, TaOSCA5-A1, TaOSCA5-B, and TaOSCA5-D1 were targeted by tae-miR530a, and TaOSCA1-A, TaOSCA1-B, TaOSCA1-D, TaOSCA2-D, TaOSCA7-B, and TaOSCA7-D were targeted by ta-miR2038a.

3. Discussion

OSCA proteins are very important Ca2+-permeable channels reported to be involved in various stress responses as well as in the development process of plants. They have been identified and characterized in numerous plant species at different scales [12,13,14,15,16,17,18,19,20,21,22,23,24,25]. However, the detailed characterization of TaOSCAs in T. aestivum, an important cereal crop, has not been performed in earlier studies. Moreover, while Tong et al. [32] earlier identified a similar number of TaOSCA genes as were identified in the present study, they only conducted a partial characterization and expression analysis of a limited number of genes in different experimental conditions. In the current study, a detailed in silico characterization, along with an evolutionary analysis, expression profiling in diverse conditions, and interaction analyses were performed.
The extensive BLAST search identified a total of 42 TaOSCA genes in the allohexaploid genome of T. aestivum, which were relatively higher and around thrice in number than in other diploid plant species, such as A. thaliana, O. sativa, and Z. mays, etc. Moreover, a relatively higher number of OSCA genes has also been reported in tetraploid G. hirsutum (35) [14,15,16,17,18,19,20]. These results suggested that the occurrence of a higher number of OSCA genes could be attributed to their complex polyploid genome. Further, a positive correlation between the number of genes and the ploidy level of the genome was observed. The comparable number of the homeologous grouping (14) of the TaOSCA genes of T. aestivum to the total number of OSCAs in the diploid plant species [14,15,17,18] further endorses the above hypothesis. Similarly, higher numbers of genes in other gene families of T. aestivum have also been reported as compared to those of other crops [33,34]. The other characteristics of the TaOSCA proteins, such as peptide length, molecular weight, pI, sub-cellular localization, and the number of trans-membranes, were comparable to the OSCA proteins of other plant species [14,15,16,17,18,19,20]. The majority of TaOSCA proteins were predicted to be localized in the plasma membrane, which was also confirmed by the presence of the trans-membrane domain in each protein.
Duplication events play vital functions in the expansion of gene families, introducing genetic variability, and gaining neo-functionality in paralogues genes [35]. In T. aestivum, both SDEs and TDEs were predicted as key factors behind the expansion of the TaOSCA gene family. Similar duplication events in the OSCA gene family have also been reported in Pyrus bretschneideri (five SDEs), V. radiata (three SDEs), and G. hirsutum (16 SDEs) [16,17,19]. During evolution, the paralogous genes experience positive (non-purifying) or negative (purifying) selection pressures under various evolutionary forces [36]. The Ka/Ks analysis suggested the purifying selection of the TaOSCA paralogous genes, which was in agreement with the paralogous OSCA genes in other plants, such as Pyrus bretschneideri, V. radiata, and G. hirsutum, [16,17,19]. Further, the divergence time analysis suggested the origin of duplicated TaOSCA genes probably earlier than the hybridization events of the A, B, and D subgenomes [37].
The phylogenetic analysis suggested the clustering of OSCA proteins into four clades as reported in earlier studies [18,19,32]. The tight clustering of the OSCA genes of A. thaliana, O. sativa, and T. aestivum in all the clades indicated their evolvement before the division of dicotyledons and monocotyledons. The tight clustering of the homeologous genes of T. aestivum could be due to their high sequence homology. Moreover, the close clustering of paralogous TaOSCA genes pointed toward their conserved nature, which was in accordance with the purifying selection.
Expression studies on the TaOSCA genes were performed to reveal their roles in the growth and development of vegetative and reproductive tissues, as well as in the stress response. The specifically higher expression levels of certain genes in particular tissue developmental stages suggested their precise roles in said tissue development. For instance, the higher expression of the majority of TaOSCA genes in the early developmental stages of root tissue indicated their vital function in Ca2+ absorption, which is highly required during the early stage for the proper growth and development of plants because Ca2+ is an integral part of the cell wall and membrane and also plays a significant role in various organelles and in signaling [6]. Similarly, the higher expression levels of a few TaOSCA genes in leaf and stem tissues further indicated their roles in vegetative tissue development. Moreover, the specifically greater expression levels of certain TaOSCA genes in particular developmental stage spike and grain tissue indicated their involvement in reproductive tissue development and the reproductive health of plants. Similarly, the differential expression of OSCA genes has also been reported in the cereal crop rice, where certain genes, such as OsOSCA1.1, OsOSCA1.2, OsOSCA2.4, OsOSCA3.1, and OsOSCA4.1, exhibited higher expression levels in the roots, shoots, mature stems, mature flag leaves, stamens, pistils, and mature seeds [15]. The specifically high expression levels of some of the TaOSCA genes in various developmental stages of grain indicated their roles during grain filling. This could be due to either the positive involvement of Ca2+ during grain development or the fact that increased osmotic potential is responsible for the enrichment of TaOSCA transcripts. Earlier research has also suggested the roles of several OSCA genes in O. sativa in caryopsis development and seed imbibition [15]. Further, the differential expression of OSCA genes in vegetative and reproductive tissues has also been reported in P. bretschneideri [16]. Moreover, the specific roles of each OSCA need to be established individually in future studies.
The modulated expression of various TaOSCA genes under abiotic stresses, such as heat, drought, salt, and biotic stresses including fungal (Bgt and Pst) infestation, suggested the putative roles of TaOSCA genes in defense responses. The majority of TaOSCA genes exhibited differential responses during drought and salinity stresses, which is in agreement with previous reports [16,17,18,19,20,32] and the mechanosensitive nature of these genes [7,13]. For instance, an earlier survey established that five OSCA genes in O. sativa, OsOSCA1.2, OsOSCA2.1, OsOSCA2.4, OsOSCA2.5, and OsOSCA3.1, showed upregulation after ABA, drought, PEG, and salinity treatments. Further, OsOSCA4.1 is upregulated after PEG, salinity, and ABA treatments, while OsOSCA1.1 is solely upregulated after PEG and salinity stress. The OSCA1 of A. thaliana has also been reported to play a precise role in osmotic stress-induced Ca2+ signaling [14]. It has also been established that the over-expression of various OsOSCA genes (OsOSCA1.1-4, and OsOSCA2.1-2) mediated Ca2+ signalling in osca1 mutant of A. thaliana during hyperosmolality and salt stress [22,23]. Similarly, most of the ZmOSCA genes of Z. mays are upregulated in response to ABA, PEG, and NaCl treatments, and ZmOSCA2.3 and ZmOSCA2.4 exhibited significantly higher upregulation under these stresses [21]. Further, the over-expression of ZmOSCA2.4 conferred drought resistance in the mutant of A. thaliana [21]. The elevated expression of certain TaOSCA genes in T. aestivum in response to biotic stresses has suggested their involvement in biotic stress-induced Ca2+ signaling. Thor et al. [24] recently established the BIK1-mediated activation of OSCA1.3 and OSCA1.7 after phosphorylation for Ca2+ influx in the cytoplasm of guard cells in Arabidopsis during PAMPs-triggered stomatal immunity, which established their role in Ca2+ signaling under biotic stress. The induced expression of TaOSCA genes at different hours of CaCl2 treatment in the present study further suggests their crucial participation in Ca2+ homeostasis and signaling. Several previous studies already established the roles of OSCAs in Ca2+ homeostasis in response to different stress conditions [14,15,16,17,18,19,20,21,22,23,24,25].
The interaction analyses of TaOSCAs were analysed by co-expression, protein–protein interaction, and protein–chemical interaction to reveal their roles in downstream signaling during developmental stages, metabolism, and stress conditions. The co-expression analysis and GO mapping indicated the involvement of TaOSCA genes in a wide range of developmental processes as well as in stress responses. For instance, the co-expression of TaOSCA genes with UDP-glucose 6-dehydrogenase 4-like, cellulose synthase, embryogenesis-associated proteins, and Rubisco revealed their role in cell wall synthesis, reproductive development, and photosynthesis [38,39]. During drought and heat stress, the co-expression of TaOSCA genes with Ca2+-binding protein, Ca2+ uptake proteins, Ca2+-dependent protein kinase, Ca2+ transporter ATPase, and WRKY transcription factor showed their role in Ca2+-related signaling cascades and Ca2+ homeostasis during these stresses [6,40]. The occurrence of cis-regulatory element DRE1 (drought-responsive element 1) in the promoter region of TaOSCA genes also indicated their functioning in drought and osmotic stress responses [32]. The co-expression of TaOSCA genes with transcripts encoding various kinases, such as serine-threonine kinase, well-associated receptor kinases, receptor-like kinases, and phosphatidylinositol 4-phosphate 5-kinase, further suggested their role in the defense-related signaling cascades [41]. During biotic stresses, the co-expression of TaOSCA genes with chitinase CLP-like and pathogenesis-related thaumatin-like protein 3.5 indicated their involvement in Ca2+-mediated downstream signaling for the activation of defense-responsive genes during biotic stresses [42], which was consistent with the modulated expression of certain TaOSCA genes after Bgt and Pst infestation.
Similar to the co-expression analysis, the protein–protein interaction analysis of TaOSCAs also suggested their linkage with various biological as well as stress-related signaling pathways. For instance, the interaction of TaOSCA proteins with GLR showed their functioning in stomata closure via Ca2+ influx into the cytosol [24,43], because both OSCA and glutamate receptors are known to be involved in Ca2+-mediated stomatal closure. The interaction of TaOSCA proteins with LEA and C/VIF2 proteins indicated their role in adaptive responses during drought stress conditions [44,45,46]. Additionally, their interaction with PLP4 and AIR3 suggested their role in root formation [47,48]. The significantly higher expression levels of various TaOCSA genes in root developmental stages also endorse the above statement. The interaction of TaOSCA with MgATP further suggested their probable functioning in Ca2+ signaling and homeostasis [49]. MgATP is reported to play an important role in plasma membrane ATPase and nitrogenase catalysis [50,51]. Interaction with GTPases that are responsible for oscillating Ca2+ concentration by modulating endo/exocytosis or by signaling cascades during pollen tube growth indicated their function in reproductive tissue development [52], which is also suggested by the specifically higher expression levels of certain TaOSCA genes in spike developmental stages. Guanosine triphosphate was also reported to be involved in signal transduction, vesicular transportation, and cell proliferation, etc. [52].
miRNAs control gene expression at the post-transcriptional and translational level through the regulatory mechanism known as RNA interference [53,54]. Many previous analyses have revealed the role of miRNAs in the regulation of several genes that are involved in plant developmental processes and stress responses [55,56,57,58]. Therefore, to analyze the miRNA-mediated regulation of TaOSCA genes, their interaction with the known miRNAs [59] of T. aestivum was investigated in the present study. The interaction of TaOSCAs with miR156 and miR172, associated with grain development [60] and floral organ development [61], respectively, further suggested the role of TaOSCA genes in plant reproductive development as indicated by expression and co-expression studies. Additionally, their interaction with some drought stress-related miRNAs, such as miR528, miRNA172, miRNA395, and miRNA530 [62,63,64], assured their miRNA-mediated regulation during the stress response.
In conclusion, comprehensive analyses of the TaOSCA gene family in T. aestivum suggested their diverse roles from development to the stress response, which could be attributed to their involvement in Ca2+ homeostasis. The duplication event analysis suggested that segmental duplications are the major factors responsible for the OSCA gene family expansion. The phylogenetic analysis of OSCA proteins among different plant species indicated the close evolutionary relatedness between dicotyledons and monocotyledons. The modulated expression patterns of TaOSCA genes suggested that they play essential roles in plant development as well as in adaptive responses. The co-expression and interaction analysis suggested the involvement of TaOSCA genes in Ca2+-mediated developmental processes and stress responses. TaOSCA interaction with numerous known miRNAs associated with different biological functions suggested the miRNA-mediated regulation of TaOSCA genes during different biological processes. The current study revealed numerous functions of TaOSCAs, but the specific roles of each of the genes need to be further established in future research.

4. Materials and Methods

4.1. Identification and Chromosomal Distribution

The bidirectional BLAST hit approach was adopted with e-value 10−10 to identify the TaOSCA genes in the T. aestivum genome. The OSCA protein sequences of A. thaliana and O. sativa were used as queries against the protein model sequences of T. aestivum, retrieved from the Ensembl Plant (http://plants.ensembl.org/index.html, accessed on 7 August 2021) and IWGSC (IWGSC RefSeq assembly v2.0) (http://wheat-urgi.versailles.inra.fr/Seq-Repository/Genes-annotations, accessed on 25 February 2019, http://www.wheatgenome.org/, accessed on 25 February 2019) databases. Furthermore, the SMART server [65] and Conserved Domain Database (CCD) blast search [66] approaches were used to confirm the presence of characteristic domains in the identified putative OSCA proteins of T. aestivum.
The data regarding the chromosomal and subgenomic location of each TaOSCA gene were downloaded from the Ensembl Plant server. Further, TaOSCA genes were mapped on their respective chromosomes using the MapInspect tool (http://mapinspect.software.in-former.com/accessed on 1 October 2021). The proposed guidelines for wheat gene symbolization (http://wheat.pw.usda.gov/ggpages/wgc/98/Intro.htm, accessed on 6 October 2021) were followed for the nomenclature of the TaOSCA proteins. The homeologous grouping of TaOSCA genes was performed on the basis of ≥90% sequence similarity among them, as performed in the previous analysis [33,34].

4.2. In Silico Protein Characterization

The Expasy tool was used to compute the various properties, for instance, the protein length, MW, and pI of each TaOSCA protein [67]. Subcellular localization, signal peptide, and transmembrane helices were predicted using the Cello [68], SignalP 5.0. (https://services.healthtech.dtu.dk/service.php?SignalP-5.0, accessed on 30 August 2022) and TMHMM-2.0 (https://services.healthtech.dtu.dk/service.php?TMHMM-2.0, accessed on 29 June 2022) server, respectively.

4.3. Prediction of Duplication Events and Ka/Ks Analysis

To analyze the duplication events, a sequence similarity matrix was conducted using the MAFFT software (https://www.ebi.ac.uk/Tools/msa/mafft/, accessed on 3 June 2022), and TaOSCA genes with 80–90% sequence similarity were considered duplicated genes. Further, the predicted duplicated genes were categorized into tandem and segmentally duplicated genes based on the distance among them as described in earlier reports [42].
The non-synonymous substitution per non-synonymous site (Ka), synonymous substitution per synonymous site (Ks), and Ka/Ks ratios of TaOSCA duplicated gene pairs were also calculated using the PAL2NAL software [69]. Further, the formula T = Ks/2r, (T = divergence time and r = divergence rate) was applied to compute the divergence time of TaOSCA duplicated genes. In the case of cereals, the value of r was proposed as 6.5 × 10⁻⁹ [70]. Moreover, Tajima’s relativity test was applied to estimate the evolutionary rate between duplicated genes [26].

4.4. Phylogenetic Analysis

For the construction of a phylogenetic tree, firstly full-length OSCA protein sequences of A. thaliana, O. sativa, and T. aestivum were aligned via the ClustalW algorithm (https://www.ebi.ac.uk/Tools/msa/clustalw2/, accessed on 9 June 2022). Further, the neighbor-joining method was applied to construct the phylogenetic tree OSCA protein using the MEGA X software with 1000 bootstrap replicates [71].

4.5. Expression Profiling of TaOSCA Genes

An expression analysis of the TaOSCA genes was performed to gain insight into the functional involvement of these genes in plant development and defense. The high-throughput RNA-seq data were downloaded from the publicly available URGI at https://urgi.versailles.inra.fr/files/RNASeqWheat, accessed on 24 February 2019. In the case of tissue developmental expression profiling, the RNA seq data were produced from three development stages of five tissues, including root, leaf, stem, spike, and grain tissues, and were present in biological replicates [27,28]. The trinity pipelines [72] were pursued to obtain fragments per kilobase of transcripts per million mapped (FPKM) reads, which were revalidated by the Expression ATLAS [73].
To study the effects of abiotic stresses on TaOSCA genes, expression profiling was carried out using high-throughput RNA-seq data generated after 1 and 6 h of HS, DS, and HD in duplicates from leaf tissue [29], and 6, 12, 24, and 48 h of salt stress (150mM NaCl) from root tissue [30].
Moreover, to study the effects of the two fungal pathogens Bgt and Pst on TaOSCA genes, expression profiling was carried out using high-throughput RNA seq data generated in triplicates after 24, 48, and 72 h of their inoculation [31]. Using the Trinity package, the expression values were calculated into FPKM reads [72]. The heat maps were built with the help of Hierarchical Clustering Explorer 3.5 (http://www.cs.umd.edu/hcil/hce/, accessed on 4 January 2022) and the Euclidean distance method was used for hierarchical clustering [74].

4.6. qRT-PCR Analysis

Firstly, the seeds of T. aestivum (cv. Chinese spring) were surface sterilized with sodium hypochlorite (1.2%) in 10% ethanol and washed with double autoclaved water. The washed seeds were placed overnight at 4 °C for stratification. Further, these seeds were kept at room temperature for germination. Afterwards, these germinated seedlings were grown in a plant growth chamber at 22 °C, 60% relative humidity, and in 16 and 8 hours of light and dark periods, respectively. Further, the seven-day-old seedlings were treated with CaCl2 (20 mM) Murashige and Skoog (MS) growth media. The samples were collected after 6, 12, 24, and 48 h in liquid nitrogen. RNA was taken out of root tissues using the Spectrum TM Plant Total RNA kit (Sigma, USA). The TURBO DNA-free™ Kit (Invitrogen, USA) was used to remove the traces of DNA contamination from the RNA samples. Moreover, both the quality and quantity of RNA samples were examined using agarose gel electrophoresis and a Nanodrop spectrophotometer, respectively. The cDNAs were produced from 1 microgram of RNA using Superscript III First-Strand Synthesis SuperMix (Invitrogen, Waltham, MA, USA). qRT-PCR was performed with CFX96 Real-Time PCR (BioRad, USA) using SYBR Green and gene-specific primers of selected OSCA genes by following a previously established procedure [75]. An ADP-ribosylation factor (TaARF1) was used as an internal control and the expression values were calculated using delta-delta CT (2-ΔΔCT) method [76]. All the experiments were carried out in biological triplicates (n = 3) which were further illustrated in the terms of mean § standard deviation (SD).

4.7. Co-Expression Analysis and Gene Ontology Mapping

The co-expressing partners of TaOSCA genes were predicted using CoExpress v.1.5. server. The Pearson correlation coefficient with a correlation power of 1 [77] and threshold filter ≥ 0.9 were used to compute the co-expression values. The Blast2GO tool [78] was used for the gene ontology (GO) mapping and functional annotation of co-expressed genes. Interaction networks of co-expressed genes were displayed using the Gephi 0.9.1 server [79].

4.8. Protein–Protein, Protein–Chemical, and miRNA Analysis

The protein–protein and protein–chemical interaction were performed using the STRING (http://stringdb.org) [80] and STITCH (http://stitch.embl.de/, accessed on 16 June 2022) [81] servers, respectively. Further, Cytoscape software (https://cytoscape.org/download.html) was used for the construction of interaction networks. The interacting miRNAs of TaOSCA genes were predicted with the psRNATarget (http://plantgrn.noble.org/psRNATarget/, accessed on 23 June 2022) database [82] using the known T. aestivum miRNA sequences [59].

Supplementary Materials

The following supporting information can be downloaded at: https://www.mdpi.com/article/10.3390/ijms232314867/s1.

Author Contributions

S.K.U. conceived the idea. S.K.U. and A.K. designed the experiments. A.K., A.S., M. and S.D. performed the experiments. A.K., K.S. and S.K.U. analyzed the data. A.K. and S.K.U. wrote and finalized the manuscript. All authors have read and agreed to the published version of the manuscript.

Funding

This research received no external funding.

Institutional Review Board Statement

Not applicable.

Informed Consent Statement

All the authors provided their consent for publication.

Data Availability Statement

Not applicable.

Acknowledgments

The authors are grateful to the Panjab University, Chandigarh, India for the research facilities. S.K.U. is grateful to the Science and Engineering Board (SERB) of the Government of India for the Core Research Grant (CRG/2021/000040). A.K. and A.S. are thankful to CSIR and M. is grateful to UGC for their respective fellowships. S.D. is thankful to DBT for the M.K.-Bhan Fellowship.

Conflicts of Interest

The authors declare that they have no conflict of interest.

References

  1. Bartels, D.; Sunkar, R. Drought and salt tolerance in plants. Crit. Rev. Plant Sci. 2005, 24, 23–58. [Google Scholar] [CrossRef]
  2. McAinsh, M.R.; Pittman, J.K. Shaping the calcium signature. New Phytol. 2009, 181, 275–294. [Google Scholar] [CrossRef]
  3. White, P.J. Calcium channels in higher plants. BBA-Biomembr. 2000, 1465, 171–189. [Google Scholar] [CrossRef] [Green Version]
  4. Taneja, M.; Upadhyay, S.K. An introduction to the calcium transport elements in plants. In Calcium Transport Elements in Plants; Academic Press: Cambridge, MA, USA, 2021; pp. 1–18. [Google Scholar]
  5. Smyth, J.T.; DeHaven, W.I.; Jones, B.F.; Mercer, J.C.; Trebak, M.; Vazquez, G.; Putney, J.W., Jr. Emerging perspectives in store-operated Ca2+ entry: Roles of Orai, Stim and TRP. BBA-Mol. Cell Res. 2006, 1763, 1147–1160. [Google Scholar]
  6. Upadhyay, S.K. Calcium Transport Elements in Plants; Academic Press: Cambridge, MA, USA, 2021; pp. 1–464. [Google Scholar]
  7. Zhang, M.; Wang, D.; Kang, Y.; Wu, J.X.; Yao, F.; Pan, C.; Yan, Z.; Song, C.; Chen, L. Structure of the mechanosensitive OSCA channels. Nat. Struct Mol. Biol 2018, 25, 850–858. [Google Scholar] [CrossRef]
  8. Batistic, O.; Kudla, J. Analysis of calcium signaling pathways in plants. Biochim. Biophys. Acta 2012, 1820, 1283–1293. [Google Scholar] [CrossRef] [PubMed]
  9. Trewavas, A.; Knight, M. Mechanical signalling, calcium and plant form. Plant Mol. Biol. 1994, 26, 1329–1341. [Google Scholar] [CrossRef]
  10. Booth, I.R.; Edwards, M.D.; Black, S.; Schumann, U.; Miller, S. Mechanosensitive channels in bacteria: Signs of closure? Nat. Rev. Microbiol. 2007, 5, 431–440. [Google Scholar] [CrossRef]
  11. Árnadóttir, J.; Chalfie, M. Eukaryotic mechanosensitive channels. Annu Rev. Biophys 2010, 39, 111–137. [Google Scholar] [CrossRef] [PubMed]
  12. Hou, C.; Tian, W.; Kleist, T.; He, K.; Garcia, V.; Bai, F.; Hao, Y.; Luan, S.; Li, L. DUF221 proteins are a family of osmosensitive calcium-permeable cation channels conserved across eukaryotes. Cell Res. 2014, 24, 632–635. [Google Scholar] [CrossRef] [Green Version]
  13. Liu, X.; Wang, J.; Sun, L. Structure of the hyperosmolality-gated calcium permeable channel OSCA1. 2. Nat. Commun. 2018, 9, 1–9. [Google Scholar] [CrossRef]
  14. Yuan, F.; Yang, H.; Xue, Y.; Kong, D.; Ye, R.; Li, C.; Zhang, J.; Theprungsirikul, L.; Shrift, T.; Krichilsky, B.; et al. OSCA1 mediates osmotic-stress-evoked Ca2+ increases vital for osmosensing in Arabidopsis. Nature 2014, 514, 367–371. [Google Scholar] [CrossRef]
  15. Li, Y.; Yuan, F.; Wen, Z.; Li, Y.; Wang, F.; Zhu, T.; Zhuo, W.; Jin, X.; Wang, Y.; Zhao, H.; et al. Genome-wide survey and expression analysis of the OSCA gene family in rice. BMC Plant Biol. 2015, 15, 261. [Google Scholar] [CrossRef] [Green Version]
  16. Gu, X.; Wang, P.; Liu, Z.; Wang, L.; Huang, Z.; Zhang, S.; Wu, J. Genome-wide identification and expression analysis of the OSCA gene family in Pyrus bretschneideri. Can. J. Plant Sci. 2018, 98, 918–929. [Google Scholar] [CrossRef] [Green Version]
  17. Yin, L.; Zhang, M.; Wu, R.; Chen, X.; Liu, F.; Xing, B. Genome-wide analysis of OSCA gene family members in Vigna radiata and their involvement in the osmotic response. BMC Plant Biol 2021, 21, 408. [Google Scholar] [CrossRef]
  18. Ding, S.; Feng, X.; Du, H.; Wang, H. Genome-wide analysis of maize OSCA family members and their involvement in drought stress. PeerJ 2019, 7, e6765. [Google Scholar] [CrossRef] [PubMed] [Green Version]
  19. Yang, X.; Xu, Y.; Yang, F.; Magwanga, R.O.; Cai, X.; Wang, X.; Wang, Y.; Hou, Y.; Wang, K.; Liu, F.; et al. Genome-wide identification of OSCA gene family and their potential function in the regulation of dehydration and salt stress in Gossypium hirsutum. J. Cotton Res. 2019, 2, 1–18. [Google Scholar] [CrossRef] [Green Version]
  20. Zeng, H.; Zhao, B.; Wu, H.; Zhu, Y.; Chen, H. Comprehensive in silico characterization and expression profiling of nine gene families associated with calcium transport in soybean. Agronomy 2020, 10, 1539. [Google Scholar] [CrossRef]
  21. Cao, L.; Zhang, P.; Lu, X.; Wang, G.; Wang, Z.; Zhang, Q.; Zhang, X.; Wei, X.; Mei, F.; Wei, L.; et al. Systematic analysis of the maize OSCA genes revealing ZmOSCA family members involved in osmotic stress and ZmOSCA2.4 confers enhanced drought tolerance in transgenic arabidopsis. Int. J. Mol. Sci. 2020, 21, 351. [Google Scholar] [CrossRef] [Green Version]
  22. Zhai, Y.; Wen, Z.; Han, Y.; Zhuo, W.; Wang, F.; Xi, C.; Liu, J.; Gao, P.; Zhao, H.; Wang, Y.; et al. Heterogeneous expression of plasma-membrane-localised OsOSCA1.4 complements osmotic sensing based on hyperosmolality and salt stress in arabidopsis osca1 mutant. Cell Calcium 2020, 91, 102261. [Google Scholar] [CrossRef] [PubMed]
  23. Zhai, Y.; Wen, Z.; Fang, W.; Wang, Y.; Xi, C.; Liu, J.; Zhao, H.; Wang, Y.; Han, S. Functional analysis of rice OSCA genes overexpressed in the arabidopsis osca1 mutant due to drought and salt stresses. Transgenic Res. 2021, 30, 811–820. [Google Scholar] [CrossRef]
  24. Thor, K.; Jiang, S.; Michard, E.; George, J.; Scherzer, S.; Huang, S.; Dindas, J.; Derbyshire, P.; Leitão, N.; DeFalco, T.A.; et al. The calcium-permeable channel OSCA1. 3 regulates plant stomatal immunity. Nature 2020, 585, 569–573. [Google Scholar] [CrossRef]
  25. Yoshioka, K.; Moeder, W. Calcium channel in plants helps shut the door on intruders. Nature 2020, 585, 507–508. [Google Scholar] [CrossRef] [PubMed]
  26. Tajima, F. Simple methods for testing the molecular evolutionary clock hypothesis. Genetics 1993, 135, 599–607. [Google Scholar] [CrossRef]
  27. Choulet, F.; Alberti, A.; Theil, S.; Glover, N.; Barbe, V.; Daron, J.; Pingault, L.; Sourdille, P.; Couloux, A.; Paux, E.; et al. Structural and functional partitioning of bread wheat chromosome 3B. Science 2014, 345, 1249721. [Google Scholar] [CrossRef]
  28. Pingault, L.; Choulet, F.; Alberti, A.; Glover, N.; Wincker, P.; Feuillet, C.; Paux, E. Deep transcriptome sequencing provides new insights into the structural and functional organization of the wheat genome. Genome Biol. 2015, 16, 1–15. [Google Scholar] [CrossRef] [PubMed] [Green Version]
  29. Liu, Z.; Xin, M.; Qin, J.; Peng, H.; Ni, Z.; Yao, Y.; Sun, Q. Temporal transcriptome profiling reveals expression partitioning of homeologous genes contributing to heat and drought acclimation in wheat (Triticum aestivum L.). BMC Plant Biol. 2015, 15, 152. [Google Scholar] [CrossRef] [Green Version]
  30. Zhang, Y.; Liu, Z.; Khan, A.A.; Lin, Q.; Han, Y.; Mu, P.; Liu, Y.; Zhang, H.; Li, L.; Meng, X.; et al. Expression partitioning of homeologs and tandem duplications contribute to salt tolerance in wheat (Triticum aestivum L.). Sci. Rep. 2016, 6, 21476. [Google Scholar] [CrossRef] [PubMed] [Green Version]
  31. Zhang, H.; Yang, Y.; Wang, C.; Liu, M.; Li, H.; Fu, Y.; Wang, Y.; Nie, Y.; Liu, X.; Ji, W. Large-scale transcriptome comparison reveals distinct gene activations in wheat responding to stripe rust and powdery mildew. BMC Genom. 2014, 15, 898. [Google Scholar] [CrossRef] [Green Version]
  32. Tong, K.; Wu, X.; He, L.; Qiu, S.; Liu, S.; Cai, L.; Rao, S.; Chen, J. Genome-Wide Identification and Expression Profile of OSCA Gene Family Members in Triticum aestivum L. Int. J. Mol. Sci. 2021, 23, 469. [Google Scholar] [CrossRef]
  33. Kaur, A.; Taneja, M.; Tyagi, S.; Sharma, A.; Singh, K.; Upadhyay, S.K. Genome-wide characterization and expression analysis suggested diverse functions of the mechanosensitive channel of small conductance-like (MSL) genes in cereal crops. Sci. Rep. 2020, 10, 16583. [Google Scholar] [CrossRef] [PubMed]
  34. Madhu; Kaur, A.; Tyagi, S.; Singh, K.; Upadhyay, S.K. Exploration of glutathione reductase for abiotic stress response in bread wheat (Triticum aestivum L.). Plant Cell Rep. 2022, 41, 639–654. [Google Scholar] [CrossRef] [PubMed]
  35. Appels, R.; Eversole, K.; Feuillet, C.; Keller, B.; Rogers, J.; Stein, N.; Pozniak, C.J.; Choulet, F.; Distelfeld, A.; Poland, J. Shifting the limits in wheat research and breeding using a fully annotated reference genome. Science 2018, 361, eaar7191. [Google Scholar]
  36. Ellegren, H. Comparative genomics and the study of evolution by natural selection. Mol. Ecol. 2008, 17, 4586–4596. [Google Scholar] [CrossRef]
  37. Marcussen, T.; Sandve, S.R.; Heier, L.; Spannagl, M.; Pfeifer, M.; International Wheat Genome Sequencing Consortium; Jakobsen, K.S.; Wulff, B.B.; Steuernagel, B.; Mayer, K.F.; et al. Ancient hybridizations among the ancestral genomes of bread wheat. Science 2014, 345, 1250092. [Google Scholar] [CrossRef] [PubMed]
  38. Kärkönen, A.; Murigneux, A.; Martinant, J.P.; Pepey, E.; Tatout, C.; Dudley, B.J.; Fry, S.C. UDP-glucose dehydrogenases of maize: A role in cell wall pentose biosynthesis. Biochem. J. 2005, 391, 409–415. [Google Scholar] [CrossRef]
  39. Chen, Y.; Li, C.; Zhang, B.; Yi, J.; Yang, Y.; Kong, C.; Lei, C.; Gong, M. The role of the late embryogenesis-abundant (LEA) protein family in development and the abiotic stress response: A comprehensive expression analysis of potato (Solanum tuberosum). Genes 2019, 10, 148. [Google Scholar] [CrossRef] [PubMed] [Green Version]
  40. Chen, F.; Hu, Y.; Vannozzi, A.; Wu, K.; Cai, H.; Qin, Y.; Mullis, A.; Lin, Z.; Zhang, L. The WRKY transcription factor family in model plants and crops. Crit. Rev. Plant Sci. 2017, 36, 311–335. [Google Scholar] [CrossRef]
  41. Romeis, T. Protein kinases in the plant defence response. Curr. Opin. Plant Biol. 2001, 4, 407–414. [Google Scholar] [CrossRef]
  42. Sharma, A.; Sharma, H.; Rajput, R.; Pandey, A.; Upadhyay, S.K. Molecular Characterization Revealed the Role of Thaumatin-Like Proteins of Bread Wheat in Stress Response. Front. Plant Sci. 2022, 12, 807448. [Google Scholar] [CrossRef]
  43. Cho, D.; Kim, S.A.; Murata, Y.; Lee, S.; Jae, S.K.; Nam, H.G.; Kwak, J.M. De-regulated expression of the plant glutamate receptor homolog AtGLR3. 1 impairs long-term Ca2+-programmed stomatal closure. Plant J. 2009, 58, 437–449. [Google Scholar] [CrossRef]
  44. Mowla, S.B.; Cuypers, A.; Driscoll, S.P.; Kiddle, G.; Thomson, J.; Foyer, C.H.; Theodoulou, F.L. Yeast complementation reveals a role for an Arabidopsis thaliana late embryogenesis abundant (LEA)-like protein in oxidative stress tolerance. Plant J. 2006, 48, 743–756. [Google Scholar] [CrossRef]
  45. Olvera-Carrillo, Y.; Campos, F.; Reyes, J.L.; Garciarrubio, A.; Covarrubias, A.A. Functional analysis of the group 4 late embryogenesis abundant proteins reveals their relevance in the adaptive response during water deficit in Arabidopsis. Plant Physiol. 2010, 154, 373–390. [Google Scholar] [CrossRef] [PubMed] [Green Version]
  46. Yang, W.; Chen, S.; Cheng, Y.; Zhang, N.; Ma, Y.; Wang, W.; Tian, H.; Li, Y.; Hussain, S.; Wang, S. Cell wall/vacuolar inhibitor of fructosidase 1 regulates ABA response and salt tolerance in Arabidopsis. Plant Signal. Behav. 2020, 15, 1744293. [Google Scholar] [CrossRef] [PubMed]
  47. Rietz, S.; Dermendjiev, G.; Oppermann, E.; Tafesse, F.G.; Effendi, Y.; Holk, A.; Parker, J.E.; Teige, M.; Scherer, G.F. Roles of Arabidopsis patatin-related phospholipases a in root development are related to auxin responses and phosphate deficiency. Mol. Plant 2010, 3, 524–538. [Google Scholar] [CrossRef] [PubMed]
  48. Neuteboom, L.W.; Veth-Tello, L.M.; Clijdesdale, O.R.; Hooykaas, P.J.; van der Zaal, B.J. A novel subtilisin-like protease gene from Arabidopsis thaliana is expressed at sites of lateral root emergence. DNA Res. 1999, 6, 13–19. [Google Scholar] [CrossRef] [PubMed] [Green Version]
  49. Lemtiri-Chlieh, F.; Arold, S.T.; Gehring, C. Mg2+ is a missing link in plant cell Ca2+ signalling and homeostasis—A study on Vicia faba guard cells. Int. J. Mol. Sci. 2020, 21, 3771. [Google Scholar] [CrossRef]
  50. Briskin, D.P.; Poole, R.J. Role of magnesium in the plasma membrane ATPase of red beet. Plant Physiol. 1983, 71, 969–971. [Google Scholar] [CrossRef]
  51. Cordewener, J.; Krüse-Wolters, M.; Wassink, H.; Haaker, H.; Veeger, C. The role of MgATP hydrolysis in nitrogenase catalysis. Eur. J. Biochem. 1988, 172, 739–745. [Google Scholar] [CrossRef]
  52. Nuoffer, C.; Balch, W.E. GTPases: Multifunctional molecular switches regulating vesicular traffic. Annu. Rev. Biochem 1994, 63, 949–990. [Google Scholar] [CrossRef]
  53. Carthew, R.W.; Sontheimer, E.J. Origins and mechanisms of miRNAs and siRNAs. Cell 2009, 136, 642–655. [Google Scholar] [CrossRef] [PubMed] [Green Version]
  54. Contreras-Cubas, C.; Palomar, M.; Arteaga-Vázquez, M.; Reyes, J.L.; Covarrubias, A.A. Non-coding RNAs in the plant response to abiotic stress. Planta 2012, 236, 943–958. [Google Scholar] [CrossRef] [PubMed]
  55. Bai, Q.; Wang, X.; Chen, X.; Shi, G.; Liu, Z.; Guo, C.; Xiao, K. Wheat miRNA TaemiR408 acts as an essential mediator in plant tolerance to Pi deprivation and salt stress via modulating stress-associated physiological processes. Front. Plant Sci. 2018, 9, 499. [Google Scholar] [CrossRef]
  56. Lin, Y.; Lai, Z.; Tian, Q.; Lin, L.; Lai, R.; Yang, M.; Zhang, D.; Chen, Y.; Zhang, Z. Endogenous target mimics down-regulate miR160 mediation of ARF10,-16, and-17 cleavage during somatic embryogenesis in Dimocarpus longan Lour. Front. Plant Sci. 2015, 6, 956. [Google Scholar] [CrossRef] [PubMed] [Green Version]
  57. Tang, F.; Wei, H.; Zhao, S.; Wang, L.; Zheng, H.; Lu, M. Identification of microRNAs involved in regeneration of the secondary vascular system in Populus tomentosa Carr. Front. Plant Sci. 2016, 7, 724. [Google Scholar] [CrossRef] [Green Version]
  58. Meng, F.; Liu, H.; Wang, K.; Liu, L.; Wang, S.; Zhao, Y.; Yin, J.; Li, Y. Development-associated microRNAs in grains of wheat (Triticum aestivum L.). BMC Plant Biol. 2013, 13, 140. [Google Scholar] [CrossRef] [Green Version]
  59. Sun, F.; Guo, G.; Du, J.; Guo, W.; Peng, H.; Ni, Z.; Sun, Q.; Yao, Y. Whole-genome discovery of miRNAs and their targets in wheat (Triticum aestivum L. ). BMC Plant Biol 2014, 14, 142. [Google Scholar] [CrossRef] [Green Version]
  60. Zhu, Q.H.; Helliwell, C.A. Regulation of flowering time and floral patterning by miR172. J. Exp. Bot. 2011, 62, 487–495. [Google Scholar] [CrossRef] [PubMed] [Green Version]
  61. Budak, H.; Akpinar, B.A. Plant miRNAs: Biogenesis, organization and origins. Funct. Integr. Genom. 2015, 15, 523–531. [Google Scholar] [CrossRef]
  62. Akdogan, G.; Tufekci, E.D.; Uranbey, S.; Unver, T. miRNA-based drought regulation in wheat. Funct. Integr. Genom. 2016, 16, 221–233. [Google Scholar] [CrossRef]
  63. Bakhshi, B.; Fard, E.M.; Gharechahi, J.; Safarzadeh, M.; Nikpay, N.; Fotovat, R.; Azimi, M.R.; Salekdeh, G.H. The contrasting microRNA content of a drought tolerant and a drought susceptible wheat cultivar. J. Plant Physiol. 2017, 216, 35–43. [Google Scholar] [CrossRef] [PubMed]
  64. She, K.; Pan, W.; Yan, Y.; Shi, T.; Chu, Y.; Cheng, Y.; Ma, B.; Song, W. Genome-Wide Identification, Evolution and Expressional Analysis of OSCA Gene Family in Barley (Hordeum vulgare L.). Int. J. Mol. Sci. 2022, 23, 13027. [Google Scholar] [CrossRef]
  65. Letunic, I.; Doerks, T.; Bork, P. SMART: Recent updates, new developments and status in 2015. Nucleic Acids Res. 2015, 43, D257–D260. [Google Scholar] [CrossRef]
  66. Marchler-Bauer, A.; Bo, Y.; Han, L.; He, J.; Lanczycki, C.J.; Lu, S.; Chitsaz, F.; Derbyshire, M.K.; Geer, R.C.; Gonzales, N.R.; et al. CDD/SPARCLE: Functional classification of proteins via subfamily domain architectures. Nucleic Acids Res. 2017, 45, D200–D203. [Google Scholar] [CrossRef] [Green Version]
  67. Gasteiger, E.; Hoogland, C.; Gattiker, A.; Wilkins, M.R.; Appel, R.D.; Bairoch, A. Protein identification and analysis tools on the ExPASy server. In The Proteomics Protocols Handbook; Humana Press: New York, NY, USA, 2005; pp. 571–607. [Google Scholar]
  68. Yu, C.S.; Chen, Y.C.; Lu, C.H.; Hwang, J.K. Prediction of protein subcellular localization. Proteins: Struct. Funct. Bioinform. 2006, 64, 643–651. [Google Scholar] [CrossRef] [PubMed]
  69. Suyama, M.; Torrents, D.; Bork, P. PAL2NAL: Robust conversion of protein sequence alignments into the corresponding codon alignments. Nucleic Acids Res. 2006, 34 (Suppl. 2), W609–W612. [Google Scholar] [CrossRef] [PubMed] [Green Version]
  70. Gaut, B.S.; Morton, B.R.; McCaig, B.C.; Clegg, M.T. Substitution rate comparisons between grasses and palms: Synonymous rate differences at the nuclear gene Adh parallel rate differences at the plastid gene rbcL. Proc Natl Acad Sci. USA 1996, 93, 10274–10279. [Google Scholar] [CrossRef] [PubMed] [Green Version]
  71. Kumar, S.; Stecher, G.; Li, M.; Knyaz, C.; Tamura, K. MEGA X: Molecular evolutionary genetics analysis across computing platforms. Mol. Biol. Evol. 2018, 35, 1547. [Google Scholar] [CrossRef]
  72. Haas, B.J.; Papanicolaou, A.; Yassour, M.; Grabherr, M.; Blood, P.D.; Bowden, J.; Couger, M.B.; Eccles, D.; Li, B.; Lieber, M.; et al. De novo transcript sequence reconstruction from RNA-seq using the Trinity platform for reference generation and analysis. Nat. Protoc. 2013, 8, 1494–1512. [Google Scholar] [CrossRef] [PubMed]
  73. Papatheodorou, I.; Fonseca, N.A.; Keays, M.; Tang, Y.A.; Barrera, E.; Bazant, W.; Burke, M.; Füllgrabe, A.; Fuentes, A.M.P.; George, N.; et al. Expression Atlas: Gene and protein expression across multiple studies and organisms. Nucleic Acids Res. 2018, 46, D246–D251. [Google Scholar] [CrossRef] [PubMed]
  74. Seo, J.; Gordish-Dressman, H.; Hoffman, E.P. An interactive power analysis tool for microarray hypothesis testing and generation. Bioinformatics 2006, 22, 808–814. [Google Scholar] [CrossRef] [PubMed] [Green Version]
  75. Shumayla; Mendu, V.; Singh, K.; Upadhyay, S.K. Insight into the Roles of Proline-Rich Extensin-like Receptor Protein Kinases of Bread Wheat (Triticum aestivum L.). Life 2022, 12, 941. [Google Scholar] [CrossRef] [PubMed]
  76. Livak, K.J.; Schmittgen, T.D. Analysis of relative gene expression data using real-time quantitative PCR and the 2−ΔΔCT method. Methods 2001, 25, 402–408. [Google Scholar] [CrossRef] [PubMed]
  77. Nazarov, P.; Muller, A.; Khutko, V.; Vallar, L. Co-Expression Analysis of Large Microarray Data Sets Using CoExpress Software Tool. In Proceedings of the Conference: WCSB 2010, Luxembourg, 16–18 June 2010. [Google Scholar]
  78. Conesa, A.; Götz, S. Blast2GO: A comprehensive suite for functional analysis in plant genomics. Int. J. Plant Genom. 2008, 2008, 619832. [Google Scholar] [CrossRef] [Green Version]
  79. Bastian, M.; Heymann, S.; Jacomy, M. Gephi: An open source software for exploring and manipulating networks visualization and exploration of large graphs. In Proceedings of the Third International AAAI Conference on Weblogs and Social Media, San Jose, CA, USA, 17–20 May 2009. [Google Scholar]
  80. Franceschini, A.; Szklarczyk, D.; Frankild, S.; Kuhn, M.; Simonovic, M.; Roth, A.; Lin, J.; Minguez, P.; Bork, P.; Von Mering, C.; et al. STRING v9. 1: Protein-protein interaction networks, with increased coverage and integration. Nucleic Acids Res. 2012, 41, D808–D815. [Google Scholar] [CrossRef] [Green Version]
  81. Kuhn, M.; Szklarczyk, D.; Franceschini, A.; Von Mering, C.; Jensen, L.J.; Bork, P. STITCH 3: Zooming in on protein–chemical interactions. Nucleic Acids Res. 2012, 40, D876–D880. [Google Scholar] [CrossRef] [PubMed] [Green Version]
  82. Dai, X.; Zhuang, Z.; Zhao, P.X. psRNATarget: A plant small RNA target analysis server (2017 release). Nucleic Acids Res. 2018, 46, W49–W54. [Google Scholar] [CrossRef]
Figure 1. Chromosomal localization and duplication analysis of OSCA genes in Triticum aestivum. The TaOSCA genes are distributed on a total of 15 chromosomes of the A, B, and D subgenomes of T. aestivum. Blue lines point toward the existence of segmentally duplicated genes and yellow delineated shapes indicate the existence of tandemly duplicated gene pairs.
Ijms 23 14867 g001
Figure 2. Phylogenetic tree analysis of A. thaliana, O. sativa, and T. aestivum using full-length peptide of OSCAs. The figure shows the phylogenetic tree of OSCA built by the neighbor-joining approach with 1000 bootstrap values using MEGA X software. The phylogenetic tree displays the clustering of the OSCA proteins of three plant species in different clades I–IV; each clade is colored differently.
Ijms 23 14867 g002
Figure 3. Expression profiling of TaOSCA genes of T. aestivum in various tissue and developmental stages. The heat map shows the clustering and expression profiling of OSCA genes of T. aestivum. The color bar depicts upregulated and downregulated expression with red and green color, respectively.
Ijms 23 14867 g003
Figure 4. Expression profiling of OSCA genes of T. aestivum under abiotic and biotic stress conditions. Heat maps (AC) show the expression profiles of two-fold up and down-regulated genes under (A) drought stress (DS), heat stress (HS), and HD (heat–drought), (B) salt stress, and (C) Blumeria graminis (Bgt) and Puccinia striiformis (Pst) infestation, respectively. The color bar shows high and low expressions with red and green color, respectively.
Ijms 23 14867 g004
Figure 5. qRT-PCR analysis. Expression analysis of six TaOSCA genes was performed using qRT-PCR. Bar graphs show the expression trends of selected genes at 6, 12, 24, and 48 h of CaCl2 treatment. The bar graphs represent the fold change of each gene expression and the vertical lines indicate the standard deviation.
Ijms 23 14867 g005
Figure 6. The interaction network analysis of OSCA genes with co-expressed genes was generated by using Gephi 0.9.1. The interaction network (A) shows co-expression in various tissues and developmental stages. The interaction network (B) shows the co-expression in the presence of HS, DS, and HS, (C) in salt, and (D) in biotic stress.
Ijms 23 14867 g006
Figure 7. Interaction analysis of OSCA proteins using the STRING and STITCH servers. The networks (A) show the protein–protein interactions, where TaOSCA proteins are marked with blue and predicted interacting proteins are marked with red. The network (B) shows the protein–chemical interactions, where TaOSCA proteins are marked with blue and predicted interacting chemicals are marked with red. The networks were developed using the Cytoscape software.
Ijms 23 14867 g007
Figure 8. miRNA interaction analysis. The interaction network (A) of known miRNA of T. aestivum with TaOSCA genes. The prediction and generation of the network were performed by psRNAtarget tool and Cytoscape software, respectively. (B) shows the arrangement of miRNA target sites on TaOSCA genes. The colored boxes represent the predicted miRNAs of T. aestivum.
Ijms 23 14867 g008
Table 1. The Ka/Ks ratios and divergence times of duplicated TaOSCA gene pairs.
Gene AGene BKaKsKa/KsT = Ks/2rSelection Pressure
TaOSCA4-ATaOSCA6-B0.08850.50330.175813.5 MYAPurifying
TaOSCA1-BTaOSCA2-D0.06970.24130.288622.2 MYAPurifying
TaOSCA12-BTaOSCA13-B0.12970.30290.428232.9 MYAPurifying
Ka, non-synonymous substitutions per non-synonymous site; Ks, synonymous substitutions per synonymous site; T, divergence time.
Table 2. Tajima’s relative rate tests of paralogous genes.
Group AGroup BOutgroupNtNaNbχ2p
TaOSCA4-ATaOSCA6-BTaOSCA11-B931061.000.31731
TaOSCA1-BTaOSCA2-DTaOSCA5-B20113150.140.70546
TaOSCA12-BTaOSCA13-BTaOSCA11-D11213110.170.68309
Nt, identical sites in all three sequences; Na, unique differences in sequence A; Nb, unique differences in sequence B.
Publisher’s Note: MDPI stays neutral with regard to jurisdictional claims in published maps and institutional affiliations.

