GWAS of Reproductive Traits in Large White Pigs on Chip and Imputed Whole-Genome Sequencing Data
Abstract
1. Introduction
2. Results
2.1. Descriptive Statistics of Phenotypic Data
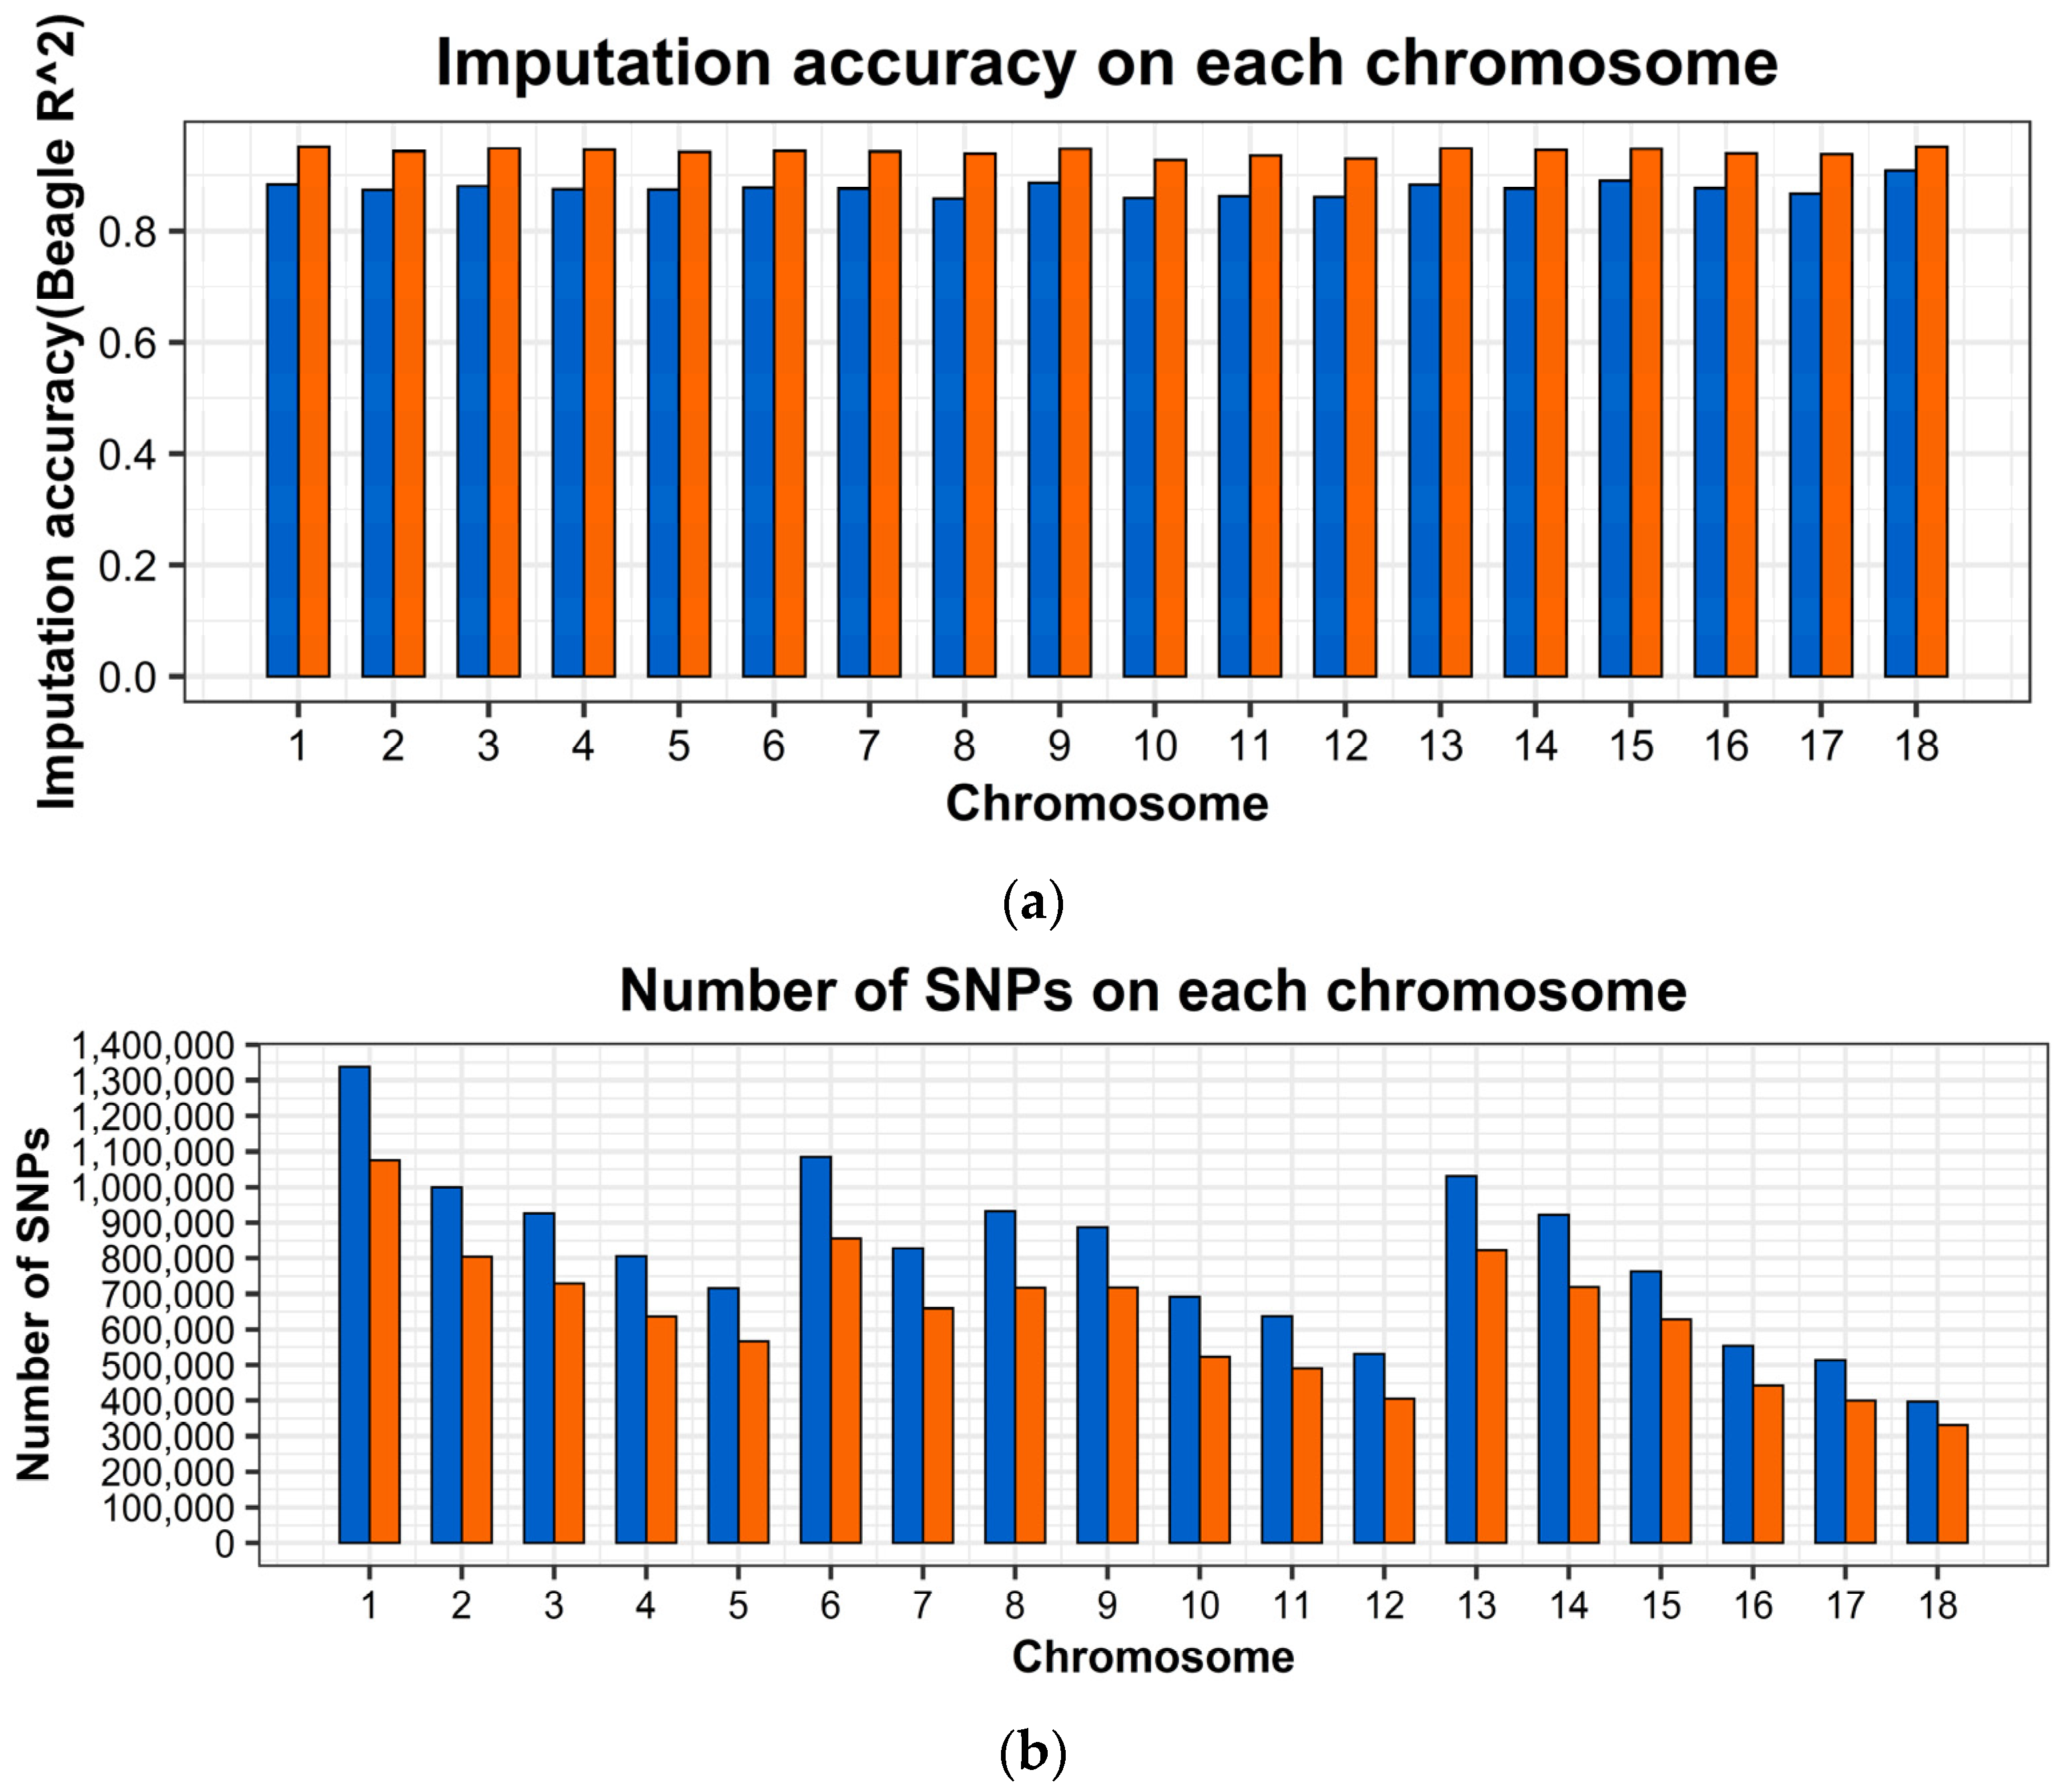
2.2. Genotype Imputation and Imputation Accuracy
2.3. Genome-Wide Association Studies
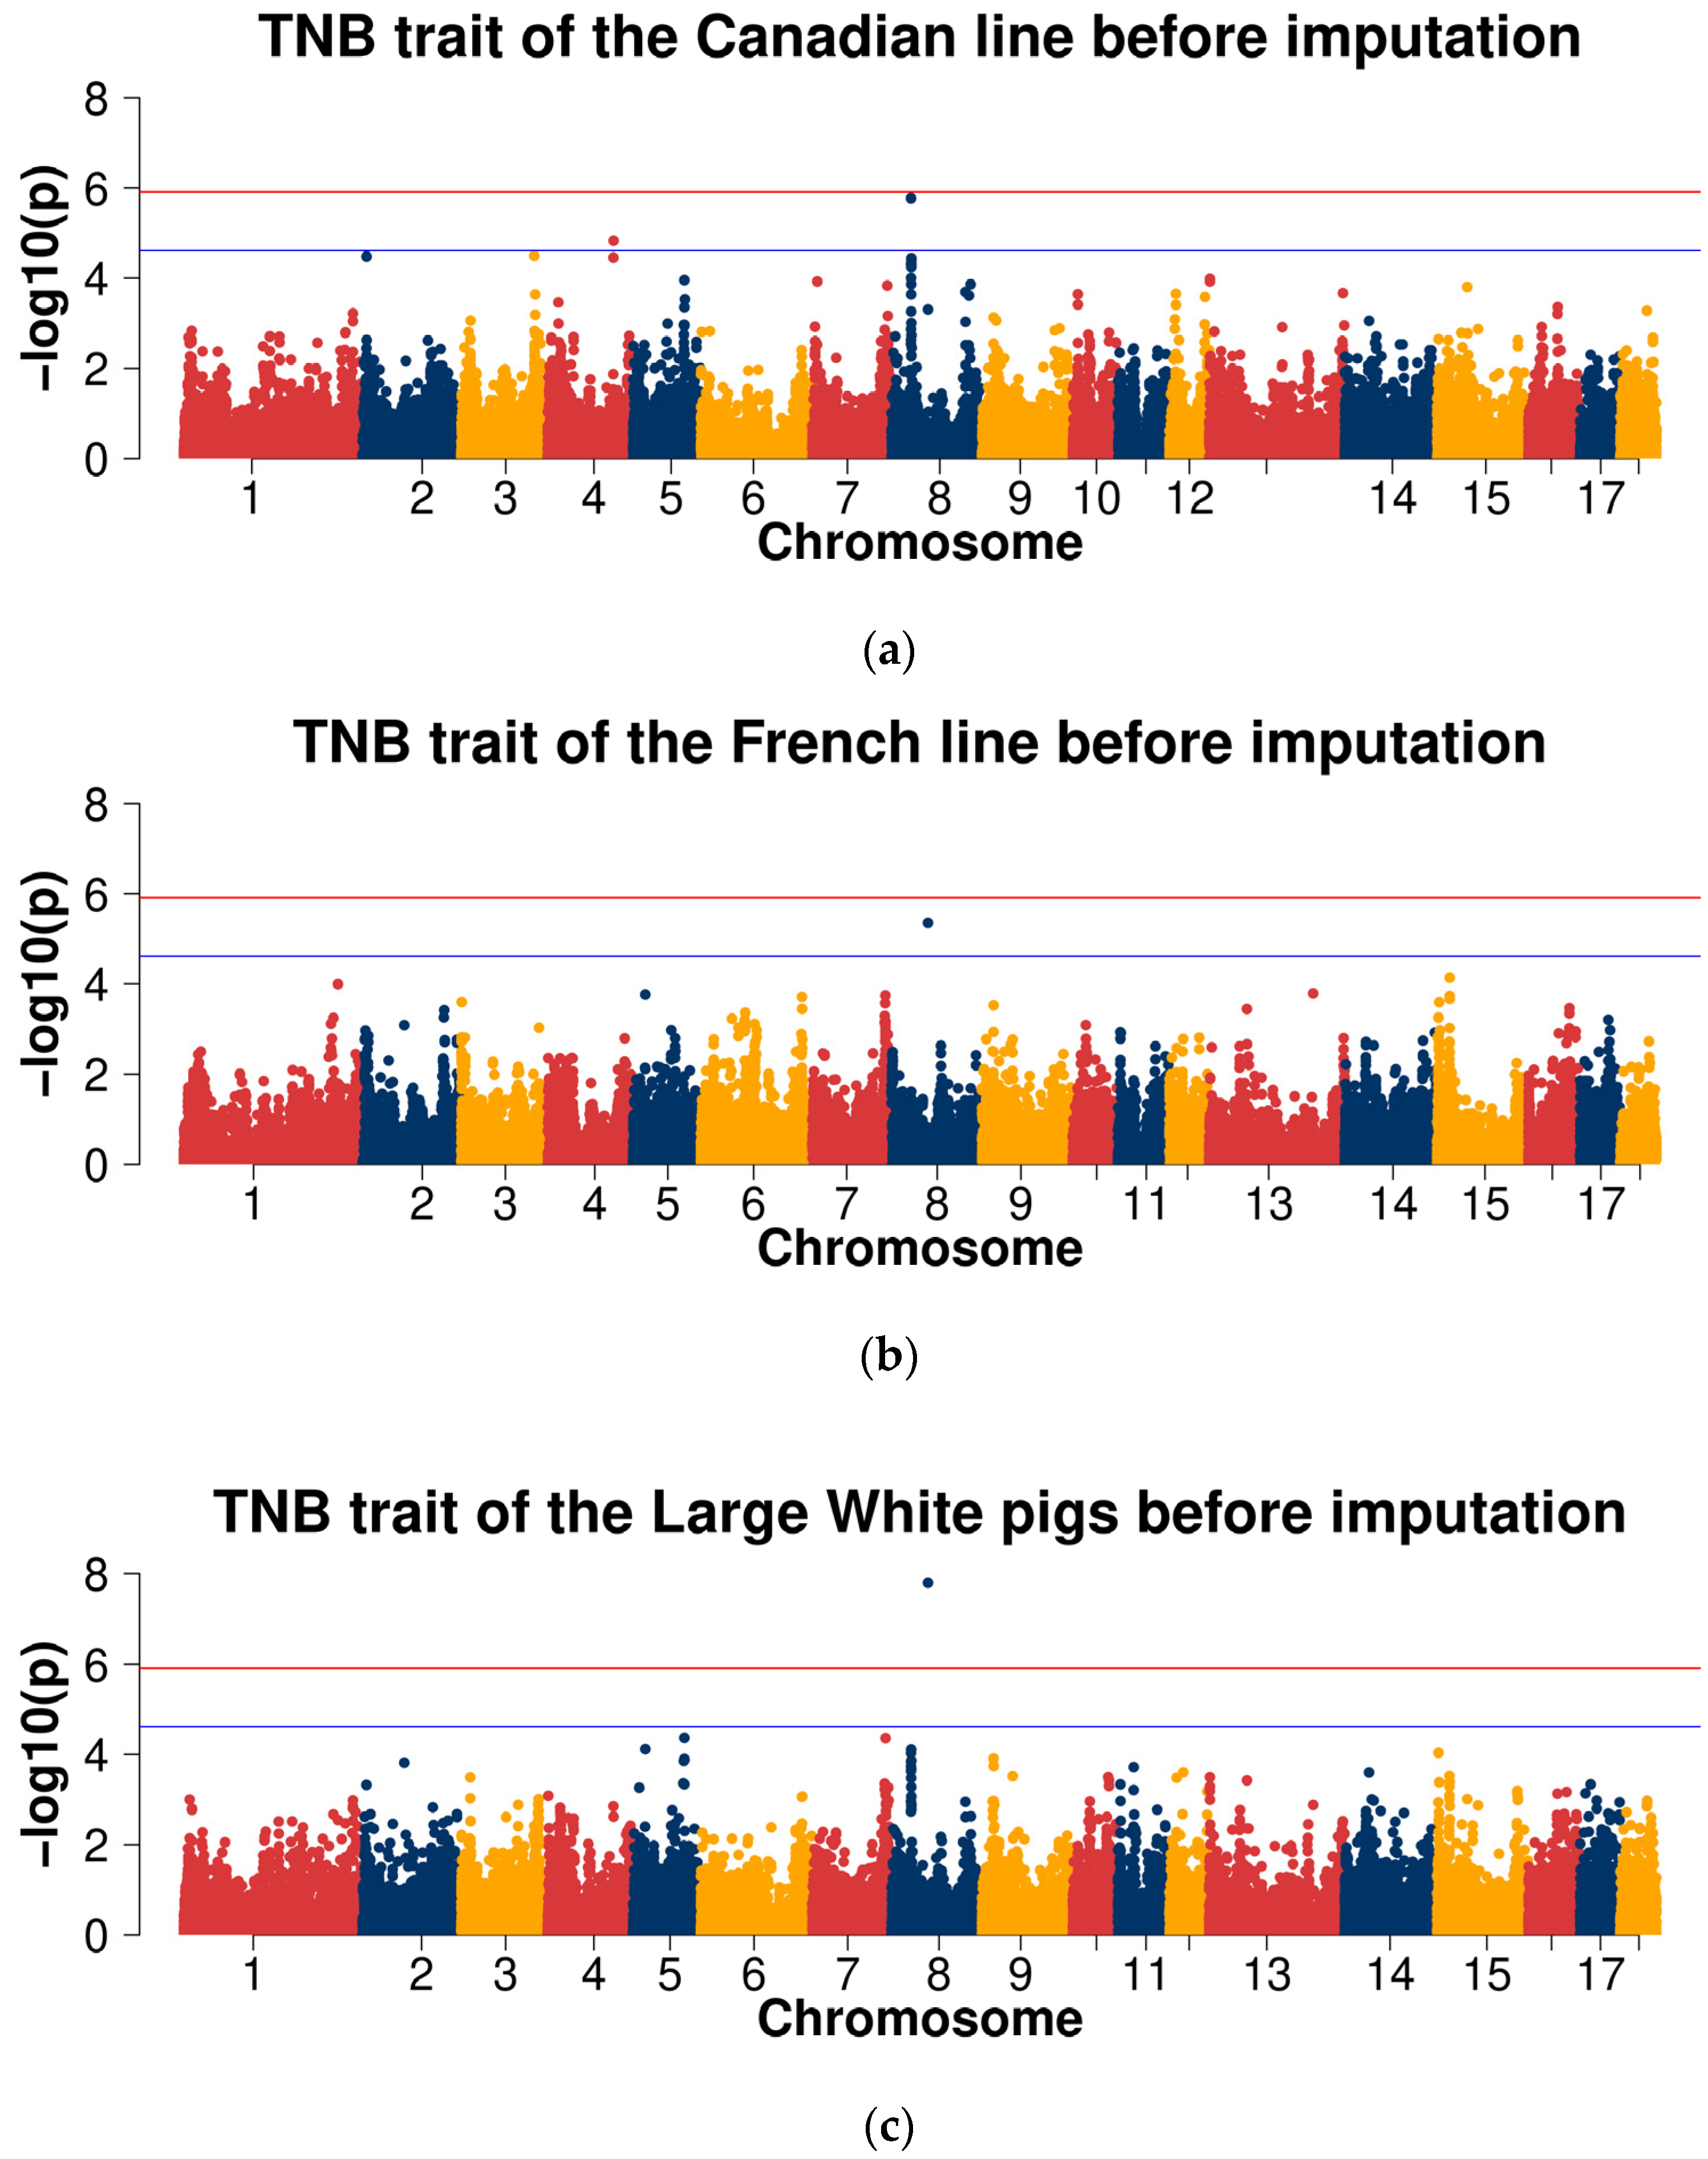
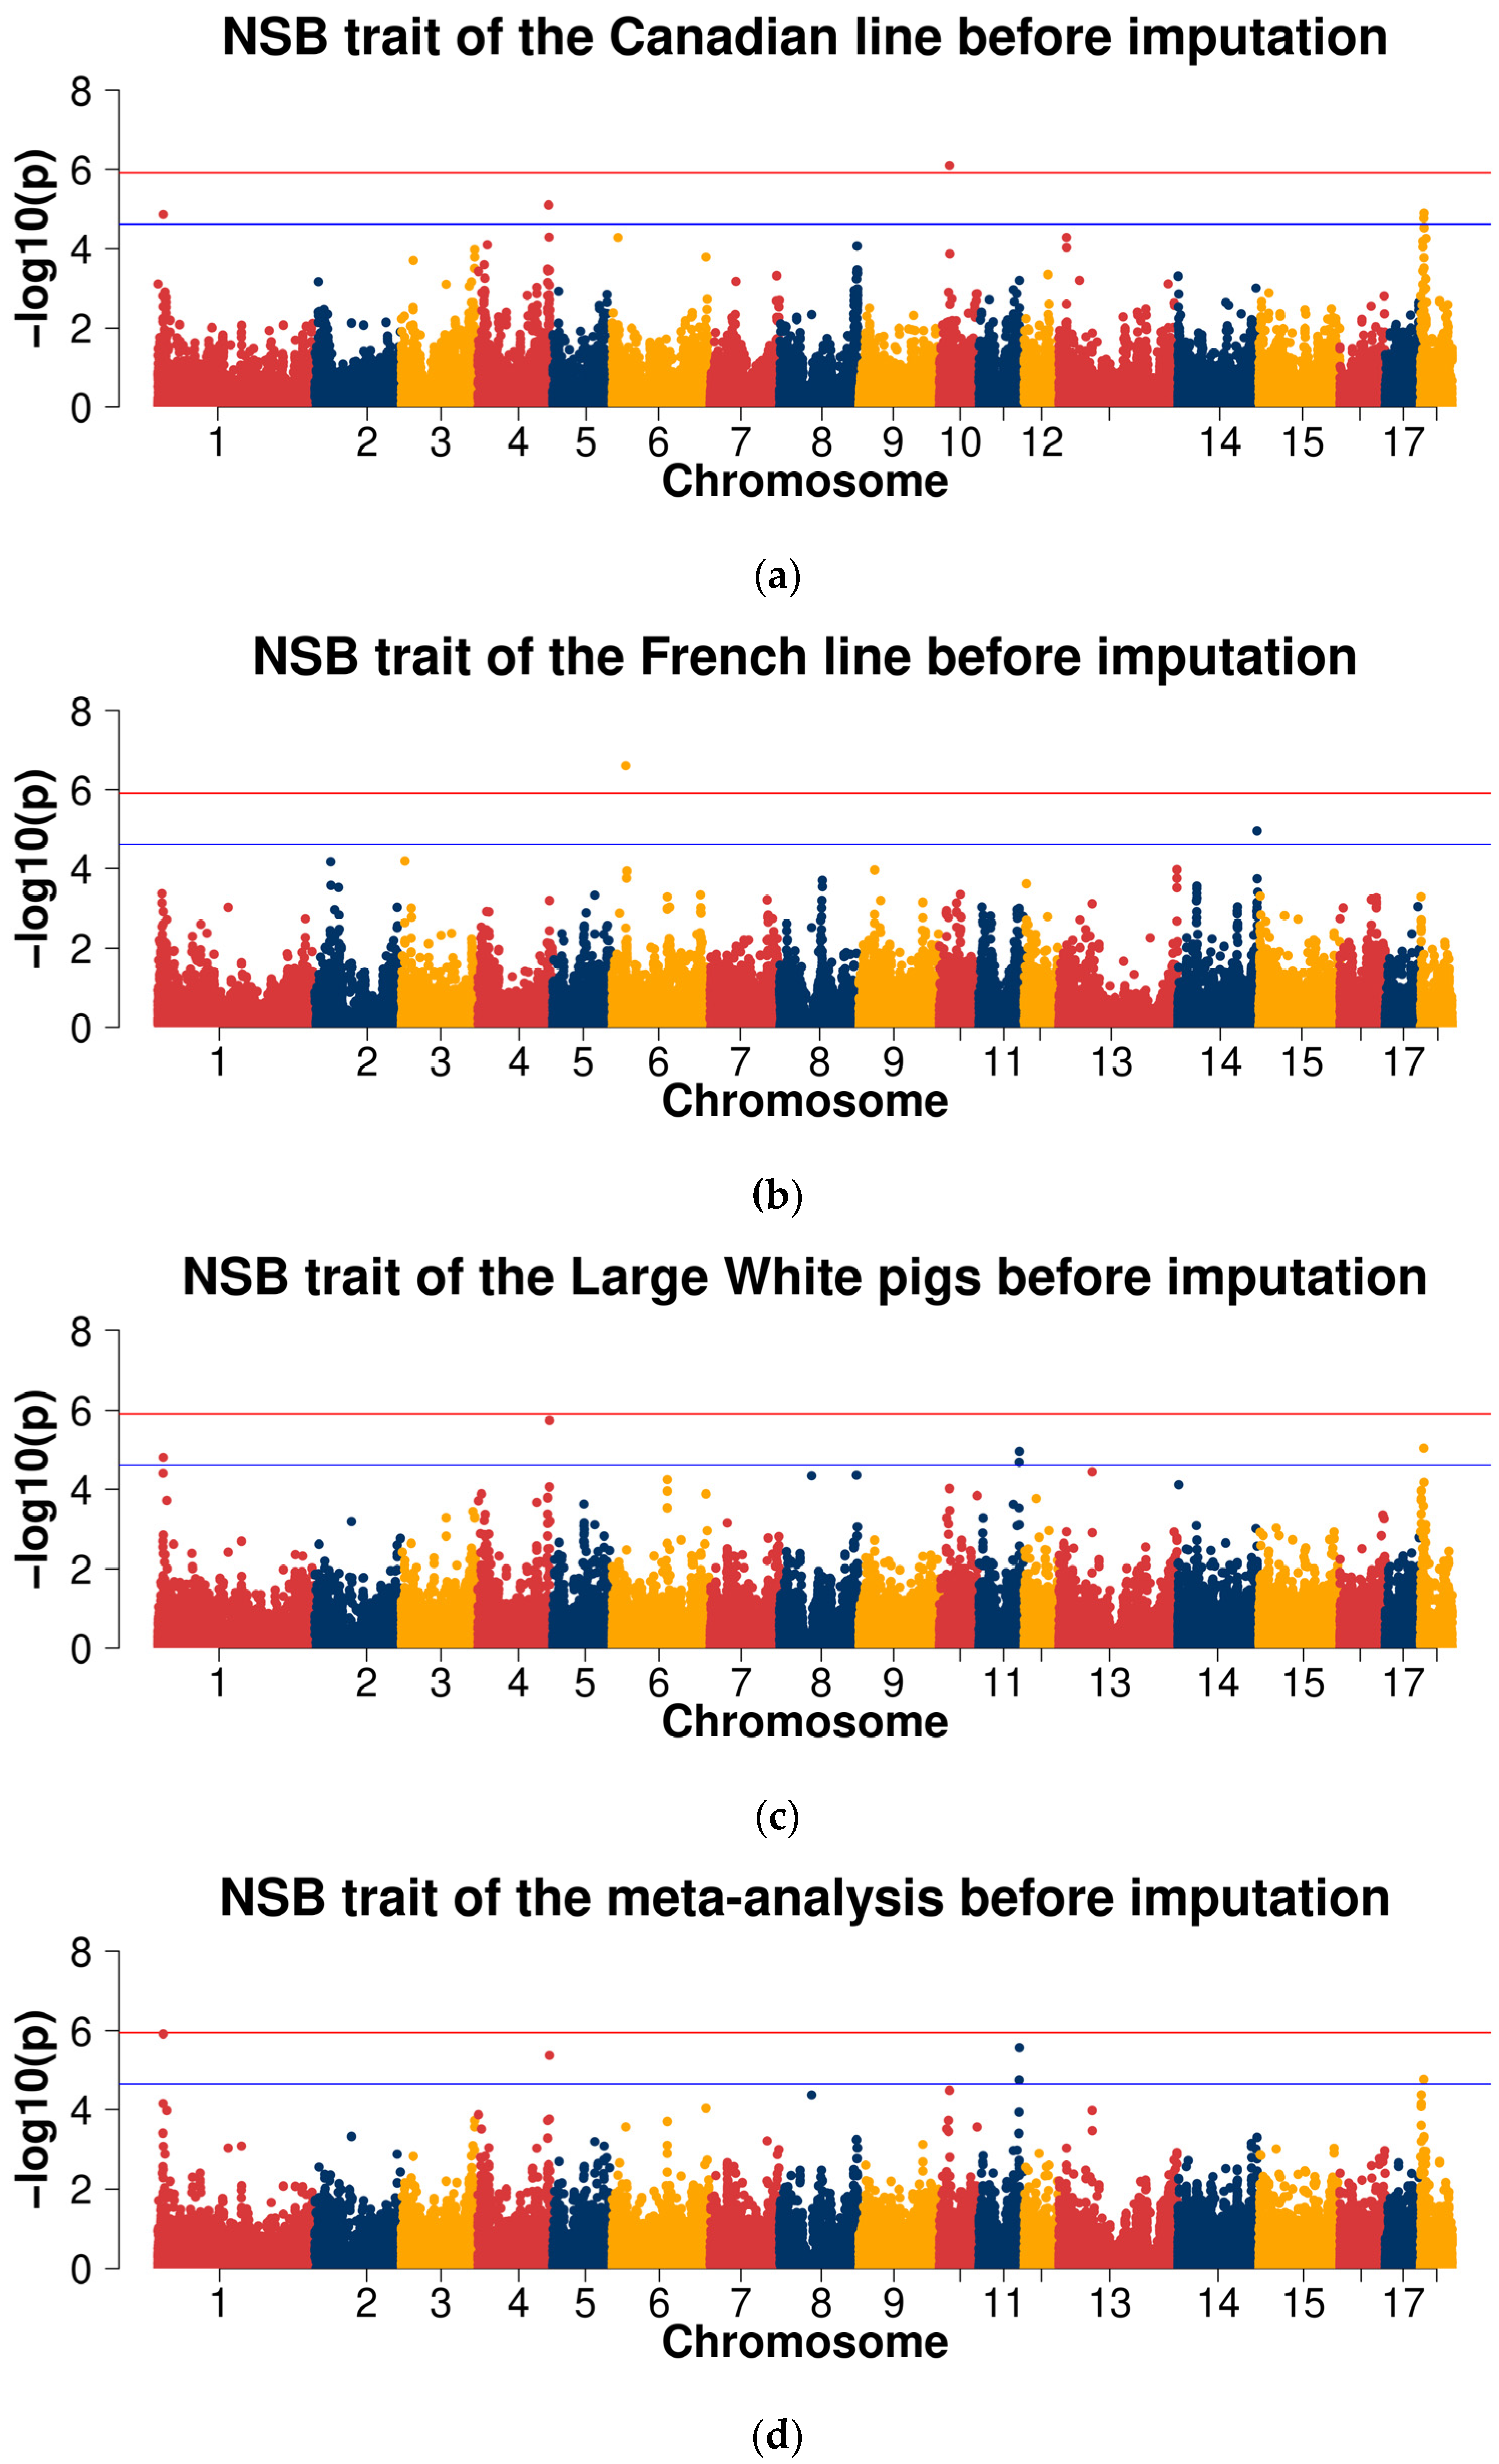
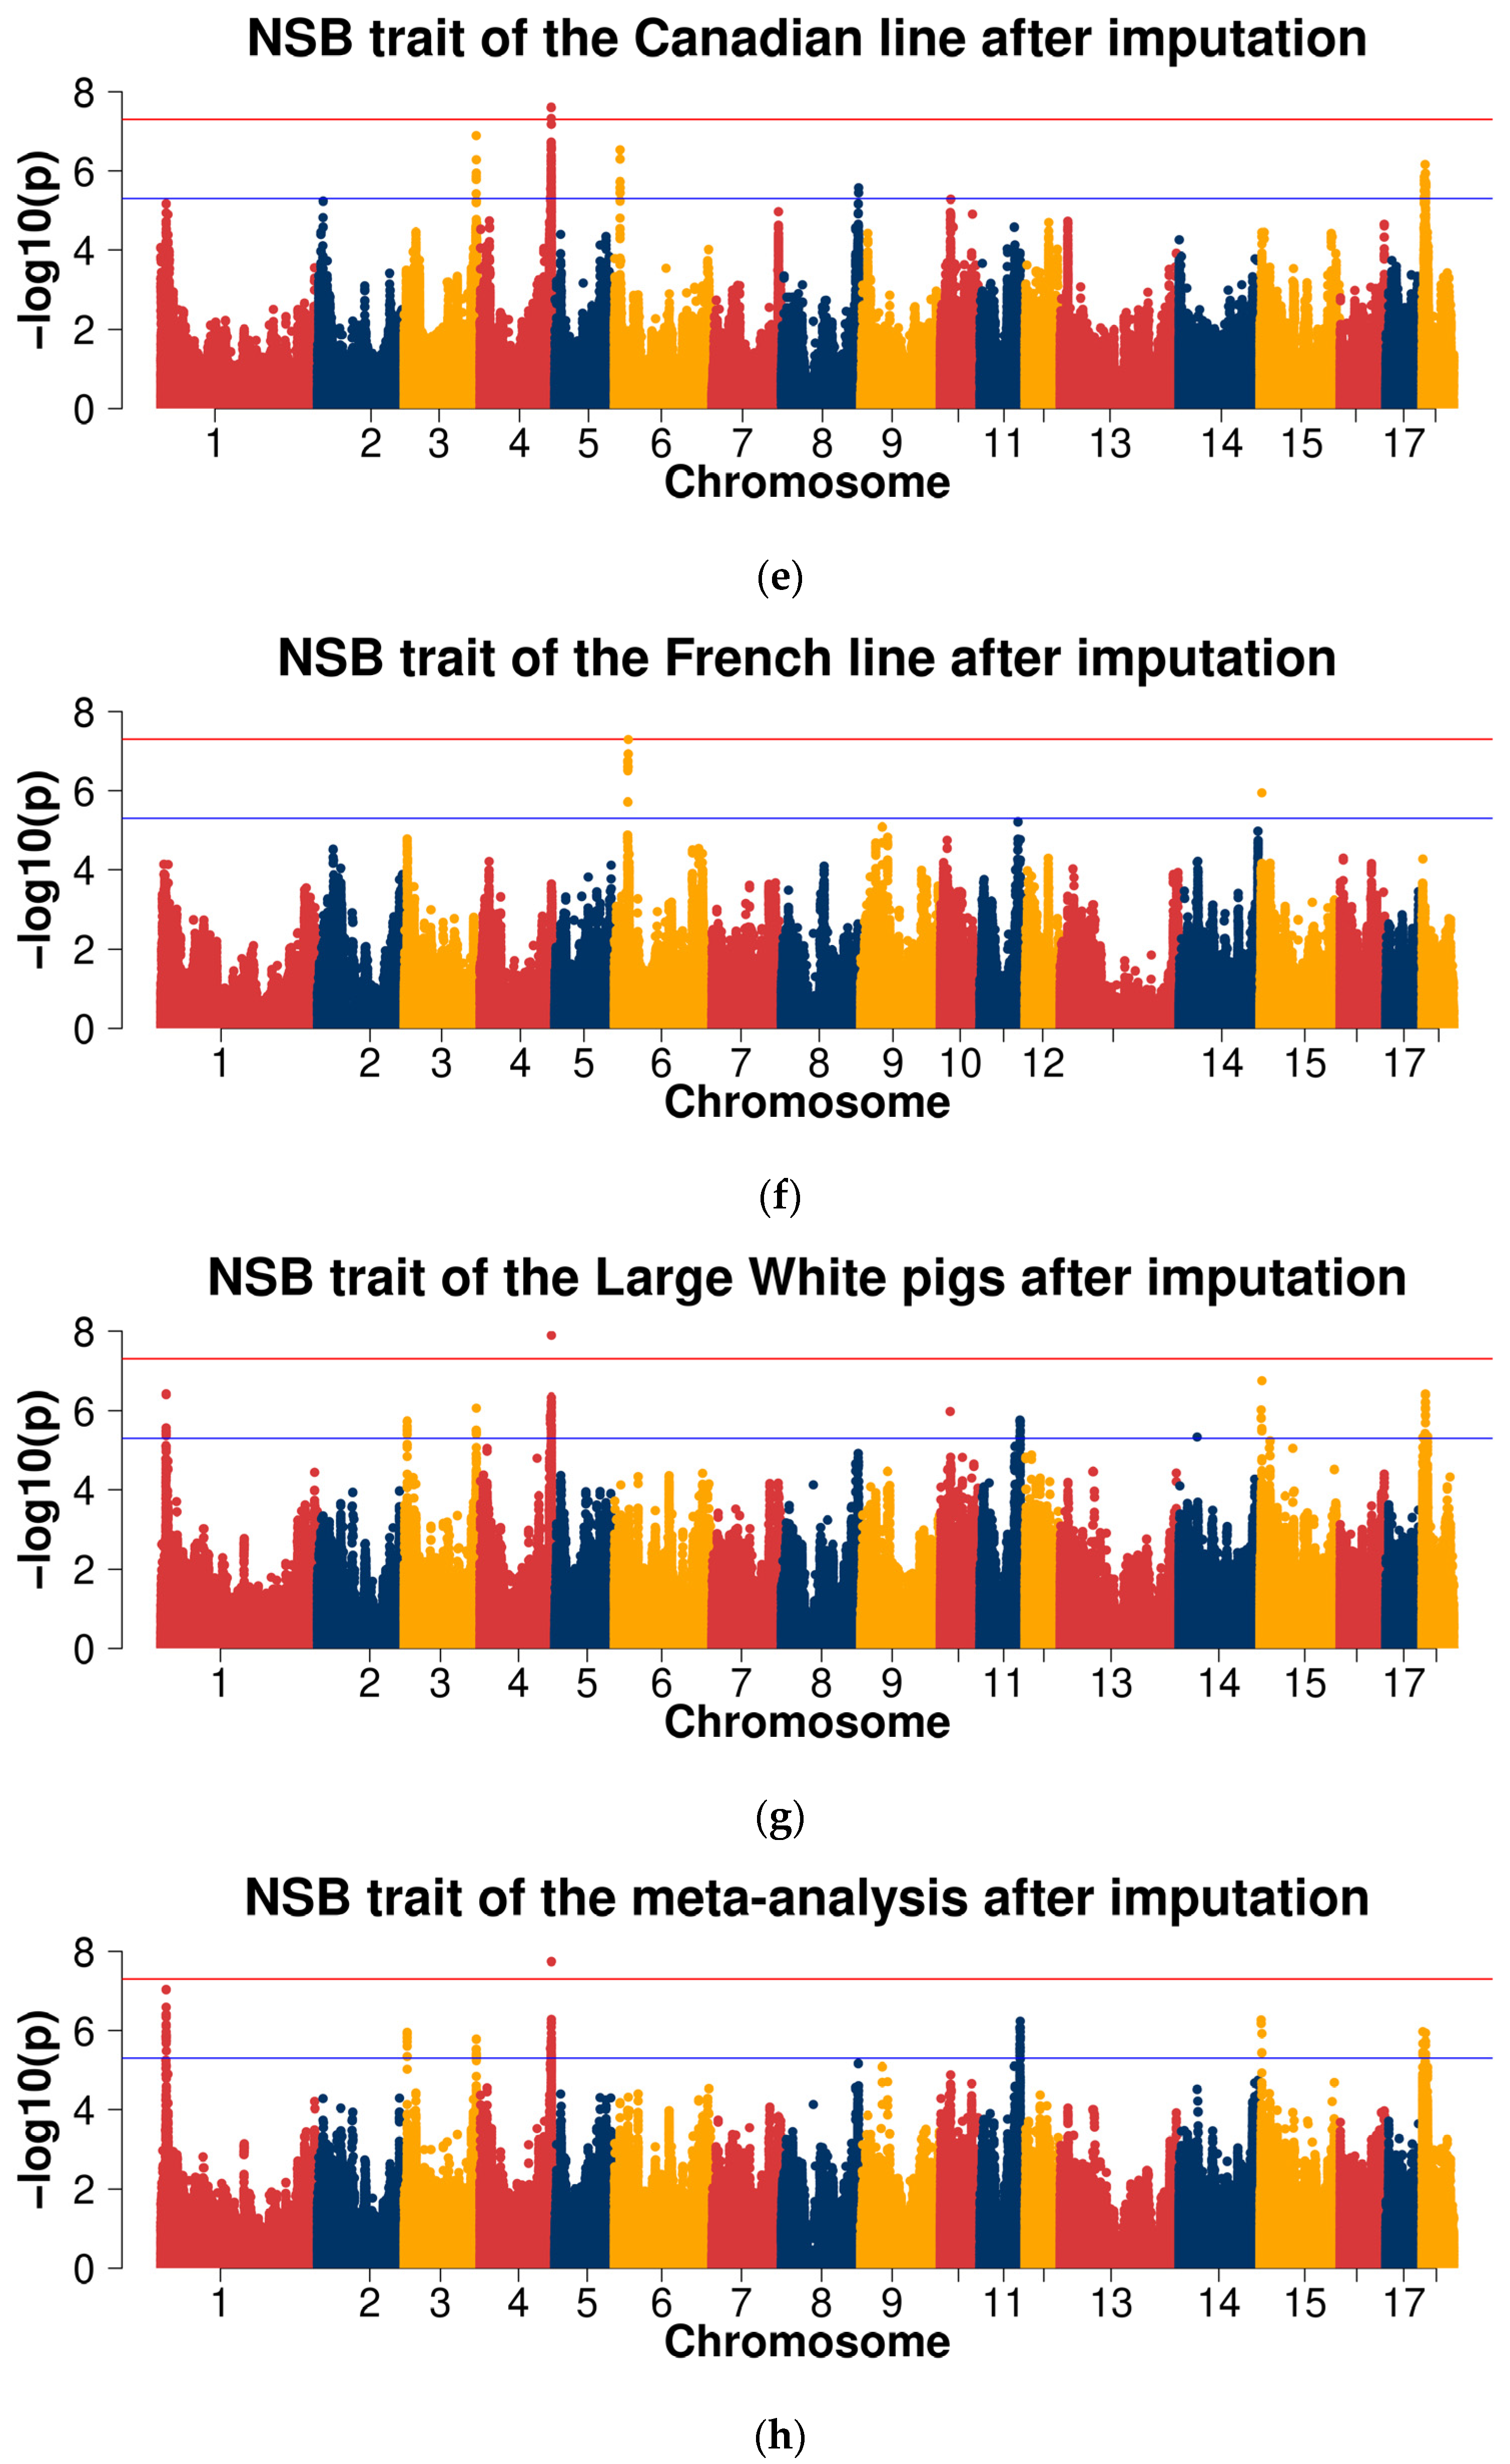
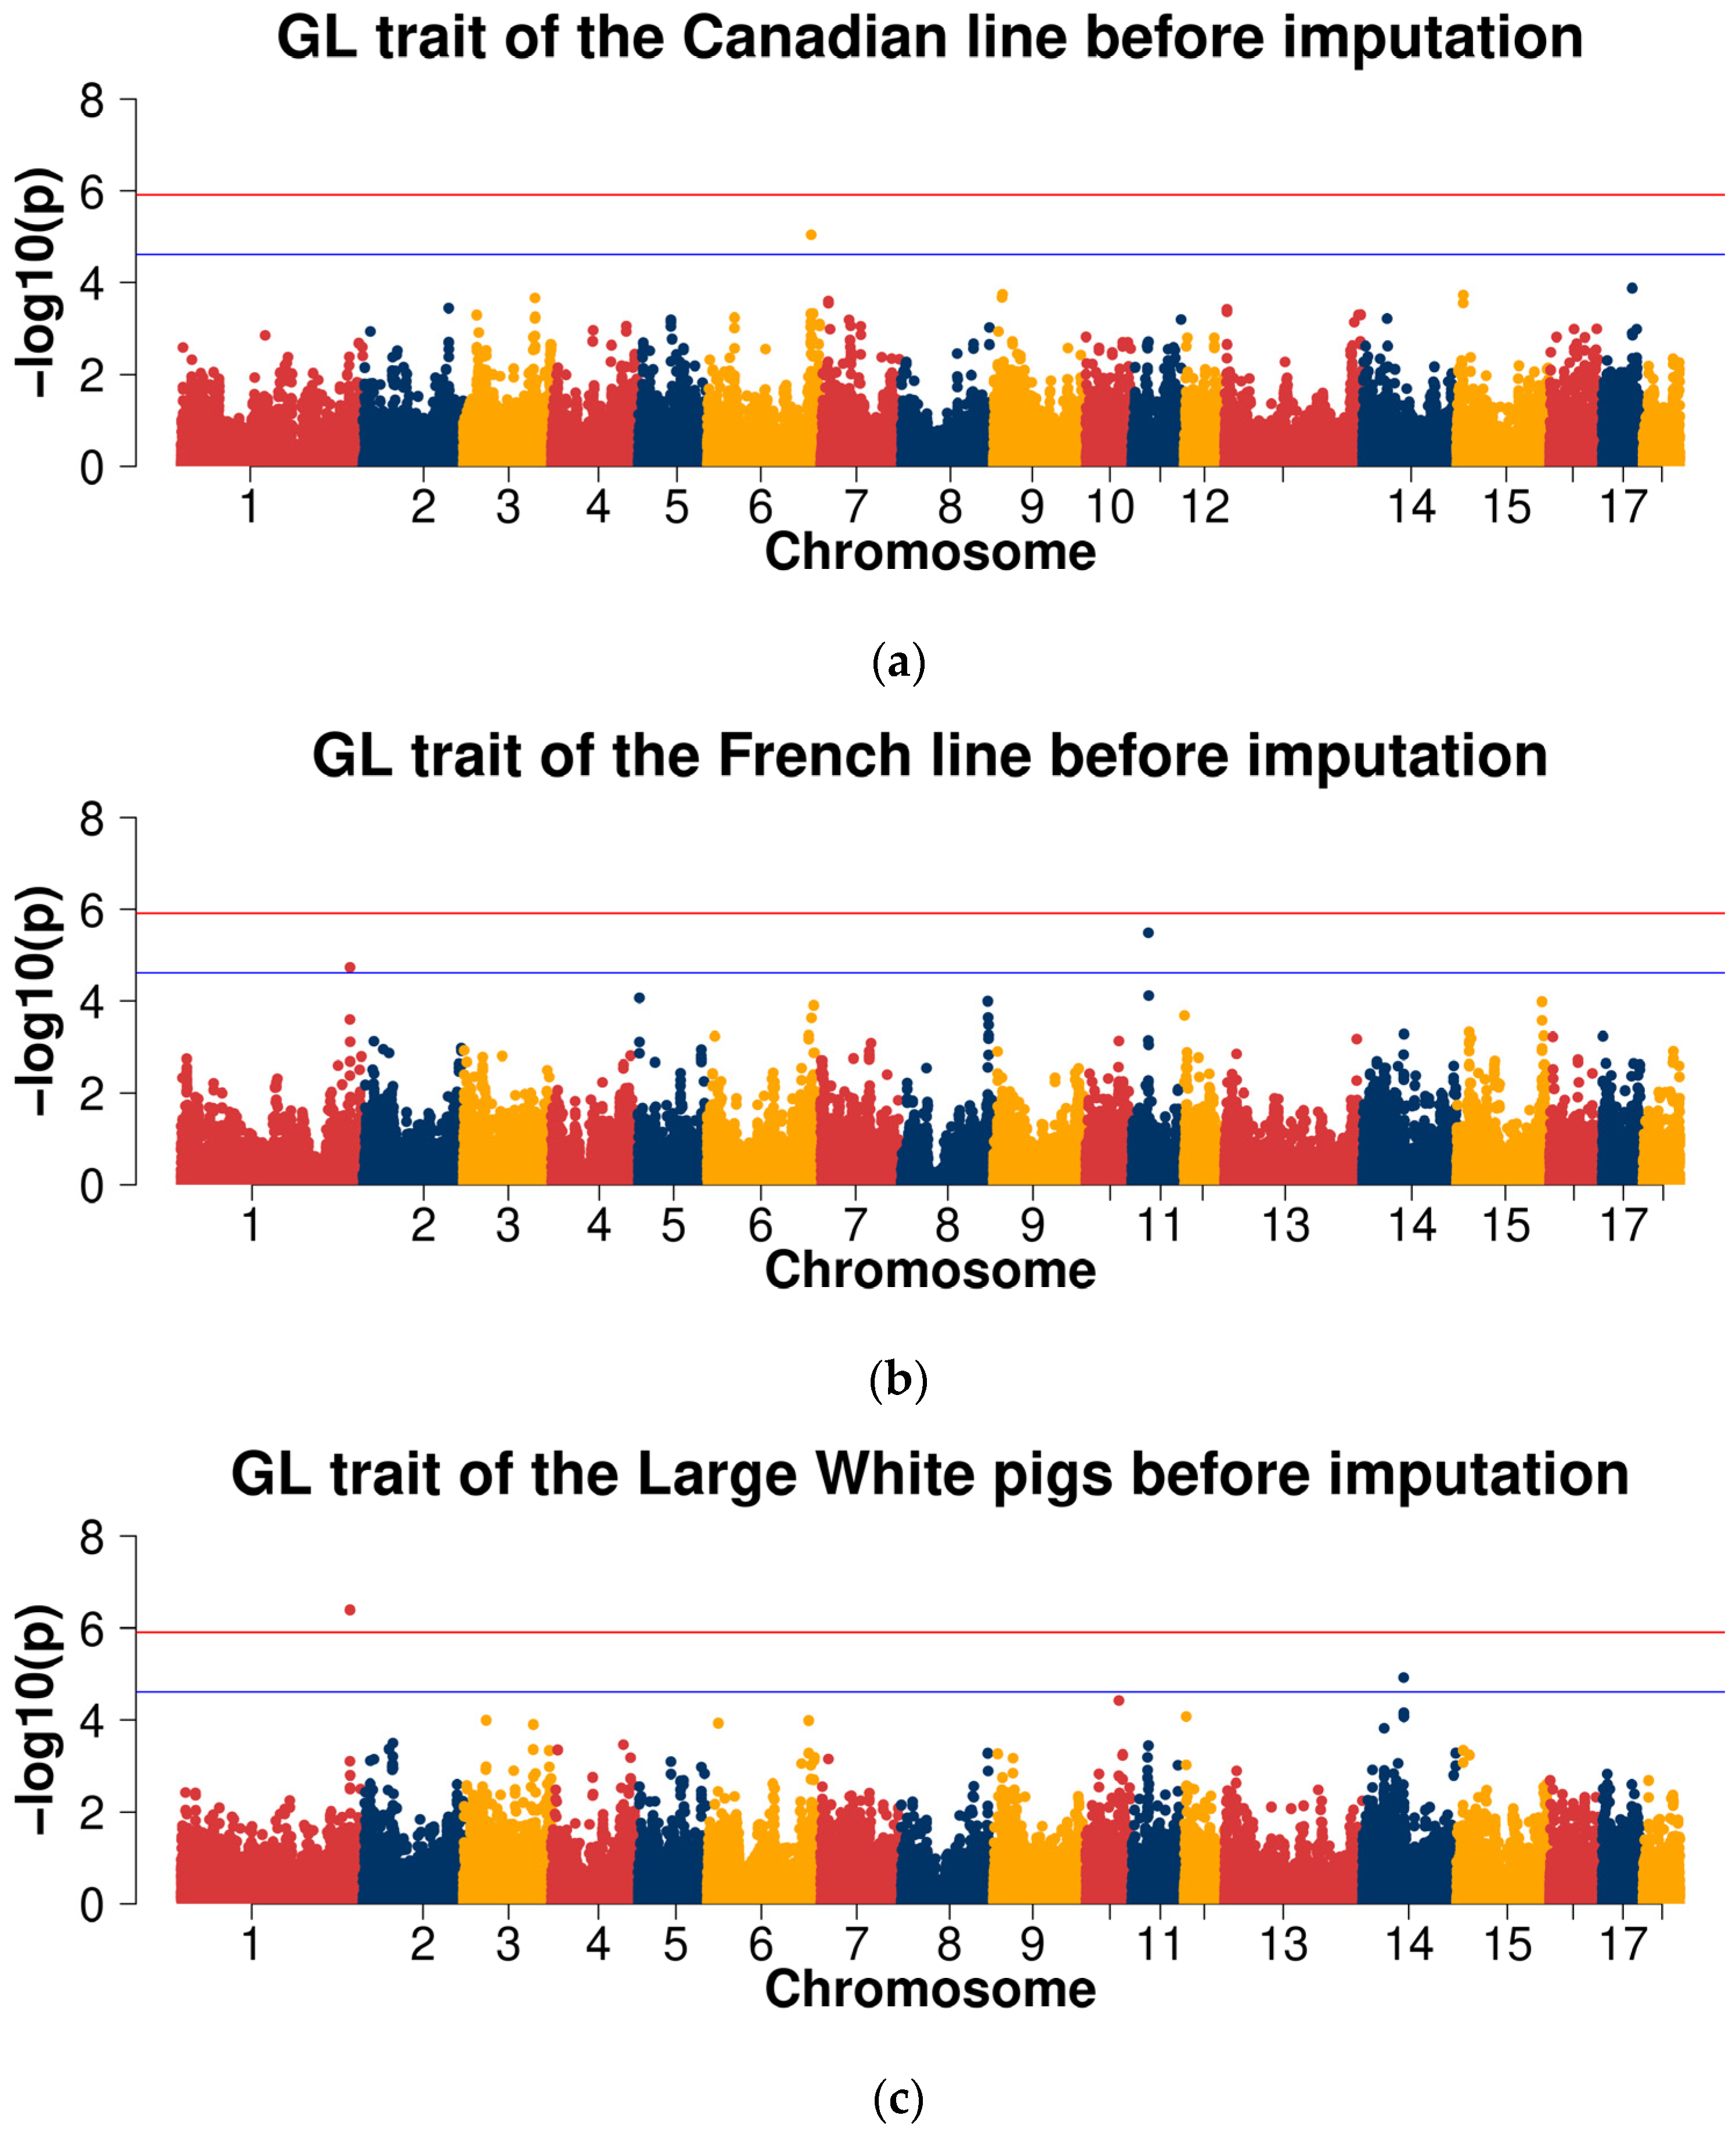
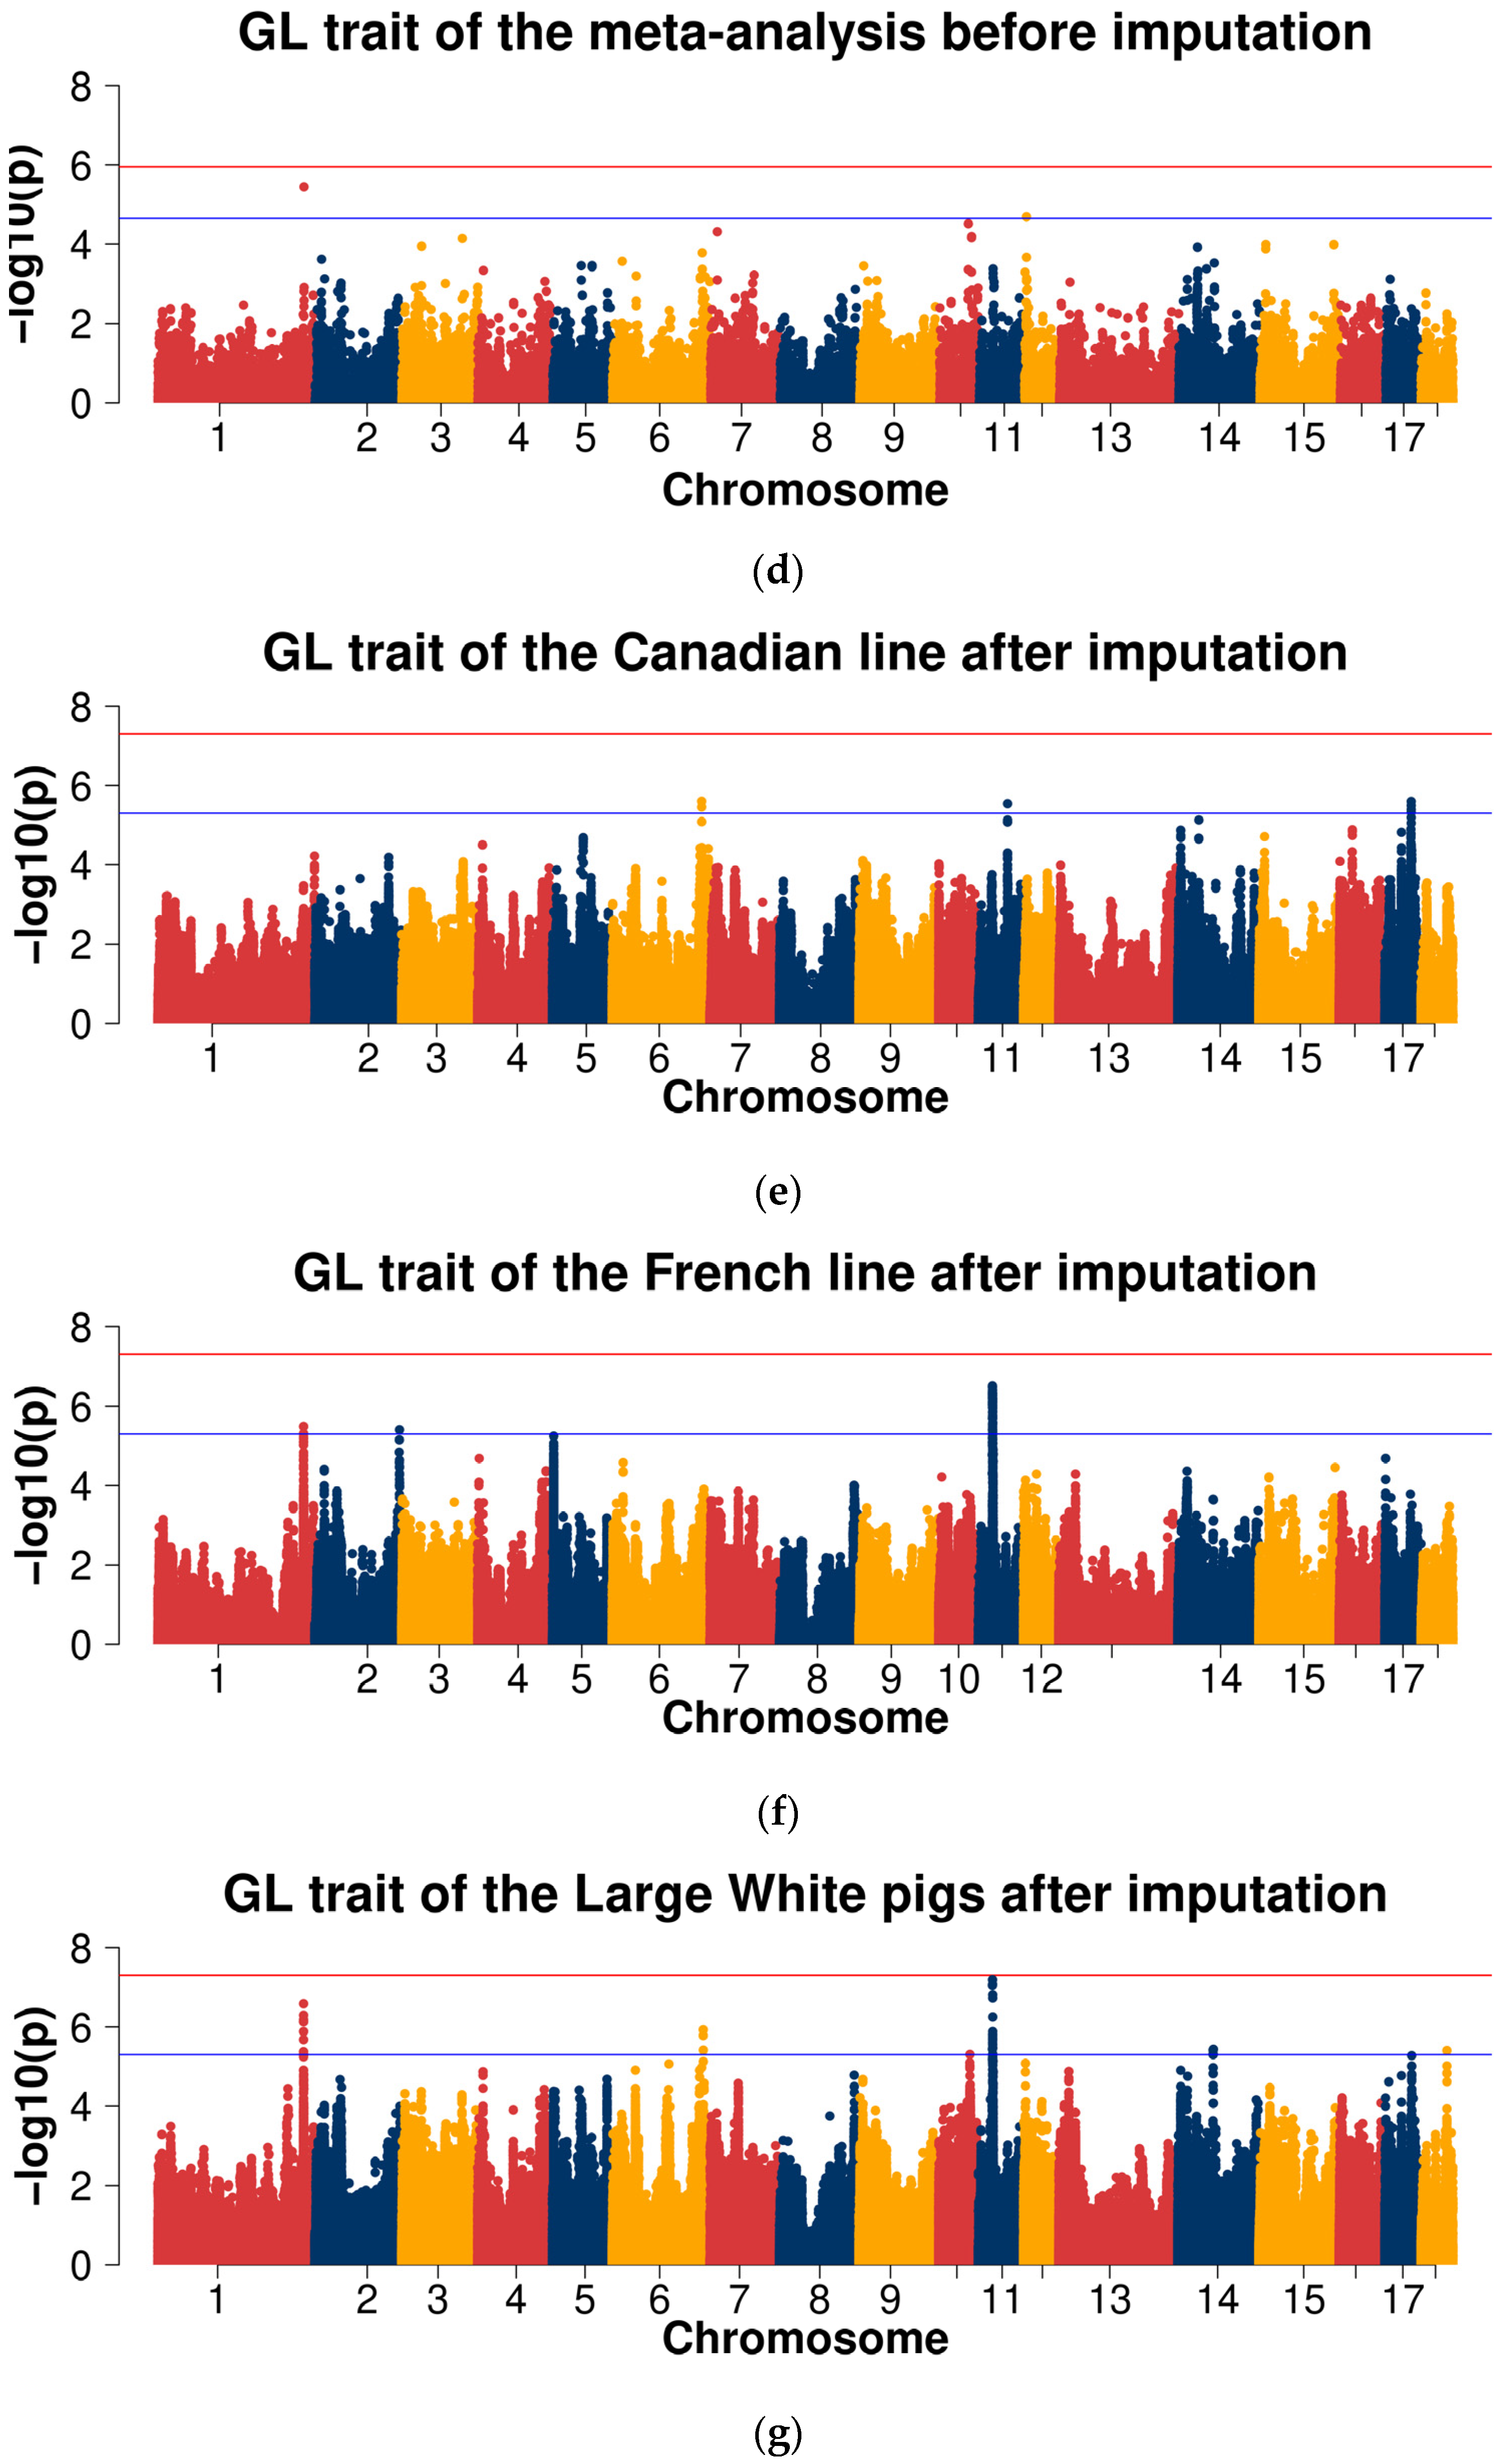
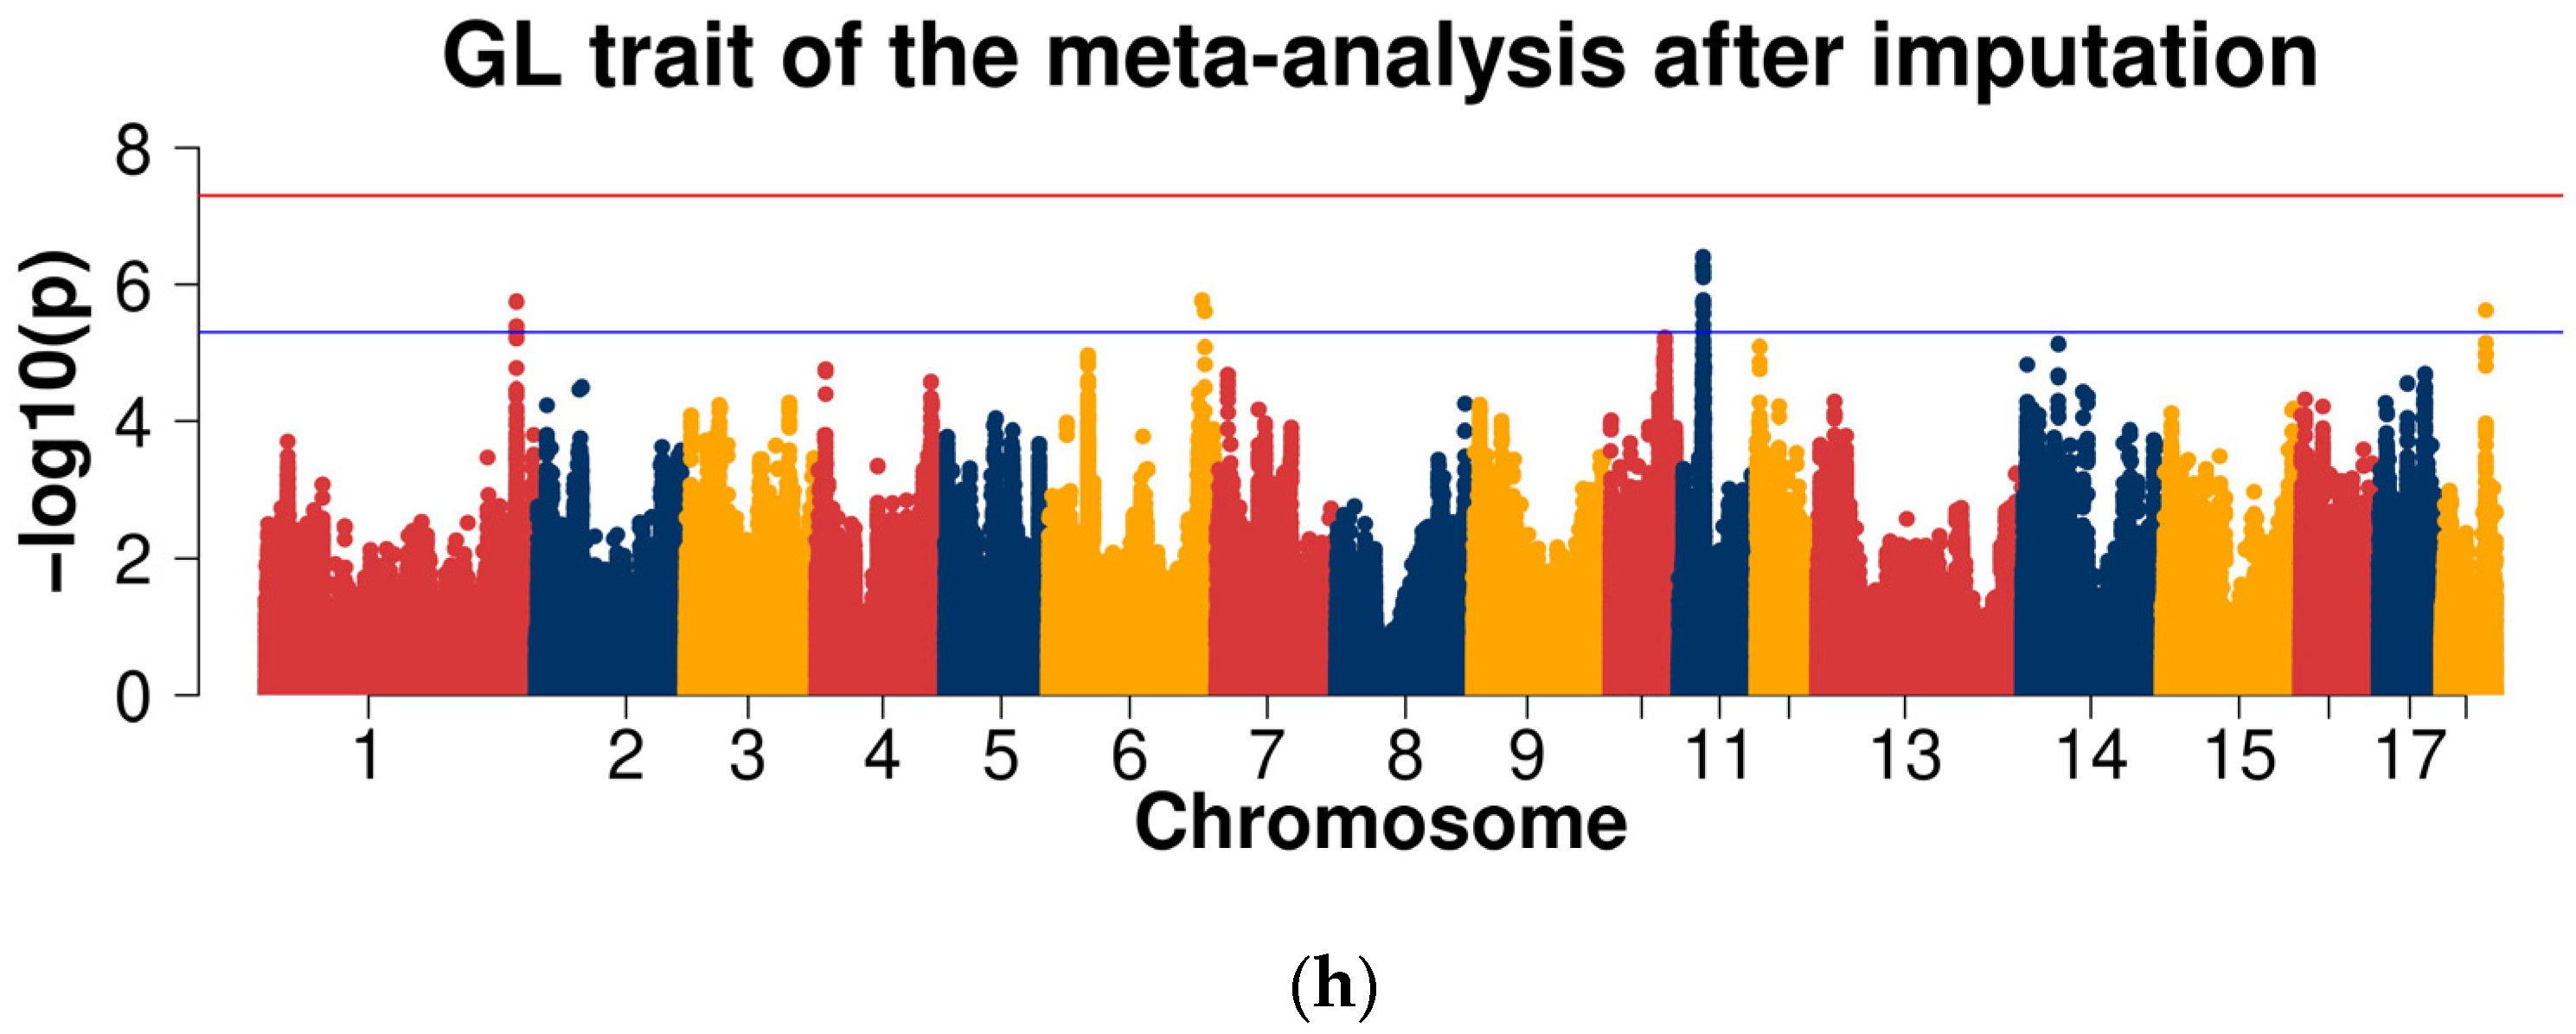
2.3.1. GWAS for Data before Imputation
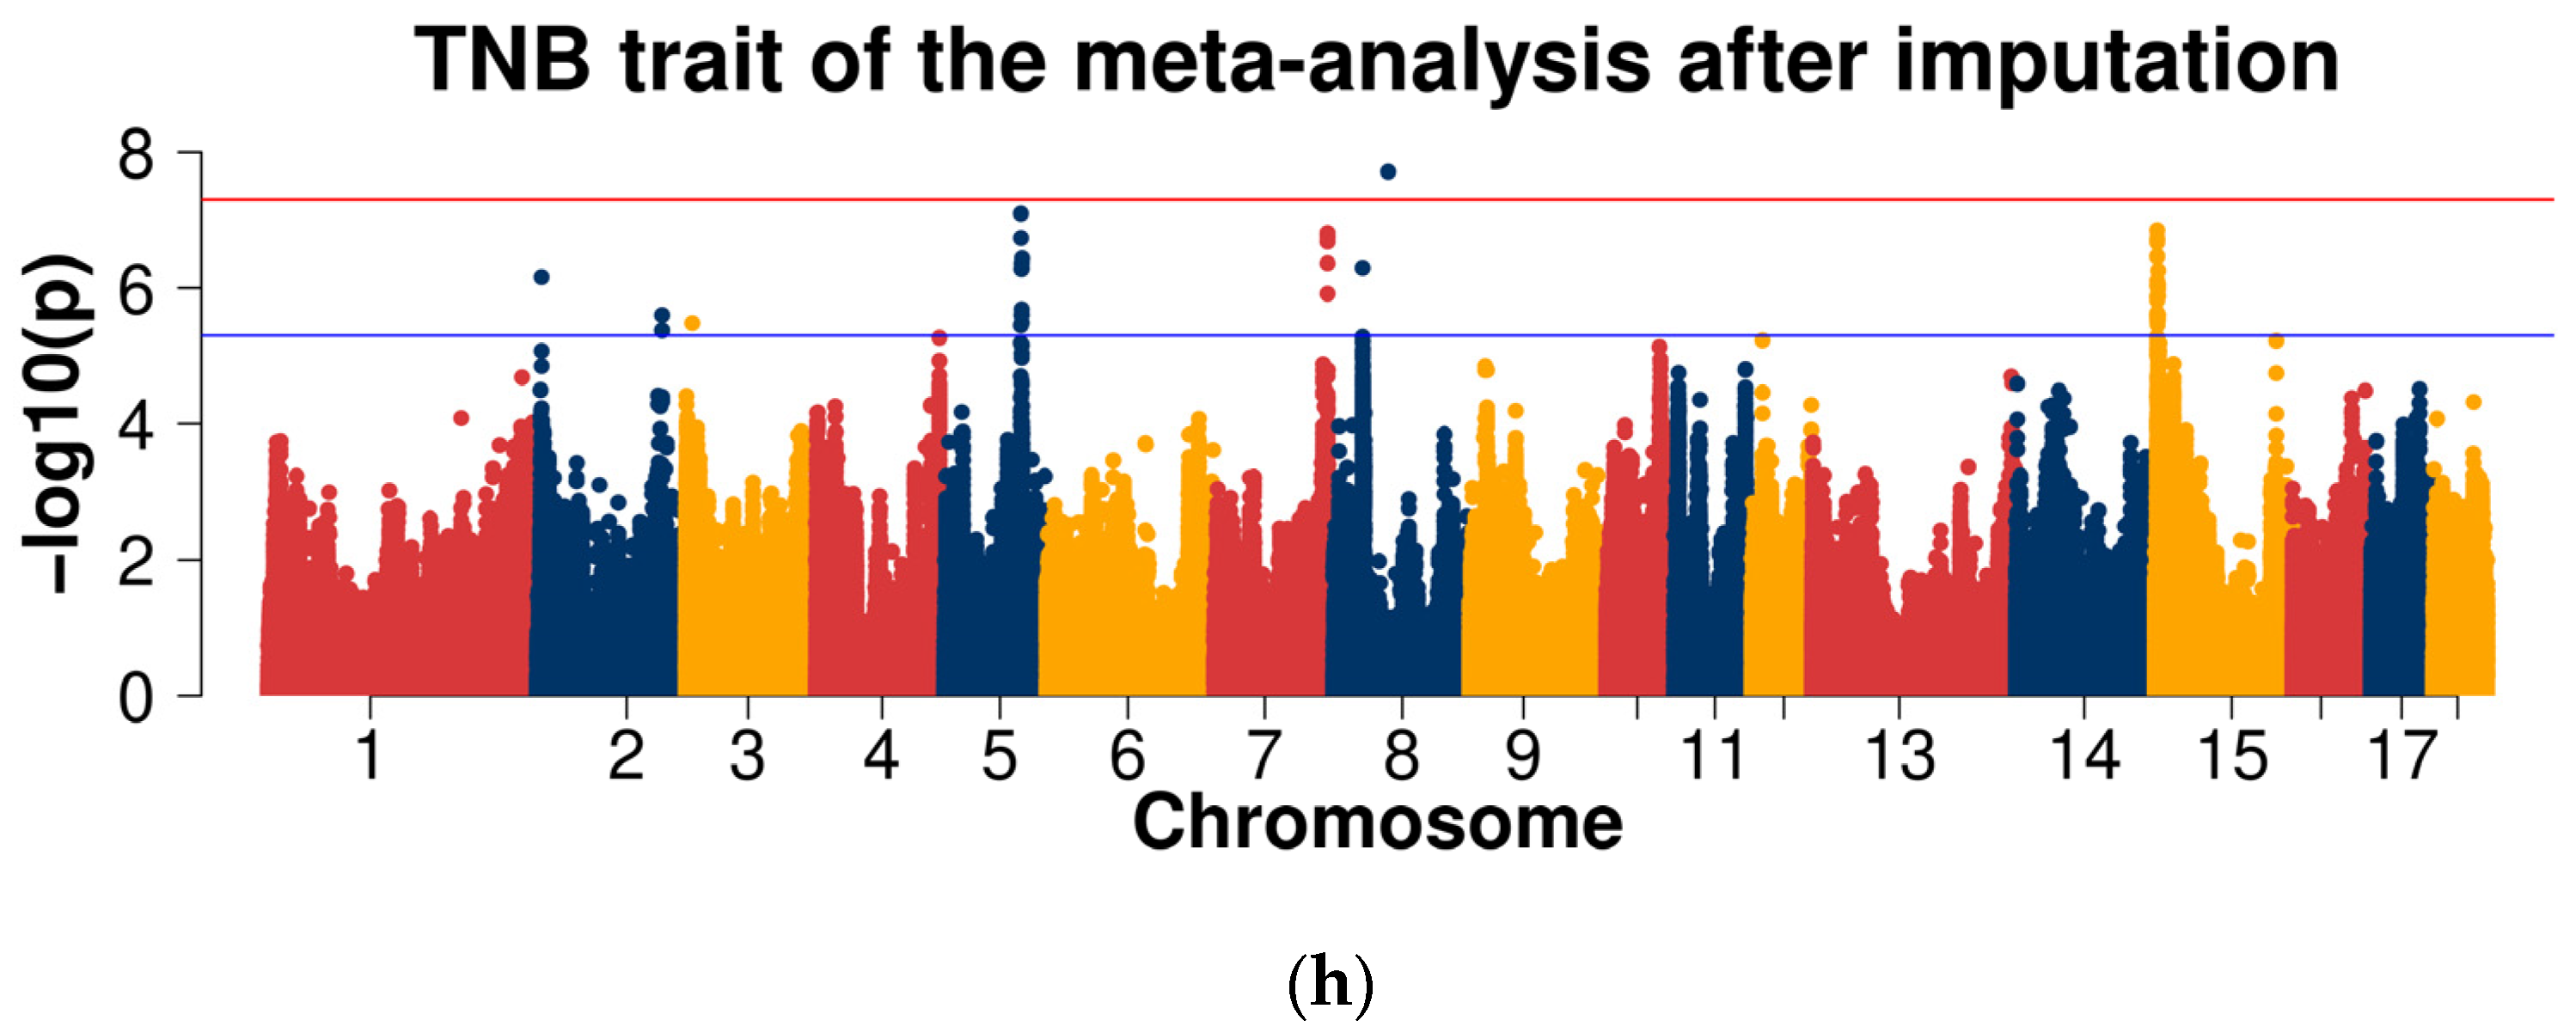
2.3.2. GWAS for Data after Imputation
2.4. Bioinformatics Annotation Analysis
3. Discussion
3.1. Imputation of 50K Chip Data to WGS Data
3.1.1. Reference Population Size and Imputation Accuracy
3.1.2. Genetic Distance between Reference and Target Populations and Imputation Accuracy
3.1.3. Imputation Strategy and Imputation Accuracy
3.2. Potential Candidate Genes
4. Materials and Methods
4.1. Animals and Phenotype
4.2. SNP Chip Data
4.3. Reference Sequence Data
4.4. Genotype Imputation
4.5. Genome-Wide Association Studies
4.6. Bioinformatics Annotation Analysis
5. Conclusions
Supplementary Materials
Author Contributions
Funding
Institutional Review Board Statement
Informed Consent Statement
Data Availability Statement
Conflicts of Interest
References
- Ogawa, S.; Konta, A.; Kimata, M.; Ishii, K.; Uemoto, Y.; Satoh, M. Estimation of genetic parameters for farrowing traits in purebred Landrace and Large White pigs. Anim. Sci. J. 2019, 90, 23–28. [Google Scholar] [CrossRef] [PubMed]
- Ye, J.; Tan, C.; Hu, X.; Wang, A.; Wu, Z. Genetic parameters for reproductive traits at different parities in Large White pigs. J. Animal Sci. 2018, 96, 1215–1220. [Google Scholar] [CrossRef]
- Wu, P.; Wang, K.; Zhou, J.; Yang, Q.; Yang, X.; Jiang, A.; Jiang, Y.; Li, M.; Zhu, L.; Bai, L. A genome wide association study for the number of animals born dead in domestic pigs. BMC Genet. 2019, 20, 4. [Google Scholar] [CrossRef] [PubMed]
- Andersen, I.L.; Nævdal, E.; Bøe, K.E. Maternal investment, sibling competition, and offspring survival with increasing litter size and parity in pigs (Sus scrofa). Behav. Ecol. Sociobiol. 2011, 65, 1159–1167. [Google Scholar] [CrossRef]
- Varona, L.; Sorensen, D.; Thompson, R. Analysis of litter size and average litter weight in pigs using a recursive model. Genetics 2007, 177, 1791–1799. [Google Scholar] [CrossRef] [PubMed]
- Rydhmer, L.; Lundeheim, N.; Canario, L. Genetic correlations between gestation length, piglet survival and early growth. Livest. Sci. 2008, 115, 287–293. [Google Scholar] [CrossRef]
- Ruan, D.; Zhuang, Z.; Ding, R.; Qiu, Y.; Zhou, S.; Wu, J.; Xu, C.; Hong, L.; Huang, S.; Zheng, E.; et al. Weighted single-step GWAS identified candidate genes associated with growth traits in a Duroc pig population. Genes 2021, 12, 117. [Google Scholar] [CrossRef]
- Xue, Y.; Li, C.; Duan, D.; Wang, M.; Han, X.; Wang, K.; Qiao, R.; Li, X.J.; Li, X.L. Genome-wide association studies for growth-related traits in a crossbreed pig population. Anim. Genet. 2021, 52, 217–222. [Google Scholar] [CrossRef]
- Zhang, Y.; Zhang, J.; Gong, H.; Cui, L.; Zhang, W.; Ma, J.; Chen, C.; Ai, H.; Xiao, S.; Huang, L.; et al. Genetic correlation of fatty acid composition with growth, carcass, fat deposition and meat quality traits based on GWAS data in six pig populations. Meat Sci. 2019, 150, 47–55. [Google Scholar] [CrossRef]
- Jiang, Y.; Tang, S.; Xiao, W.; Yun, P.; Ding, X. A genome-wide association study of reproduction traits in four pig populations with different genetic backgrounds. Asian-Australas. J. Anim. Sci. 2020, 33, 1400–1410. [Google Scholar] [CrossRef]
- Ding, R.; Qiu, Y.; Zhuang, Z.; Ruan, D.; Wu, J.; Zhou, S.; Ye, J.; Cao, L.; Hong, L.; Xu, Z.; et al. Genome-wide association studies reveals polygenic genetic architecture of litter traits in Duroc pigs. Theriogenology 2021, 173, 269–278. [Google Scholar] [CrossRef] [PubMed]
- Wang, Y.; Ding, X.; Tan, Z.; Xing, K.; Yang, T.; Pan, Y.; Wang, Y.; Mi, S.; Sun, D.; Wang, C. Genome-wide association study for reproductive traits in a Large White pig population. Anim. Genet. 2018, 49, 127–131. [Google Scholar] [CrossRef]
- Oyelami, F.O.; Zhao, Q.; Xu, Z.; Zhang, Z.; Sun, H.; Zhang, Z.; Ma, P.; Wang, Q.; Pan, Y. Haplotype Block Analysis Reveals Candidate Genes and QTLs for Meat Quality and Disease Resistance in Chinese Jiangquhai Pig Breed. Front. Genet. 2020, 11, 752. [Google Scholar] [CrossRef] [PubMed]
- Falker-Gieske, C.; Blaj, I.; Preuß, S.; Bennewitz, J.; Thaller, G.; Tetens, J. GWAS for meat and carcass traits using imputed sequence level genotypes in pooled F2-designs in pigs. G3 Genes Genomes Genet. 2019, 9, 2823–2834. [Google Scholar] [CrossRef] [PubMed]
- Jang, D.; Yoon, J.; Taye, M.; Lee, W.; Kwon, T.; Shim, S.; Kim, H. Multivariate genome-wide association studies on tenderness of Berkshire and Duroc pig breeds. Genes Genom. 2018, 40, 701–705. [Google Scholar] [CrossRef]
- Okamura, T.; Onodera, W.; Tayama, T.; Kadowaki, H.; Kojima-Shibata, C.; Suzuki, E.; Uemoto, Y.; Mikawa, S.; Hayashi, T.; Awata, T.; et al. A genome-wide scan for quantitative trait loci affecting respiratory disease and immune capacity in Landrace pigs. Anim. Genet. 2012, 43, 721–729. [Google Scholar] [CrossRef]
- Uemoto, Y.; Ichinoseki, K.; Matsumoto, T.; Oka, N.; Takamori, H.; Kadowaki, H.; Kojima-Shibata, C.; Suzuki, E.; Okamura, T.; Aso, H. Genome-wide association studies for production, respiratory disease, and immune-related traits in Landrace pigs. Sci. Rep. 2021, 11, 15823. [Google Scholar] [CrossRef]
- Lachance, J.; Tishkoff, S.A. SNP ascertainment bias in population genetic analyses: Why it is important, and how to correct it. Bioessays 2013, 35, 780–786. [Google Scholar] [CrossRef]
- Daetwyler, H.D.; Capitan, A.; Pausch, H.; Stothard, P.; Van Binsbergen, R.; Brøndum, R.F.; Liao, X.; Djari, A.; Rodriguez, S.C.; Grohs, C.; et al. Whole-genome sequencing of 234 bulls facilitates mapping of monogenic and complex traits in cattle. Nat. Genet. 2014, 46, 858–865. [Google Scholar] [CrossRef]
- Li, Y.; Willer, C.; Sanna, S.; Abecasis, G. Genotype imputation. Annu. Rev. Genom. Hum. Genet. 2009, 10, 387–406. [Google Scholar] [CrossRef]
- Das, S.; Abecasis, G.R.; Browning, B.L. Genotype imputation from large reference panels. Annu. Rev. Genom. Hum. Genet. 2018, 19, 73–96. [Google Scholar] [CrossRef] [PubMed]
- Ye, S.; Yuan, X.; Lin, X.; Gao, N.; Luo, Y.; Chen, Z.; Li, J.; Zhang, X.; Zhang, Z. Imputation from SNP chip to sequence: A case study in a Chinese indigenous chicken population. J. Anim. Sci. Biotechnol. 2018, 9, 30. [Google Scholar] [CrossRef] [PubMed]
- Deng, T.; Zhang, P.; Garrick, D.; Gao, H.; Wang, L.; Zhao, F. Comparison of Genotype Imputation for SNP Array and Low-Coverage Whole-Genome Sequencing Data. Front. Genet. 2021, 12, 704118. [Google Scholar] [CrossRef] [PubMed]
- Mahajan, A.; Taliun, D.; Thurner, M.; Robertson, N.R.; Torres, J.M.; Rayner, N.W.; Payne, A.J.; Steinthorsdottir, V.; Scott, R.A.; Grarup, N.; et al. Fine-mapping type 2 diabetes loci to single-variant resolution using high-density imputation and islet-specific epigenome maps. Nat. Genet. 2018, 50, 1505–1513. [Google Scholar] [CrossRef]
- Liu, H.; Song, H.; Jiang, Y.; Jiang, Y.; Zhang, F.; Liu, Y.; Shi, Y.; Ding, X.; Wang, C. A single-step genome wide association study on Body Size Traits using imputation-based whole-genome sequence data in Yorkshire pigs. Front. Genet. 2021, 912, 629049. [Google Scholar] [CrossRef]
- Schrooten, C.; Dassonneville, R.; Ducrocq, V.; Brøndum, R.F.; Lund, M.S.; Chen, J.; Liu, Z.; González-Recio, O.; Pena, J.; Druet, T. Error rate for imputation from the Illumina BovineSNP50 chip to the Illumina BovineHD chip. Genet. Sel. Evol. 2014, 46, 10. [Google Scholar] [CrossRef][Green Version]
- Wu, P.; Wang, K.; Zhou, J.; Chen, D.; Yang, Q.; Yang, X.; Liu, Y.; Feng, B.; Jiang, A.; Shen, L.; et al. GWAS on imputed whole-genome Resequencing from genotyping-by-sequencing data for farrowing interval of different parities in pigs. Front. Genet. 2019, 10, 1012. [Google Scholar] [CrossRef]
- van den Berg, S.; Vandenplas, J.; van Eeuwijk, F.A.; Bouwman, A.C.; Lopes, M.S.; Veerkamp, R.F. Imputation to whole-genome sequence using multiple pig populations and its use in genome-wide association studies. Genet. Sel. Evol. 2019, 51, 2. [Google Scholar] [CrossRef]
- Ji, J.; Yan, G.; Chen, D.; Xiao, S.; Gao, J.; Zhang, Z. An association study using imputed whole-genome sequence data identifies novel significant loci for growth-related traits in a Duroc× Erhualian F2 population. J. Anim. Breed. Genet. 2019, 136, 217–228. [Google Scholar] [CrossRef]
- Ventura, R.V.; Miller, S.P.; Dodds, K.G.; Auvray, B.; Lee, M.; Bixley, M.; Clarke, S.M.; McEwan, J.C. Assessing accuracy of imputation using different SNP panel densities in a multi-breed sheep population. Genet. Sel. Evol. 2016, 48, 71. [Google Scholar] [CrossRef]
- van Binsbergen, R.; Bink, M.C.; Calus, M.P.; van Eeuwijk, F.A.; Hayes, B.J.; Hulsegge, I.; Veerkamp, R.F. Accuracy of imputation to whole-genome sequence data in Holstein Friesian cattle. Genet. Sel. Evol. 2014, 46, 41. [Google Scholar] [CrossRef] [PubMed]
- Korkuć, P.; Arends, D.; Brockmann, G.A. Finding the optimal imputation strategy for small cattle populations. Front. Genet. 2019, 10, 52. [Google Scholar] [CrossRef] [PubMed]
- Guo, Y.; Hou, L.; Zhang, X.; Huang, M.; Mao, H.; Chen, H.; Ma, J.; Chen, C.; Ai, H.; Ren, J. A meta analysis of genome-wide association studies for limb bone lengths in four pig populations. BMC Genet. 2015, 16, 95. [Google Scholar] [CrossRef][Green Version]
- Le, T.H.; Christensen, O.F.; Nielsen, B.; Sahana, G. Genome-wide association study for conformation traits in three Danish pig breeds. Genet. Sel. Evol. 2017, 49, 12. [Google Scholar] [CrossRef] [PubMed]
- Bao, H.; Sun, Y.; Yang, N.; Deng, N.; Ni, Z.; Tang, Y.; Li, G.; Du, L.; Wang, Y.-L.; Chen, D.; et al. Uterine Notch2 facilitates pregnancy recognition and corpus luteum maintenance via upregulating decidual Prl8a2. PLoS Genet. 2021, 17, e1009786. [Google Scholar] [CrossRef]
- Liu, Y.; Yang, Y.; Li, W.; Ao, H.; Zhang, Y.; Zhou, R.; Li, K. Effects of melatonin on the synthesis of estradiol and gene expression in pig granulosa cells. J. Pineal Res. 2019, 66, e12546. [Google Scholar] [CrossRef]
- Lin, Y.; Wang, J.; Wang, X.; Wu, W.; Lai, C. T cells development is different between thymus from normal and intrauterine growth restricted pig fetus at different gestational stage. Asian-Australas. J. Anim. Sci. 2013, 26, 343–348. [Google Scholar] [CrossRef]
- Godini, R.; Fallahi, H. Dynamics changes in the transcription factors during early human embryonic development. J. Cell. Physiol. 2019, 234, 6489–6502. [Google Scholar] [CrossRef]
- Zhang, J.; Bakheet, R.; Parhar, R.S.; Huang, C.-H.; Hussain, M.M.; Pan, X.; Siddiqui, S.S.; Hashmi, S. Regulation of fat storage and reproduction by Krüppel-like transcription factor KLF3 and fat-associated genes in Caenorhabditis elegans. J. Mol. Biol. 2011, 411, 537–553. [Google Scholar] [CrossRef]
- Bianchi, E.; Sun, Y.; Almansa-Ordonez, A.; Woods, M.; Goulding, D.; Martinez-Martin, N.; Wright, G.J. Control of oviductal fluid flow by the G-protein coupled receptor Adgrd1 is essential for murine embryo transit. Nat. Commun. 2021, 12, 1251. [Google Scholar] [CrossRef]
- Bush, J.O.; Maltby, K.M.; Cho, E.-S.; Jiang, R. The T-box gene Tbx10 exhibits a uniquely restricted expression pattern during mouse embryogenesis. Gene Expr. Patterns 2003, 3, 533–538. [Google Scholar] [CrossRef]
- Che, L.; Yang, Z.; Xu, M.; Xu, S.; Che, L.; Lin, Y.; Fang, Z.; Feng, B.; Li, J.; Chen, D.; et al. Maternal nutrition modulates fetal development by inducing placental efficiency changes in gilts. BMC Genom. 2017, 18, 213. [Google Scholar] [CrossRef]
- Xu, Z.; Jin, X.; Cai, W.; Zhou, M.; Shao, P.; Yang, Z.; Fu, R.; Cao, J.; Liu, Y.; Yu, F.; et al. Proteomics Analysis Reveals Abnormal Electron Transport and Excessive Oxidative Stress Cause Mitochondrial Dysfunction in Placental Tissues of Early-Onset Preeclampsia. Proteom. Clin. Appl. 2018, 12, e1700165. [Google Scholar] [CrossRef]
- Yoo, I.; Han, J.; Lee, S.; Jung, W.; Kim, J.H.; Kim, Y.W.; Kim, H.J.; Hong, M.; Ka, H. Analysis of stage-specific expression of the toll-like receptor family in the porcine endometrium throughout the estrous cycle and pregnancy. Theriogenology 2019, 125, 173–183. [Google Scholar] [CrossRef]
- Schindler, K.; Schultz, R.M. The CDC14A phosphatase regulates oocyte maturation in mouse. Cell Cycle 2009, 8, 1090–1098. [Google Scholar]
- Pedrosa, V.B.; Schenkel, F.S.; Chen, S.-Y.; Oliveira, H.R.; Casey, T.M.; Melka, M.G.; Brito, L.F. Genomewide Association Analyses of Lactation Persistency and Milk Production Traits in Holstein Cattle Based on Imputed Whole-Genome Sequence Data. Genes 2021, 12, 1830. [Google Scholar] [CrossRef]
- Chen, Z.; Zhang, Z.; Wang, Z.; Zhang, Z.; Wang, Q.; Pan, Y. Heterozygosity and homozygosity regions affect reproductive success and the loss of reproduction: A case study with litter traits in pigs. Comput. Struct. Biotechnol. J. 2022, 20, 4060–4071. [Google Scholar] [CrossRef]
- Nguyen, H.; Ung, A.; Ward, W.S. The role of ORC4 in enucleation of murine erythroleukemia (MEL) cells is similar to that in oocyte polar body extrusion. Syst. Biol. Reprod. Med. 2020, 66, 378–386. [Google Scholar] [CrossRef]
- Nguyen, H.; Ortega, M.A.; Ko, M.; Marh, J.; Ward, W.S. ORC4 surrounds extruded chromatin in female meiosis. J. Cell. Biochem. 2015, 116, 778–786. [Google Scholar] [CrossRef][Green Version]
- Nguyen, H.; Wu, H.; Ung, A.; Yamazaki, Y.; Fogelgren, B.; Ward, W.S. Deletion of Orc4 during oogenesis severely reduces polar body extrusion and blocks zygotic DNA replication. Biol. Reprod. 2022, 106, 730–740. [Google Scholar] [CrossRef]
- Zhang, J.; Ren, Q.; Chen, J.; Lv, L.; Wang, J.; Shen, M.; Xing, B.; Wang, X. Downregulation of miR-192 Alleviates Oxidative Stress-Induced Porcine Granulosa Cell Injury by Directly Targeting Acvr2a. Cells 2022, 11, 2362. [Google Scholar]
- Li, X.; Ye, J.; Han, X.; Qiao, R.; Li, X.; Lv, G.; Wang, K. Whole-genome sequencing identifies potential candidate genes for reproductive traits in pigs. Genomics 2020, 112, 199–206. [Google Scholar] [CrossRef]
- Sasaki, S.; Ibi, T.; Matsuhashi, T.; Takeda, K.; Ikeda, S.; Sugimoto, M.; Sugimoto, Y. Genetic variants in the upstream region of activin receptor IIA are associated with female fertility in Japanese Black cattle. BMC Genet. 2015, 16, 123. [Google Scholar] [CrossRef]
- Meijer, H.; van de Pavert, S.; Stroband, H.; Boerjan, M. Expression of the organizer specific homeobox gene goosecoid (gsc) in porcine embryos. Mol. Reprod. Dev. 2000, 55, 1–7. [Google Scholar] [CrossRef]
- da Cruz, A.S.; Silva, D.C.; Minasi, L.B.; de Farias Teixeira, L.K.; Rodrigues, F.M.; da Silva, C.C.; do Carmo, A.S.; da Silva, M.V.G.B.; Utsunomiya, Y.T.; Garcia, J.F.; et al. Single-Nucleotide Polymorphism variations associated with specific genes putatively identified enhanced genetic predisposition for 305-day milk yield in the Girolando crossbreed. Front. Genet. 2021, 11, 573344. [Google Scholar] [CrossRef]
- Abousoliman, I.; Reyer, H.; Oster, M.; Murani, E.; Mohamed, I.; Wimmers, K. Genome-Wide SNP Analysis for Milk Performance Traits in Indigenous Sheep: A Case Study in the Egyptian Barki Sheep. Animals 2021, 11, 1671. [Google Scholar] [CrossRef]
- Borys, S.; Brązert, M.; Jankowski, M.; Kocherova, I.; Ożegowska, K.; Celichowski, P.; Nawrocki, M.; Kranc, W.; Bryja, A.; Kulus, M.; et al. Enzyme linked receptor protein signaling pathway is one of the ontology groups that are highly up-regulated in porcine oocytes before in vitro maturation. J. Biol. Regul. Homeost. Agents 2018, 32, 21–35. [Google Scholar]
- Zhu, L.; Lv, R.; Kong, L.; Li, X. Reduced methylation downregulates CD39/ENTPD1 and ZDHHC14 to suppress trophoblast cell proliferation and invasion: Implications in preeclampsia. Pregnancy Hypertens. 2018, 14, 59–67. [Google Scholar] [CrossRef]
- Chen, Z.; Li, Y.; Zhang, Z.; Zhao, W.; Zhang, Z.; Xiang, Y.; Wang, Q.; Pan, Y.; Guo, X.; Wang, Z. Genome-wide epistatic interactions of litter size at birth in Chinese indigenous pigs. Anim. Genet. 2021, 52, 739–743. [Google Scholar] [CrossRef]
- Tan, C.; Wu, Z.; Ren, J.; Huang, Z.; Liu, D.; He, X.; Prakapenka, D.; Zhang, R.; Li, N.; Da, Y.; et al. Genome-wide association study and accuracy of genomic prediction for teat number in Duroc pigs using genotyping-by-sequencing. Genet. Sel. Evol. 2017, 49, 35. [Google Scholar] [CrossRef]
- Chao, A.; Tsai, C.-L.; Jung, S.-M.; Chuang, W.-C.; Kao, C.; Hsu, A.; Chen, S.-H.; Lin, C.-Y.; Lee, Y.-C.; Lee, Y.-S.; et al. BAI1-associated protein 2-like 1 (BAIAP2L1) is a potential biomarker in ovarian cancer. PLoS ONE 2015, 10, e0133081. [Google Scholar] [CrossRef]
- Meng, X.; Liu, J.; Wang, H.; Chen, P.; Wang, D. MicroRNA-126-5p downregulates BCAR3 expression to promote cell migration and invasion in endometriosis. Mol. Cell. Endocrinol. 2019, 494, 110486. [Google Scholar] [CrossRef]
- Zhou, K.; Diebel, K.W.; Holy, J.; Skildum, A.; Odean, E.; Hicks, D.A.; Schotl, B.; Abrahante, J.E.; Spillman, M.A.; Bemis, L.T. A tRNA fragment, tRF5-Glu, regulates BCAR3 expression and proliferation in ovarian cancer cells. Oncotarget 2017, 8, 95377–95391. [Google Scholar] [CrossRef]
- Kirkegaard, K.; Villesen, P.; Jensen, J.M.; Hindkjær, J.J.; Kølvraa, S.; Ingerslev, H.J.; Lykke-Hartmann, K. Distinct differences in global gene expression profiles in non-implanted blastocysts and blastocysts resulting in live birth. Gene 2015, 571, 212–220. [Google Scholar] [CrossRef]
- Fefelova, E.; Stolyarenko, A.; Yakushev, E.; Gvozdev, V.; Klenov, M.J.M.B. Participation of the piRNA pathway in recruiting a component of RNA polymerase I transcription initiation complex to germline cell nucleoli. Mol. Biol. 2017, 51, 718–723. [Google Scholar] [CrossRef]
- Schumacher, T.; Röntgen, M.; Maak, S. Congenital Splay Leg Syndrome in Piglets—Current Knowledge and a New Approach to Etiology. Front. Vet. Sci. 2021, 8, 609883. [Google Scholar] [CrossRef]
- Jia, R.; Fu, Y.; Xu, L.; Li, H.; Li, Y.; Liu, L.; Ma, Z.; Sun, D.; Han, B. Associations between polymorphisms of SLC22A7, NGFR, ARNTL and PPP2R2B genes and Milk production traits in Chinese Holstein. BMC Genom. Data 2021, 22, 47. [Google Scholar] [CrossRef]
- Gao, N.; Chen, Y.; Liu, X.; Zhao, Y.; Zhu, L.; Liu, A.; Jiang, W.; Peng, X.; Zhang, C.; Tang, Z. Weighted single-step GWAS identified candidate genes associated with semen traits in a Duroc boar population. BMC Genom. 2019, 20, 797. [Google Scholar] [CrossRef]
- Khan, F.A.; Liu, H.; Zhou, H.; Wang, K.; Qamar, M.T.U.; Pandupuspitasari, N.S.; Shujun, Z. Analysis of Bos taurus and Sus scrofa X and Y chromosome transcriptome highlights reproductive driver genes. Oncotarget 2017, 8, 54416. [Google Scholar] [CrossRef][Green Version]
- Bujold, E.; Romero, R.; Kusanovic, J.P.; Erez, O.; Gotsch, F.; Chaiworapongsa, T.; Gomez, R.; Espinoza, J.; Vaisbuch, E.; Kim, Y.M.; et al. Proteomic profiling of amniotic fluid in preterm labor using two-dimensional liquid separation and mass spectrometry. J. Matern. Fetal Neonatal Med. 2008, 21, 697–713. [Google Scholar] [CrossRef]
- Kopylov, A.T.; Papysheva, O.; Gribova, I.; Kotaysch, G.; Kharitonova, L.; Mayatskaya, T.; Sokerina, E.; Kaysheva, A.L.; Morozov, S.G. Molecular pathophysiology of diabetes mellitus during pregnancy with antenatal complications. Sci. Rep. 2020, 10, 19641. [Google Scholar] [CrossRef] [PubMed]
- Chettier, R.; Ward, K.; Albertsen, H.M. Endometriosis is associated with rare copy number variants. PLoS ONE 2014, 9, e103968. [Google Scholar] [CrossRef] [PubMed]
- Muráni, E.; Murániová, M.; Ponsuksili, S.; Schellander, K.; Wimmers, K. Identification of genes differentially expressed during prenatal development of skeletal muscle in two pig breeds differing in muscularity. BMC Dev. Biol. 2007, 7, 190. [Google Scholar] [CrossRef]
- Zhang, Z.; Chen, Z.; Ye, S.; He, Y.; Huang, S.; Yuan, X.; Chen, Z.; Zhang, H.; Li, J. Genome-wide association study for reproductive traits in a Duroc pig population. Animals 2019, 9, 732. [Google Scholar] [CrossRef] [PubMed]
- Xu, Z.; Sun, H.; Zhang, Z.; Zhao, Q.; Olasege, B.S.; Li, Q.; Yue, Y.; Ma, P.; Zhang, X.; Wang, Q.; et al. Assessment of autozygosity derived from runs of homozygosity in Jinhua pigs disclosed by sequencing data. Front. Genet. 2019, 10, 274. [Google Scholar] [CrossRef]
- DU, H.; Taylor, H.S. Molecular regulation of Müllerian development by Hox genes. Ann. N. Y. Acad. Sci. 2004, 1034, 152–165. [Google Scholar] [CrossRef]
- Song, T.; Zhao, X.; Sun, H.; Li, X.A.; Lin, N.; Ding, L.; Dai, J.; Hu, Y. Regeneration of uterine horns in rats using collagen scaffolds loaded with human embryonic stem cell-derived endometrium-like cells. Tissue Eng. Part A 2015, 21, 353–361. [Google Scholar] [CrossRef]
- Madsen, P.; Jensen, J.; Labouriau, R.; Christensen, O.; Sahana, G. DMU-a package for analyzing multivariate mixed models in quantitative genetics and genomics. In Proceedings of the 10th World Congress of Genetics Applied to Livestock Production, Vancouver, BC, Canada, 17–24 August 2014; pp. 18–22. [Google Scholar]
- Purcell, S.; Neale, B.; Todd-Brown, K.; Thomas, L.; Ferreira, M.A.; Bender, D.; Maller, J.; Sklar, P.; De Bakker, P.I.; Daly, M.J.; et al. PLINK: A tool set for whole-genome association and population-based linkage analyses. Am. J. Hum. Genet. 2007, 81, 559–575. [Google Scholar] [CrossRef]
- Bolger, A.M.; Lohse, M.; Usadel, B. Trimmomatic: A flexible trimmer for Illumina sequence data. Bioinformatics 2014, 30, 2114–2120. [Google Scholar] [CrossRef]
- Li, H.; Durbin, R. Fast and accurate short read alignment with Burrows—Wheeler transform. Bioinformatics 2009, 25, 1754–1760. [Google Scholar] [CrossRef]
- DePristo, M.A.; Banks, E.; Poplin, R.; Garimella, K.V.; Maguire, J.R.; Hartl, C.; Philippakis, A.A.; Del Angel, G.; Rivas, M.A.; Hanna, M.; et al. A framework for variation discovery and genotyping using next-generation DNA sequencing data. Nat. Genet. 2011, 43, 491–498. [Google Scholar] [CrossRef]
- Danecek, P.; Auton, A.; Abecasis, G.; Albers, C.A.; Banks, E.; DePristo, M.A.; Handsaker, R.E.; Lunter, G.; Marth, G.T.; Sherry, S.T.; et al. The variant call format and VCFtools. Bioinformatics 2011, 27, 2156–2158. [Google Scholar] [CrossRef] [PubMed]
- Browning, S.R.; Browning, B.L. Rapid and accurate haplotype phasing and missing-data inference for whole-genome association studies by use of localized haplotype clustering. Am. J. Hum. Genet. 2007, 81, 1084–1097. [Google Scholar] [CrossRef] [PubMed]
- Li, H. A statistical framework for SNP calling, mutation discovery, association mapping and population genetical parameter estimation from sequencing data. Bioinformatics 2011, 27, 2987–2993. [Google Scholar] [CrossRef]
- Browning, B.L.; Browning, S.R. A unified approach to genotype imputation and haplotype-phase inference for large data sets of trios and unrelated individuals. Am. J. Hum. Genet. 2009, 84, 210–223. [Google Scholar] [CrossRef]
- Yang, J.; Lee, S.H.; Goddard, M.E.; Visscher, P.M. GCTA: A tool for genome-wide complex trait analysis. Am. J. Hum. Genet. 2011, 88, 76–82. [Google Scholar] [CrossRef]
- Willer, C.J.; Li, Y.; Abecasis, G.R. METAL: Fast and efficient meta-analysis of genomewide association scans. Bioinformatics 2010, 26, 2190–2191. [Google Scholar] [CrossRef] [PubMed]
- Pe’er, I.; Yelensky, R.; Altshuler, D.; Daly, M.J. Estimation of the multiple testing burden for genomewide association studies of nearly all common variants. Genet. Epidemiol. 2008, 32, 381–385. [Google Scholar] [CrossRef]
- Turner, S.D. qqman: An R package for visualizing GWAS results using QQ and manhattan plots. bioRxiv 2014, 7, e1002043. [Google Scholar]

| Line | Trait | Samples Size | Mean | Standard Deviation | Minimum | Maximum |
|---|---|---|---|---|---|---|
| Canadian | TNB | 1403 | 14.42 | 1.97 | 8.10 | 22.30 |
| French | 1252 | 14.29 | 1.72 | 7.85 | 21.03 | |
| Canadian | NSB | 1403 | 1.26 | 0.85 | −0.21 | 4.65 |
| French | 1252 | 1.16 | 0.74 | −0.19 | 5.73 | |
| Canadian | GL | 1403 | 114.59 | 0.93 | 111.35 | 117.69 |
| French | 1252 | 114.09 | 1.12 | 110.11 | 119.82 |
| Trait | SSC | SNP Name | SNP Position (bp) | p (Canadian) | p (French) | p (Combined LW) | p (Meta) | Candidate Gene |
|---|---|---|---|---|---|---|---|---|
| TNB | 4 | WU_10.2_4_111043929 | 101,156,553 | 1.47 × 10⁻⁵ | 6.50 × 10⁻¹ | 2.39 × 10⁻³ | 6.20 × 10⁻⁴ | NOTCH2 |
| 5 | ALGA0122851 | 79,145,588 | 1.11 × 10⁻⁴ | 3.71 × 10⁻² | 4.26 × 10⁻⁵ | 2.22 × 10⁻⁵ | - | |
| 8 | H3GA0024679 | 30,016,379 | 1.69 × 10⁻⁶ | 4.62 × 10⁻¹ | 9.30 × 10⁻⁵ | 6.75 × 10⁻⁵ | KLF3 | |
| 8 | Affx-114981021 | 56,076,247 | 4.95 × 10⁻⁴ | 4.44 × 10⁻⁶ | 1.61 × 10⁻⁸ | 1.30 × 10⁻⁸ | - | |
| NSB | 1 | INRA0000573 | 9,677,339 | 1.37 × 10⁻⁵ | 1.35 × 10⁻² | 1.54 × 10⁻⁵ | 1.20 × 10⁻⁶ | TMEM242 |
| 4 | ALGA0029239 | 123,733,425 | 7.90 × 10⁻⁶ | 7.47 × 10⁻¹ | 6.98 × 10⁻⁴ | 2.46 × 10⁻³ | FNBP1L | |
| 4 | WU_10.2_4_136884741 | 125,301,443 | 1.94 × 10⁻³ | 6.29 × 10⁻⁴ | 1.78 × 10⁻⁶ | 4.20 × 10⁻⁶ | TGFBR3 | |
| 6 | WU_10.2_6_21881195 | 23,735,225 | 8.94 × 10⁻¹ | 2.51 × 10⁻⁷ | 1.92 × 10⁻² | 2.72 × 10⁻⁴ | - | |
| 10 | ASGA0046895 | 17,881,060 | 7.95 × 10⁻⁷ | 4.08 × 10⁻¹ | 9.49 × 10⁻⁵ | 3.22 × 10⁻⁵ | - | |
| 11 | WU_10.2_11_78220891 | 70,923,126 | 6.20 × 10⁻⁴ | 1.30 × 10⁻³ | 1.08 × 10⁻⁵ | 2.65 × 10⁻⁶ | - | |
| 11 | ALGA0063609 | 70,551,880 | 5.29 × 10⁻³ | 9.79 × 10⁻⁴ | 2.05 × 10⁻⁵ | 1.77 × 10⁻⁵ | - | |
| 14 | MARC0062790 | 138,357,861 | 5.25 × 10⁻¹ | 1.10 × 10⁻⁵ | 1.39 × 10⁻² | 4.98 × 10⁻⁴ | - | |
| 18 | WU_10.2_18_6267059 | 5,909,015 | 1.71 × 10⁻⁵ | - | 8.92 × 10⁻⁶ | 1.71 × 10⁻⁵ | NUB1 | |
| 18 | MARC0056921 | 6,400,611 | 1.26 × 10⁻⁵ | 6.43 × 10⁻¹ | 6.66 × 10⁻⁵ | 4.79 × 10⁻⁴ | GIMAP2 | |
| GL | 1 | ASGA0104591 | 254,755,615 | 1.82 × 10⁻² | 1.84 × 10⁻⁵ | 4.08 × 10⁻⁷ | 3.58 × 10⁻⁶ | COL27A1 |
| 6 | WU_10.2_6_144601434 | 156,647,853 | 8.97 × 10⁻⁶ | 1.21 × 10⁻¹ | 2.60 × 10⁻¹ | 3.05 × 10⁻² | - | |
| 11 | ALGA0124549 | 25,293,190 | 9.56 × 10⁻¹ | 3.24 × 10⁻⁶ | 3.60 × 10⁻⁴ | 1.26 × 10⁻³ | VWA8 | |
| 12 | WU_10.2_12_3290782 | 3,251,323 | 2.42 × 10⁻³ | 2.74 × 10⁻³ | 8.38 × 10⁻⁵ | 2.03 × 10⁻⁵ | - | |
| 14 | MARC0035949 | 61,937,863 | 4.86 × 10⁻² | 1.48 × 10⁻³ | 1.18 × 10⁻⁵ | 2.98 × 10⁻⁴ | BICC1 |
| SSC | SNP_R (Mb) | T_SNP_P (bp) | SNP_N | p (Canadian) | p (French) | p (Combined LW) | p (Meta) | Candidate Gene |
|---|---|---|---|---|---|---|---|---|
| 1 | 261.86–261.90 | 261,882,219 | 4 | 4.42 × 10⁻¹ | 7.79 × 10⁻⁷ | 2.41 × 10⁻² | 4.60 × 10⁻³ | TTLL11 |
| 2 | 4.90–4.94 | 4,917,216 | 1 | 6.89 × 10⁻⁷ | - | 3.47 × 10⁻⁶ | 6.89 × 10⁻⁷ | UNC93B1/ALDH3B2 |
| 2 | 4.94–4.98 | 4,964,340 | 19 | 5.72 × 10⁻⁷ | 6.61 × 10⁻¹ | 2.02 × 10⁻⁴ | 8.56 × 10⁻⁴ | TBX10/NDUFV1 |
| 2 | 127.88–127.92 | 127,904,283 | 13 | 4.21 × 10⁻⁶ | - | 8.20 × 10⁻⁵ | 4.21 × 10⁻⁶ | - |
| 3 | 6.81–6.85 | 117,058,450 | 1 | 3.78 × 10⁻⁴ | - | 4.61 × 10⁻⁶ | 3.78 × 10⁻⁴ | - |
| 3 | 117.04–117.08 | 6,831,554 | 1 | 6.12 × 10⁻⁴ | 1.65 × 10⁻³ | 1.08 × 10⁻⁵ | 3.29 × 10⁻⁶ | - |
| 4 | 117.63–117.67 | 117,647,397 | 1 | 9.90 × 10⁻¹ | 4.47× 10⁻⁶ | 2.16 × 10⁻³ | 1.68 × 10⁻³ | CDC14A |
| 5 | 78.38–78.42 | 78,396,126 | 1 | 8.21 × 10⁻⁵ | 9.81 × 10⁻³ | 7.00 × 10⁻⁶ | 3.55 × 10⁻⁶ | COL2A1 |
| 5 | 78.40–78.44 | 78,424,002 | 1 | 4.34 × 10⁻⁶ | 3.17 × 10⁻³ | 1.08 × 10⁻⁷ | 8.03 × 10⁻⁸ | SENP1 |
| 5 | 78.53–78.57 | 78,554,745 | 1 | 1.14 × 10⁻⁵ | 3.20 × 10⁻³ | 2.80 × 10⁻⁷ | 1.84 × 10⁻⁷ | CCDC184 |
| 5 | 79.02–79.12 | 79,102,021 | 11 | 1.30 × 10⁻⁶ | 2.89 × 10⁻² | 1.13 × 10⁻⁶ | 5.21 × 10⁻⁷ | - |
| 5 | 79.12–79.16 | 79,144,763 | 8 | 6.11 × 10⁻⁶ | 3.86 × 10⁻² | 2.66 × 10⁻⁶ | 2.50 × 10⁻⁶ | - |
| 5 | 79.24–79.28 | 79,262,197 | 2 | 1.07 × 10⁻⁶ | 7.45 × 10⁻³ | 8.06 × 10⁻⁶ | 3.25 × 10⁻⁶ | KANSL2 |
| 5 | 79.24–79.29 | 79,271,540 | 7 | 1.38 × 10⁻⁶ | 2.44 × 10⁻² | 5.50 × 10⁻⁷ | 4.31 × 10⁻⁷ | KANSL2, SNORA2C |
| 5 | 79.25–79.29 | 79,266,042 | 3 | 1.32 × 10⁻⁵ | 2.44 × 10⁻² | 3.71 × 10⁻⁶ | 2.44 × 10⁻⁶ | KANSL2, SNORA2C |
| 5 | 79.70–79.74 | 79,716,662 | 1 | 4.02 × 10⁻⁷ | 4.12 × 10⁻² | 1.97 × 10⁻⁷ | 3.66 × 10⁻⁷ | |
| 5 | 79.71–79.75 | 79,732,010 | 3 | 2.71 × 10⁻⁷ | 6.65 × 10⁻¹ | 4.30 × 10⁻⁴ | 5.45 × 10⁻⁵ | SLC41A2 |
| 7 | 115.99–116.04 | 116,017,230 | 9 | 2.94 × 10⁻⁵ | 1.30 × 10⁻³ | 5.09 × 10⁻⁸ | 1.55 × 10⁻⁷ | GSC |
| 7 | 115.06–116.10 | 116,082,776 | 2 | 1.44 × 10⁻⁵ | 2.58 × 10⁻³ | 3.67 × 10⁻⁸ | 1.76 × 10⁻⁷ | GSC |
| 7 | 116.32–116.36 | 116,344,726 | 1 | 1.62 × 10⁻⁵ | - | 1.63 × 10⁻⁶ | 1.62 × 10⁻⁵ | - |
| 8 | 29.96–30.00 | 29,982,306 | 2 | 5.03 × 10⁻⁷ | - | 2.49 × 10⁻⁵ | 5.03 × 10⁻⁷ | - |
| 8 | 30.04–31.11 | 31,089,176 | 87 | 4.23 × 10⁻⁶ | 1.79 × 10⁻¹ | 1.91 × 10⁻³ | 1.98 × 10⁻⁵ | KLF3, FAM114A1, TLR10, TLR1, TLR6, WDR19, PDS5A |
| 8 | 56.06–56.10 | 56,076,247 | 1 | 5.72 × 10⁻⁴ | 5.79 × 10⁻⁶ | 2.33 × 10⁻⁸ | 1.94 × 10⁻⁸ | - |
| 10 | 54.58–54.62 | 54,600,820 | 1 | 3.16 × 10⁻⁶ | 1.11 × 10⁻¹ | 5.38 × 10⁻⁶ | 7.38 × 10⁻⁶ | PLXDC2 |
| 10 | 55.49-55.53 | 55,514,613 | 9 | 1.57 × 10⁻⁴ | 1.66 × 10⁻² | 4.62 × 10⁻⁶ | 1.12 × 10⁻⁵ | - |
| 13 | 205.13–205.17 | 205,150,403 | 1 | 2.16 × 10⁻⁶ | 7.41 × 10⁻¹ | 1.53 × 10⁻⁴ | 2.42 × 10⁻⁴ | RIPK4 |
| 15 | 2.20–2.28 | 2,257,349 | 4 | - | 3.69 × 10⁻⁵ | 4.41 × 10⁻⁶ | 3.69 × 10⁻⁵ | - |
| 15 | 2.24–2.35 | 2,325,462 | 4 | 5.96 × 10⁻³ | 3.20× 10⁻⁵ | 3.10 × 10⁻⁶ | 2.46 × 10⁻⁶ | - |
| 15 | 2.50–2.56 | 2,538,624 | 5 | - | 1.41 × 10⁻⁷ | 2.79 × 10⁻⁷ | 1.41× 10⁻⁷ | MMADHC |
| 15 | 2.54–2.60 | 2,578,548 | 6 | 1.56 × 10⁻¹ | 3.42 × 10⁻⁷ | 1.96 × 10⁻⁶ | 2.10 × 10⁻⁵ | - |
| 15 | 2.57–2.61 | 2,586,649 | 2 | 8.65 × 10⁻¹ | 8.25 × 10⁻⁷ | 9.70 × 10⁻⁵ | 4.51 × 10⁻⁴ | LYPD6 |
| 15 | 2.54–2.61 | 2,564,841 | 83 | - | 9.22 × 10⁻⁷ | 1.67 × 10⁻⁶ | 9.22 × 10⁻⁷ | LYPD6 |
| 15 | 2.65–2.69 | 2,671,075 | 1 | 2.53 × 10⁻³ | 3.27 × 10⁻⁴ | 6.97 × 10⁻⁶ | 3.13 × 10⁻⁶ | LYPD6 |
| 15 | 2.76–2.80 | 2,778,681 | 1 | - | 3.07 × 10⁻⁶ | 3.83 × 10⁻⁵ | 3.07 × 10⁻⁶ | LYPD6 |
| 15 | 2.68–2.81 | 2,779,384 | 11 | 9.87 × 10⁻¹ | 2,779,3842.99 × 10−6 | 5.85 × 10⁻⁴ | 1.39 × 10⁻³ | LYPD6 |
| 15 | 2.90–2.95 | 2,933,736 | 6 | - | 7.06 × 10⁻⁶ | 3.30 × 10⁻⁶ | 5.68 × 10⁻⁶ | LYPD6B |
| 15 | 2.92–2.96 | 2,938,800 | 2 | - | 3.47 × 10⁻⁶ | 2.44 × 10⁻⁶ | 3.47 × 10⁻⁶ | LYPD6B |
| 15 | 3.24–3.28 | 3,264,770 | 1 | 4.51 × 10⁻¹ | 4.48 × 10⁻⁶ | 6.54 × 10⁻⁵ | 2.17 × 10⁻⁴ | KIF5C |
| 15 | 3.26–3.30 | 3,278,046 | 2 | 9.74 × 10⁻² | 1.03 × 10⁻⁵ | 3.90 × 10⁻⁶ | 2.29× 10⁻⁵ | KIF5C |
| 15 | 3.36–3.40 | 3,376,487 | 8 | 4.19 × 10⁻³ | 1.30 × 10⁻⁴ | 1.95 × 10⁻⁶ | 2.48 × 10⁻⁶ | KIF5C |
| 15 | 3.37–3.41 | 3,392,704 | 8 | 1.18 × 10⁻³ | 2.91 × 10⁻³ | 2.42 × 10⁻⁶ | 1.07 × 10⁻⁵ | - |
| 15 | 3.37–3.57 | 3,545,949 | 8 | 1.11 × 10⁻² | 1.33 × 10⁻⁵ | 2.73 × 10⁻⁷ | 1.32 × 10⁻⁶ | EPC2 |
| 15 | 4.15–4.43 | 4,408,571 | 14 | 2.42 × 10⁻² | 4.58× 10⁻⁵ | 3.03 × 10⁻⁶ | 9.11 × 10⁻⁶ | ORC4, ACVR2A |
| 15 | 4.79–4.88 | 4,857,043 | 20 | 3.63 × 10⁻¹ | 1.07 × 10⁻⁶ | 5.46 × 10⁻³ | 7.16 × 10⁻³ | - |
| SSC | SNP_R (Mb) | T_SNP_P (bp) | SNP_N | p (Canadian) | p (French) | p (Combined LW) | p (Meta) | Candidate Gene |
|---|---|---|---|---|---|---|---|---|
| 1 | 9.04–9.42 | 9,404,407 | 12 | 3.60 × 10⁻⁵ | 1.11 × 10⁻² | 1.07 × 10⁻⁵ | 2.06 × 10⁻⁶ | SYNJ2, ZDHHC14 |
| 1 | 9.38–9.43 | 9,411,440 | 57 | 3.57 × 10⁻⁵ | 6.68 × 10⁻⁴ | 3.87 × 10⁻⁷ | 9.23 × 10⁻⁸ | ZDHHC14 |
| 1 | 9.44–9.76 | 9,743,278 | 13 | 1.03 × 10⁻⁴ | 7.68 × 10⁻³ | 3.83 × 10⁻⁵ | 3.26 × 10⁻⁶ | ZDHHC14, TMEM242 |
| 3 | 5.44–5.49 | 5,470,408 | 5 | 1.25 × 10⁻² | 2.52 × 10⁻⁵ | 8.38 × 10⁻⁶ | 2.48 × 10⁻⁶ | TECPR1, BRI3, BAIAP2L1 |
| 3 | 5.43–5.50 | 5,478,442 | 5 | 7.49 × 10⁻³ | 2.30 × 10⁻⁵ | 1.83 × 10⁻⁶ | 1.23 × 10⁻⁶ | TECPR1, BRI3, BAIAP2L1 |
| 3 | 126.29–126.42 | 126,396,984 | 9 | 1.62 × 10⁻⁶ | 5.71 × 10⁻¹ | 6.02 × 10⁻⁵ | 1.06 × 10⁻⁴ | CYS1 |
| 3 | 126.38–126.43 | 126,405,359 | 6 | 6.22 × 10⁻⁶ | 4.31 × 10⁻² | 3.09 × 10⁻⁶ | 2.96 × 10⁻⁶ | CYS1, KLF11 |
| 3 | 126.53–136.57 | 126,553,254 | 1 | 1.13 × 10⁻⁶ | 4.53 × 10⁻¹ | 4.10 × 10⁻⁵ | 5.05 × 10⁻⁵ | TAF1B |
| 3 | 126.55–126.60 | 126,576,921 | 4 | 5.17 × 10⁻⁷ | 1.70 × 10⁻¹ | 3.46 × 10⁻⁶ | 4.39 × 10⁻⁶ | TAF1B |
| 3 | 126.57–126.63 | 126,610,508 | 4 | 5.74 × 10⁻⁶ | 5.69 × 10⁻² | 3.90 × 10⁻⁶ | 4.13 × 10⁻⁶ | TAF1B |
| 4 | 123.49–123.53 | 123,514,051 | 1 | 1.04 × 10⁻⁵ | - | 1.48 × 10⁻⁶ | 2.83 × 10⁻⁶ | BCAR3 |
| 4 | 123.48–123.54 | 123,515,536 | 5 | 3.21 × 10⁻⁵ | 7.62 × 10⁻¹ | 1.48 × 10⁻⁶ | 6.79 × 10⁻⁶ | BCAR3 |
| 4 | 123.69–123.86 | 123,842,741 | 5 | 4.68 × 10⁻⁶ | 7.62 × 10⁻¹ | 5.02 × 10⁻⁴ | 1.81 × 10⁻³ | FNBP1L, DR1 |
| 4 | 124.53–124.57 | 124,546,985 | 3 | 2.58 × 10⁻⁶ | - | 7.72 × 10⁻⁶ | 2.58 × 10⁻⁶ | EVI5 |
| 4 | 124.63–124.67 | 124,647,920 | 1 | 4.54 × 10⁻⁶ | 1.26 × 10⁻¹ | 7.50 × 10⁻² | 2.25 × 10⁻² | GFI1 |
| 4 | 124.88–124.93 | 124,907,426 | 136 | 4.62 × 10⁻⁶ | - | 2.15 × 10⁻⁵ | 4.62 × 10⁻⁶ | BTBD8 |
| 4 | 124.84–124.93 | 124,912,144 | 83 | 2.38 × 10⁻⁶ | 6.77 × 10⁻¹ | 4.03 × 10⁻⁵ | 2.03 × 10⁻⁴ | BTBD8 |
| 4 | 124.89–124.95 | 124,934,706 | 71 | 1.67 × 10⁻⁶ | 3.45 × 10⁻¹ | 2.50 × 10⁻⁵ | 3.62 × 10⁻⁵ | BTBD8 |
| 4 | 124.93–124.97 | 124,946,497 | 7 | 2.48 × 10⁻⁸ | 5.10 × 10⁻¹ | 1.05 × 10⁻⁶ | 6.64 × 10⁻⁶ | BTBD8, EPHX4 |
| 4 | 124.92–125.00 | 124,977,862 | 102 | 1.55 × 10⁻⁶ | 8.97 × 10⁻¹ | 5.50 × 10⁻⁴ | 6.65 × 10⁻⁴ | BTBD8, EPHX4 |
| 4 | 124.96–125.00 | 124,978,259 | 3 | 2.88 × 10⁻⁶ | - | 2.79 × 10⁻⁶ | 2.88 × 10⁻⁶ | EPHX4 |
| 4 | 125.08–125.29 | 125,266,938 | 27 | 2.59 × 10⁻³ | 9.16 × 10⁻⁴ | 3.54 × 10⁻⁶ | 7.94 × 10⁻⁶ | TGFBR3 |
| 4 | 125.25–125.29 | 125,266,999 | 1 | 3.98 × 10⁻⁶ | 9.16 × 10⁻⁴ | 1.28 × 10⁻⁸ | 1.81 × 10⁻⁸ | TGFBR3 |
| 4 | 125.25–125.33 | 125,314,460 | 38 | 1.39 × 10⁻³ | 9.61 × 10⁻⁴ | 2.35 × 10⁻⁶ | 4.41 × 10⁻⁶ | TGFBR3 |
| 6 | 10.13–10.21 | 10,185,432 | 61 | 2.66 × 10⁻⁶ | 9.08 × 10⁻¹ | 8.04 × 10⁻² | 8.57 × 10⁻⁴ | NUDT7 |
| 6 | 23.63–24.55 | 24,525,703 | 151 | 6.56 × 10⁻¹ | 5.10 × 10⁻⁸ | 2.09 × 10⁻³ | 4.81 × 10⁻⁵ | - |
| 8 | 135.32–135.43 | 135,411,117 | 3 | 2.64 × 10⁻⁶ | 5.19 × 10⁻¹ | 5.40 × 10⁻³ | 2.97 × 10⁻³ | LIN54, THAP9, SEC31A |
| 10 | 17.51–17.56 | 17,535,810 | 2 | - | 1.29 × 10⁻³ | 1.05 × 10⁻⁶ | 1.29 × 10⁻³ | - |
| 11 | 70.38–70.93 | 70,913,213 | 48 | 4.86 × 10⁻³ | 5.62 × 10⁻⁵ | 3.14 × 10⁻⁶ | 1.48 × 10⁻⁶ | FGF14 |
| 11 | 70.89–70.94 | 70,915,607 | 13 | 8.02 × 10⁻³ | 5.62 × 10⁻⁵ | 8.92 × 10⁻⁶ | 2.68 × 10⁻⁶ | - |
| 14 | 31.82–31.86 | 31,835,585 | 1 | 5.00 × 10⁻² | 6.43 × 10⁻⁵ | 4.63 × 10⁻⁶ | 3.06 × 10⁻⁵ | ARPC3, GPN3, FAM216A |
| 15 | 2.24–3.42 | 3,396,362 | 8 | 2.72 × 10⁻⁴ | 3.87 × 10⁻³ | 2.77 × 10⁻⁶ | 3.65 × 10⁻⁶ | - |
| 15 | 3.39–3.43 | 3,411,573 | 1 | 2.08 × 10⁻¹ | 1.14 × 10⁻⁶ | 3.24 × 10⁻⁶ | 2.06 × 10⁻⁵ | EPC2 |
| 15 | 3.53–3.57 | 3,545,949 | 1 | 2.09 × 10⁻⁴ | 1.65 × 10⁻³ | 1.79 × 10⁻⁷ | 1.20 × 10⁻⁶ | EPC2 |
| 18 | 1.70–1.74 | 1,721,220 | 1 | 3.82 × 10⁻³ | 5.29 × 10⁻⁵ | 4.73 × 10⁻⁶ | 1.07 × 10⁻⁶ | MNX1 |
| 18 | 1.69–1.78 | 1,758,722 | 4 | 4.17 × 10⁻³ | 2.37 × 10⁻⁴ | 2.26 × 10⁻⁵ | 4.09 × 10⁻⁶ | MNX1, HOM1 |
| 18 | 4.16–5.70 | 5,675,281 | 71 | 1.88 × 10⁻⁶ | 1.12 × 10⁻¹ | 1.94 × 10⁻² | 1.77 × 10⁻² | PRKAG2 |
| 18 | 5.68–5.84 | 5,822,905 | 19 | 6.15 × 10⁻⁶ | - | 4.08 × 10⁻⁶ | 6.15 × 10⁻⁶ | PRKAG2, RHEB, CRYGN |
| 18 | 6.15–6.21 | 6,190,743 | 63 | 2.31 × 10⁻⁶ | - | 8.90 × 10⁻⁷ | 2.31 × 10⁻⁶ | AGAP3, FASTK, SLC4A2, ASIC3, ABCB8, ATG9B, NOS3 |
| 18 | 6.18–6.25 | 6,231,446 | 52 | 1.16 × 10⁻⁶ | - | 2.01 × 10⁻⁶ | 1.16 × 10⁻⁶ | ASIC3, ABCB8, ATG9B, NOS3, KCNH2 |
| 18 | 6.21–6.25 | 6,232,825 | 4 | 3.93 × 10⁻⁶ | - | 5.27 × 10⁻⁶ | 3.93 × 10⁻⁶ | NOS3, KCNH2 |
| 18 | 6.21–6.27 | 6,246,190 | 25 | 3.93 × 10⁻⁶ | - | 1.32 × 10⁻⁶ | 3.93 × 10⁻⁶ | NOS3, KCNH2 |
| 18 | 6.23–7.09 | 7,071,468 | 10 | 2.47 × 10⁻⁶ | 7.24 × 10⁻¹ | 3.10 × 10⁻⁴ | 2.46 × 10⁻⁴ | KCNH2, GIMAP2, TAS2R39 |
| 18 | 9.84–9.98 | 9,961,849 | 7 | 1.34 × 10⁻⁴ | 1.43 × 10⁻² | 4.47 × 10⁻⁶ | 8.26 × 10⁻⁶ | TBXAS1, HIPK2 |
| SSC | SNP_R (Mb) | T_SNP_P (bp) | SNP_N | p (Canadian) | p (French) | p (Combined LW) | p (Meta) | Candidate Gene |
|---|---|---|---|---|---|---|---|---|
| 1 | 254.70–254.77 | 254,753,857 | 15 | 9.06 × 10⁻² | 2.19 × 10⁻⁵ | 4.87 × 10⁻⁶ | 3.40 × 10⁻⁵ | AMBP, KIF12, COL27A1 |
| 1 | 254.73–254.78 | 254,756,216 | 10 | 6.79 × 10⁻² | 7.84 × 10⁻⁶ | 1.31 × 10⁻⁶ | 4.91 × 10⁻⁶ | COL27A1 |
| 1 | 254.74–254.78 | 254,757,687 | 5 | 3.92 × 10⁻² | 3.23 × 10⁻⁶ | 7.39 × 10⁻⁷ | 1.77 × 10⁻⁶ | COL27A1 |
| 2 | 148.22–148.26 | 148,238,122 | 1 | 6.20 × 10⁻¹ | 3.91 × 10⁻⁶ | 4.08 × 10⁻⁴ | 4.16 × 10⁻⁴ | PPP2R2B |
| 6 | 156.54–156.58 | 156,564,691 | 2 | 5.73 × 10⁻⁴ | 8.95 × 10⁻⁴ | 1.06 × 10⁻⁵ | 1.71 × 10⁻⁶ | - |
| 6 | 156.55–156.60 | 156,578,616 | 2 | 3.48 × 10⁻⁶ | 6.73 × 10⁻² | 2.07 × 10⁻¹ | 3.43 × 10⁻² | - |
| 6 | 159.28–159.49 | 159,467,436 | 4 | 3.98 × 10⁻³ | 5.68 × 10⁻⁴ | 3.85 × 10⁻⁶ | 2.45 × 10⁻⁶ | ZYG11B, PODN |
| 10 | 54.75–54.79 | 54,772,721 | 1 | 7.92 × 10⁻³ | 7.50 × 10⁻⁴ | 4.94 × 10⁻⁶ | 2.19 × 10⁻⁵ | MALRD1 |
| 11 | 24.70–24.78 | 24,756,403 | 2 | - | 5.31 × 10⁻⁷ | 3.65 × 10⁻⁶ | 5.31 × 10⁻⁷ | AKAP11 |
| 11 | 24.73–24.78 | 24,763,839 | 30 | - | 3.39 × 10⁻⁷ | 5.11 × 10⁻⁵ | 1.05 × 10⁻⁵ | AKAP11 |
| 11 | 24.75–24.87 | 24,848,044 | 15 | - | 6.15 × 10⁻⁷ | 1.90 × 10⁻³ | 1.64 × 10⁻³ | DGKH |
| 11 | 24.93–25.02 | 24,996,968 | 3 | - | 3.98 × 10⁻⁷ | 6.50 × 10⁻⁸ | 3.98 × 10⁻⁷ | DGKH |
| 11 | 25.04–25.09 | 25,069,836 | 59 | - | 2.85 × 10⁻⁶ | 2.19 × 10⁻⁴ | 1.09 × 10⁻⁴ | VWA8 |
| 11 | 25.05–25.09 | 25,072,777 | 5 | - | 5.46 × 10⁻⁷ | 8.49 × 10⁻⁸ | 5.46 × 10⁻⁷ | VWA8 |
| 11 | 25.08–25.25 | 25,229,257 | 10 | - | 1.72 × 10⁻⁶ | 1.71 × 10⁻⁵ | 1.72 × 10⁻⁶ | VWA8 |
| 11 | 25.21–25.33 | 25,306,498 | 58 | - | 8.50 × 10⁻⁶ | 3.40 × 10⁻⁶ | 8.50 × 10⁻⁶ | VWA8 |
| 11 | 25.30–25.37 | 51,268,401 | 6 | - | 2.57 × 10⁻⁶ | 1.87 × 10⁻⁷ | 2.57 × 10⁻⁶ | VWA8 |
| 11 | 51.25–51.29 | 51,268,401 | 1 | 2.87 × 10⁻⁶ | 4.07 × 10⁻¹ | 6.18 × 10⁻² | 4.61 × 10⁻³ | - |
| 14 | 61.85–62.44 | 62,420,628 | 46 | 2.87 × 10⁻² | 2.29 × 10⁻⁴ | 3.67 × 10⁻⁶ | 2.30 × 10⁻⁴ | BICC1 |
| 17 | 46.30–46.38 | 46,358,876 | 4 | 4.03 × 10⁻⁶ | 9.01 × 10⁻¹ | 5.28 × 10⁻³ | 5.89 × 10⁻⁴ | GTSF1L |
| 18 | 45.35–45.39 | 45,371,853 | 1 | 4.60 × 10⁻⁴ | 1.55 × 10⁻³ | 3.95 × 10⁻⁶ | 2.36 × 10⁻⁶ | HOXA13, HOXA11 |
Publisher’s Note: MDPI stays neutral with regard to jurisdictional claims in published maps and institutional affiliations. |
© 2022 by the authors. Licensee MDPI, Basel, Switzerland. This article is an open access article distributed under the terms and conditions of the Creative Commons Attribution (CC BY) license (https://creativecommons.org/licenses/by/4.0/).
Share and Cite
Wang, X.; Wang, L.; Shi, L.; Zhang, P.; Li, Y.; Li, M.; Tian, J.; Wang, L.; Zhao, F. GWAS of Reproductive Traits in Large White Pigs on Chip and Imputed Whole-Genome Sequencing Data. Int. J. Mol. Sci. 2022, 23, 13338. https://doi.org/10.3390/ijms232113338
Wang X, Wang L, Shi L, Zhang P, Li Y, Li M, Tian J, Wang L, Zhao F. GWAS of Reproductive Traits in Large White Pigs on Chip and Imputed Whole-Genome Sequencing Data. International Journal of Molecular Sciences. 2022; 23(21):13338. https://doi.org/10.3390/ijms232113338
Chicago/Turabian StyleWang, Xiaoqing, Ligang Wang, Liangyu Shi, Pengfei Zhang, Yang Li, Mianyan Li, Jingjing Tian, Lixian Wang, and Fuping Zhao. 2022. "GWAS of Reproductive Traits in Large White Pigs on Chip and Imputed Whole-Genome Sequencing Data" International Journal of Molecular Sciences 23, no. 21: 13338. https://doi.org/10.3390/ijms232113338
APA StyleWang, X., Wang, L., Shi, L., Zhang, P., Li, Y., Li, M., Tian, J., Wang, L., & Zhao, F. (2022). GWAS of Reproductive Traits in Large White Pigs on Chip and Imputed Whole-Genome Sequencing Data. International Journal of Molecular Sciences, 23(21), 13338. https://doi.org/10.3390/ijms232113338


