Article

A Heat Shock Transcription Factor TrHSFB2a of White Clover Negatively Regulates Drought, Heat and Salt Stress Tolerance in Transgenic Arabidopsis

1
College of Grassland Science and Technology, Sichuan Agricultural University, Chengdu 611130, China
2
Guangdong Key Laboratory of Plant Epigenetics, College of Life Sciences and Oceanography, Shenzhen University, Shenzhen 518055, China
3
Key Laboratory of Southwest Crop Genetic Resources and Genetic Improvement, Ministry of Education, Rice Research Institute, Sichuan Agricultural University, Chengdu 611130, China
4
Maize Research Institute, Sichuan Agricultural University, Chengdu 611130, China
*
Author to whom correspondence should be addressed.
Int. J. Mol. Sci. 2022, 23(21), 12769; https://doi.org/10.3390/ijms232112769
Submission received: 21 July 2022 / Revised: 19 September 2022 / Accepted: 10 October 2022 / Published: 23 October 2022
(This article belongs to the Special Issue New Advances in Plant Abiotic Stress)

Abstract

:
Heat shock transcription factors (HSF) are divided into classes A, B and C. Class A transcription factors are generally recognized as transcriptional activators, while functional characterization of class B and C heat shock transcription factors have not been fully developed in most plant species. We isolated and characterized a novel HSF transcription factor gene, TrHSFB2a (a class B HSF) gene, from the drought stress-sensitive forage crop species, white clover (Trifolium repens). TrHSFB2a was highly homologous to MtHSFB2b, CarHSFB2a, AtHSFB2b and AtHSFB2a. The expression of TrHSFB2a was strongly induced by drought (PEG6000 15% w/v), high temperature (35 °C) and salt stresses (200 mM L−1 NaCl) in white clover, while subcellular localization analysis showed that it is a nuclear protein. Overexpression of the white clover gene TrHSFB2a in Arabidopsis significantly reduced fresh and dry weight, relative water contents (RWC), maximum photosynthesis efficiency (Fv/Fm) and performance index on the absorption basis (PIABS), while it promoted leaf senescence, relative electrical conductivity (REC) and the contents of malondialdehyde (MDA) compared to a wild type under drought, heat and salt stress conditions of Arabidopsis plants. The silencing of its native homolog (AtHSFB2a) by RNA interference in Arabidopsis thaliana showed opposite trends by significantly increasing fresh and dry weights, RWC, maximum photosynthesis efficiency (Fv/Fm) and performance index on the absorption basis (PIABS) and reducing REC and MDA contents under drought, heat and salt stress conditions compared to wild type Arabidopsis plants. These phenotypic and physiological indicators suggested that the TrHSFB2a of white clover functions as a negative regulator of heat, salt and drought tolerance. The bioinformatics analysis showed that TrHSFB2a contained the core B3 repression domain (BRD) that has been reported as a repressor activator domain in other plant species that might repress the activation of the heat shock-inducible genes required in the stress tolerance process in plants. The present study explores one of the potential causes of drought and heat sensitivity in white clover that can be overcome to some extent by silencing the TrHSFB2a gene in white clover.

1. Introduction

White clover, belonging to the genus Trifolium, is an excellent worldwide cultivated forage due to its high-yield characteristics, better forage quality and strong biological nitrogen fixation ability. It is an integral part of the grass industry. The development of white clover can promote grain conversion to feed and encourage grass and animal products in competitive markets. However, it is vulnerable to drought and heat stresses and shows significant growth retardation under stress conditions [1], which restrict its development and production globally [2,3]. Therefore, it is of great theoretical and practical significance to strengthen the research to improve drought tolerance in white clover and cultivate drought-tolerant varieties by identifying, studying and manipulating downstream genes and molecular mechanisms.
Heat shock proteins (HSPs), as molecular chaperones, play significant roles in responding to environmental stresses and taking part in protein folding, assembly and stability, which are important threats under stressed conditions in plants [4,5]. The expression of HSPs is controlled by heat shock transcription factors, containing conserved binding domains known as heat stress elements (HSE), mostly existing in promoter regions of the heat stress-inducible/responsive genes and are conserved almost in all eukaryotes. Structurally heat shock transcription factors (HSFs) comprise of a main DNA-binding domain (DBD) of a helix-turn-helix motif in the N-terminal region, which generally binds with the HSE present in the promoter region of heat stress-inducible genes [6]. Following the DBD domain, there is an oligomerization domain (OD), associated with heptad hydrophobic repeat motifs, and a NLS (Nuclear localization signals) domain containing a basic amino acid residue motif and a leucine-rich motif in the HR-C region for export (NES). The C-terminal region is comparatively less conserved, comprising of hydrophobic, aromatic and acid amino acid (AHA) motifs, which are essential for transcriptional activity [6]. Since the first plant HSF isolation from Solanum lycopersicum in the 1990s [7], many HSFs have been identified and characterized [8]. For instance, there are 21 HSFs in Arabidopsis, 25 in Oryza sative, 31 in Zea may ssp. mays, 38 in Glycine max and 56 in wheat, divided into classes A, B and C based on their conserved domain structures [6,9,10,11,12,13,14,15]. Most of the previous research focused on class A HSFs, which generally regulate the transcriptional activities of the genes involved in different environmental stress responses and the seed development process [16,17,18,19,20]. The class B family members do not contain insertions into the HR-A/B domain, while class A has 21 amino acid insertions and class C contains 7 amino acid insertions and class B HSFs generally lack the AHA motif in the C-terminal domain [21,22], which is essential for transcriptional activity. Thus, some Class B HSFs do not show transcriptional activity or act as the co-activator by interacting with class A HSFs and generally suppress the activation of downstream stress-inducible genes [5]. For instance, HSFB1 of a tomato acts as a co-activator along with HSFBA1 and modulates the expression activity of certain housekeeping and viral genes under high-temperature stress [23,24]. In Arabidopsis, the HSFB1 and the HSFB2b have already been reported to negatively control the expression of many stress-inducible genes (HSFs), including HSFA2, HSFA7a, HSFB1, HSFB2b and Vin3, along with several other heat shock transcription factors [25,26]. In Arabidopsis, the single and double mutants of the HSFb1 and the HSFb2b significantly enhance the tolerance of Arabidopsis against abiotic stress tolerance [27]. In a previous transcriptome analysis of white clover under drought stress conditions, it was perceived that a transcription factor homolog to HSFB2 of Chickpea showed a stronger expression under drought stress [28].
The economically important forage, white clover, is vulnerable to abiotic stresses, adversely affecting its normal biological and physiological activities and interrupting fundamental cellular structures [29,30]. Therefore, it is important to continuously explore effective means and resources to improve white clover’s biotic and abiotic stress tolerance. Previously, we explored the physiological, transcriptomic and metabolomics responses of white clover under drought stress conditions and found highly differential expressions of the HSFB2 homolog [28]. To assist a strategy for the molecular improvement of white clover and broaden the understanding of how heat shock transcriptional factor and heat shock proteins modulate stress responses in white clover, we isolated and characterized a class B heat shock transcription factor HSFB2 from white clover cDNA and named it as TrHSFB2a based on conserved domains characteristics. The qRT-PCR method was employed to investigate the spatial and temporal expression of TrHSFB2a under different stress conditions. Furthermore, we synthesized overexpression Arabidopsis and compared it with wild-type and T-DNA lines of Arabidopsis in which the homolog of TrHSFB2a was silenced by RNA interference (RNAi) to determine how HSFB2a protein responds under drought, heat and salt stress conditions. The current study results would improve the understanding of the molecular mechanism of the responses to extreme environmental conditions in white clover and explore the regulatory role of HSFs during ecological stress responses in plants.

2. Results

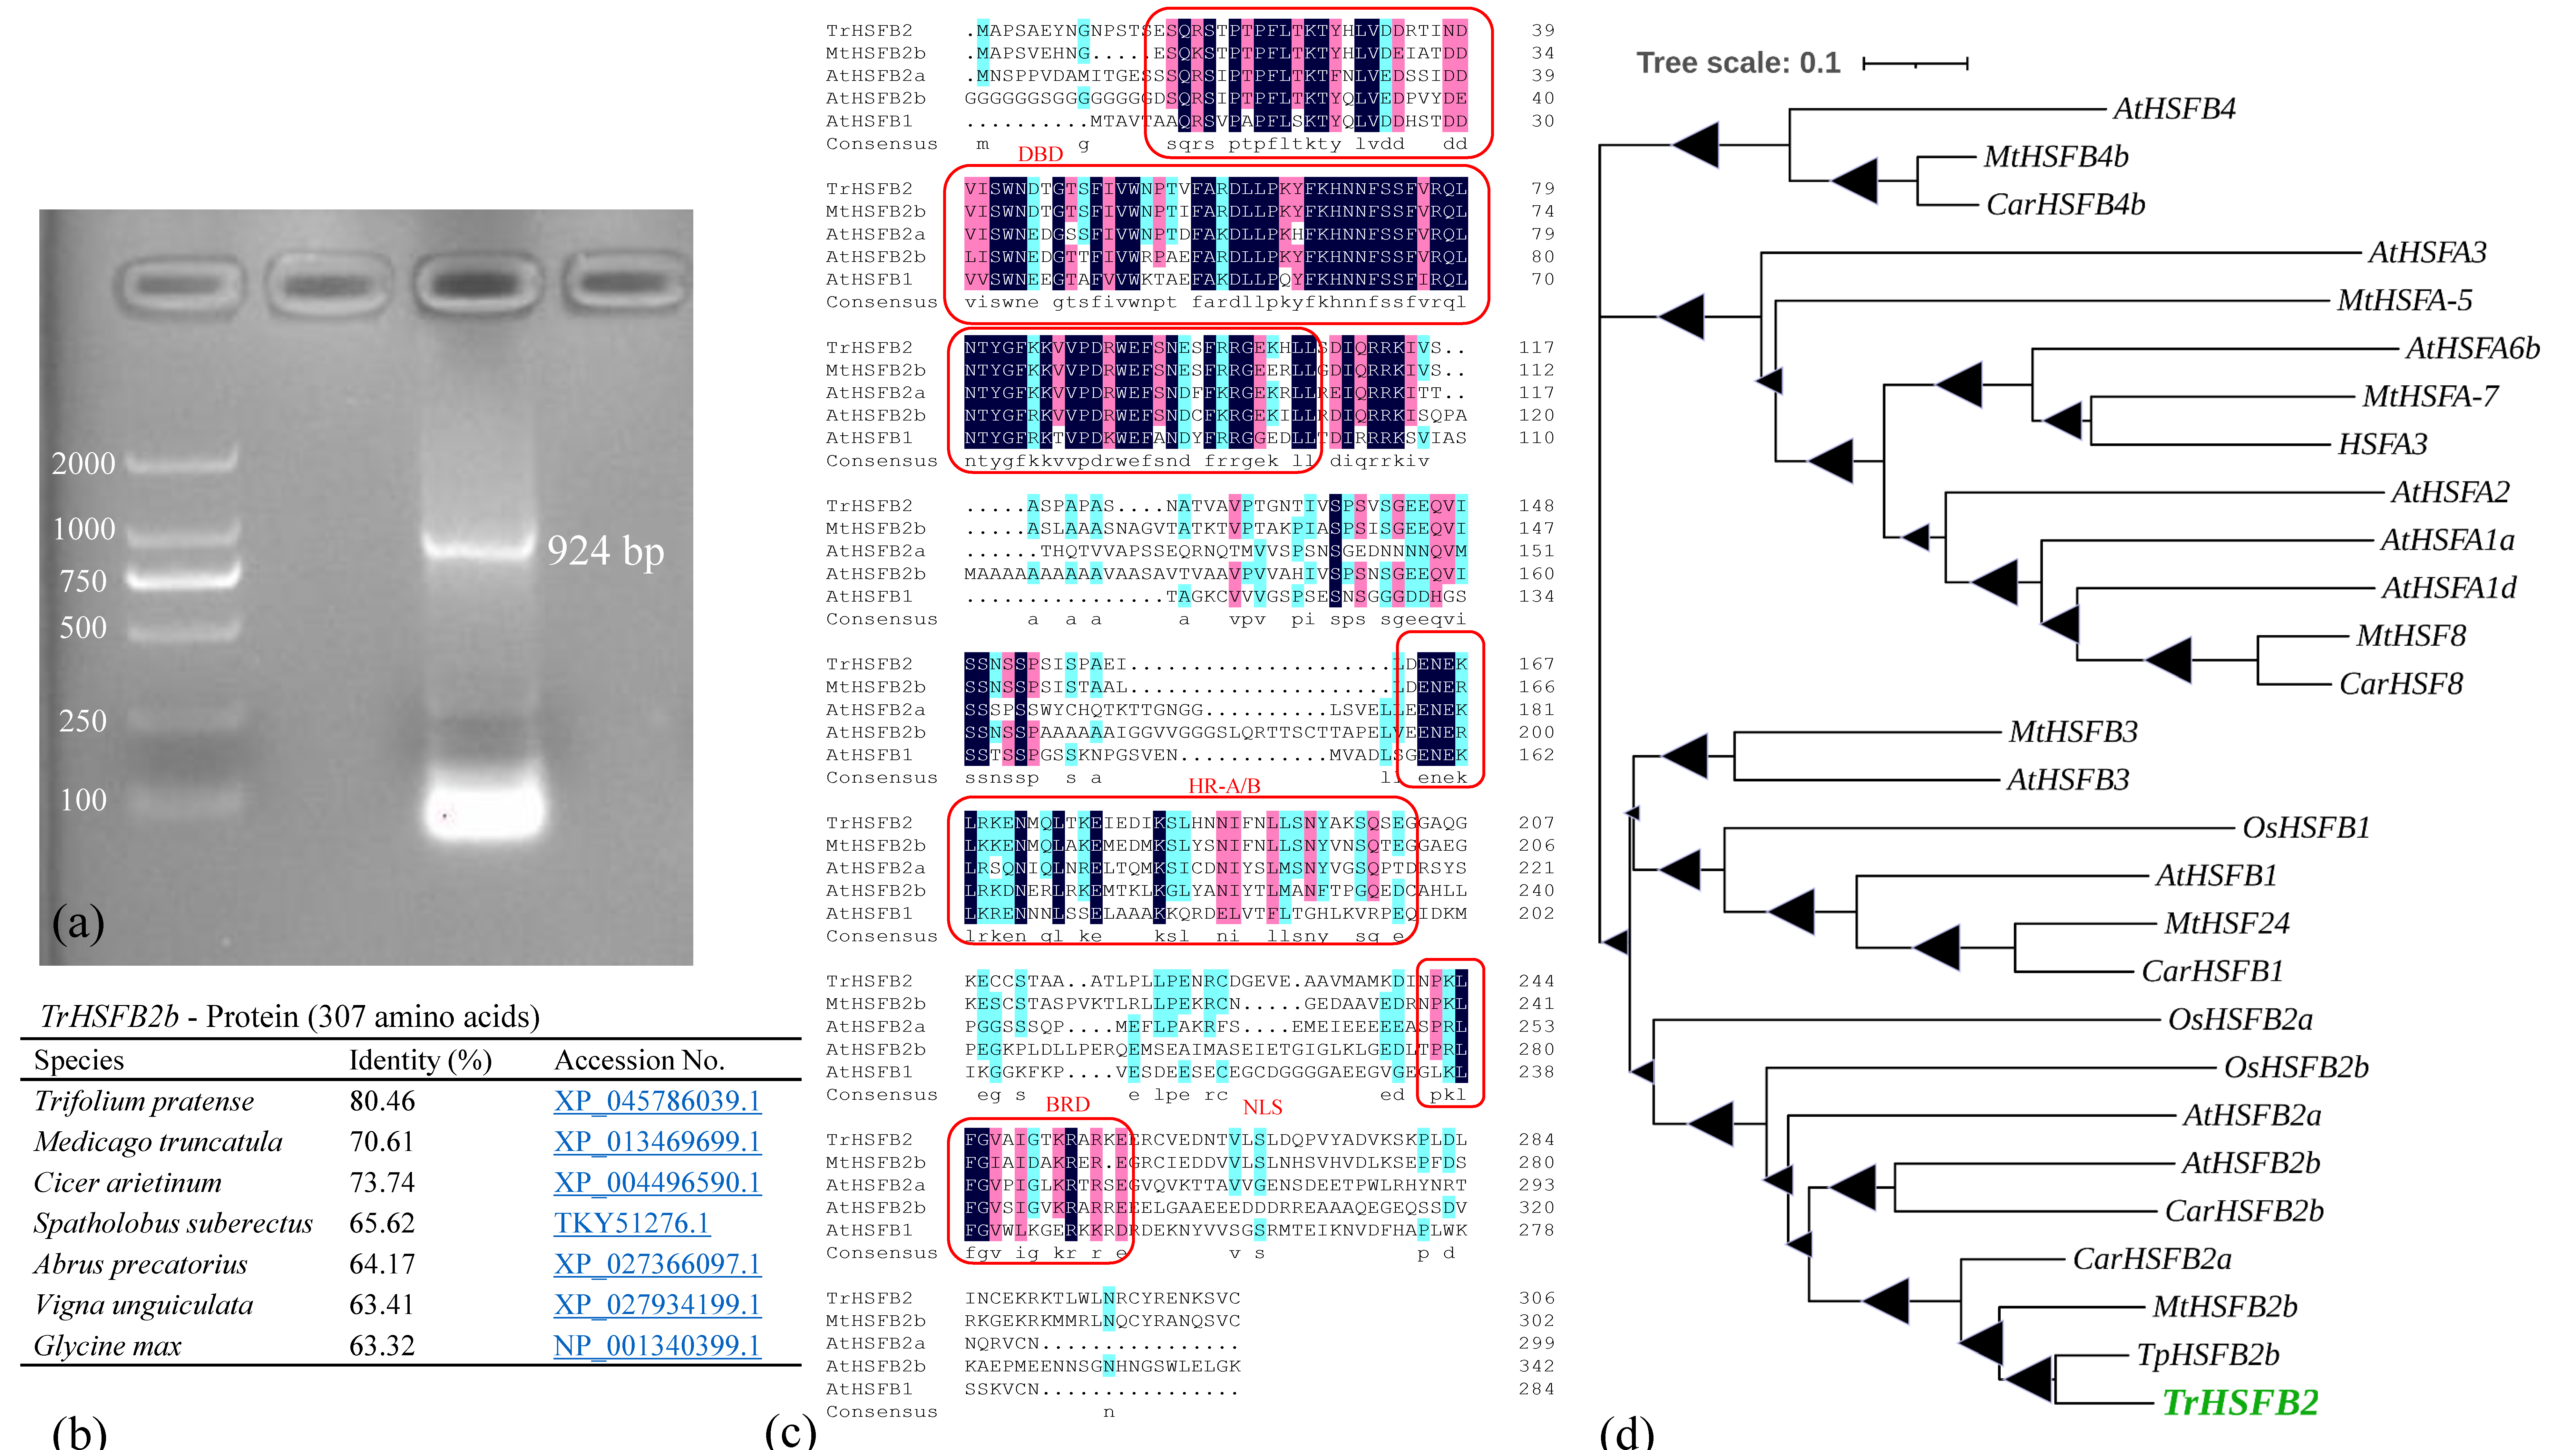
2.1. TrHSFB2a Was Predicated as One of the Class B HSF Proteins

The sequence of the isolated TrHSFB2a gene comprises an open reading frame (ORF) of 924 bp (Figure 1a), which constitutes a protein of 307 amino acids (Figure 1c). Inter-protein scan results showed that this protein belonged to the heat shock transcription family and was predicated as the heat stress transcription factor B-2a (HSFB2-a). It contained a heat shock factor-type, DNA-binding domain (HSF-DNA-bd) of 93 amino acids (20–113), commonly associated with DNA-binding transcription factor activity, sequence-specific DNA binding and regulation of DNA-dependent cellular transcription. The N-terminal region contained a helix-turn-helix motif (H2-T-H3) in the center of the DNA binding domain (DND) (Figure 1c). Based on the homology of amino acids, TrHSFB2a showed an overall 80.46%, 70.61% and 73.74% homology with TpHSFB2b, MtHSFB2b and CarHSFB2a, respectively (Figure 1b). Additionally, amplification and sequencing of TrHSFB2a from white clover genomes showed it has one intron of 107bp, similar to other HSF genes of plants. Based on conserved domains of HSF genes, these are divided into Class A, B and C members. Phylogenetic tree constructed using 27 HSF proteins showed TrHSFB2a clustered with class B HSF proteins of closely related species and Arabidopsis, indicating that it is one of class B HSF proteins (Figure 1d).
Bioinformatics tools were used to understand physiochemical and structural charac-teristics of TrHSFB2a and results are presented in Supplementary Figure S1. Using pro-param predication [31], it was found that the molecular formula of TrHSFB2a was C1499H2383N425O475S11, molecular weight was 34,311.63, theoretical isoelectric point was 8.7, instability index was 49.92, and it was an unstable protein. DeepTMHMM [32] predicted that it was a globular protein and had no transmembrane structure (Supple-mentary Figure S1a). Hydrophobicity analysis using ProtScale revealed that it was a hy-drophobic protein (Supplementary Figure S1b), with an average hydropathicity −0.566. The secondary structure of the encoded protein predicted by SOPMA [33] showed that the secondary structure was composed of 33. 88% α helix, 2.93% β-turn, 55.70% random coil and 7.49% extended strand (Supplementary Figure S1d). The phosphorylation sites of protein sequence determined by Netphos 3.1 server [34] showed TrHSFB2a protein had 58 phosphorylation sites, including 32 serine sites, 19 threonine sites and 7 tyrosine sites (Supplementary Figure S1c). Protein signal peptide analysis using Signalp 4.1 server [35] showed that the protein had no signal peptide (Supplementary Figure S1e). The spatial protein structure predicted by SWISS-Mod. server [36] revealed that the three-dimensional structure had a monomer structure (Supplementary Figure S1f).

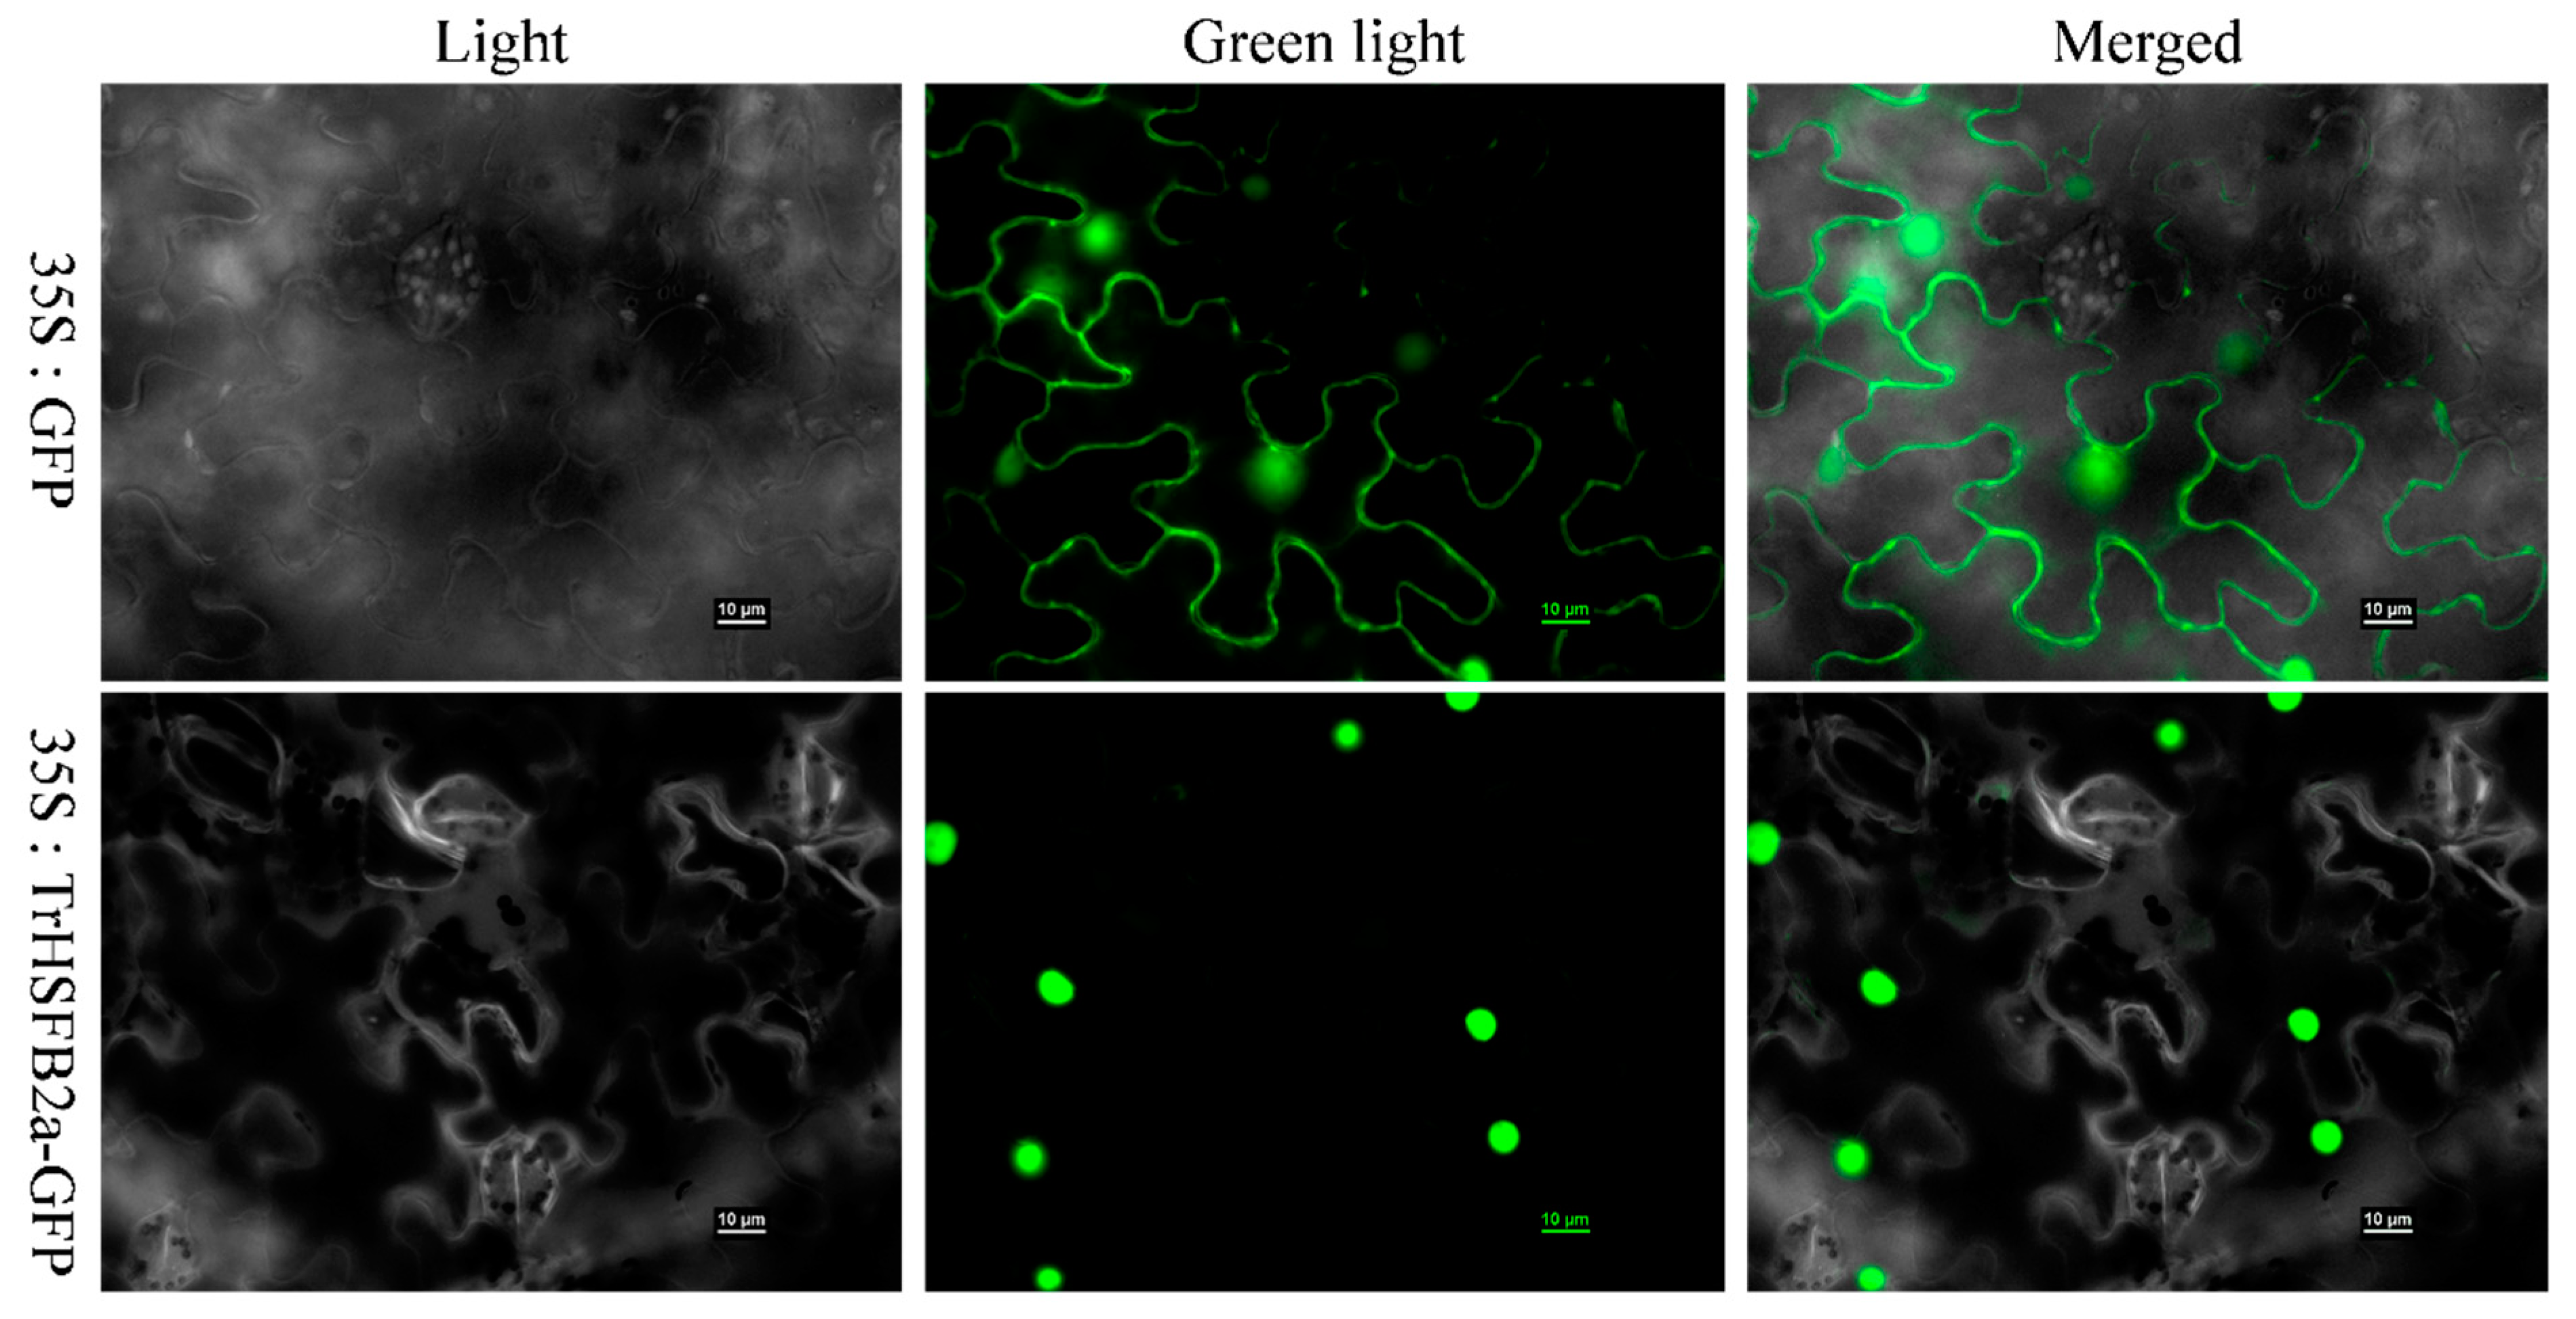
2.2. TrHSFB2a Is a Nuclear Protein

TrHSFB2a was predicated as transcription factors, and transcription factors generally function in the nucleus. To confirm this, we initially used the WoLF PSORT program and predicted its location in the nucleus, then ligated the coding region of TrHSFB2a to 3′ end of GFP gene in pSUPER1300 containing 35S promoter, while GPP gene alone with promoter served as control. The subcellular location of TrHSFB2a protein was determined by transiently expressing TrHSFB2a::GFP fusion protein in the leaves of Nicotiana benthamiana. As expected, the TrHSFB2a::GFP protein is localized in the nucleus (Figure 2).

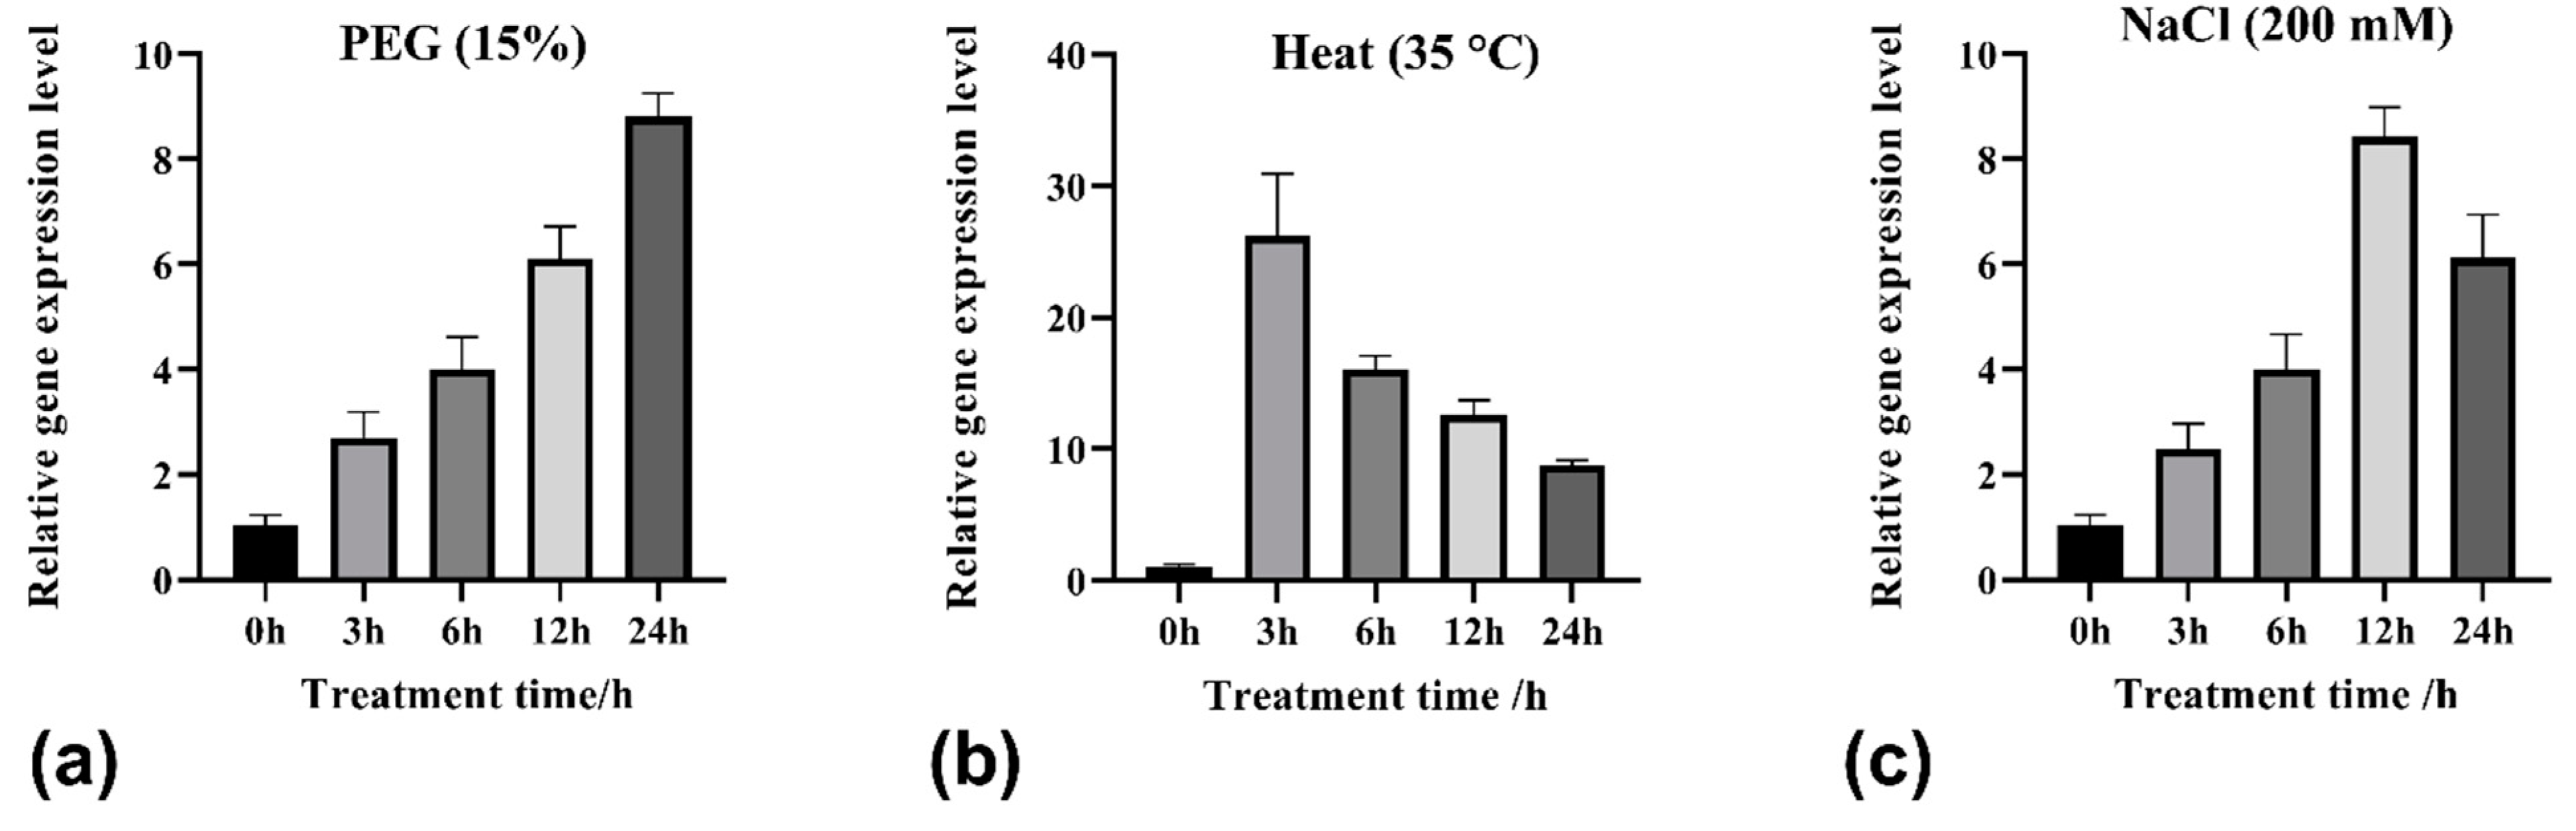
2.3. Relative Expression of TrHSFB2a in White Clover under Different Conditions

A previous transcriptome study of our research group showed that TrHSFB2a is strongly expressed in white clover under drought stress [28]. After isolating TrHSFB2a from white clover, its expression pattern was studied. The four-week-old white clover plants were subjected to drought (PEG6000 15% w/v), heat (35 °C) and salt (NaCl 200 mM) stresses. Total RNA of whole plants (root + shoot) was isolated after 0 h, 3 h, 6 h, 12 h and 24 h and used to construct cDNA for determining relative gene expression levels. A relative expression of TrHSFB2a was determined under normal conditions (0 h) in white clover, indicating that this gene is also expressed under normal conditions, at least in one-day-old white clover plants. Under polyethylene glycol (PEG6000 15% w/v) and salt stress of 3 h, its increased expression was observed, which kept increasing for 12 h under salt stress and, at least, up to 24 h under drought stress. However, the expression pattern of TrHSFB2a under heat stress was not the same. In heat stress, a strong expression of TrHSFB2a was detected after 3 h, and then it reduced continuously but remained relatively higher than the highest levels observed under salt and drought stresses (Figure 3). These results indicated that TrHSFB2a was involved in abiotic stress responses in white clover and more strongly induced under heat stress.

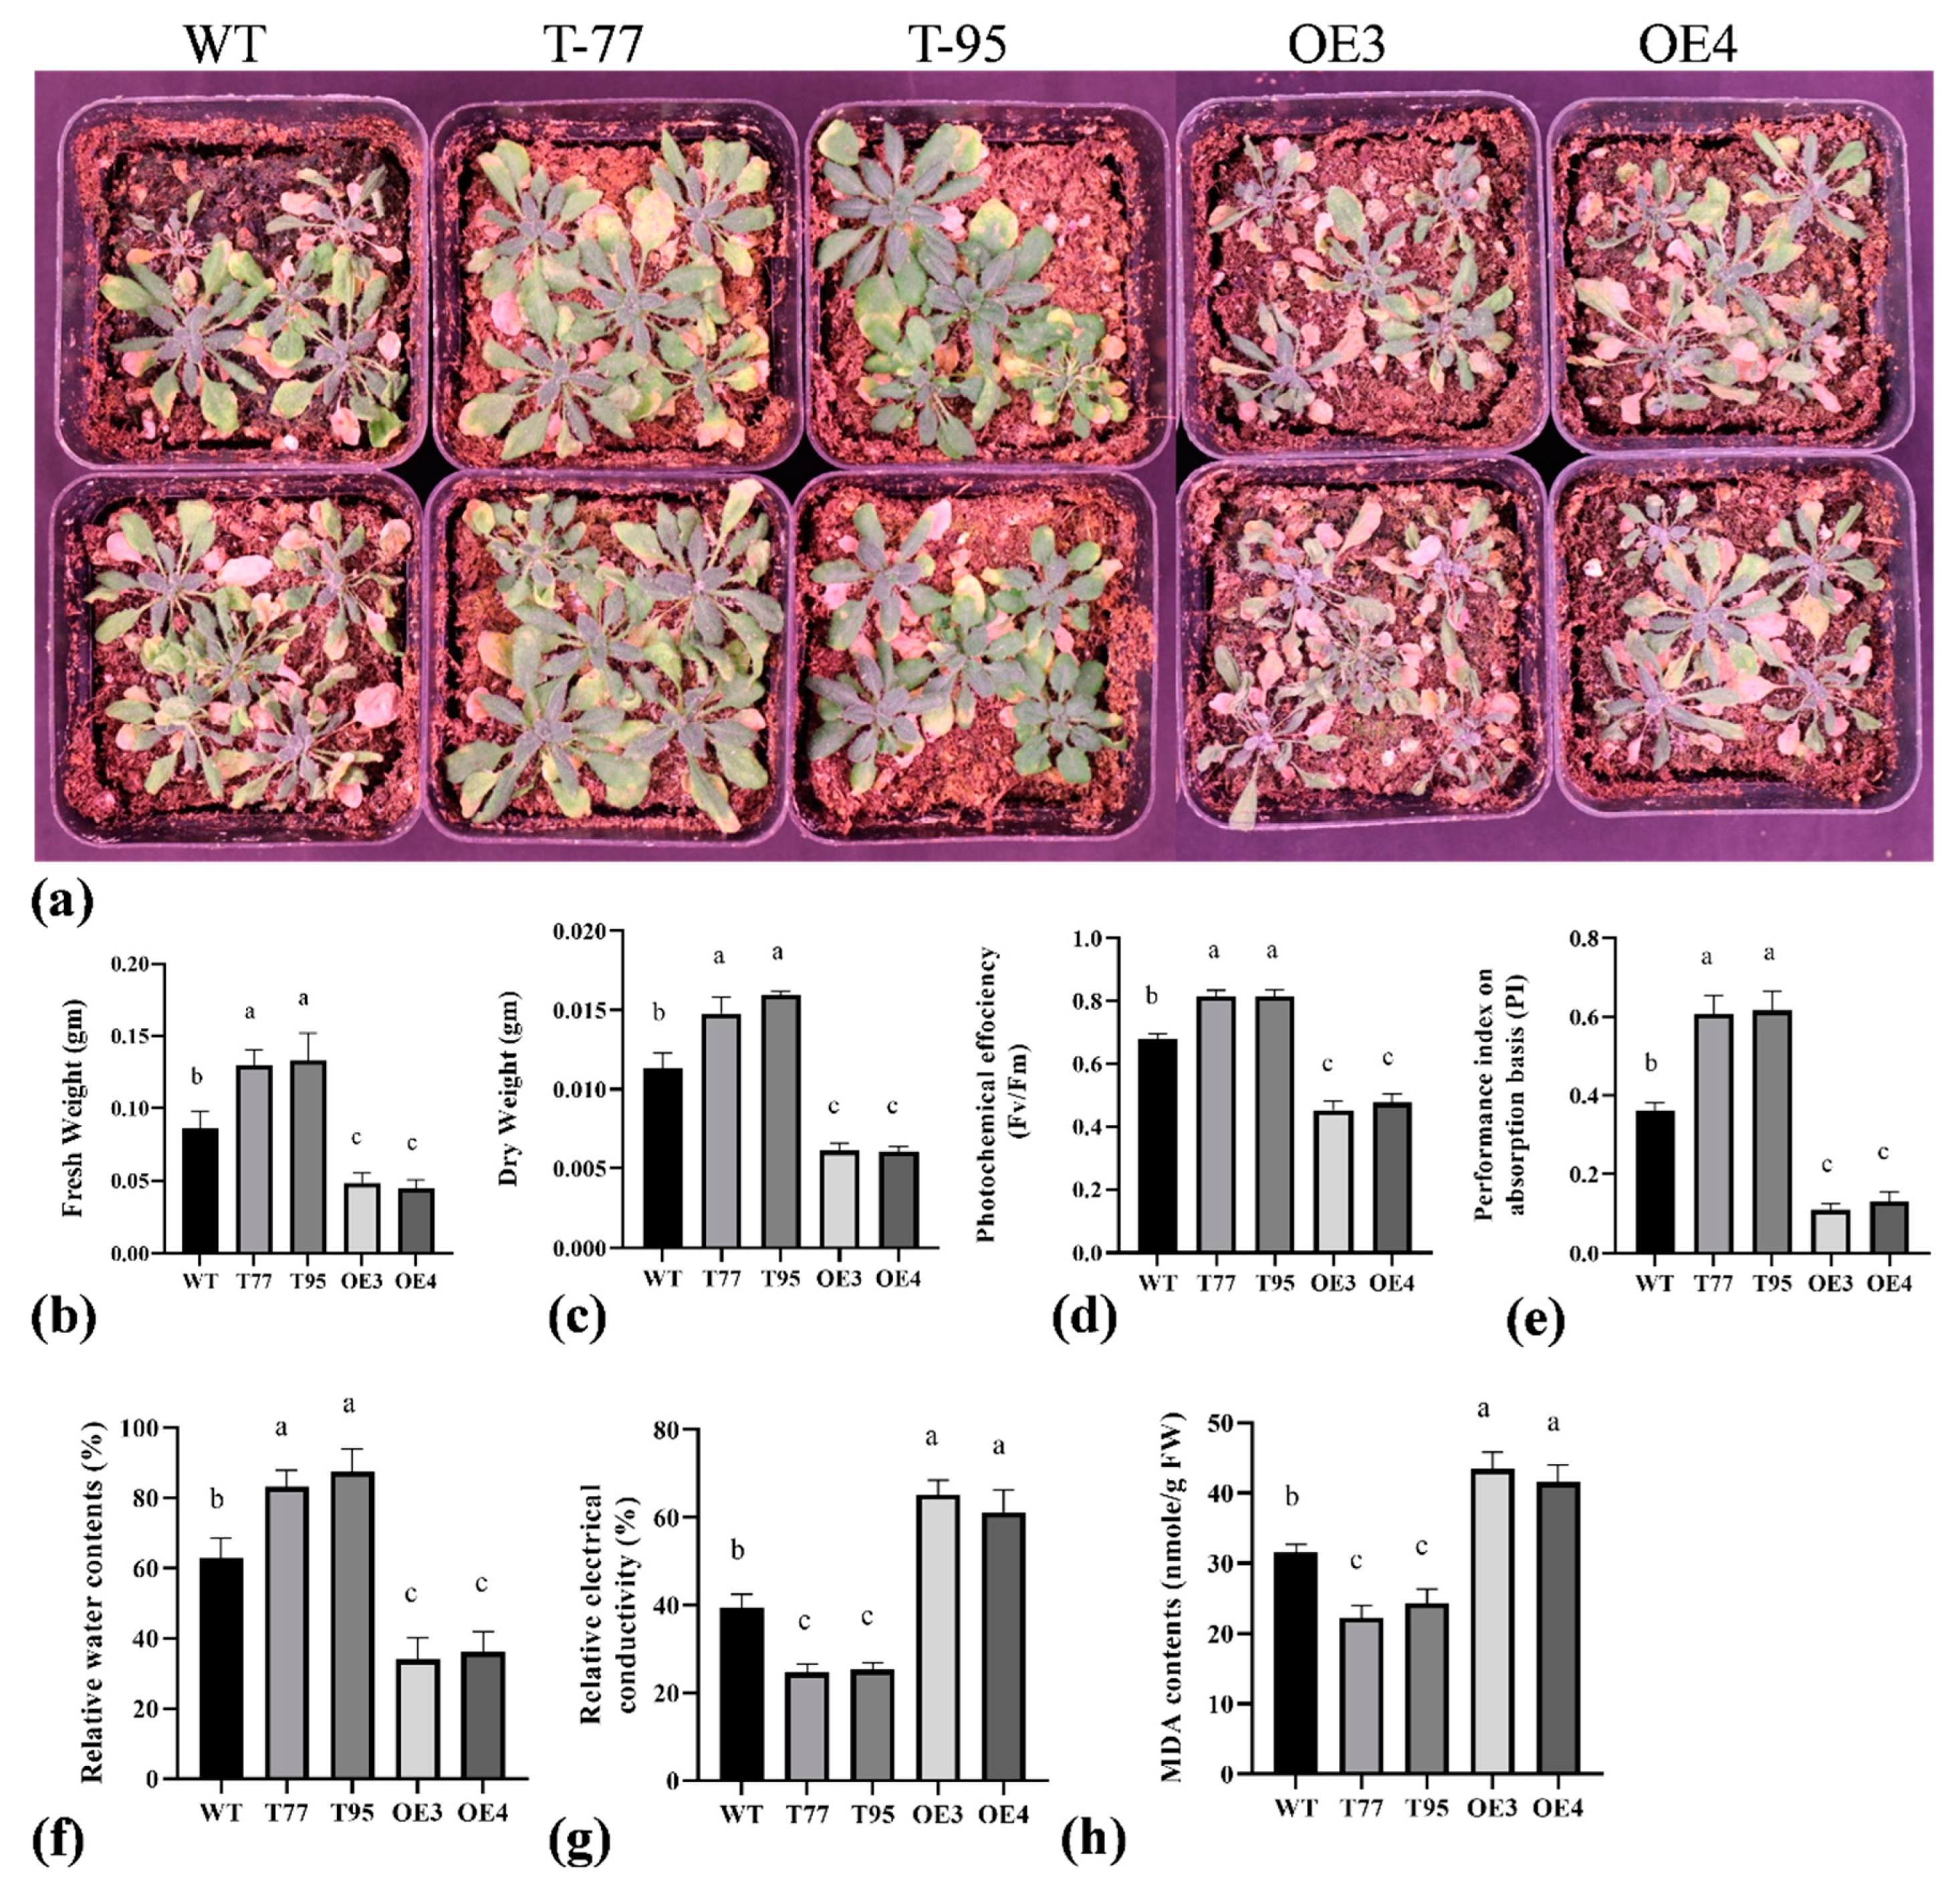
2.4. TrHSFB2a Negatively Regulates Drought Tolerance in Transgenic Overexpression Arabidopsis

The detection of TrHSFB2a expression under abiotic stress observing its role in stress responses in detail. Therefore, the overexpression vector of TrHSFB2a was constructed and transferred into Arabidopsis thaliana, and thereby, constructed the TrHSFB2a overexpression Arabidopsis. After developing homozygous T3 lines, the relative expression of TrHSFB2a was analyzed in transgenic Arabidopsis (Figure 4g), and two lines highly expressing TrHSFB2a were selected for a comparative analysis along with the wild type and T-DNA lines of Arabidopsis gene AtHSFB2a, purchased from Arabidopsis share platform “https://www.arashare.cn/index/ (accessed 18 December 2020)”, in which TrHSFB2a has been silenced. Under normal conditions, there was no significant difference in plant root length among groups after 7 d of transplanting in ½ MS medium (Figure 4d,e,h). However, the soil-grown overexpression Arabidopsis were significantly lower in fresh and dry weight compared to wild-type Arabidopsis, and T-DNA lines of Arabidopsis were significantly higher in fresh and dry weights compared to wild type (Figure 4i,j), suggesting that TrHSFB2a produced negative effects on early plant growth and development, which was also obvious in phenotypic observations (Figure 4f), suggesting that overexpression or silencing of TrHSFB2a at least do not cause detrimental effects on growth and developments of Arabidopsis. Two overexpression lines (OE3 and OE4), two T-DNA lines (denoted as T77 and T95) and the wild type (Wt) were subjected to different drought treatments.
Initially, 5-day-old seedlings of Arabidopsis (wild type and transgenic) were transferred to ½ MS plates containing 200 or 300 mM mannitol. After two weeks, the overexpression lines (OE-3 and OE-4) under 200 mM mannitol showed a significantly higher leaf-yellowing rate compared to the wild type, while most of the plants of overexpression lines under 300 mM mannitol dried; the wild type although had curled leaves, all were green (Figure 5a,b). Moreover, root length was significantly higher in T-DNA lines and was significantly lower in overexpression lines under 200 mM mannitol stress, indicating that TrHSFB2a possibly negatively regulates drought stress (Figure 5c–e). Three-week-old wild-type and transgenic Arabidopsis plants were also subjected to drought stress in nutrient soil by withholding water. Plants were well watered, and then, irrigation was stopped. After 12 days of water withholding, all the leaves of overexpression lines OE3 and OE4 wilted and dried, while wild-type plants showed less wilting compared to the overexpression lines, while T-DNA lines did not exhibit leaf wilting at this stage (Figure 6a). Three days after rewatering, more than 70% of wild-type plants recovered, while only about 30% of overexpression plants could survive. These observations indicated that the overexpression of TrHSFB2a significantly reduced drought tolerance, while suppressing its expression significantly increased drought tolerance in transgenic Arabidopsis at the seedling stage. Fresh weight, dry weight and photochemical efficiency determine how plants grow under stressed conditions. Relative water contents (RWC) of the plant showed their water status in terms of physiological consequences under water-deficient conditions. The cell membrane permeability and lipid peroxidation are the general indicators of damage in plants caused by different stresses and are measured as REC of electrolyte leakage and malondialdehyde (MDA) contents, respectively. Lipid peroxidation is generally associated with the oxidation of lipids of the cell membrane; thus, its quantification determines the extent of cell membrane damage. In the current study, the phytochemical efficiency of photosystem II and performance index was determined after 10 days of water withholding. Results showed that overexpression lines had significantly reduced photochemical efficiency of Photosystem II and the performance index compared to wild type, while T-DNA lines had significantly higher photochemical efficiency of photosystem II and performance index than that of wild type. Similarly, fresh weight, dry weight and RWC were significantly lower in overexpression lines compared to wild type and were significantly higher in T-DNA lines compared to wild type (Figure 6). In contrast, REC and MDA contents were significantly higher in overexpressed lines than that of wild type and significantly lower in T-DNA lines than that of wild type (Figure 6). These results, along with phenotypic data, demonstrated that TrHSFB2a negatively regulates drought stress, and RNA interference in T-DNA lines improved the drought tolerance in Arabidopsis.

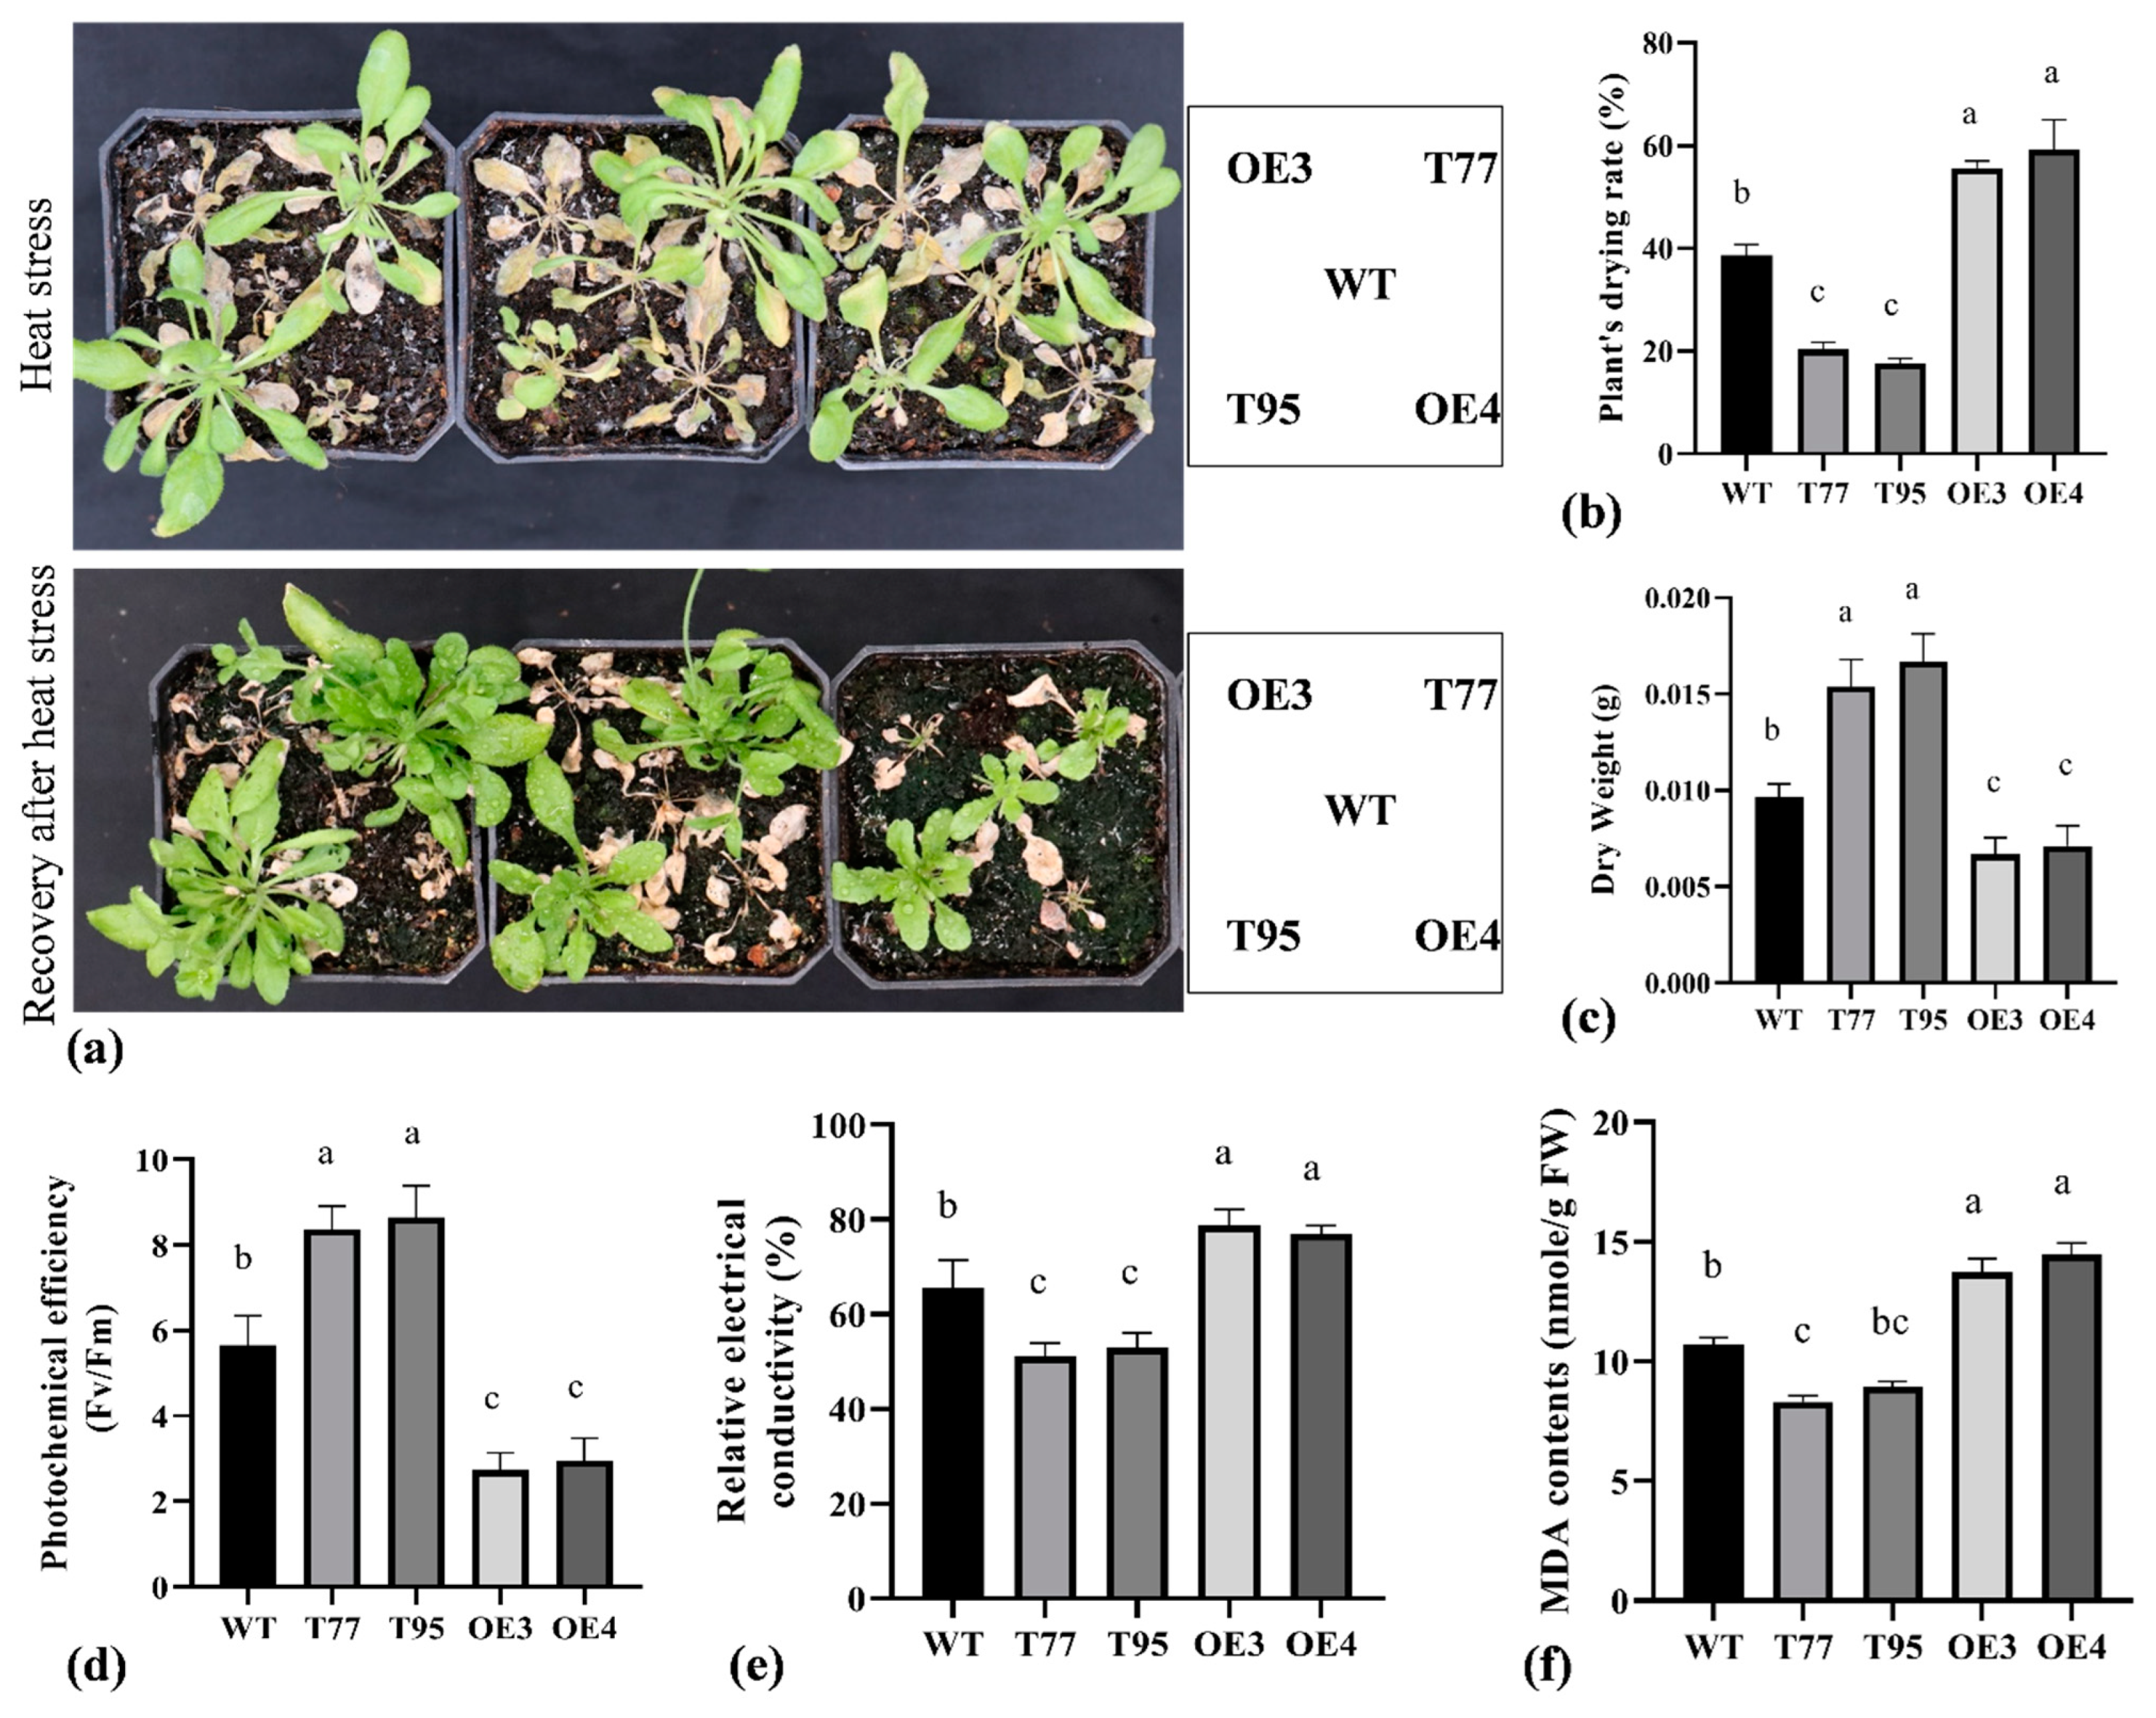
2.5. TrHSFB2a Negatively Regulates the Heat Tolerance in Arabidopsis

Heat shock proteins and transcription factors are generally involved in regulating heat stress responses. One-month-old soil-grown plants were transferred to an incubator adjusted to 35 °C temperature for two weeks in order to validate the role of TrHSFB2a in Arabidopsis under high-temperature stress. Photochemical efficiency, REC and MDA contents were determined after one week, while plants' dying rate and dry weight were measured after two weeks when phenotypic differences appeared significantly. As shown in Figure 7, around 60% of plants of overexpression lines completely dried and could not recover when transferred in normal conditions. The rate of drying was significantly higher in overexpression lines than that of wild type. In comparison, T-DNA lines showed a significantly lower drying rate compared to wild type (Figure 7a). Photochemical efficiency and the plant’s dry weight were significantly lower for overexpression lines compared to wild type and significantly higher for T-DNA lines. In contrast, overexpression lines showed significantly increased REC % and MDA contents than that of wild type, and T-DNA lines had significantly reduced REC % and MDA contents compared to wild types, indicating that RNA interference lines had lower damage at the cellular level compared to wild type, while overexpression lines showed opposite trends. Collectively, phenotypic and physiological data demonstrated that TrHSFB2a negatively regulates heat tolerance in Arabidopsis at the seedling stage.

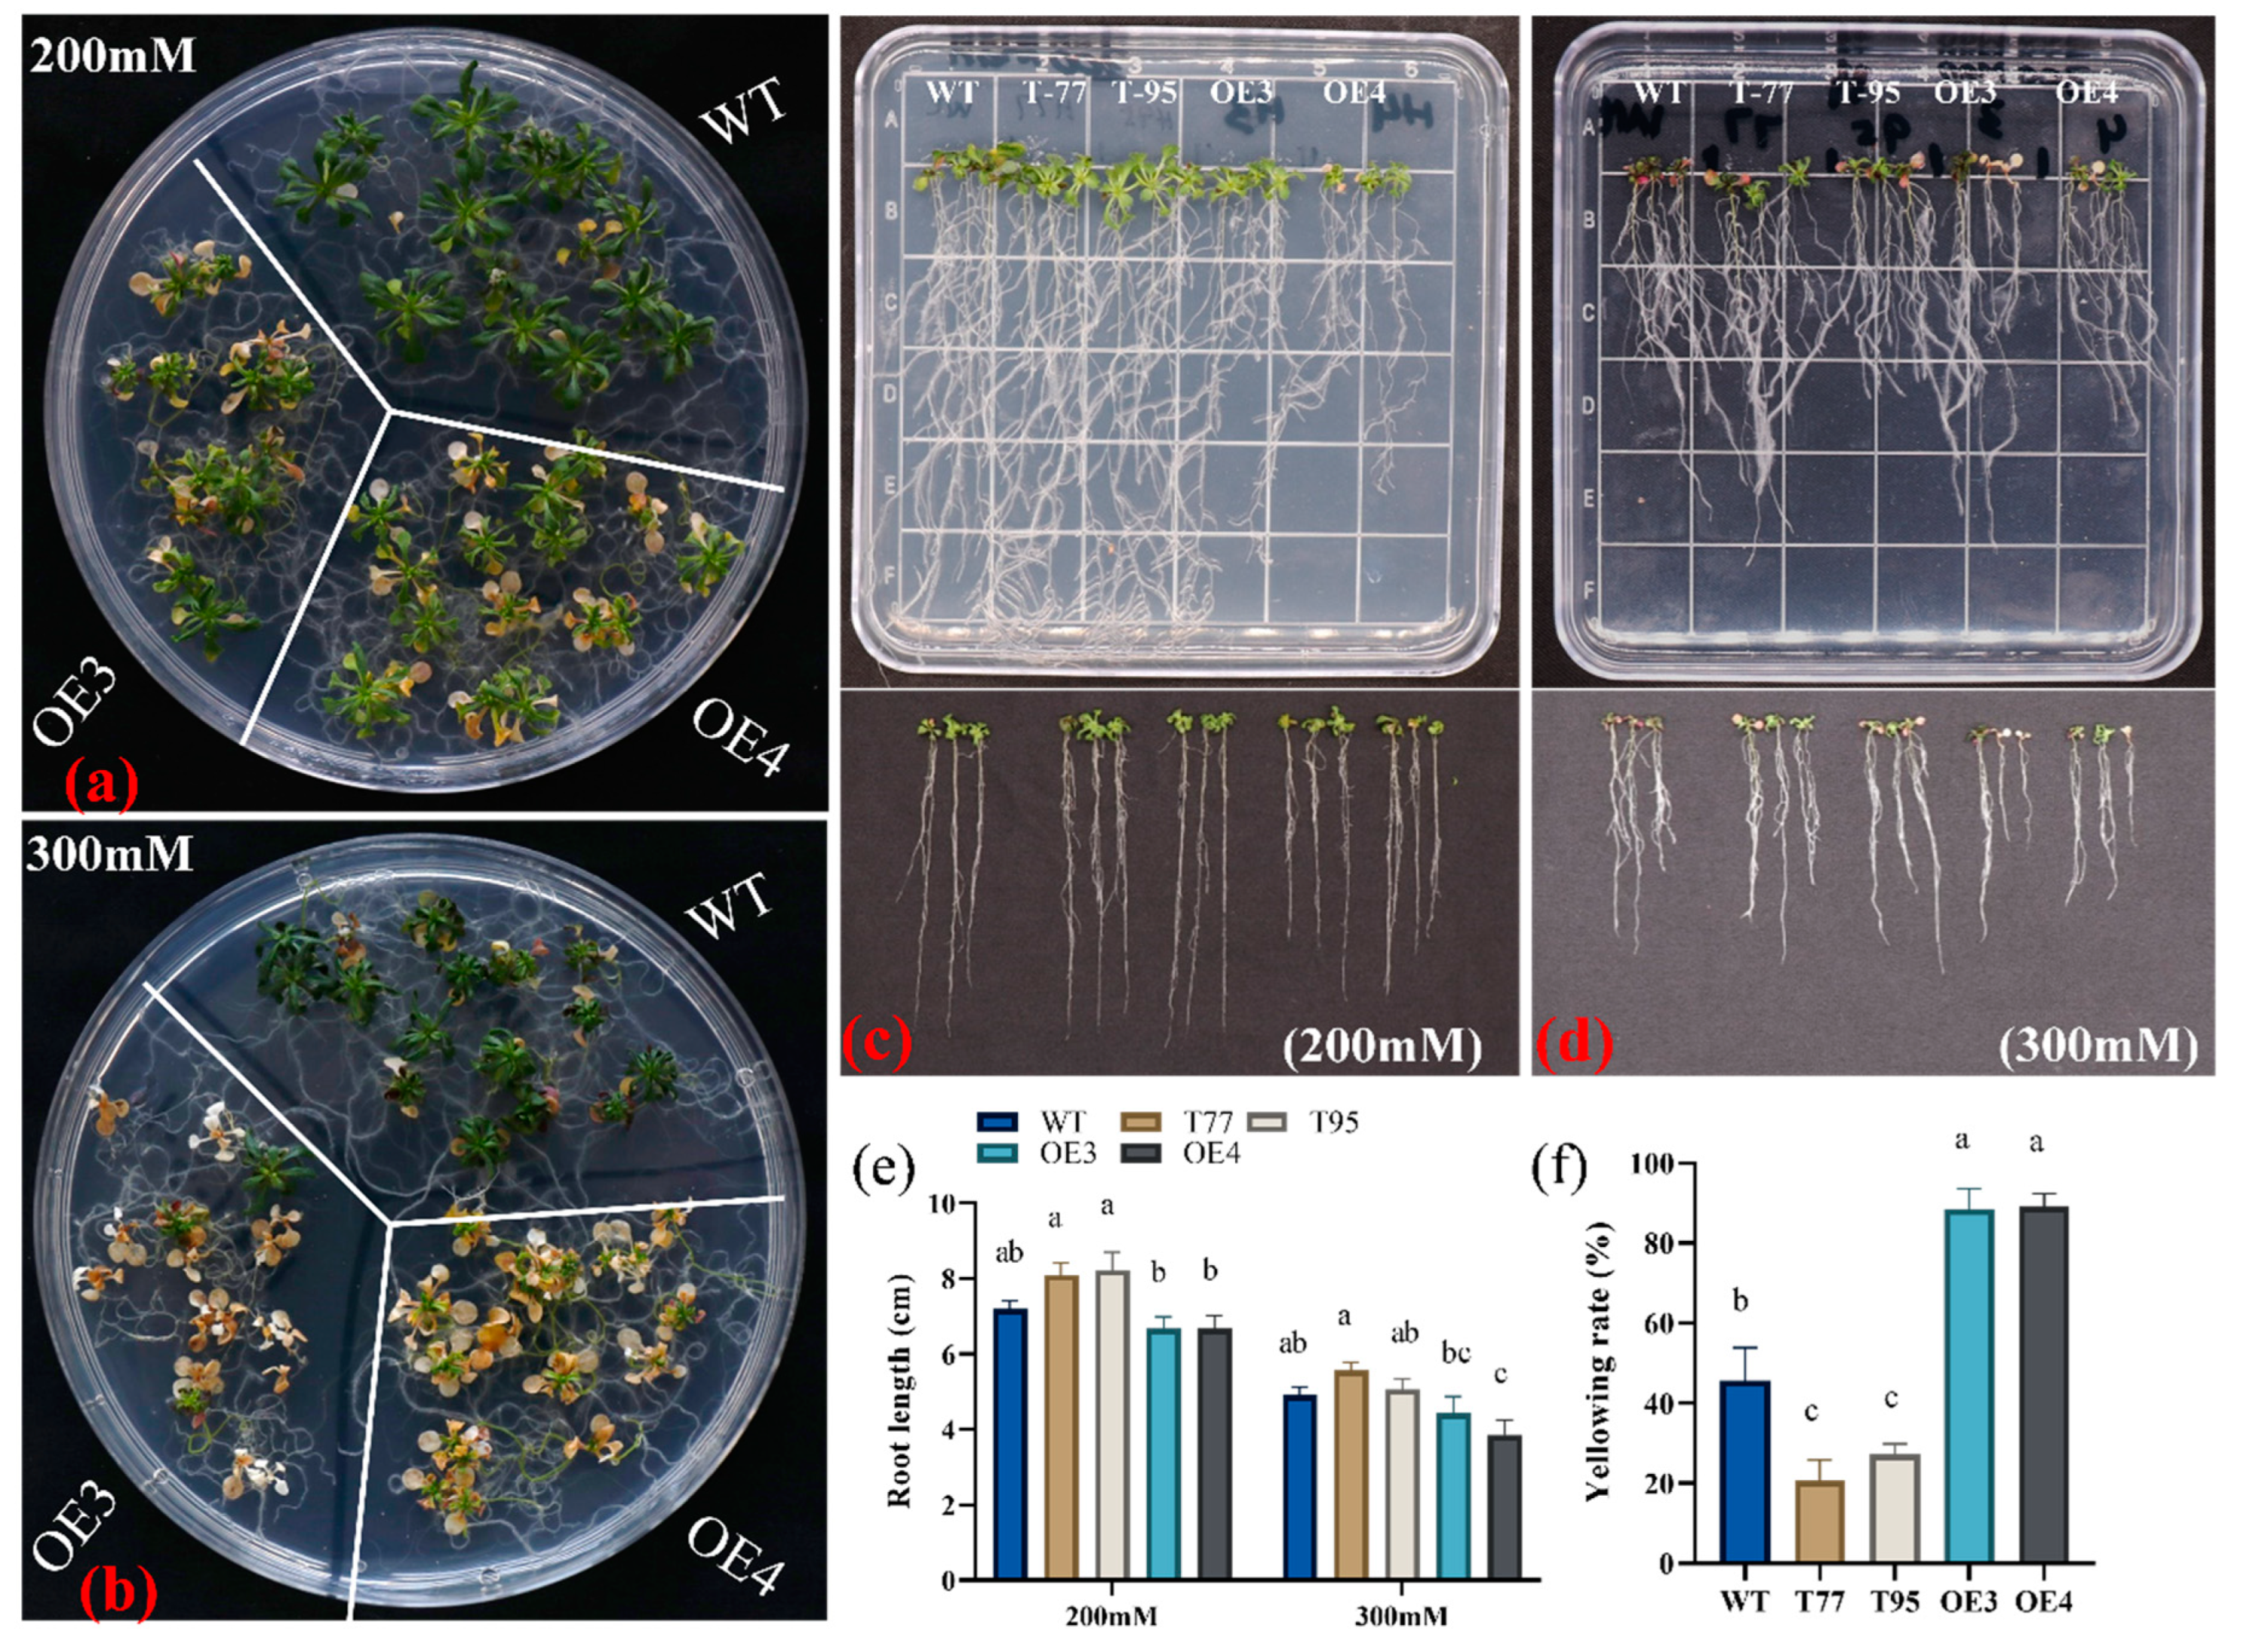
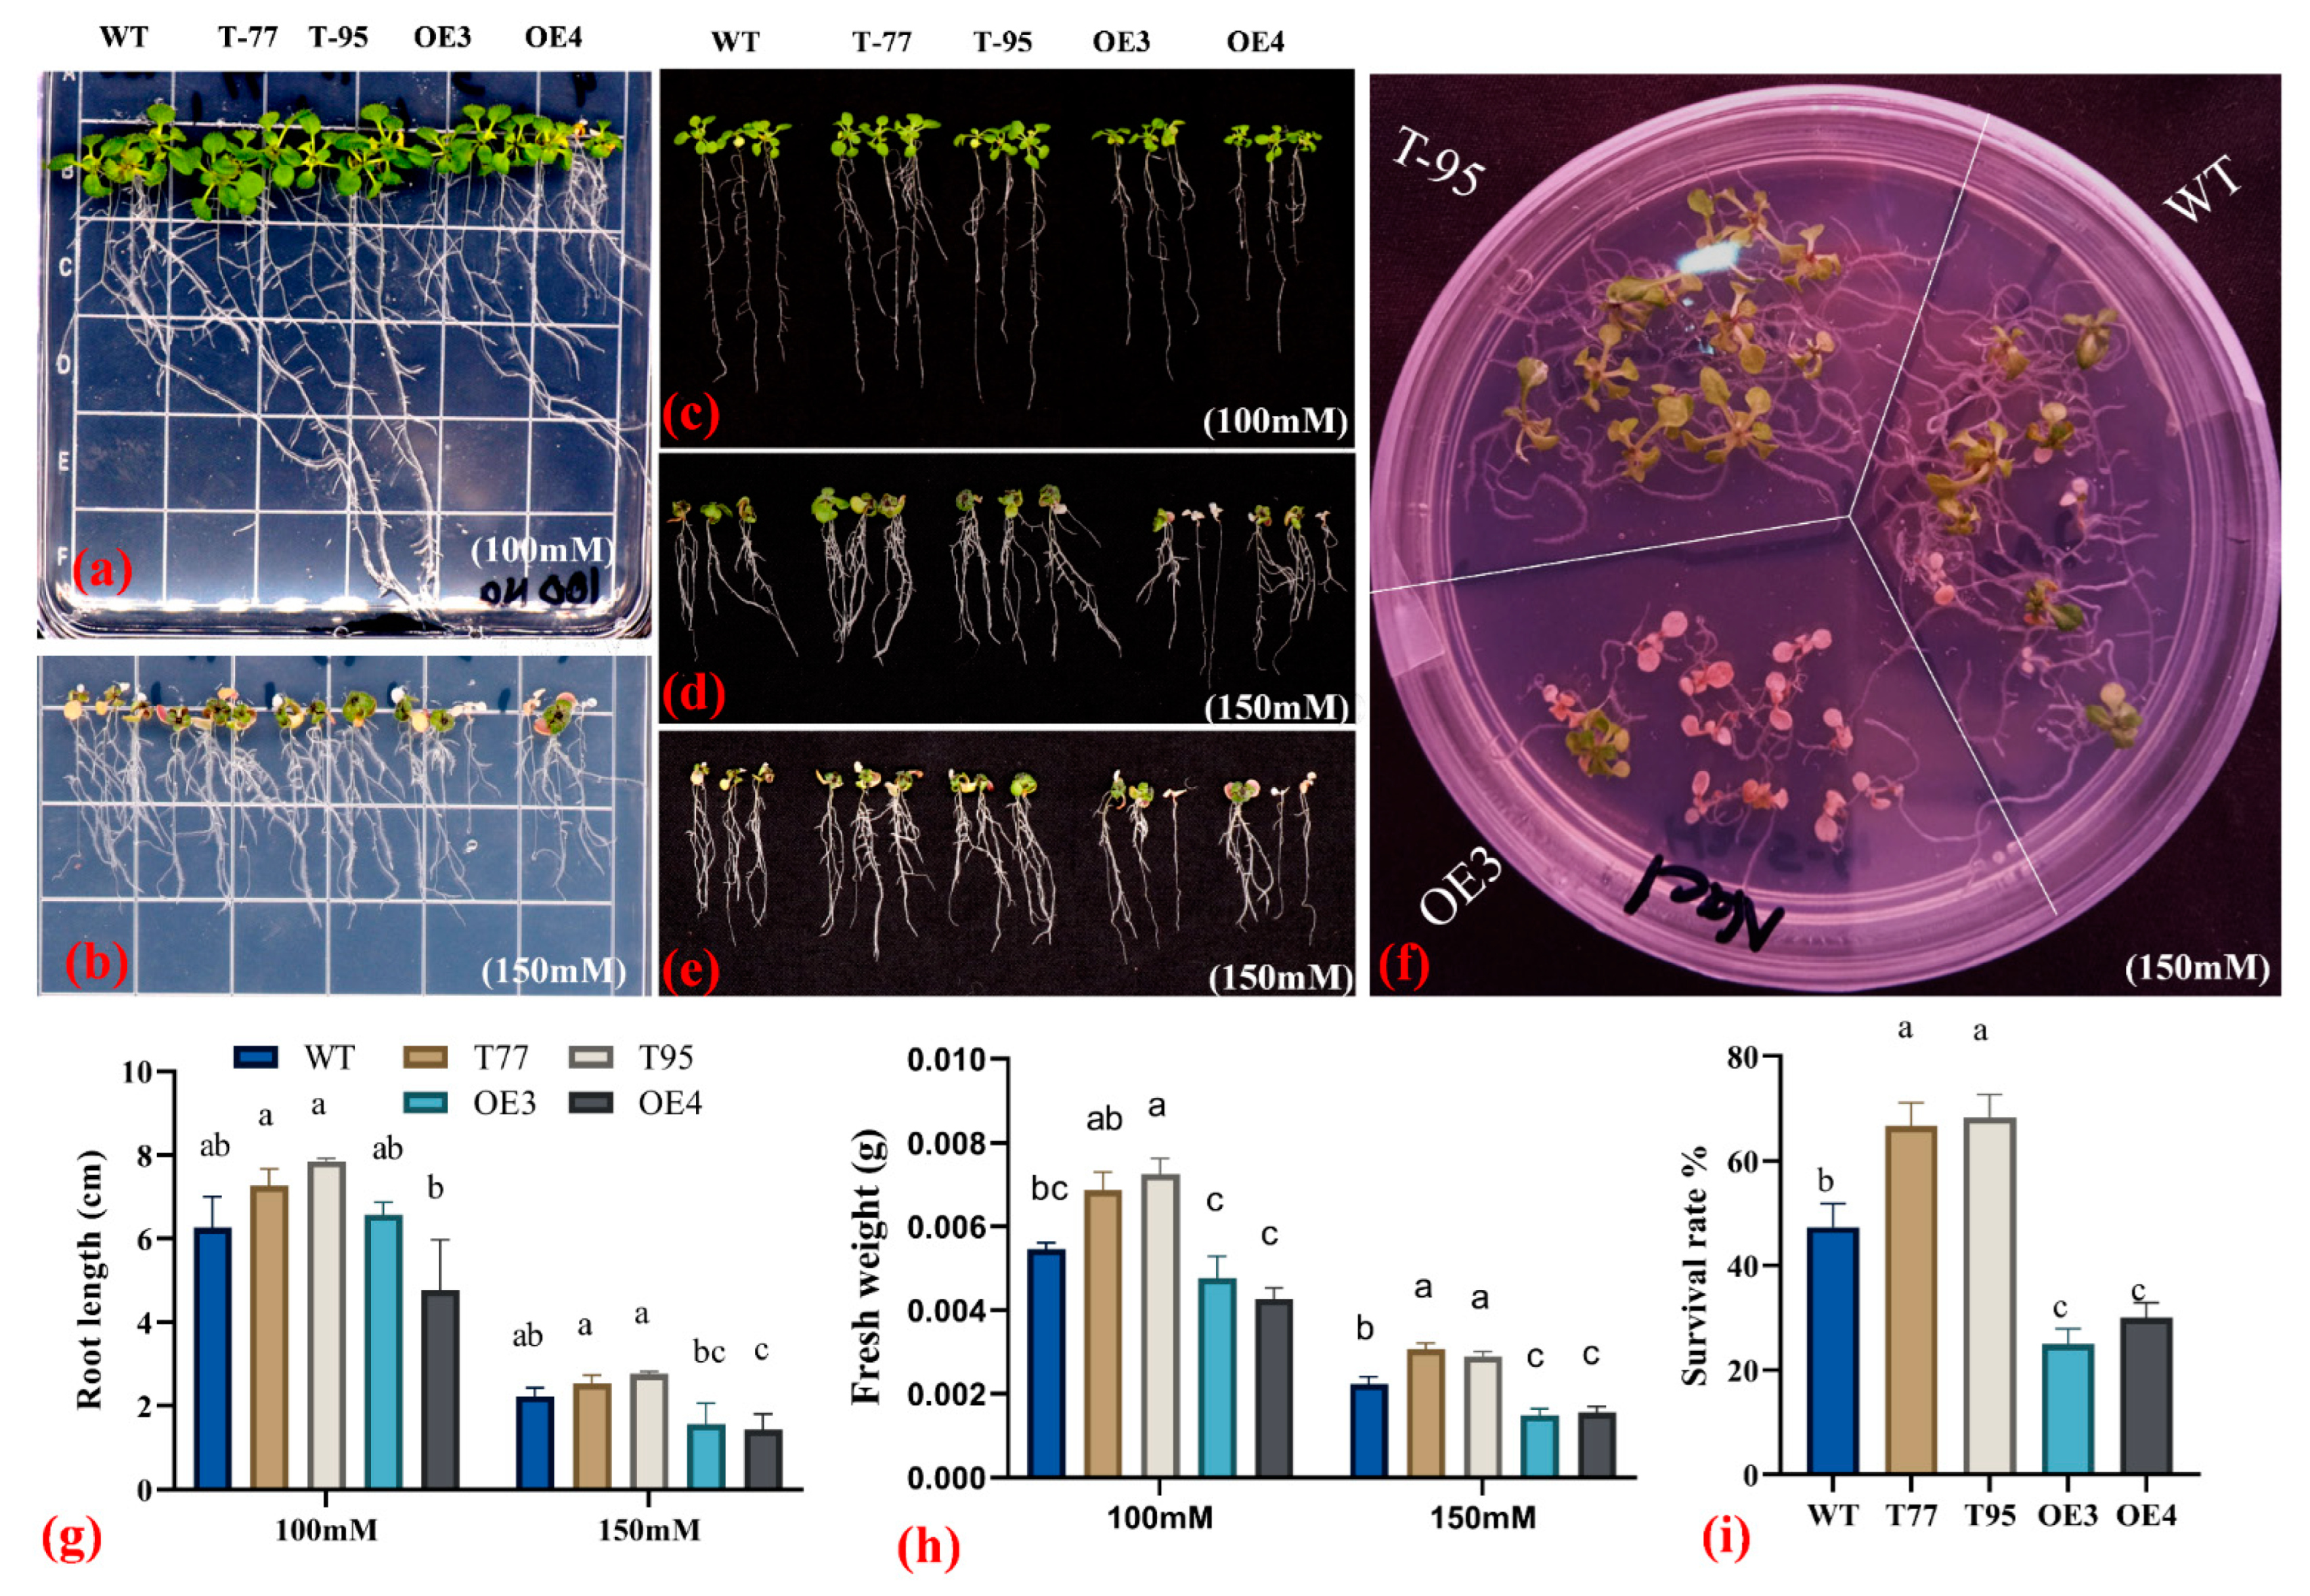
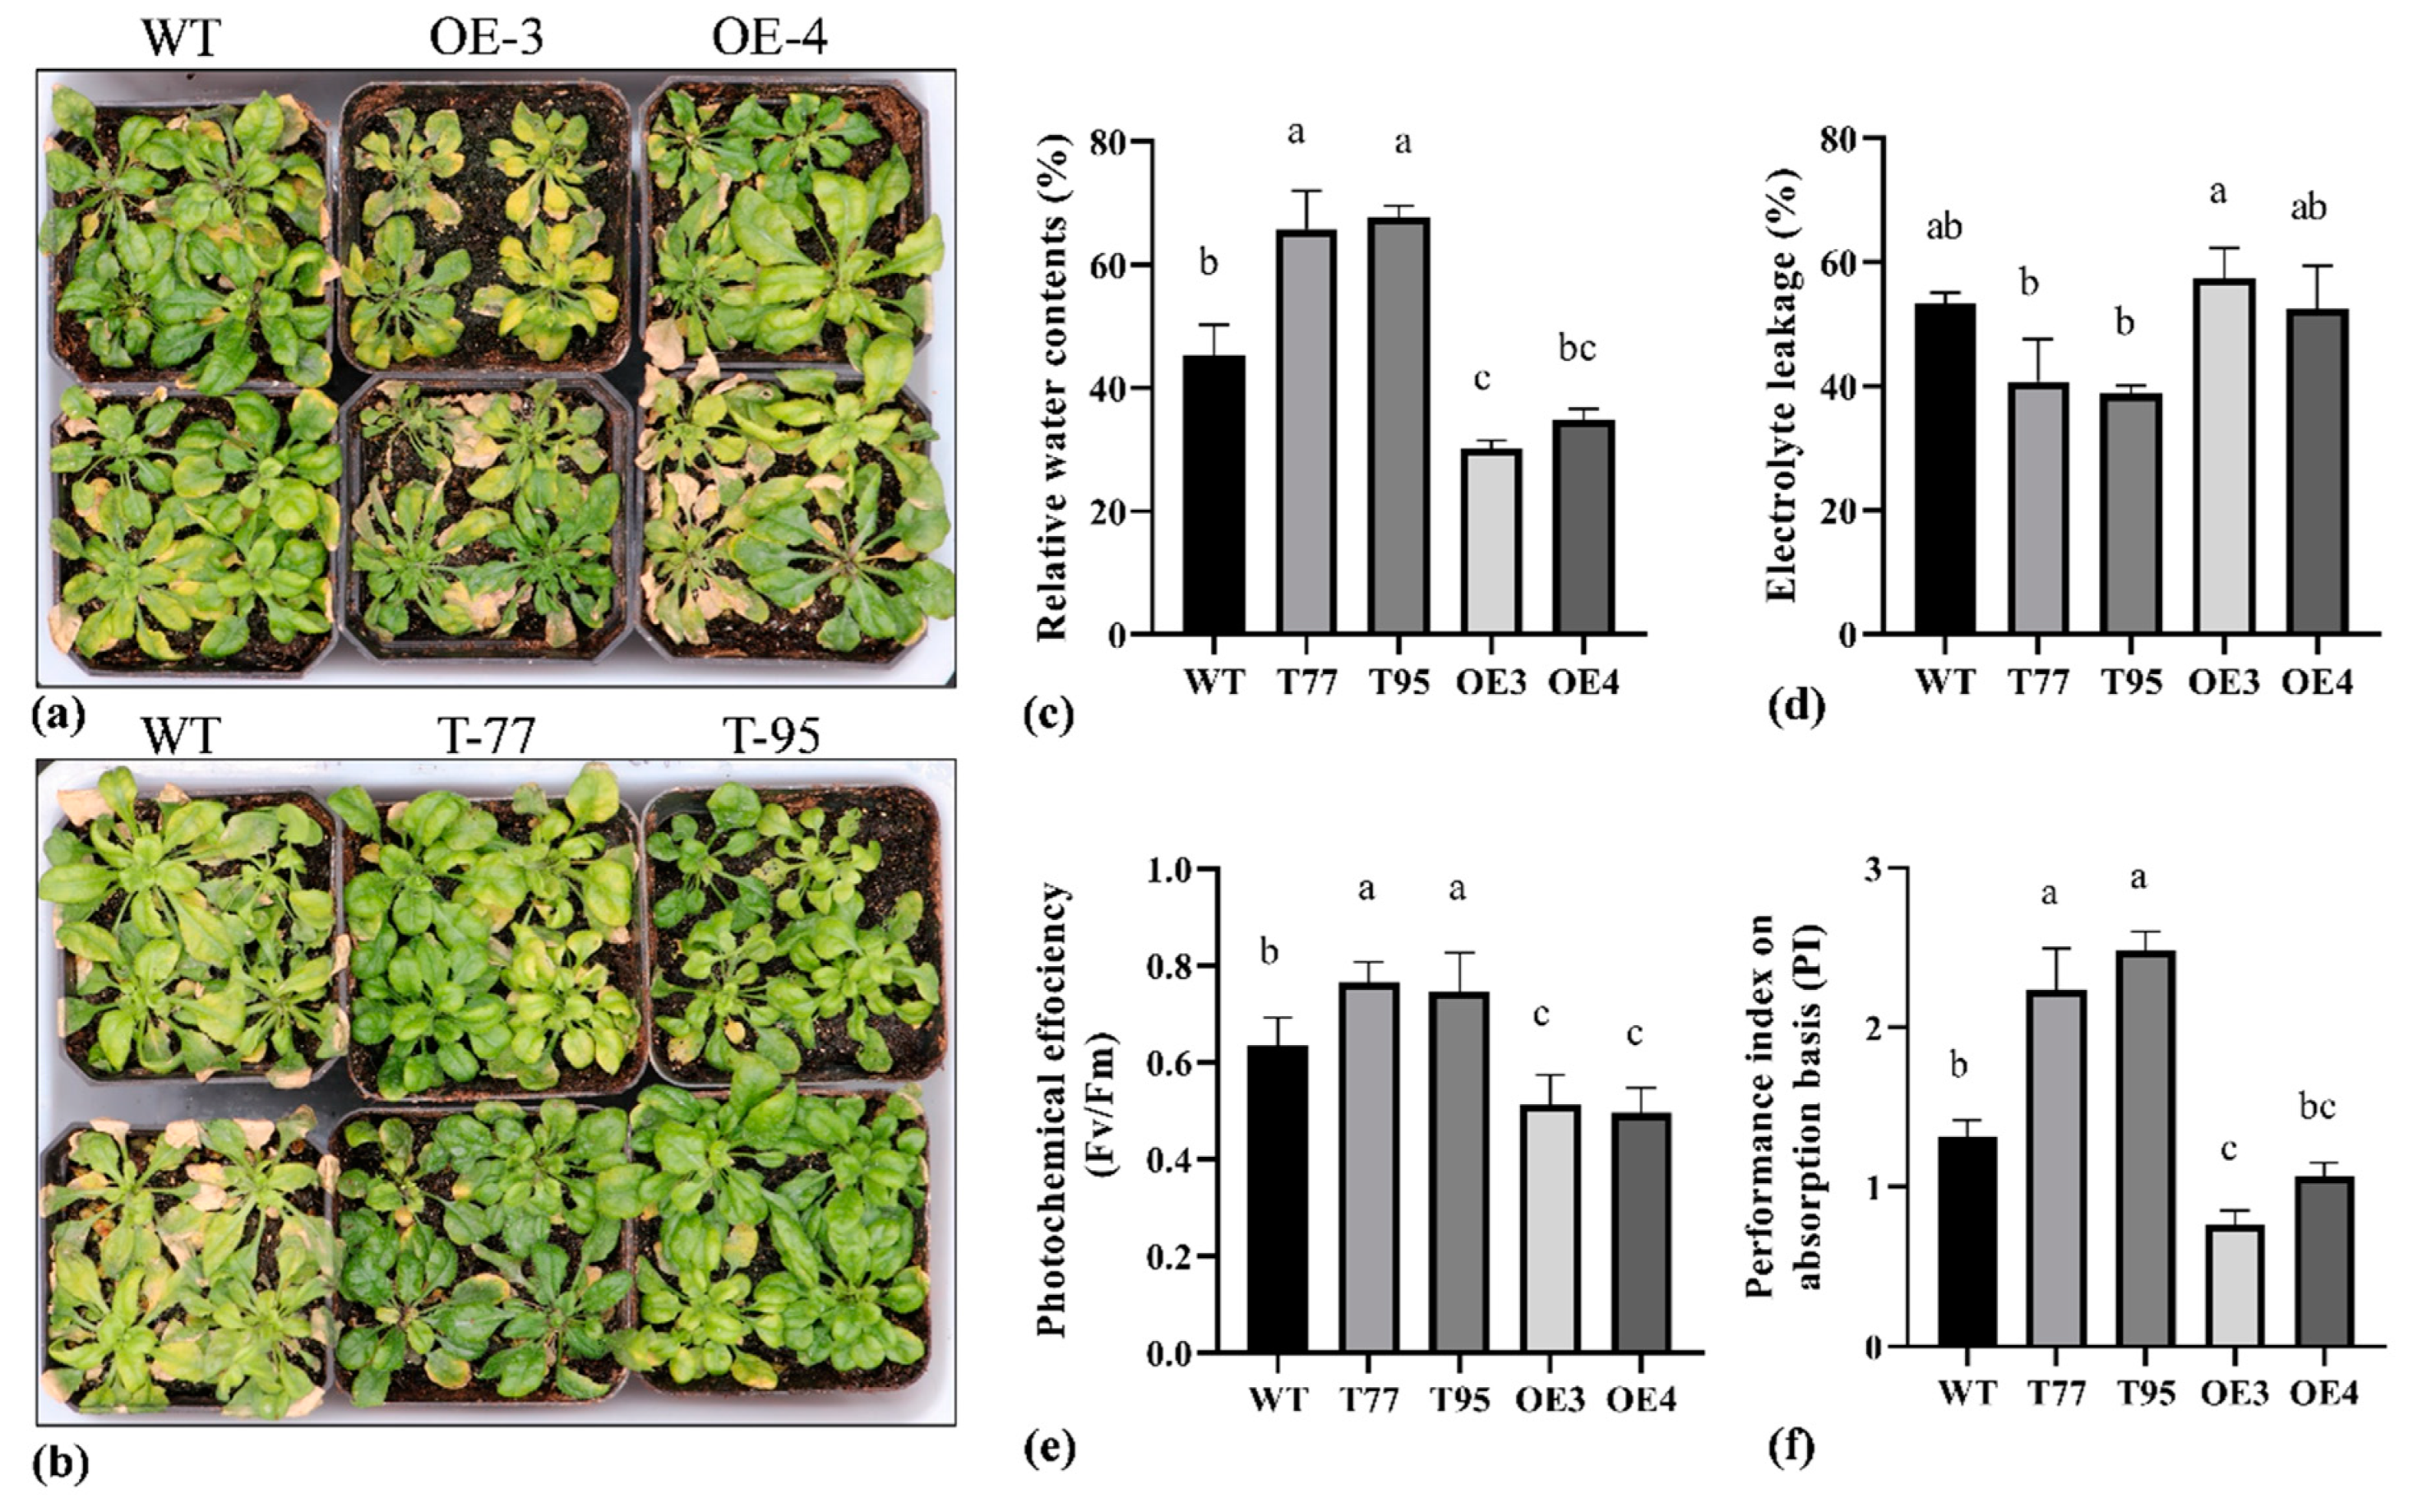
2.6. TrHSFB2a Negatively Regulates Salt Tolerance in Arabidopsis

To check how the TrHSFB2a gene functions under salt stress conditions, we observed the overexpression and RNA interference T-DNA lines of Arabidopsis in ½ MS media and in soil. At five days old, seedlings were shifted to 1/2MS+Agar plates, supplemented with 100 mM or 150 mM NaCl, and phenotypic data were recorded at 10 d of transplanting. The results showed that TrHSFB2a had a significantly lower rate of survival (around 20%) compared to wild type (47.33%), and RNA interference T-DNA lines showed a significantly higher survival rate (more than 65%) than that of wild type (Figure 8), suggesting that overexpression of TrHSFB2a significantly reduced tolerance of salt, while RNA interference of TrHSFB2a can enhance salt tolerance of transformed Arabidopsis at the seedling stage. Root length was significantly higher in T-DNA lines compared to wild type under 100 mM and 150 mM salt stress, while one overexpression line (OE-3) showed significantly reduced roots length than that of wild type, and one (OE-3) did not show a significant difference with the wild type under both salt stress treatments. However, the total fresh weight was significantly higher in T-DNA lines and significantly lower in overexpression lines compared to wild type, respectively (Figure 8). Simultaneously, 10 d old wild and transgenic Arabidopsis lines grown on 1/2MS+Agar media were transferred into the soil, grown additionally for three weeks in nutrient soil, then irrigated with 100 mM, 200 mM and 300 mM NaCl gradients water, each twice after every two days (Figure 9a,b). RWC, EC, photochemical efficiency and performance index were measured after two times of 100 mM and 2 times 200 mM saline water irrigation, on the 8th d of treatment. Results showed that RWC, photochemical efficiency and performance index on an absorption basis were significantly lower in overexpression lines and were significantly higher in T-DNA lines compared to wild type, respectively. In contrast, EC % had significantly increased in overexpression lines and was significantly lower in T-DNA lines compared to wild type (Figure 9c–f). The data of physiological analysis, together with phenotypic observations, indicated that overexpression of TrHSFB2a reduced salt tolerance, while RNA interference for this gene can improve the salt tolerance of Arabidopsis at seedling and developing growth stages.

3. Discussion

Plant heat shock transcription factors (HSFs) play important roles in regulating biotic and abiotic stress responses, especially heat stress regulation [5,6]. HSFs can be divided into three classes (A, B and C) based on their domain characteristics, which have been reported to function differently in different stress responses [5]. The HSFs of class A have been generally reported as the positive regulator of stress tolerance in different plant species and possess an exclusive C terminal activation domain [16]. The class C HSFs have also been shown to play important functions in mediating the effects of heat, salt and osmotic stress in plants [37,38,39]. The class B HSFs including HSFB1 and HSFB2, show repressive activity and are reported as negative regulators of stress tolerance in Cicer arietinium [40], Oryza sativa [41], Glycine max [42] and Arabidopsis thialiana [26,27]. In the current study, we reported and characterized an HSF of white clover HSFB2a, which belongs to the Class B HSFs family. Current study data suggested that the TrHSFB2a might negatively regulate heat, drought and salt tolerance in transgenic Arabidopsis.

3.1. Abiotic Stress Treatments Induce TrHSFB2a Expression

The expression pattern of TrHSFB2a was investigated under different treatments of abiotic stresses, including high temperature, PEG and salt stress. The expression of TrHSFB2a was strongly induced under drought stress, which is in accordance with our previous study of transcriptome analysis of white clover under drought stress [28]. Moreover, TrHSFB2a is strongly upregulated under heat stress like other HSFs members, as well as strongly expressed in response to NaCl stress. These observations are well in agreement with previous studies that HSFB2 candidates expressed under high temperature, high salinity and drought conditions [23,40,41]. Like stress-related cis-acting elements, including HSE, DRE, ABRE, MYCRS and MYBRS, present in the promoter region of the HSFB2 genes in Arabidopsis and other plant species [5,43,44], they might also be involved in inducing response and the expression of TrHSFB2a in white clover under drought, heat and high salinity stresses, but it needs to be further verified.

3.2. TrHSFB2a Negatively Regulates Drought, Heat and Salt Stress in Arabidopsis

The overexpression of TrHSFB2a in Arabidopsis, although it enhanced the transcriptome abundance and RNA interference of AtHSFB2a in Arabidopsis, reduced the accumulation of AtHSFB2a transcripts. There were no significant differences in plant stature, root length or fresh and dry weights under normal conditions. It indicated that TrHSFB2a does not have significant effects on plant development under normal conditions, as similarly observed in the effects of HSBs of class B on other plant species [40,41]. However, under drought, salt and heat stress, the overexpression of TrHSFB2a significantly reduced plant growth compared to wild type, while RNA interference of AtHSFB2a significantly improved salt, heat and drought tolerance both in ½ MS media and in the soil. By increasing the stress levels (NaCl 150 mM and Mannitol 300 mM) or by extending stress duration, the overexpression of TrHSFB2a led to significantly higher drying and dying rates compared to wild type, while RNA interference of AtHSFB2a exhibited opposite trends. These observations agreeing has been observed in the transgenic lines developed by overexpression and RNA interference homolog of this OsHSFB2b in rice [41] and overexpression of CarHSFB2b of Chickpea in Arabidopsis [40].
RWC, photosynthetic activity, REC percentage and MDA contents are important indicators to assess the stress tolerance potential differences in plants. Under drought and heat stress treatment, the overexpression lines of TrHSFB2a showed higher REC % and MDA contents than that of wild type, and in T-DNA lines of AtHSFB2a, the accumulation of MDA contents and REC % was lower compared to wild type. As electrolyte leakage is an indirect indicator of cell membrane damage due to stress conditions [45,46], the higher REC in TrHSFB2a overexpression lines showed higher cell membrane damage, which had occurred there, while there was comparatively less cell membrane damage in T-DNA lines. One of the end products of lipid peroxidation due to external stresses is MDA, which is a result of membrane damage caused by free radicals [47,48], was higher in overexpression lines and lower in RNA interference lines compared to wild types, representing higher lipid damage in overexpression lines and a lower in T-DNA lines. Abiotic stresses on plants mainly reduce the photosynthetic efficiency of the plants under stress as a result of the negative effects of the abiotic stresses on the biosynthesis of photosynthetic pigments, photosystem performance, CO2 fixation and gases exchanges, and on carbohydrate metabolism, etc. The photosynthetic activity and photosystem performance index significantly reduced overexpression lines and significantly improved in T-DNA lines compared to wild-type user drought, salt and heat stress, indicating better adaptability of T-DNA line and reduced fitness by overexpressing TrHSFB2a gene in Arabidopsis. Moreover, lower RWC, as observed in overexpression lines, can reduce or even completely stop photosynthetic activity in a stressed condition. Leaf wilting, drying, RWC, photosynthetic system performance, REC and MDA-related to plant stress that has been already used to assess the function of HSFs under drought, salt and heat stress in transgenic plants [41,49,50]. These findings provide evidence that TrHSFB2a negatively regulates stress tolerance at least in Arabidopsis.
The HSFB class has been reported to act as a transcriptional repressor in plant species [23,26,41], including Arabidopsis [5,26]. In Arabidopsis, the single mutant HSFB2B and double mutant HSFB1 HSFB2 induced the strong expression of stress defense-related genes, and thereby, significantly enhanced the resistance of Arabidopsis against pathogens [27]. These double mutants also improve heat tolerance in Arabidopsis, which might be because HSFB1 and HSFB2b repress the expression of heat shock (HS) inducible genes required in the stress tolerance process [26]. Likewise, it is speculated that TrHSFB2a suppresses the expression of HS-inducible genes in white clover and as well as in overexpression Arabidopsis lines, while when it was mutated, or its expression decreased by RNA interference, it could not suppress the expression of HS-inducible genes, and full functionality of HS-inducible gens in stress condition in the absence of AtHSFB2 protein might have improved the stress tolerance in T-DNA lines. The differences observed in the tolerance level of different stress between overexpression lines and T-DNA lines might be attributed due to the differential expression of HS-inducible genes because TrHSFB2a may repress the expression of such genes due to the existence of the core B3 repression domain (BRD) domain (Figure 1c). This domain is conserved in plant species and speculated as a core domain that repress the activation of downstream HSPs genes in different plant species [41], as observed in the case of HSFB1 in Arabidopsis, but it needs to be tested.
In conclusion, the current study demonstrated that TrHSFB2a is expressed under various abiotic stresses, such as drought, heat and salt stress, and it negatively regulates drought, heat and salt stress, possibly by repressing the activation of HS-inducible genes under stressed conditions. Moreover, diminishing or reducing the expression of TrHSFB2a may have promising utility for enhancing the drought and heat tolerance of white clover.

4. Materials and Methods

4.1. Plant Growth Conditions

A total of 0.5 g of healthy and uniform-sized white clover (Trifolium repens L. cv. Landino) seeds were surface-sterilized with NaClO (0.5% (w/v), followed by being rinsed in autoclaved ddH2O 6 times and germinated in a plastic pot (24 cm length, 18 cm width and 9 cm deep) filled with sterilized moisturized quartz sand in a controlled growth chamber for seven days to maintain germination. Seven-day-old seedlings were irrigated with Hoagland’s nutrient solution for an additional three weeks (21 days) until the second leaves fully expanded, changing the Hoagland’s nutrient solution after every 2 days. The growth chamber was maintained at a 12 h photoperiod, with day/night temperatures of 23/19 °C, relative humidity of 75% and 250-μmol m−2⋅s−1 photosynthetic photon flux density. Four-week-old white clover plants were subjected to drought stress by 15% (w/v) polyethylene glycol (PEG) 6000, which was dissolved in Hoagland’s solution and samples were collected after 0 h, 1.5 h, 3 h, 6 h, 12 h and 24 h to isolate the total RNA for the subsequent cDNA library constructions. The total RNA was isolated from white clover plants (root + shoot) using an RNAprep Pure Plant Kit (TIANGEN Biotech (Beijing) Co., Ltd., Beijing, China) and was then reverse-transcribed to cDNA by an iScriptTM cDNA Synthesis Kit (Bio-Rad Laboratories, (Shanghai) Co., Ltd., Shanghai, China) according to the manufacturer’s manual instructions. Arabidopsis thaliana ecotype Col-0 was used for genetic transformation, and thus, grown as wild type. The Arabidopsis genotypes grown in the current stud consisted of wild-type (Col-0) and transgenic Arabidopsis, including overexpressing the TrHSFB2 and RNA interference T-DNA lines of AtHSFB2a for the comparative study. The seeds of Arabidopsis were surface sterilized with alcohol (75% w/v) and (0.1% w/v) NaClO, and subsequently, propagated on ½ MS medium containing 3% sucrose and 0.7% agar, followed by being placed in the dark at 4 °C for 2–3 days for vernalization. Then, for germination, the seeds were transferred to the growth chamber in the set condition of 21 °C temperature with 65% relative humidity, 16 h photoperiod and 150-μmol m−2⋅s−1 photoactive radiation. After 5 days, the equal-sized seedlings were transferred to square plates containing 1/2MS medium with sucrose (3%) and agar (0.7%) and arranged at 90 degrees in the same growth chamber for observing roots and shoot growth differences under normal and stressed conditions between transgenic and wild type Arabidopsis plants. Moreover, after 10 days, well-grown uniform-sized wild and transgenic Arabidopsis plants were transferred into plastic pots (10 cm length, 10 cm width and 7 cm deep) filled with nutrient soil consisting of peat moss, vermiculite and perlite (3:1:1) and placed in the growth chamber for completing rest growth periods or being subjected to different stress treatments after about 25 d of transplanting.

4.2. TrHSFB2 Gene Isolation from White Clover and Bioinformatics Analysis

Initially, the homologous sequences of TrHSFB2a were obtained through the BLAST program of NCBI “http://www.ncbi.nlm.nih.gov/Blast (accessed on 12 April 2020)” [51] by searching and identifying conserved sequences region of TrHSFB2a with closely related species and then aligning these sequences with partially published white clover genomes on the NCBI database https://www.ncbi.nlm.nih.gov/genome/13404 (accessed on 12 April 2020) [52] to obtain gene sequence information for the designing primers. The premier primer-5 software was used to design primers for TrHSFB2a amplification, and thereby, obtained a full-length CDS sequence of TrHSFB2a from the cDNA library by using the primer pair TrHSFB2-F CTCGCGAACCTTCTAGAACTCTCA and TrHSFB2-R TCCCTAATCCATCTAACATCAGGTGTCA through the touch-down PCR method and Phanta Max Master Mix (see the procedure detail in Supplementary Methods and Supplementary Table S1). The full-length amplified PCR fragments were excised and cloned into the pMD19 simple vector for sequencing; after confirming the TrHSFB2 sequence from three sequenced clones through a homology search on the NCBI database, an open reading frame of 924bp was cloned into the pBI21 overexpression vector (detail below). The molecular weight and pI values of primary TrHSFB2 protein sequences were determined using the ExPASy software http://web.expasy.org/protparam (accessed on 1 March 2022) [53]. Clustal Omega “https://www.ebi.ac.uk/Tools/msa/clustalo/ (accessed on 1 March 2022)” [54] and PSORT “https://www.genscript.com/psort.html (accessed on 10 December 2020)” [55] were used for multiple sequence alignment and subcellular protein localization, respectively. The motif and conserved domains were identified using “https://www.ncbi.nlm.nih.gov/Structure/cdd/wrpsb.cgi (accessed on 1 March 2022)” [56], and open reading frames (ORFs) were predicted using the NCBI program https://www.ncbi.nlm.nih.gov/orffinder (accessed on 10 May 2020) [57]. The construction of the phylogenetic tree was carried out through the MEGA 11 bioinformatic tool.

4.3. Plasmid Construction, Genetic Transformation and Developing Homozygous Overexpression Lines of TrHSFB2a

pSUPER1300-GFP and pBI121 vectors were used for subcellular localization and for constructing the overexpression of Arabidopsis, respectively. The complete coding region (without stop codon) of TrHSFB2a was amplified from a previously constructed pMD19 simple vector by the PCR reaction using Prime STAR® Max DNA-Polymerase (Takara-Biology Technology (Beijing) Co., Beijing, China) by following manual instructions, and inserted into the restriction sites of XbaI and BamHI of the linearized pBI121 (containing CaMV 35S promoter) and XbaI and KpnI site of the linearized pSuper1300-GFP using the EasyGeno Assembly Cloning kit (TIANGEN Biotech (Beijing) Co., Ltd., Beijing, China) to generate TrHSFB2::GFP in-frame fused protein according to manual’s instruction. The primers for amplifying the coding region and flanking vector sequences for both constructs are enlisted in Supplementary Table S1. The constructed pBI121 vector (CaMV 35S::TrHSFB2a) was then mobilized into the floral tissues of the Arabidopsis thaliana genotype “Col-0” by Agrobacterium-mediated transformation through the floral dip method [58]. The seeds of transformed plants were harvested, surface sterilized and sown on the selective media of ½ MS media with Kanamycine-50. Surviving plants were transferred into the soil at the four-leaf stage, confirmed by PCR for the presence of TrHSFB2a, and thereby developed ten independent transgenic overexpression lines. The expression level of TrHSFB2a in transgenic lines was identified by qRT-PCR and selected overexpression lines OE3 and OE4 and OE6 for further experiments based on relative expression levels. Two T-DNA lines (N675207 and N677095) of the Arabidopsis gene AtHSFB2A (Gene ID: At5g62020) were purchased from Arabidopsis mutants stock share platform AraShare “https://www.arashare.cn (accessed on 18 December 2020)” for the comparative functional analysis of TrHAFB2a in Arabidopsis.

4.4. Subcellular Localization

The fusion constructs TrHSFB2::GFP and control GFP vector were inserted into the Agrobacterium strain EHA105 competent cells using a standard protocol. Briefly, the transformed Agrobacterium culture was shaken for 2–3 h in YEB (Yeast Extract Beef) solution without an antibiotic at 28 °C, then centrifuged at 4000 rpm for one min (minute) and plated 100 µL on YEB medium containing rifamycin-20 and kanamycin-50, and incubated at 28 °C for 72 h followed by positive colonies selection using colony PCR. Cell culture was shaken at 28 °C until the OD-600 value reached 0.8, then the 30 mL cell culture was centrifuged at 4000 rpm for 10 min at 4 °C, dissolved in autoclaved water containing 5% sucrose and 0.02% silwet and, finally, introduced into tobacco leaves. Then the subcellular location of TrHSFB2a protein was determined by transiently expressing the TrHSFB2a::GFP fusion protein in the leaves of Nicotiana benthamiana. Tobacco plants were placed in a growth chamber in the dark, set at a day/night temperature of 23/19 °C, with 75% relative humidity for 24 h, followed by observing the GFP localization using a fluorescent microscope (Olympus).

4.5. Relative Expression of TrHSFB2a

To determine the relative expression level of TrHSFB2a in white clover under drought, heat and salt stress conditions, the four-week-old white clover plants were subjected to drought or salt stress by irrigating with Hoagland’s solution containing PEG6000 15% w/v or 200 mM L−1, respectively, in a controlled growth chamber. High-temperature stress was induced by placing the four-week-old white clover plants in a growth chamber adjusted with a continuous temperature of 35 °C. The processing times were 0 h, 1.5 h, 3 h, 6 h, 12 h and 24 h. The plant samples were collected, immediately frozen in liquid nitrogen, and stored at −80 °C for the subsequent process of total RNA extraction. Plant tissues (leaf, stem and roots) were ground in liquid nitrogen and 100 mg of tissue powder was used to extract the total RNA using HiPure Universal RNA Mini Kit (Magen, Beijing) by following the manual’s instructions. After confirming the quantity and quality on the NanDrop spectrophotometer and the RNA integrity on 1.5 agarose gel, cDNA was synthesized by reverse transcription of the first strand of RNA using MonScript™ RTIII All-in-One Mix with dsDNase (Monad Biotech Co., Ltd., Beijing, China) following kit protocols. Later, the relative gene expression was determined using 2X M5 HiPer SYBR Premix EsTaq (with Tli RNaseH) (Mei5 Biotechnology, Co., Ltd., Beijing, China) and the CFX96 Real-Time PCR detection system (Bio-RAD) according to manual instructions. The qRT-PCR primers are provided in Supplementary Table S1. The TrB-Actin gene was used as an internal control for white clover. The amplification conditions were as follows: initial denaturation at 95 °C for 5 min, then, 40 cycles at 95 °C for 10 sec and 60 °C for 30 s. The relative difference in the expression of the genes was calculated by the 2ΔΔCt method [59].
For determining TrHSFB2a expressions in transgenic Arabidopsis, the seeds of 10 overexpression lines were sown on ½ MS media supplemented with 3% sucrose and 0.7% agar, followed by vernalization for 2 days. After germination, seedlings were grown for an additional 10 days in the same ½ MS media plates placed in a growth chamber set at 21 °C with 65% relative humidity, 16 h photoperiod, and 150 μmol m−2⋅s−1 photoactive radiation. Then, the extraction of the total RNA, reverse transcription and qRT-PCR analysis was the same as stated above for white clover.

4.6. Drought, Salt and Heat Stress in Arabidopsis

The drought, salt and heat stress treatments were according to Jia et al. (2021) [60]. Briefly, the seeds of homozygous T3 lines of transgenic Arabidopsis (overexpression and T-DNA lines) were used for studying stress responses. For drought and salt stress treatments in ½ MS medium, 5 d old wild and transgenic lines were transferred into ½ MS medium (15 plants of each genotype with three technical repeats) supplemented with 200 mML−1 and 300 mML−1 of mannitol or 100 mML−1 and 150 mML−1 of sodium chloride (NaCl). The phenotypes of plants under stress were observed daily for up to 26 days. Photographs of the plants were taken using a digital camera. The yellowing rate (senescence) was calculated by counting the respective plant at the end of the experiment from each treatment. One-month-old wild and transgenic lines were also subjected to drought, heat and salt treatment in nutrient soil (peat moss, vermiculite, perlite, 3:1:1) in controlled growth chamber conditions, as stated above. Drought stress treatment was induced by withholding the irrigation for 22 days. Salt treatment was applied by irrigation with 100 mML−1, 200 mML−1 and 300 mML−1 of NaCl every two times after every two consecutive days. For inducing heat stress, the one-month-old soil-grown WT and transgenic plants were transferred to another growth chamber adjusted with a continuous temperature of 35 °C for two weeks.

4.7. Determination of Relative Water Contents (RWC)

RWC was determined by following Barrs and Weatherley [61]. A total of 0.3 g of leaf blade samples were collected between 9:00–10:00 am, wrapped well in ordinary absorbent paper and placed into centrifuge tubes of 50 mL, followed by filling the tubes with water, covered with a lid and placing in a protected place for 24 h. When the leaves had absorbed water at full saturation level, we took out the leaf samples, wiped off the surface water, weighed the saturated fresh weight, and placed the samples in a blast oven set at 105 °C temperature for 45 min. Finally, we dried the samples at 75 °C to reach a constant weight and measured dry weights. Three biological repeats were used for all treatments. RWC of the leaves were calculated by employing the following formula:
RWC % = [(FW − DW)/(TW − DW)] × 100
FW, TW and DW represent fresh weight, saturated fresh weight after drenching the leaves in water for 12 h and dry weight, respectively.

4.8. Determination of Relative Electrical Conductivity (EC)

Relative electrical conductivity was determined by following Blum and Ebercon [62]. Briefly, 0.1 g of leaf blade samples of the different materials in the study were placed into test tubes filled with 15 mL of deionized water. The initial conductivity (Cinitial) was determined by the conductivity meter (YSI Model 32) after 24 h, then we boiled the samples at 100 centigrade for 15 min, followed by cooling down at room temperature and measuring their final conductivity (Cmax). Three biological repeats were used for all treatments. The following formula was used to calculate EL:
Relative electrical conductivity EL = Cinitial/Cmax × 100
where Cinitial is initial conductivity and Cmax is final conductivity.

4.9. Determination of Chlorophyll Fluorescence Parameters

Chlorophyll fluorescence parameters were measured according to Jia et al. (2021) [60]. Briefly, for determining chlorophyll fluorescence parameters, we placed the soil-grown WT and transgenic lines in the dark for 30 min, and measured the maximum quantum yield of PSII photochemistry (Fv/Fm) and PIABS by a pulse-amplitude modulation portable chlorophyll fluorometer (PAM-2500), using 15 replicates for each treatment.

4.10. Determination of Malondialdehyde (MDA) Content

The MDA contents of the leaves of different materials in the study were determined by following Heath and Packer (1968) method. Briefly, 0.1 g leaf tissues were immediately frozen in liquid nitrogen, followed by thoroughly grounded in ice within 2 mL of 50 mM pre-cooled phosphate-buffered saline (PBS) solution (pH 7.8) and centrifuged at 12,000× g for up to 30 min at 4 °C. The supernatant was taken and used to extract and determine MDA content by adding 1 mL of reaction solution comprising of trichloroacetic acid (20% w/v) and thiobarbituric acid (0.5% w/v) of a 0.5 mL solution of crude enzyme. Then samples were heated at 95 degrees Celsius for up to 30 min in a water bath, followed by quickly cooling to room temperature in an ice bath, with continuous gentle shaking to avoid bubble formations, and then centrifuged at 10,000× g for 10 min, removing the air bubbles, if any, with the pipette. Finally, we took out the supernatant and measured absorbance values at the wavelength of 532 nm and 600 nm. Three biological repeats were used for all treatments. To calculate MDA contents values, we subtracted the absorbance value of 600 nm wavelength from the absorbance value obtained at 532 nm wavelength by using an extinction coefficient of 155 mM−1 em−1 [63].
MDA (nmole g−1 DW) = (A532 − A600) × V × 1000/155 × W
where A532 is the absorbance at 532 nm, A600 is the absorbance at 600 nm, V is the extraction volume and W is the dry weight of the leaf.

4.11. Statistical Analysis

Statistical analyses were performed using IBM SPSS and GraphPad Prism 8.3.0 software, and graphs were made using GraphPad Prism 8.3.0 software.

Supplementary Materials

The supporting information can be downloaded at: https://www.mdpi.com/article/10.3390/ijms232112769/s1.

Author Contributions

Investigation, M.Z.I., Y.P. and Q.T., designed and approved the project; M.Z.I. performed experiment and data analysis; T.J., T.T., M.J.H. and Y.Z., assisted in the experiment; M.A. and A.A. guided in gene cloning and transformation processes. M.Z.I. wrote the original manuscript; M.J.H. performed data curation; T.J., T.T., M.A., A.A. and Y.Z. helped in revising the manuscript. Y.P. provided funds and supervised the project. All authors have read and agreed to the published version of the manuscript.

Funding

This work was supported by Sichuan Forage Innovation Team Program (NO. SCCXTD-2020-16) and Sichuan International Cooperation Project (NO. 2022YFH0059).

Institutional Review Board Statement

Not applicable.

Informed Consent Statement

Not applicable.

Data Availability Statement

The data presented in this study are available on request from the corresponding author.

Conflicts of Interest

The authors declare that they have no competing interest.

References

  1. Vaseva, I.; Akiscan, Y.; Demirevska, K.; Anders, I.; Feller, U. Drought stress tolerance of red and white clover–comparative analysis of some chaperonins and dehydrins. Sci. Hortic. 2011, 130, 653–659. [Google Scholar]
  2. Chaves, M.M.; Oliveira, M.M. Mechanisms underlying plant resilience to water deficits: Prospects for water-saving agriculture. J. Exp. Bot. 2004, 55, 2365–2384. [Google Scholar] [PubMed] [Green Version]
  3. Annicchiarico, P.; Piano, E. Indirect Selection for root development of white clover and implications for drought tolerance. J Agron. Crop Sci. 2004, 190, 28–34. [Google Scholar] [CrossRef]
  4. Wang, W.; Vinocur, B.; Shoseyov, O.; Altman, A. Role of plant heat-shock proteins and molecular chaperones in the abiotic stress response. Trends Plant Sci. 2004, 9, 244–252. [Google Scholar] [CrossRef] [PubMed]
  5. Andrási, N.; Pettkó-Szandtner, A.; Szabados, L. Diversity of plant heat shock factors: Regulation, interactions, and functions. J. Exp. Bot. 2021, 72, 1558–1575. [Google Scholar] [CrossRef]
  6. Scharf, K.-D.; Berberich, T.; Ebersberger, I.; Nover, L. The plant heat stress transcription factor (Hsf) family: Structure, function and evolution. BBA-Gene Regul. Mech. 2012, 1819, 104–119. [Google Scholar]
  7. Scharf, K.-D.; Rose, S.; Zott, W.; Schöffl, F.; Nover, L.; Schöff, F. Three tomato genes code for heat stress transcription factors with a region of remarkable homology to the DNA-binding domain of the yeast HSF. EMBO J. 1990, 9, 4495–4501. [Google Scholar] [CrossRef]
  8. Guo, M.; Liu, J.-H.; Ma, X.; Luo, D.-X.; Gong, Z.-H.; Lu, M.-H. The plant heat stress transcription factors (HSFs): Structure, regulation, and function in response to abiotic stresses. Front. Plant Sci. 2016, 7, 114. [Google Scholar] [CrossRef] [Green Version]
  9. Chung, E.; Kim, K.-M.; Lee, J.-H. Genome-wide analysis and molecular characterization of heat shock transcription factor family in Glycine max. J. Genet. Genom. 2013, 40, 127–135. [Google Scholar] [CrossRef]
  10. Lin, Y.-X.; Jiang, H.-Y.; Chu, Z.-X.; Tang, X.-L.; Zhu, S.-W.; Cheng, B.-J. Genome-wide identification, classification and analysis of heat shock transcription factor family in maize. BMC Genom. 2011, 12, 76. [Google Scholar] [CrossRef] [Green Version]
  11. Tang, R.; Zhu, W.; Song, X.; Lin, X.; Cai, J.; Wang, M.; Yang, Q. Genome-wide identification and function analyses of heat shock transcription factors in potato. Front. Plant Sci. 2016, 7, 490. [Google Scholar] [CrossRef] [PubMed] [Green Version]
  12. Song, X.; Liu, G.; Duan, W.; Liu, T.; Huang, Z.; Ren, J.; Li, Y.; Hou, X. Genome-wide identification, classification and expression analysis of the heat shock transcription factor family in Chinese cabbage. Mol. Genet. Genom. 2014, 289, 541–551. [Google Scholar] [CrossRef] [PubMed]
  13. Duan, S.; Liu, B.; Zhang, Y.; Li, G.; Guo, X. Genome-wide identification and abiotic stress-responsive pattern of heat shock transcription factor family in Triticum aestivum L. BMC Genom. 2019, 20, 257. [Google Scholar] [CrossRef] [PubMed] [Green Version]
  14. Zhang, H.; Li, G.; Fu, C.; Duan, S.; Hu, D.; Guo, X. Genome-wide identification, transcriptome analysis and alternative splicing events of Hsf family genes in maize. Sci. Rep. 2020, 10, 8073. [Google Scholar] [CrossRef]
  15. Xue, G.-P.; Sadat, S.; Drenth, J.; McIntyre, C.L. The heat shock factor family from Triticum aestivum in response to heat and other major abiotic stresses and their role in regulation of heat shock protein genes. J. Exp. Bot. 2014, 65, 539–557. [Google Scholar] [CrossRef] [Green Version]
  16. Liu, H.C.; Liao, H.T.; Charng, Y.Y. The role of class A1 heat shock factors (HSFA1s) in response to heat and other stresses in Arabidopsis. Plant Cell Environ. 2011, 34, 738–751. [Google Scholar] [CrossRef]
  17. Wang, Y.; Dai, Y.; Tao, X.; Wang, J.-Z.; Cheng, H.-Y.; Yang, H.; Ma, X.-R. Heat shock factor genes of tall fescue and perennial ryegrass in response to temperature stress by RNA-Seq analysis. Front. Plant Sci. 2016, 6, 1226. [Google Scholar] [CrossRef] [Green Version]
  18. Friedrich, T.; Oberkofler, V.; Trindade, I.; Altmann, S.; Brzezinka, K.; Lämke, J.; Gorka, M.; Kappel, C.; Sokolowska, E.; Skirycz, A. Heteromeric HSFA2/HSFA3 complexes drive transcriptional memory after heat stress in Arabidopsis. Nat. Commun. 2021, 12, 3426. [Google Scholar] [CrossRef]
  19. Yue, Z.; Wang, Y.; Zhang, N.; Zhang, B.; Niu, Y. Expression of the Amorphophallus albus heat stress transcription factor AaHsfA1 enhances tolerance to environmental stresses in Arabidopsis. Ind. Crop Prod. 2021, 174, 114231. [Google Scholar] [CrossRef]
  20. Fabri, J.H.T.M.; Rocha, M.C.; Fernandes, C.M.; Persinoti, G.F.; Ries, L.N.A.; Cunha, A.F.d.; Goldman, G.H.; Del Poeta, M.; Malavazi, I. The heat shock transcription factor HsfA is essential for thermotolerance and regulates cell wall integrity in Aspergillus fumigatus. Front. Microbiol. 2021, 12, 735. [Google Scholar] [CrossRef]
  21. Nover, L.; Bharti, K.; Döring, P.; Mishra, S.K.; Ganguli, A.; Scharf, K.-D. Arabidopsis and the heat stress transcription factor world: How many heat stress transcription factors do we need? Cell Stress Chaperon. 2001, 6, 177. [Google Scholar] [CrossRef]
  22. von Koskull-Döring, P.; Scharf, K.-D.; Nover, L. The diversity of plant heat stress transcription factors. Trends Plant Sci. 2007, 12, 452–457. [Google Scholar] [CrossRef] [PubMed]
  23. Fragkostefanakis, S.; Simm, S.; El-Shershaby, A.; Hu, Y.; Bublak, D.; Mesihovic, A.; Darm, K.; Mishra, S.K.; Tschiersch, B.; Theres, K. The repressor and co-activator HsfB1 regulates the major heat stress transcription factors in tomato. Plant Cell Environ. 2019, 42, 874–890. [Google Scholar] [CrossRef] [PubMed]
  24. Bharti, K.; von Koskull-Döring, P.; Bharti, S.; Kumar, P.; Tintschl-Körbitzer, A.; Treuter, E.; Nover, L. Tomato heat stress transcription factor HsfB1 represents a novel type of general transcription coactivator with a histone-like motif interacting with the plant CREB binding protein ortholog HAC1. Plant Cell 2004, 16, 1521–1535. [Google Scholar] [CrossRef] [Green Version]
  25. Jeong, G.; Jeon, M.; Shin, J.; Lee, I. Heat shock transcription factor B2b acts as a transcriptional repressor of VIN3, a gene induced by long-term cold for flowering. Sci. Rep. 2022, 12, 10963. [Google Scholar] [CrossRef]
  26. Ikeda, M.; Mitsuda, N.; Ohme-Takagi, M. Arabidopsis HsfB1 and HsfB2b act as repressors of the expression of heat-inducible Hsfs but positively regulate the acquired thermotolerance. Plant Physiol. 2011, 157, 1243–1254. [Google Scholar] [CrossRef] [Green Version]
  27. Kumar, M.; Busch, W.; Birke, H.; Kemmerling, B.; Nürnberger, T.; Schöffl, F. Heat shock factors HsfB1 and HsfB2b are involved in the regulation of Pdf1. 2 expression and pathogen resistance in Arabidopsis. Mol. Plant 2009, 2, 152–165. [Google Scholar] [CrossRef] [Green Version]
  28. Li, Z.; Zhang, Y.; Zhang, X.; Merewitz, E.; Peng, Y.; Ma, X.; Huang, L.; Yan, Y. Metabolic pathways regulated by chitosan contributing to drought resistance in white clover. J. Proteom. Res. 2017, 16, 3039–3052. [Google Scholar] [CrossRef]
  29. Li, Z.; Hou, J.; Zhang, Y.; Zeng, W.; Cheng, B.; Hassan, M.J.; Zhang, Y.; Pu, Q.; Peng, Y. Spermine regulates water balance associated with Ca2+-dependent aquaporin (TrTIP2-1, TrTIP2-2 and TrPIP2-7) expression in plants under water stress. Plant Cell Physiol. 2020, 61, 1576–1589. [Google Scholar] [CrossRef]
  30. Liu, H.-L.; Lee, Z.-X.; Chuang, T.-W.; Wu, H.-C. Effect of heat stress on oxidative damage and antioxidant defense system in white clover (Trifolium repens L.). Planta 2021, 254, 103. [Google Scholar] [CrossRef]
  31. Gasteiger, E.; Hoogland, C.; Gattiker, A.; Wilkins, M.R.; Appel, R.D.; Bairoch, A. Protein identification and analysis tools on the ExPASy server. In The Proteomics Protocols Handbook; Walker, J.M., Ed.; Humana Press: Totowa, NJ, USA, 2005; pp. 571–607. [Google Scholar]
  32. Hallgren, J.; Tsirigos, K.D.; Pedersen, M.D.; Armenteros, J.J.A.; Marcatili, P.; Nielsen, H.; Krogh, A.; Winther, O. DeepTMHMM predicts alpha and beta transmembrane proteins using deep neural networks. bioRxiv 2022. [Google Scholar] [CrossRef]
  33. Geourjon, C.; Deleage, G. SOPMA: Significant improvements in protein secondary structure prediction by consensus prediction from multiple alignments. Bioinformatics 1995, 11, 681–684. [Google Scholar] [CrossRef] [PubMed]
  34. Blom, N.; Gammeltoft, S.; Brunak, S. Sequence and structure-based prediction of eukaryotic protein phosphorylation sites. J. Mol. Biol. 1999, 294(5), 1351–1362. [Google Scholar] [CrossRef] [PubMed]
  35. Petersen, T.N.; Brunak, S.; Von Heijne, G.; Nielsen, H. SignalP 4.0: Discriminating signal peptides from transmembrane regions. Nature Methods. 2011, 8, 785–786. [Google Scholar] [CrossRef] [PubMed]
  36. Waterhouse, A.; Bertoni, M.; Bienert, S.; Studer, G.; Tauriello, G.; Gumienny, R.; Heer, F.T.; de Beer, T.A.P.; Rempfer, C.; Bordoli, L. SWISS-MODEL: Homology modelling of protein structures and complexes. Nucleic Acids Res. 2018, 46, W296–W303. [Google Scholar] [CrossRef] [PubMed] [Green Version]
  37. Zhuang, L.; Cao, W.; Wang, J.; Yu, J.; Yang, Z.; Huang, B. Characterization and functional analysis of FaHsfC1b from Festuca arundinacea conferring heat tolerance in Arabidopsis. Int. J. Mol. Sci. 2018, 19, 2702. [Google Scholar] [CrossRef] [Green Version]
  38. Dossa, K.; Diouf, D.; Cissé, N. Genome-wide investigation of Hsf genes in sesame reveals their segmental duplication expansion and their active role in drought stress response. Front. Plant Sci. 2016, 7, 1522. [Google Scholar] [CrossRef] [Green Version]
  39. Schmidt, R.; Schippers, J.H.; Welker, A.; Mieulet, D.; Guiderdoni, E.; Mueller-Roeber, B. Transcription factor OsHsfC1b regulates salt tolerance and development in Oryza sativa ssp. japonica. AoB Plants 2012, 2012, pls011. [Google Scholar] [CrossRef]
  40. Ma, H.; Wang, C.; Yang, B.; Cheng, H.; Wang, Z.; Mijiti, A.; Ren, C.; Qu, G.; Zhang, H.; Ma, L. CarHSFB2, a class B heat shock transcription factor, is involved in different developmental processes and various stress responses in chickpea (Cicer arietinum L.). Plant Mol. Biol. Rep. 2016, 34, 1–14. [Google Scholar] [CrossRef]
  41. Xiang, J.; Ran, J.; Zou, J.; Zhou, X.; Liu, A.; Zhang, X.; Peng, Y.; Tang, N.; Luo, G.; Chen, X. Heat shock factor OsHsfB2b negatively regulates drought and salt tolerance in rice. Plant Cell Rep. 2013, 32, 1795–1806. [Google Scholar] [CrossRef]
  42. Czarnecka-Verner, E.; Pan, S.; Salem, T.; Gurley, W.B. Plant class B HSFs inhibit transcription and exhibit affinity for TFIIB and TBP. Plant Mol. Biol. 2004, 56, 57–75. [Google Scholar] [CrossRef] [PubMed]
  43. Guo, J.; Wu, J.; Ji, Q.; Wang, C.; Luo, L.; Yuan, Y.; Wang, Y.; Wang, J. Genome-wide analysis of heat shock transcription factor families in rice and Arabidopsis. J. Genet. Genom. 2008, 35, 105–118. [Google Scholar] [CrossRef]
  44. Chidambaranathan, P.; Jagannadham, P.T.K.; Satheesh, V.; Kohli, D.; Basavarajappa, S.H.; Chellapilla, B.; Kumar, J.; Jain, P.K.; Srinivasan, R. Genome-wide analysis identifies chickpea (Cicer arietinum) heat stress transcription factors (Hsfs) responsive to heat stress at the pod development stage. J. Plant Res. 2018, 131, 525–542. [Google Scholar] [CrossRef] [PubMed]
  45. Arvin, M.; Donnelly, D. Screening potato cultivars and wild species to abiotic stresses using an electrolyte leakage bioassay. J. Agric. Sci. Technol.-Iran 2008, 10, 33–42. [Google Scholar]
  46. Mantri, N.; Patade, V.; Pang, E. Recent advances in rapid and sensitive screening for abiotic stress tolerance. In Improvement of Crops in the Era of Climatic Changes; Ahmed, P., Wani, M.R., Azooz, M.M., Tran, L.S.P., Eds.; Springer: New York, NY, USA, 2014; Volume 2, pp. 37–47. [Google Scholar]
  47. Tommasino, E.; Griffa, S.; Grunberg, K.; Ribotta, A.; Lopez Colomba, E.; Carloni, E.; Quiroga, M.; Luna, C.M. Malondialdehyde content as a potential biochemical indicator of tolerant Cenchrus ciliaris L. genotypes under heat stress treatment. Grass Forage Sci. 2012, 67, 456–459. [Google Scholar] [CrossRef]
  48. Luna, C.; Garcia-Seffino, L.; Arias, C.; Taleisnik, E. Oxidative stress indicators as selection tools for salt tolerance. Plant Breed. 2000, 119, 341–345. [Google Scholar] [CrossRef]
  49. Lü, X.-P.; Shao, K.-Z.; Xu, J.-Y.; Li, J.-L.; Ren, W.; Chen, J.; Zhao, L.-Y.; Zhao, Q.; Zhang, J.-L. A heat shock transcription factor gene (HaHSFA1) from a desert shrub, Haloxylon ammodendron, elevates salt tolerance in Arabidopsis thaliana. Environ. Exp. Bot. 2022, 201, 104954. [Google Scholar] [CrossRef]
  50. Xia, H.; Zhou, Y.; Deng, H.; Lin, L.; Deng, Q.; Wang, J.; Lv, X.; Zhang, X.A.; Liang, D. Melatonin improves heat tolerance in Actinidia deliciosa via carotenoid biosynthesis and heat shock proteins expression. Physiol. Plant. 2021, 172, 1582–1593. [Google Scholar] [CrossRef]
  51. National Center for Biotechnology Information, Basic Local Alignment Search Tool. Available online: http://www.ncbi.nlm.nih.gov/Blast (accessed on 12 April 2020).
  52. National Library of Medicine, National Center for Biotechnology Information. Trifolium Repens (assembly AgR_To_v5). Available online: https://www.ncbi.nlm.nih.gov/genome/13404 (accessed on 12 April 2020).
  53. Protein Identification and Analysis Tools on the ExPASy Server. Expasy, ProtParam Tool. Available online: https://web.expasy.org/protparam/ (accessed on 1 March 2022).
  54. Clustal Omega. Multiple Sequence Alignment. Available online: https://www.ebi.ac.uk/Tools/msa/clustalo/ (accessed on 1 March 2022).
  55. PSORT: Protein Subcellular Localization Prediction Tool. Available online: https://www.genscript.com/psort.html (accessed on 10 December 2020).
  56. Search for Conserved Domains within a Protein or Coding Nucleotide Sequence, NCBI. Available online: https://www.ncbi.nlm.nih.gov/Structure/cdd/wrpsb.cgi (accessed on 1 March 2022).
  57. Open Reading Frame Finder, NIH, NCBI. Available online: https://www.ncbi.nlm.nih.gov/orffinder (accessed on 10 May 2020).
  58. Clough, S.J.; Bent, A.F. Floral dip: A simplified method for Agrobacterium-mediated transformation of Arabidopsis thaliana. Plant J. 1998, 16, 735–743. [Google Scholar] [CrossRef] [Green Version]
  59. Livak, K.J.; Schmittgen, T.D. Analysis of relative gene expression data using real-time quantitative PCR and the 2−ΔΔCT method. Methods 2001, 25, 402–408. [Google Scholar] [CrossRef]
  60. Jia, T.; Hou, J.; Iqbal, M.Z.; Zhang, Y.; Cheng, B.; Feng, H.; Li, Z.; Liu, L.; Zhou, J.; Feng, G. Overexpression of the white clover TrSAMDC1 gene enhanced salt and drought resistance in Arabidopsis thaliana. Plant Physiol. Biochem. 2021, 165, 147–160. [Google Scholar] [CrossRef] [PubMed]
  61. Barrs, H.; Weatherley, P. A re-examination of the relative turgidity technique for estimating water deficits in leaves. Aust. J. Biol. Sci. 1962, 15, 413–428. [Google Scholar] [CrossRef] [Green Version]
  62. Blum, A.; Ebercon, A. Cell membrane stability as a measure of drought and heat tolerance in wheat 1. Crop Sci. 1981, 21, 43–47. [Google Scholar] [CrossRef]
  63. Heath, R.L.; Packer, L. Photoperoxidation in isolated chloroplasts: I. Kinetics and stoichiometry of fatty acid peroxidation. Arch. Biochem. Biophys. 1968, 125, 189–198. [Google Scholar] [CrossRef]
Figure 1. The characteristics of TrHSFB2a gene and protein sequence, and the phylogenetic analysis. (a) shows amplified DNA fragment of TrHSFB2a gene from white clover cDNA separated on 1.5% agarose gel, (b) sequence similarity of the predicted protein of TrHSFB2a gene with other species, (c) comparison of amino acids sequences of TrHAFB2a with related HSF proteins—highly homolog amino acids residue are shaded and conserved domains are boxed. (d) Phylogenetic relationship of the protein of TrHSFB2a gene with other plant species and other members of HSF family of the Arabidopsis thaliana. Triangles size in branches represents bootstrap values. Phylogenetic tree analysis was based on minimum evolution using Mega (version 11).
Ijms 23 12769 g001
Figure 2. Subcellular localization of TrHSFB2a::GFP protein. The TrHSFB2a::GFP vector and an empty vector were transferred into tobacco leaves for transient expression and observed under the fluorescent microscope. Green color shows TrHSFB2a protein signals. Scale bar is 10 um.
Ijms 23 12769 g002
Figure 3. Relative gene expression pattern of TrHSFB2a after drought, heat and salt treatments. (ac) Display expression level of TrHSFB2a under polyethylene glycol 6000 15% w/v, heat (35 °C) and salt (NaCl 200 mM) stresses, respectively, with time course 0, 3, 6, 12, and 24 h after treatments. Error bars represent the standard deviation (SD) of three independent biological replicates.
Ijms 23 12769 g003
Figure 4. Homologous relationship of TrHSFB2a based on conserved domains and construction of overexpression lines of TrHSFB2a. (a) Homologous relationship of TrHSFB2a with most related proteins, with most conserved regions shaded by red color (b) Phylogenetic relationship of TrHSFB2a based on conserved domains, (c) selection of overexpression lines of TrHSFB2a on 1/2MS medium containing 50 mg/L Kanamycin for developing homozygous lines. Only transformed plant could grow on selection media, while non-transformed turned into yellow and died (d,e) Show plant stature and root growth of wild type (Wt), RNA interference T-DNA lines (T-77 and T-95) and overexpression lines (OE3 and OE4) grown on 1/2MS medium containing 3% sucrose and 0.7% agar. (f) Display the morphology of TrHSFB2a overexpression lines, T-DNA lines and Wt type plants in soil, (g) relative gene expression in overexpression lines, (h,i,j) display root length (cm), fresh weight (g) and dry weight (g), respectively, of wild and transgenic plants under normal growth condition. Bars represent mean ± SD values, and different small letters (a, b and c) represent significant statistical difference among means (one-way ANOVA, followed by Tukey test) between different lines.
Ijms 23 12769 g004
Figure 5. Comparison of drought-stress responses of overexpressing TrHSFB2a lines and RNA interference T-DNA lines and wild type grown on 1/2MS medium (with 3% sucrose + 0.7% agar) supplemented with 200 or 300 mM mannitol. (a,b) Display overexpression TrHSFB2a Arabidopsis thaliana along with wild type grown on 1/2MS medium supplemented with 200 and 300 mM mannitol, respectively, (c,d) show plant with roots growth on 1/2MS medium supplemented with 200 and 300 mM mannitol, respectively. (e) Root length on 1/2MS medium supplemented with 200 and 300 mM mannitol, respectively. (f) Plant-yellowing rate on 1/2MS medium supplemented with 200 mM mannitol. Bars represent mean ± SD values, and different small letters (a, b, and c) represent significant statistical difference among means (one-way ANOVA, followed by Tukey test) between different lines.
Ijms 23 12769 g005
Figure 6. Comparison of drought stress tolerance of overexpressing TrHSFB2a lines and RNA interference T-DNA lines with wild type grown in nutrient soil by withholding water of 25 days old plants for up to two weeks. (a) Show phenotypes of wild, T-DNA lines and overexpression lines at 12 d of water withholding; (bh) display a graphical representation of different phenotypic and physiological indicators of stress tolerance. (b) fresh weight; (c) dry weight; (d) photosynthetic efficiency (Fv/Fm); (e) performance index on absorption basis; (f) relative water contents (%); (g) Relative electrical conductivity (%); (h) MDA contents. Different alphabetic characters on bars represent statistically significant differences among variables.
Ijms 23 12769 g006
Figure 7. Comparison of heat stress tolerance of overexpressing TrHSFB2a lines and RNA interference T-DNA lines with wild type grown in nutrient soil (peat moss, vermiculite and perlite, 3:1:1) for 25 days and transferred to an incubator adjusted with 35 °C temperature. (a) Display Arabidopsis phenotypes after high-temperature treatment and recovery of plants after transferring to normal growth conditions. (bf) display graphical representations of plants drying rate (%), dry weight (g), photochemical efficiency (Fv/Fm), relative electrical conductivity (%) and MDA contents (nmole/g FW), respectively. Bars represent mean ± SD values, and different small letters (a, b and c) represent significant statistical difference among means (one-way ANOVA, followed by Tukey test) between different lines.
Ijms 23 12769 g007
Figure 8. Comparison of salt stress tolerance of overexpressing TrHSFB2a lines and RNA interference T-DNA lines with wild type on 1/2MS medium supplemented with 100 or 150 mM NaCl. (a,b) show wild (WT), T-DNA lines (T-77 and T-95) and overexpression lines (OE3 and OE4) TrHSFB2a lines grown on 1/2MS medium supplemented with 100 mM and 150 mM NaCl, respectively, (ce) show roots growth on 1/2MS medium supplemented with 100 mM and 150 mM NaCl, respectively; (f) plants survival/yellowing-related phenotypes on 1/2MS medium supplemented with 150 mM NaCl. (gi) Show root length (cm), fresh weight (g) and survival rate (%) measured after 10 days of transplanting. Bars represent mean ± SD values determined from 30 seedlings, different small letters (a, b and c) represent significant statistical difference among means (one-way ANOVA, followed by Tukey test) between different lines within a treatment. Survival rate (%) was determined by counting survived and dead plants at 15 d of transplanting.
Ijms 23 12769 g008
Figure 9. Comparison of salt stress tolerance of overexpressing TrHSFB2a lines (OE3 and OE4) and RNA interference T-DNA (T-77 and T-95) lines with wild type grown in nutrient soil for 28 days in normal conditions, irrigated with saline water gradients of 100 mM, 200 mM and 300 mM NaCl, each gradient for two times for two days. (a,b) Show phenotypic differences of wild + overexpression and wild + TDNA lines, respectively; (cf) indicate relative water contents (%), electrolyte leakage (%), maximum quantum yield of PSII photochemistry (Fv/Fm) and performance index on absorption basis (PIABS), respectively, under salt stress condition. Bars represent mean ± SD values, and different small letters (a, b and c) represent significant statistical difference among means (one-way ANOVA, followed by Tuky test) between different lines.
Ijms 23 12769 g009
Publisher’s Note: MDPI stays neutral with regard to jurisdictional claims in published maps and institutional affiliations.

