Abstract
We performed molecular dynamics simulation to elucidate the adsorption behavior of hydrogen (H2), carbon dioxide (CO2), and methane (CH4) on four sub-models of type II kerogens (organic matter) of varying thermal maturities over a wide range of pressures (2.75 to 20 MPa) and temperatures (323 to 423 K). The adsorption capacity was directly correlated with pressure but indirectly correlated with temperature, regardless of the kerogen or gas type. The maximum adsorption capacity was 10.6 mmol/g for the CO2, 7.5 mmol/g for CH4, and 3.7 mmol/g for the H2 in overmature kerogen at 20 MPa and 323 K. In all kerogens, adsorption followed the trend CO2 > CH4 > H2 attributed to the larger molecular size of CO2, which increased its affinity toward the kerogen. In addition, the adsorption capacity was directly associated with maturity and carbon content. This behavior can be attributed to a specific functional group, i.e., H, O, N, or S, and an increase in the effective pore volume, as both are correlated with organic matter maturity, which is directly proportional to the adsorption capacity. With the increase in carbon content from 40% to 80%, the adsorption capacity increased from 2.4 to 3.0 mmol/g for H2, 7.7 to 9.5 mmol/g for CO2, and 4.7 to 6.3 mmol/g for CH4 at 15 MPa and 323 K. With the increase in micropores, the porosity increased, and thus II-D offered the maximum adsorption capacity and the minimum II-A kerogen. For example, at a fixed pressure (20 MPa) and temperature (373 K), the CO2 adsorption capacity for type II-A kerogen was 7.3 mmol/g, while type II-D adsorbed 8.9 mmol/g at the same conditions. Kerogen porosity and the respective adsorption capacities of all gases followed the order II-D > II-C > II-B > II-A, suggesting a direct correlation between the adsorption capacity and kerogen porosity. These findings thus serve as a preliminary dataset on the gas adsorption affinity of the organic-rich shale reservoirs and have potential implications for CO2 and H2 storage in organic-rich formations.
1. Introduction
Global warming is evident and has led to significant adverse impacts on various Earth systems around the globe [1] due to the burning of fossil fuels and the continuous release of greenhouse gases (GHG) [2,3]. In this context, the Paris Agreement was signed by 195 parties to limit global warming to 2 °C in an attempt to maintain it below 1.5 °C by 2050 [4]. Two main strategies for reducing atmospheric concentrations of CO2 are negative emissions technology and/or switching to low- or zero-carbon fuel sources [5,6]. First, carbon capture and storage (CSS) technology is considered effective negative emission technology that is a necessity, not an option, and can cut 19% of global CO2 emissions by 2050 [7]. CCS involves capturing CO2 from stationary sources, e.g., fossil fuel power plants, fuel processing plants, and other industrial plants, particularly iron, steel, cement, and bulk chemical plants. Then, the captured CO2 is transported through pipelines or ships for storage in underground geological formations, such as saline aquifers, depleted reservoirs, and coal seams [8,9,10,11]. Renewable energy sources are low- or zero-carbon fuel sources, which have been recognized as an effective solution to mitigate the associated global warming concern [12,13]. This is evident from large-scale renewable energy projects to generate electricity and large-scale CO2 sequestration projects across the globe (e.g., Europe [14] and the Gulf region [15]). According to the World Energy Outlook, renewable-based energy sources could supply 30% of the total global energy by 2040 [13]. In this context, while CO2 geo-sequestration remains a major interest [3,16,17,18,19,20], the use of H2 as clean energy and its storage, which originated a few decades ago [21,22], has recently gained notable attention too [23,24,25]. The key benefit of hydrogen is its low carbon footprint, which could revolutionize the global energy outlook as a fuel [26]; however, specific challenges are associated with the low density and high diffusivity of H2 [27]. Although several initiatives have been taken to mitigate serious climate change consequences, more efforts are still needed to address global warming.
Subsurface geologic formations, i.e., depleted hydrocarbon reservoirs and saline aquifers, have been explored for large-scale CO2 [28,29,30,31,32,33] as well as hydrogen (H2) storage [34]. Recently, coal seams [26] and basaltic rocks [35] have also been investigated for their H2 storage potential, albeit at a lab scale. Furthermore, shale rocks have been evaluated for large-scale CO2 storage via adsorption trapping [36,37,38], while a recent study investigated H2 storage in inactive shale [39]. While the idea of underground hydrogen storage (UHS) focuses on energy storage, CO2 flooding in a medium comprised of shale and coal offers double advantages, i.e., it addresses carbon capture and storage (CCS) and enhances methane (CH4) recovery [34,40,41,42].
Shale rock is a clastic sedimentary rock in origin with fine-grained clastic sedimentary rock and exists in many types and maturities [40,43]. Shale microstructure is formulated by organic kerogen, inorganic minerals, and the cleat network [43,44]. Clay-based source rock and clastic sedimentary formations (e.g., fine-grained limestones) contain abundant kerogens, possibly 80–99% [45,46]. In kerogen-rich shales, gas can adsorb onto the rock surface and absorb onto and within the pore space of the organic matter as well as some clay minerals [47]. Particularly, the shale surface facilitates adsorption as a result of weak interaction forces (van der Waals and electrostatic), as evidenced in classical observations [48]. Adsorption is typically affected by pressure, temperature, and surface roughness [47]. It is well known that sorption (adsorption and absorption) is a reversible process due to the absence of covalent bonds between the adsorbates (fluids) and the adsorbent (rock surface) [47]. CO2 has a high adsorption tendency to organic matter [49]. The adsorption capacities of CO2 and CH4 in shale are affected by pressure, temperature, and maturity [47,50], e.g., adsorption rises with pressure and maturity and declines with temperature, while the adsorption trend exhibits mainly type 1. It is noteworthy that adsorption/desorption assists in estimating the storage capability of gas in shale, whereas kinetic diffusion determines the fluid flow in the porous media of shale [47]. This adsorption capacity is exceedingly challenging and influenced by subsurface operating conditions, i.e., pressure and temperature [51]; organic matter richness and surface area [47]; thermal maturity [52]; kerogen type, i.e., type I–III [53]; and mineral type, which are montmorillonite, illite, kaolinite, and chlorite [54]. Published experimental data suggest that shale exhibits a significant capacity to adsorb different gases, such as CO2 and methane [50,55,56], arguably due to favorable CO2-wetting characteristics [57]. This observation is also in agreement with molecular-level quantification of CO2 and CH4 adsorption on shale [40,52,58]. Generally, methane exhibits a 10–30 times lower adsorption capacity in shale than in coal [59], while CO2 can adsorb 5–10 times more than CH4 [50].
A range of experimental techniques (e.g., mercury intrusion capillary pressure (MICP) and neutron scattering) are used to determine adsorption potential and pore size distribution [60], while the molecular dynamics (MD) modeling approach describes gas adsorption in kerogen models, which act as an assembly of molecules [61]. Kerogen is composed of an intrinsically complex amorphous carbon network with pore sizes ranging from angstrom to micrometer sizes [62]. From a fundamental geochemical point of view, shale kerogen demonstrates a range of physicochemical features, including but not limited to kerogen porosity, the maturity indicator, the hydrogen-to-carbon ratio, the oxygen-to-carbon ratio, and the aromatic/aliphatic ratio [63]. Thus, a cross-plot of these features in a classic van Krevelen diagram describes the kerogen of different deposition origins, including type I (lacustrine), type II (marine), type III (terrestrial), and type IV (originating from residues), and the molecular models of these kerogens have been investigated [61].
Out of all kerogen models, type II kerogen is known to be the main origin of unconventional (shale) gas play [52,64]. Type II kerogen is further classified into four categories—immature, top of oil window, middle/end-of-oil window, and overmature—and each model is characterized by its respective maturity indicators [52]. Thus, a few previous studies [52,65,66] have investigated the gas adsorption potential of these four sub-models of type II kerogen. While these investigations have revealed the gas adsorption potential of kerogen, the impact of kerogen maturity on the gas adsorption potential of shales requires further investigation. Moreover, while the area of underground hydrogen storage is advancing, there is still limited research on H2 storage via adsorption trapping. Only a few studies have reported the H2 adsorption potential of rocks, e.g., H2 adsorption on clay [51] and H2 adsorption in coals [26], and these studies have reported a significant potential for hydrogen adsorption that was sensitive to pressure and temperature. However, the effect of organic matter residing in shale and its maturity has not been evaluated yet for H2 sorption potential. Moreover, a comparison of H2 sorption capacity with CO2 and CH4 has not been reported, but it is, nevertheless, of great importance in terms of exploring shale as a potential medium for H2 storage.
This study, therefore, investigated the adsorption behavior of hydrogen (H2), carbon dioxide (CO2), and methane (CH4) on four kerogen (organic matter) samples of varying maturity (A < B < C < D) over a wide regime of pressures (2.75 to 20 MPa) and temperatures (323 to 423 K). The molecular simulations were performed using the grand-canonical Monte Carlo (GCMC) simulation module to mimic subsurface conditions. We also correlated the adsorption capacity of CO2, CH4, and H2 to a range of kerogen structural parameters, i.e., atom ratios, % of aromatic carbon, and oxygen atoms. These results provide a fundamental understanding of gas storage in shales and particularly underpin the large-scale CO2 and hydrogen storage potential in organic-rich shale reservoirs and associated decarbonization strategies.
2. Result and Discussion
2.1. Gases Adsorption Behavior against Pressure
The adsorption of gases (CO2, CH4, and H2) was investigated for a broad range of pressure regimes (2.75 to 20 MPa) on four kerogen structures (Figure 1a–d). Clearly, gas adsorption on all types of kerogen structures increased with increasing pressure (Figure 1a). Commonly, at a particular pressure and temperature, the adsorption of three gases followed the order CO2 > CH4 > H2. As an example, for the pressure increment from 2.75 MPa to 20 MPa at 323 K, CO2 adsorption on II-A kerogen increased nearly 2.2 times (from 3.8 mmol/g to 8.8 mmol/g), 3.4 times (1.6–5.6 mmol/g) in case of CH4, and 6.2 times (0.49–3.0 mmol/g) in case of H2 (Figure 1a). Furthermore, the observed adsorption behavior was likely to plateau beyond pressure 20 MPa. The highest adsorption capacity of CO2 confirmed its tendency to desorb CH4 during a coupled enhanced methane recovery and CO2 sequestration in organic-rich shales, consistent with previous observations [38,50]. When the H2 adsorption was lowest and thus H2 could not desorb CH4 and CO2, the observations suggested the potential for H2 storage via adsorption trapping in shale formations.
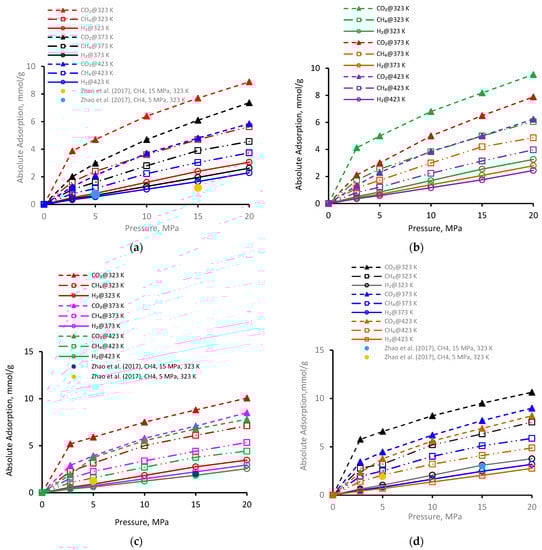
Figure 1.
Gas adsorption behavior versus pressure at different temperatures on kerogen [52]; (a) II-A, (b) II-B, (c) II-C, (d) II-D.
Furthermore, for the immature type II-A kerogen, the highest recorded adsorption capacity was 8.8 mmol/g for CO2 at 323 K and 20 MPa (but less than overmature II-D kerogen). Gas adsorption in II-A kerogen was directly correlated with pressure, which can be attributed to the enhanced van der Waals and electrostatic interactions between the gas molecules (adsorbates) and the surface (adsorbent) at a higher pressure that lead to physisorption.
Similar trends were noted for gas adsorption on II-B (Figure 1b), II-C (Figure 1c), and II-D (Figure 1d), i.e., the increase in adsorption with the increase in pressure. At a low-pressure, the relative adsorption capacities were higher than in the high-pressure range, which can be attributed to the fact that the highest adsorption energy is found in the smallest pores at low pressure at first and then advances toward the larger pores with increased pressure, which in turn decreases the isosteric heat of adsorption [67]. This observation is an indication of pore filling by physisorption in microporous material, as first recommended by Dubinin [68]—a small increase in adsorption with a further increase in pressure until equilibrium is established. As a comparison, in the literature data from Zhao et al. [37] for similar kerogen (without nanopores), the two data points for II-A, II-C, and II-D (at 5 MPa and 323 K and 10 MPa and 323 K, plotted in Figure 1a,c,d) indicated a relatively lower adsorption capacity under similar conditions compared with our results. This underestimation could be attributed to the absence of nanopores with major control over the adsorption behavior, and thus the presence of nanopores (as in our models) suggests greater adsorption capacity.
It is worthwhile to note that the overall highest adsorption capacity was noted to be 10.6 mmol/g for CO2 in immature II-D kerogen at 20 MPa and 323 K (Figure 1d). To visualize this better, a nanopore layer model of type II-D kerogen is shown (Figure 2), indicating the adsorption behavior of all gases, and a large cluster of CO2 molecules is evident (Figure 2). In addition, all kerogen structures depicted mainly type I adsorption behavior for gases, consistent with recent findings [52,69,70]. This observation is also in agreement with CO2 and CH4 adsorptions on coal [71]. In the case of H2 adsorption, however, no attempt on kerogen is available to compare with the results of this study. Note, however, that here, the kerogen has a strong affinity for CO2, i.e., ~1.7 times than CH4 and 4.5 times more than H2, which can be attributed to kerogen functional groups, which have a notable effect on the adsorption of CO2, CH4, and H2 because of their remarkable adsorption energy for CO2 over CH4 and H2 [69]. It can be noted that kerogens exhibited a small deviation from a type I adsorption behavior for H2 gas. This particular behavior can be credited to the small molecular mass of H2 (2.016 g/mole [6]) or low density, which promotes the weak intermolecular interaction of H2 with organic matter and affects adsorption thermodynamics, and the associated bonding between adsorbate and adsorbent is a strong function of the density of a gas [47].
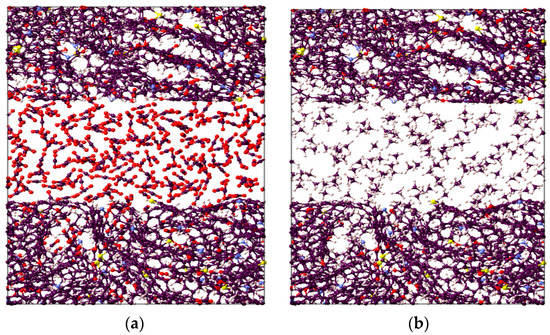
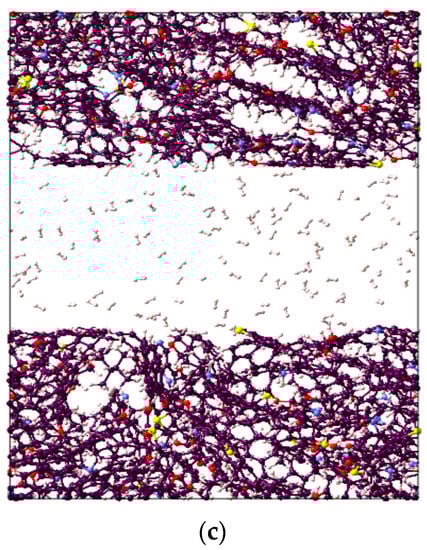
Figure 2.
Visual representation of the constructed molecular model for active spots available in II-D overmature-type kerogen for (a) CO2, (b) CH4, and (c) H2 absorption within the structure and adsorption on the surfaces.
Hence, in short, the results advise a significant capability for gas disposal in underground organic-rich (kerogen) shale formations via adsorption trapping, especially for overmature kerogens. Furthermore, the observed adsorption isotherms are of great importance to be used as input in reservoir-scale assessment to investigate organic-rich porous media [71].
2.2. Gases Adsorption Behavior against Temperature
The adsorption behavior on four kerogen structures of the gases (CO2, CH4, and H2) was evaluated at 323 K, 373 K, and 423 K (Figure 3). Clearly, adsorption decreased with increasing temperature for all kerogen structures. For example, at a fixed pressure of 20 MPa for II-A kerogen, the adsorbed amount of CO2, decreased from 8.8 mmol/g to 5.8 mmol/g (i.e., a 66% reduction) when the temperature of the system was elevated from 323 K to 423 K (Figure 3a), indicating a prominent decline. Similar trends were evident for CH4 and H2, i.e., a decline from 5.6 mmol/g to 3.7 mmol/g (↓66%) for CH4 and from 3.0 to 2.9 mmol/g (↓75%) for H2 for the same temperature increment (Figure 3a). At the same temperature range at a fixed pressure of 20 MPa, the adsorption capacity of the gases in other kerogens (II-B, II-C, and II-D) decreased with similar trends, as noted in II-D (Figure 3b–d and Table 1). Thus, the adsorption capacity is sensitive to temperature, and the low-temperature shale gas reservoir demonstrated greater gas storage potential than the high-temperature shale formation. This phenomenon was also observed in shale adsorption tests [52,72,73].
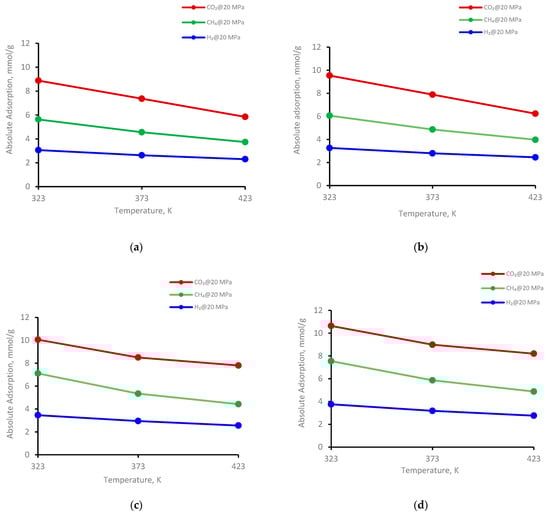
Figure 3.
Gases adsorption trend versus temperature at 20 MPa on kerogen; (a) II-A, (b) II-B, (c) II-C, (d) II-D.

Table 1.
Trend of adsorption in four kerogen structures with temperature increment at a fixed pressure.
The temperature directly caused the gas molecules to leave the adsorption site by high kinetic energy and escape to the bulk-free phase, i.e., a reduction in the adsorbed phase density with increasing temperature [26]. Consequently, the amount of adsorbed gas decreased with increasing temperature [73]. Moreover, the wetting behavior of shale could be another factor responsible for the lower adsorption of gases at higher temperatures. This is evident from the reduction in the water’s advancing and receding contact angles with increasing temperature on shale surfaces [74] as well as coal samples [75], i.e., the samples showed less affinity toward CO2 at higher temperatures. However, further investigations are required to confirm these relationships. Thus, low-temperature shale appears to be most suitable for gas storage.
2.3. Gases’ Adsorption Capacity versus Thermal Maturity
The thermal maturity of a shale sample is known to influence its gas storage capacity. While vitrinite reflectance (Vr) is typically used as an indicator of thermal maturity [76], here, we used the elementary analysis of the four kerogen structures to establish the influence of maturity; this is because this study was based on kerogen models as opposed to a physical shale sample. The percentage of aromatic fixed carbon (obtained from NMR [77]) was lowest in II-A kerogen (40%) and highest in II-D kerogen (80%). Similarly, the XPS analysis demonstrated a similar trend [77]—the lowest aromatic carbon in II-A (40%) and the highest in II-D kerogen (72%)—consistent with overmature kerogen. Thus, on the basis of these model parameters, kerogen maturity was in the order of II-D > II-C > II-B > II-A. The adsorption capacity of the three gases demonstrated a clear increase with increasing kerogen maturity. This behavior can be attributed to specific functional groups, i.e., H, O, N, and S, and an increase in effective pore volume, as both are correlated with organic matter maturity, which is proportional to adsorption capacities [69,78,79]. Typically, at a particular pressure and temperature, the adsorption capacity followed the trend II-A < II-B <II-C < II-D, and the adsorption capacity increased with increasing carbon content (Figure 4). With an increase in carbon content from 40% to 80%, the adsorption capacity increased from 2.4 to 3.0 mmol/g for H2 (Figure 4a), 7.7 to 9.5 mmol/g for CO2 (Figure 4b), and 4.7 to 6.3 mmol/g for CH4 (Figure 4c) at 15 MPa and 323 K. It is noteworthy to mention that the carbon content develops microporous characteristics in shale and contributes to the surface area and total pore volume. These factors can be attributed to a surge in absolute H2, CO2, and CH4 adsorption above 50% of the carbon content (which can be referred to as the critical carbon content).
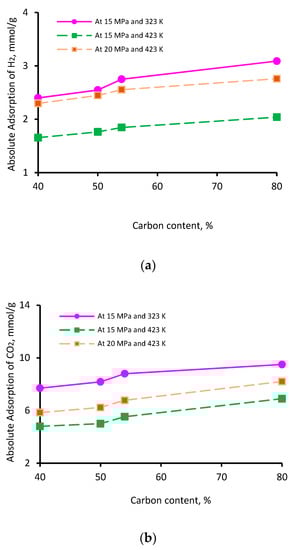
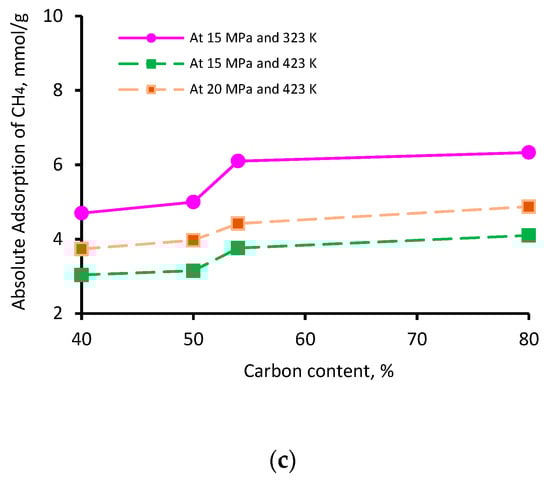
Figure 4.
Gas adsorption (a) H2, (b) CO2, and (c) CH4 as a function of carbon content.
Thus, it was confirmed that highly mature kerogen mainly adsorbs more gas, preferably CO2 over CH4 and H2, while immature kerogen (II-A: carbon content = 40%) showed the lowest adsorption capacity. These results suggest a positive correlation between kerogen maturity and the adsorption capacity of gases. These observations are consistent with previous findings on CO2 and CH4 adsorption onto shale surfaces [52,53,78]. A recent investigation by Arif et al. [26] also found a consistent increase in H2 adsorption in coals with increasing carbon content [26].
2.4. Effect of Kerogen Porosity on Adsorption
The pore size distribution of the samples investigated here suggests that II-D exhibited the largest porosity (= 0.144), followed by II-C (= 0.075), II-B (= 0.073), and II-A (= 0.056), in descending order [80], i.e., the porosity increased with increasing thermal maturity from II-A to II-D kerogens. This observation is in agreement with a previous study [81]. Accordingly, with an increase of micropores, porosity was increased, and thus II-D offered the maximum adsorption capacity, and II-A kerogen offered the minimum. For example, at a fixed pressure (20 MPa) and temperature (373 K), the CO2 adsorption capacity of type II-A kerogen was 7.3 mmol/g, while type II-D adsorbed 8.9 mmol/g under the same conditions (Figure 1). Thus, a higher kerogen porosity promoted greater gas adsorption. Similar trends were evident for other gases (Figure 1).
Previous studies have evaluated the impact of pore size on gas adsorption potential in kerogen structures and shale and have noted that the adsorption capacity is indirectly correlated with the pore size increases [82,83,84,85,86]. The reason behind this could be limited adsorption heat and interaction energy with increased pore size [83]. This observation underpins the phenomenon of adsorption via enhanced specific surface area [86,87]. Notably, smaller micropores (<2 nm), evident in all kerogens, can provide a greater surface area and thus greater gas adsorption capacity [47]. However, the average pore sizes were almost the same in all kerogens.
Our results are in alignment with past studies [80,88,89], i.e., adsorption is sensitive to porosity. This can be attributed to the structural transformation, increased number of pores, and active sorption sites from immature to overmature shale that provide strong interaction sites to gases for adsorption. Small pore volumes were dominant in kerogens II-A and II-B, while large pore volumes contributed to kerogen II-C and II-D [78]. Thus, porosity’s effect on the adsorption is clearly evident—a direct correlation was observed between kerogen porosity and adsorption capacity. Like the porosity effect, it is vital to extend this work to the effect of fracture permeability [90] on adsorption.
3. Materials and Methods
3.1. Kerogen Structure
We used four kerogen molecular models of varying maturity, i.e., immature (type II-A), top of oil window (type II-B), middle/end of oil window (type II-C), and postmature kerogen (type II-D) were considered (Figure 5). These models are similar to those of Ungerer et al. [91], which were based on the analytical data corresponding to the work of Kelemen et al. [92]. The chemical compositions of the four kerogen models were C252H294O24N6S3, C234H263O14N5S2, C242H219O13N5S2, and C175H102O9N4S2. Note that such kerogen models exist in the organic-rich shale (e.g., Duvernay marine).
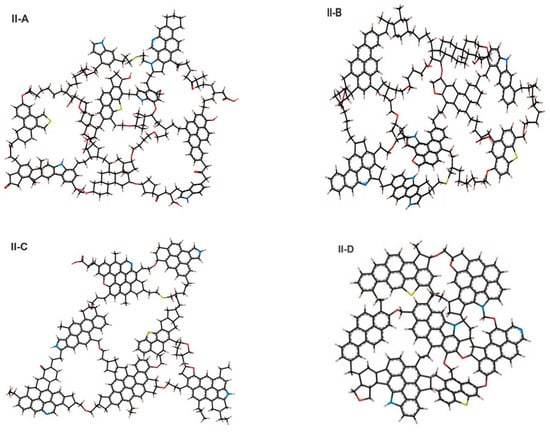
Figure 5.
Six kerogen units developed by Ungerer et al. [91], representative of real kerogen macromolecules before structural optimization. A single atomic unit of kerogen (also known as macromolecule) comprised of carbon (black), oxygen (red), sulfur (yellow), nitrogen (blue), and hydrogen (gray).
The chemical composition and physical properties of kerogen structures were in good agreement with the experimental data (e.g., X-ray and Nuclear Magnetic Resonance) [92], and the percentage of aromatic fixed carbon demonstrated a trend: the lowest aromatic carbon in II-A and highest in II-D kerogen. Thus, the kerogen maturity and porosity were in the order of II-D(overmature) > II-C(Middle and End Oil Window) > II-B(Top of Oil Window) > II-A(immature). The pores size distribution demonstrated that II-D contained the largest micropores, followed by II-C, II-B, and II-A in descending order.
Furthermore, immature kerogen had higher O/C and H/C ratios and lower aromaticity than the oil window and post-mature kerogens, while the key element of the structures was that the maturity increased as follows: II-A < II-B < II-C < II-D (see Table 2), which is plotted on Van Krevelen diagram illustrated in Figure 6. Specifically, II-D had the largest micropores, as evidenced by its high value of porosity compared with other considered kerogen types. Specifically, II-D had the largest micropores, as evidenced by its high value of porosity compared with other considered kerogen types.
Table 2.
Details of the kerogen units used in this investigation [91,93].
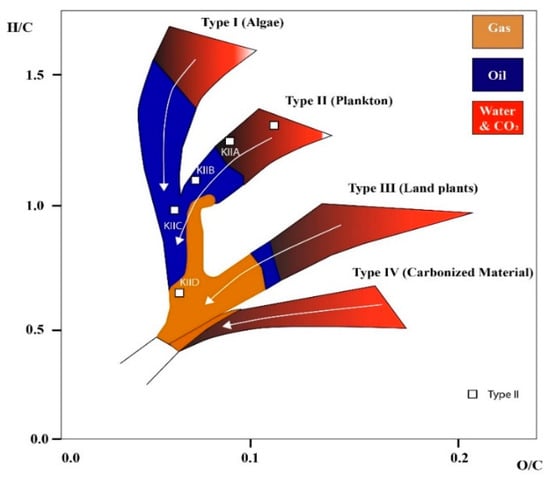
Figure 6.
Kerogen structure classification indicated as increasing order of maturity (modified from [94]). White arrow shows increased level of maturity.
3.2. Kerogen Model Construction
A few previous MD simulation studies [52,58] have been carried out to develop the condensed kerogen using a large-scale atomic/molecular massively parallel simulator (LAMMPS) [80]. Polymer-consistent forcefield plus (pcff++) was used in molecular dynamics [93]; it describes atom dispersion/repulsion (Lennard–Jones potential 6–9), intermolecular, and electrostatic interactions and has been recognized as a reliable forcefield for thermodynamic characteristics [77,95].
Kerogen structures of different maturities and types containing different units were used. A pressure of 20.7 MPa and a temperature of 350 K were considered to progress the simulation and were supposed to be representative of reservoir conditions. The MD simulation considered initialization (9.5 cutoff value and periodic boundary) and energy minimization (molecular positions and velocity proper configuration). Subsequently, the NVT (isochoric-isothermal) and NPT (isobaric-isothermal) simulations were run at 336 K for 250 ps and 200 ps, respectively. Through three continuous NPT steps, the temperature was gradually decreased from 350 K to 336 K to attain faster convergence of kerogen units, as depicted by the final structure in Figure 7. To study the adsorption on the surface of kerogen, a nanopore was created in kerogen to expose the pore space to host the gas (i.e., CO2, CH4, or H2), which led to adsorption on the surface. Unlike absorption, the adsorbed molecules do not penetrate the kerogen structure, and thus there was no chance of internal structural changes. Thus, the sum of adsorption and absorption, sorption, is equivalent to the total storage capacity. The kerogen model (e.g., II-D) used in this study is visualized in Figure 8; the other kerogen structure depicts a similar illustration of active space for adsorption.
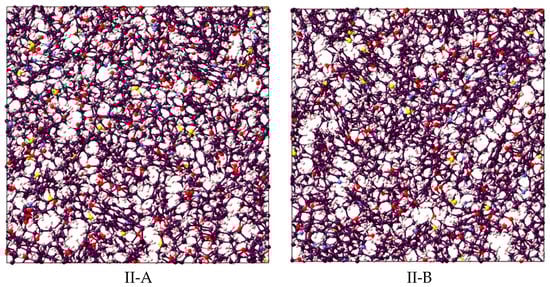
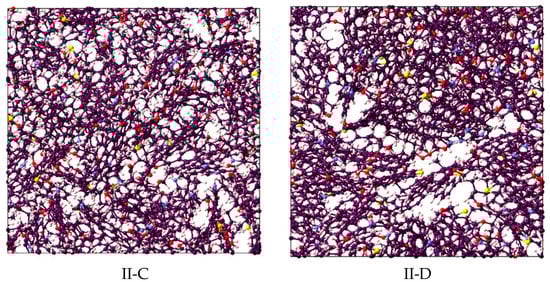
Figure 7.
Final kerogen structure comprised of carbon (black), oxygen (red), sulfur (yellow), nitrogen (blue), and hydrogen (gray).
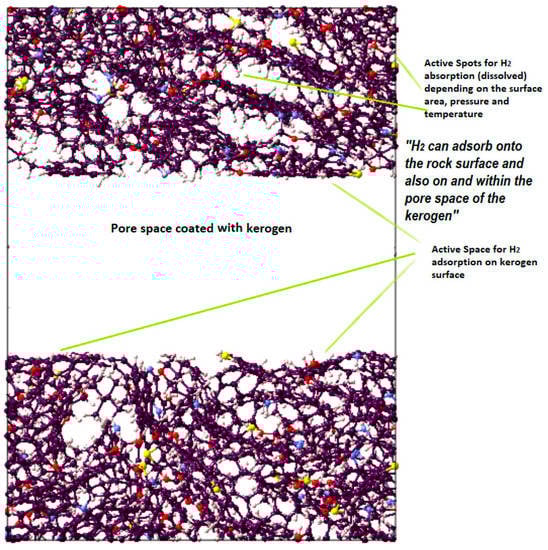
Figure 8.
Visual representation of the molecular model for active spots available in II-D (overmature-type kerogen) H2 absorption within the structure and adsorption on the surfaces.
3.3. Simulation Detail
The sorption was simulated by the Monte Carlo (MC) technique using the grand-canonical Monte Carlo (GCMC) approach [52,69,94] under a wide range of pressures (2.75 to 20 MPa) and temperatures (323 to 423 K). Moreover, ASPEN software was used with the Peng–Robinson equation of state to calculate fugacity coefficients of host molecules (i.e., H2, CH4, and CO2) and converted into chemical potential in the GCMC simulation. Note that the host molecules were defined as united atoms. A molecular loading approach was further adopted to validate the molecular simulation, which showed an acceptable match between the empty cell yield density and the experimental NIST data for CO2, CH4, and H2 (see Figure 9).
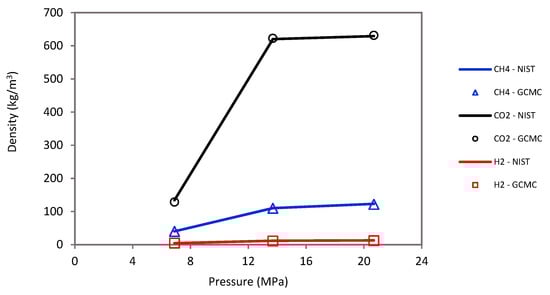
Figure 9.
Molecular loading approach shows an acceptable density match between empty cell yields and experimental NIST data for CO2, CH4, and H2.
Interaction between kerogen and host molecules took place using the 6–9 LJ function (Equation (1)) with a grid spacing of 0.2 Å. For cross interactions, the Lorentz–Berthelot mixing rules (Equations (2) and (3)) were used. Upon the adsorption of gas molecules over kerogen up to a certain value, equilibrium was reached. The number of interactions was set at 0.35 million. At the end of the simulation, the total average adsorbed gas molecules were obtained as a function of chemical potential. Further explanation of the GCMC simulation procedure can be found in the literature [52,58].
where represents the charges, and are the separation distances from two force centers, is the relative permittivity, denotes the zero-interaction potential force distance, and is the highest amplitude.
4. Conclusions
In this study, the adsorption capacities of H2, CO2, and CH4 were modeled on four kerogen structures of varying maturities under a wide range of pressures and temperatures. The adsorption capability of organic-rich matter (kerogen) improved with increasing pressure and decreased with temperature, regardless of kerogen maturity and gas type. The maximum adsorption was 10.6 mmol/g for CO2, 7.5 mmol/g for CH4, and 3.7 mmol/g for H2 in overmature II-D kerogen at 20 MPa and 323 K. Furthermore, the adsorption capacity was directly associated with thermal maturity, carbon content, and porosity at a certain pressure and temperature, i.e., II-D presented the highest adsorption, while all kerogens displayed mainly type I behavior for all gases. For all kerogens, adsorption followed the trend CO2 > CH4 > H2, attributed to the larger CO2 molecular size, which increased its affinity toward the kerogen. Furthermore, the available information from elementary analysis in terms of the pore size distribution was consistent with the adsorption trends. The porosity of kerogens and adsorption capacities of gases followed the order II-D > II-C > II-B > II-A, showing a direct correlation between adsorption capacity and kerogen porosity. Generally, overmature kerogen offered the maximum adsorption capacity at the maximum pressure and minimum temperature.
These findings, therefore, contribute to the preliminary datasets of organic-rich shale reservoirs in terms of kerogen adsorption affinity towards different gases and related logical intellection of adsorption mechanisms in kerogens. In summary, the findings suggest that mature shale formations with relatively high pressure and low temperature are highly suitable for gas storage. These results are also important to understand the potential of unconventional shale for the competitive potential of CO2 and H2 storage and thus contribute to strategies for carbon emission/hydrogen economy. In addition, this work can be extended in the presence of brine phase for its effect on adsorption.
Author Contributions
Conceptualization; methodology, writing—original draft preparation, A.R.; writing—review and editing, visualization, supervision, project administration, M.M.; software, validation, formal analysis, S.A.; writing—review and editing, investigation, M.A.; resources, data curation, G.G. All authors have read and agreed to the published version of the manuscript.
Funding
This research was funded by King Fahd University of Petroleum and Minerals, Grant Number KU201004 and SF20003 to G.G.; Khalifa University of Science and Technology, KFUPM-KU-2020-28.
Institutional Review Board Statement
Not applicable.
Informed Consent Statement
Not applicable.
Data Availability Statement
Not applicable.
Acknowledgments
We acknowledge Research Startup the College of Petroleum Engineering and Geosciences, King Fahd University of Petroleum and Minerals. The author at Khalifa University would like to acknowledge the support received under the KFUPM-KU joint research program. We are also thankful to Rene Windiks and Alexander Mavromaras from MedeA teams for technical support.
Conflicts of Interest
The authors declare no conflict of interest. There are, as such, no personal circumstances or interests that may be perceived as inappropriately influencing the representation or interpretation of reported research results. The funders had no role in the design of the study; in the collection, analyses, or interpretation of data; in the writing of the manuscript; or in the decision to publish the results.
References
- IPCC. Climate Change 2007: Mitigation of Climate Change: Contribution of Working III to the Fourth Assessment Report of the Intergovernmental Panel on Climate Change; Metz, B., Davidson, O.R., Bosch, P.R., Dave, R., Meyer, L.A., Eds.; Cambridge University Press: Cambridge, UK; New York, NY, USA, 2007. [Google Scholar]
- Raza, A.; Gholami, R. Introduction to Carbon Dioxide Capture and Storage. In Sustainable Agriculture Reviews 37: Carbon Sequestration Vol. 1 Introduction and Biochemical Methods; Inamuddin, Asiri, A.M., Lichtfouse, E., Eds.; Springer International Publishing: Cham, Switzerland, 2019; pp. 1–11. [Google Scholar]
- Raza, A.; Rezaee, R.; Gholami, R.; Bing, C.H.; Nagarajan, R.; Hamid, M.A. A screening criterion for selection of suitable CO2 storage sites. J. Nat. Gas Sci. Eng. 2016, 28, 317–327. [Google Scholar] [CrossRef]
- UNFC. United Nations Framework Convention on Climate Change. In Proceedings of the Conference of the Parties on its Twenty-First Session, Held in Paris from 30 November to 13 December 2015 Addendum Part Two: Action Taken by the Conference of the Parties at its Twenty-First Session, Paris, France, 30 November–13 December 2015. [Google Scholar]
- Krzywanski, J.; Ashraf, W.M.; Czakiert, T.; Sosnowski, M.; Grabowska, K.; Zylka, A.; Kulakowska, A.; Skrobek, D.; Mistal, S.; Gao, Y. CO2 Capture by Virgin Ivy Plants Growing Up on the External Covers of Houses as a Rapid Complementary Route to Achieve Global GHG Reduction Targets. Energies 2022, 15, 1683. [Google Scholar] [CrossRef]
- Raza, A.; Arif, M.; Glatz, G.; Mahmoud, M.; Al Kobaisi, M.; Alafnan, S.; Iglauer, S. A holistic overview of underground hydrogen storage: Influencing factors, current understanding, and outlook. Fuel 2022, 330, 125636. [Google Scholar] [CrossRef]
- Cao, C.; Liu, H.; Hou, Z.; Mehmood, F.; Liao, J.; Feng, W. A Review of CO2 Storage in View of Safety and Cost-Effectiveness. Energies 2020, 13, 600. [Google Scholar] [CrossRef]
- Bachu, S. Screening and ranking of sedimentary basins for sequestration of CO2 in geological media in response to climate change. Environ. Geol. 2003, 44, 277–289. [Google Scholar] [CrossRef]
- Zhang, S.; DePaolo, D.J. Rates of CO2 mineralization in geological carbon storage. Acc. Chem. Res. 2017, 50, 2075–2084. [Google Scholar] [CrossRef] [PubMed]
- IPCC. IPCC Special Report on Carbon Dioxide Capture and Storage. Prepared by Working Group III of the Intergovernmental Panel on Climate Change; Cambridge University Press: Cambridge, UK; New York, NY, USA, 2005. [Google Scholar]
- White, S.K.; Spane, F.A.; Schaef, H.T.; Miller, Q.R.S.; White, M.D.; Horner, J.A.; McGrail, B.P. Quantification of CO2 Mineralization at the Wallula Basalt Pilot Project. Environ. Sci. Technol. 2020, 54, 14609–14616. [Google Scholar] [CrossRef]
- Owusu, P.A.; Asumadu-Sarkodie, S. A review of renewable energy sources, sustainability issues and climate change mitigation. Cogent Eng. 2016, 3, 1167990. [Google Scholar] [CrossRef]
- Gernaat, D.E.; de Boer, H.S.; Daioglou, V.; Yalew, S.G.; Müller, C.; van Vuuren, D.P. Climate change impacts on renewable energy supply. Nat. Clim. Chang. 2021, 11, 119–125. [Google Scholar] [CrossRef]
- Sgobbi, A.; Nijs, W.; De Miglio, R.; Chiodi, A.; Gargiulo, M.; Thiel, C. How far away is hydrogen? Its role in the medium and long-term decarbonisation of the European energy system. Int. J. Hydrogen Energy 2016, 41, 19–35. [Google Scholar] [CrossRef]
- Munawwar, S.; Ghedira, H. A review of Renewable Energy and Solar Industry Growth in the GCC Region. Energy Procedia 2014, 57, 3191–3202. [Google Scholar] [CrossRef]
- Raza, A.; Rezaee, R.; Gholami, R.; Rasouli, V.; Bing, C.H.; Nagarajan, R.; Hamid, M.A. Injectivity and quantification of capillary trapping for CO2 storage: A review of influencing parameters. J. Nat. Gas Sci. Eng. 2015, 26, 510–517. [Google Scholar] [CrossRef]
- Raza, A.; Meiyu, G.; Gholami, R.; Rezaee, R.; Rasouli, V.; Sarmadivaleh, M.; Bhatti, A.A. Shale gas: A solution for energy crisis and lower CO2 emission in Pakistan. Energy Sources Part A Recovery Util. Environ. Eff. 2018, 40, 1647–1656. [Google Scholar] [CrossRef]
- Raza, A.; Gholami, R.; Sarmadivaleh, M.; Tarom, N.; Rezaee, R.; Bing, C.H.; Nagarajan, R.; Hamid, M.A.; Elochukwu, H. Integrity analysis of CO2 storage sites concerning geochemical-geomechanical interactions in saline aquifers. J. Nat. Gas Sci. Eng. 2016, 36, 224–240. [Google Scholar] [CrossRef]
- Raza, A.; Gholami, R.; Rezaee, R.; Rasouli, V.; Rabiei, M. Significant aspects of carbon capture and storage—A review. Petroleum 2019, 5, 335–340. [Google Scholar] [CrossRef]
- Raza, A.; Gholami, R.; Rezaee, R.; Han Bing, C.; Nagarajan, R.; Ali Hamid, M. Preliminary assessments of CO2 storage in carbonate formations: A case study from Malaysia. J. Geophys. Eng. 2017, 14, 533–554. [Google Scholar] [CrossRef]
- Carden, P.; Paterson, L. Physical, chemical and energy aspects of underground hydrogen storage. Int. J. Hydrogen Energy 1979, 4, 559–569. [Google Scholar] [CrossRef]
- Foh, S.; Novil, M.; Rockar, E.; Randolph, P. Underground Hydrogen Storage. Final Report. [Salt Caverns, Excavated Caverns, Aquifers and Depleted Fields]; Brookhaven National Lab.: Upton, NY, USA, 1979. [Google Scholar]
- Lewandowska-Śmierzchalska, J.; Tarkowski, R.; Uliasz-Misiak, B. Screening and ranking framework for underground hydrogen storage site selection in Poland. Int. J. Hydrogen Energy 2018, 43, 4401–4414. [Google Scholar] [CrossRef]
- Panfilov, M. Underground and pipeline hydrogen storage. In Compendium of Hydrogen Energy; Elsevier: Amsterdam, The Netherlands, 2016; pp. 91–115. [Google Scholar]
- Al-Yaseri, A.; Wolff-Boenisch, D.; Fauziah, C.A.; Iglauer, S. Hydrogen wettability of clays: Implications for underground hydrogen storage. Int. J. Hydrogen Energy 2021, 46, 34356–34361. [Google Scholar] [CrossRef]
- Arif, M.; Abid, H.R.; Keshavarz, A.; Jones, F.; Iglauer, S. Hydrogen storage potential of coals as a function of pressure, temperature, and rank. J. Colloid Interface Sci. 2022, 620, 86–93. [Google Scholar] [CrossRef]
- Heinemann, N.; Scafidi, J.; Pickup, G.; Thaysen, E.M.; Hassanpouryouzband, A.; Wilkinson, M.; Satterley, A.K.; Booth, M.G.; Edlmann, K.; Haszeldine, R.S. Hydrogen storage in saline aquifers: The role of cushion gas for injection and production. Int. J. Hydrogen Energy 2021, 46, 39284–39296. [Google Scholar] [CrossRef]
- Raza, A.; Glatz, G.; Gholami, R.; Mahmoud, M.; Alafnan, S. Carbon mineralization and geological storage of CO2 in basalt: Mechanisms and technical challenges. Earth-Sci. Rev. 2022, 229, 104036. [Google Scholar] [CrossRef]
- Gholami, R.; Raza, A.; Iglauer, S. Leakage risk assessment of a CO2 storage site: A review. Earth-Sci. Rev. 2021, 223, 103849. [Google Scholar] [CrossRef]
- Gholami, R.; Raza, A. CO2 sequestration in sandstone reservoirs: How does reactive flow alter trapping mechanisms? Fuel 2022, 324, 124781. [Google Scholar] [CrossRef]
- Saffou, E.; Raza, A.; Gholami, R.; Croukamp, L.; Elingou, W.R.; van Bever Donker, J.; Opuwari, M.; Manzi, M.S.; Durrheim, R.J. Geomechanical characterization of CO2 storage sites: A case study from a nearly depleted gas field in the Bredasdorp Basin, South Africa. J. Nat. Gas Sci. Eng. 2020, 81, 103446. [Google Scholar] [CrossRef]
- Gholami, R.; Raza, A.; Andersen, P.; Escalona, A.; Cardozo, N.; Marín, D.; Sarmadivaleh, M. Long-term integrity of shaly seals in CO2 geo-sequestration sites: An experimental study. Int. J. Greenh. Gas Control 2021, 109, 103370. [Google Scholar] [CrossRef]
- Umar, B.A.; Gholami, R.; Raza, A.; Downey, W.S.; Sarmadivaleh, M.; Shah, A.A.; Nayak, P. A Study on the Surface Wettability of Clastic Rocks with Potential Application for CO2 Storage Sites. Nat. Resour. Res. 2019, 29, 2051–2061. [Google Scholar] [CrossRef]
- Tarkowski, R. Underground hydrogen storage: Characteristics and prospects. Renew. Sustain. Energy Rev. 2019, 105, 86–94. [Google Scholar] [CrossRef]
- Bacon, D.H.; Ramanathan, R.; Schaef, H.T.; McGrail, B.P. Simulating geologic co-sequestration of carbon dioxide and hydrogen sulfide in a basalt formation. Int. J. Greenh. Gas Control 2014, 21, 165–176. [Google Scholar] [CrossRef]
- Duan, S.; Gu, M.; Du, X.; Xian, X. Adsorption equilibrium of CO2 and CH4 and their mixture on Sichuan Basin shale. Energy Fuels 2016, 30, 2248–2256. [Google Scholar] [CrossRef]
- Zhao, X.; Sang, Q.; Li, Y.; Liu, H.; Dong, M. CO2-kerogen interaction dominated CO2-oil counter-current diffusion and its effect on ad-/absorbed oil recovery and CO2 sequestration in shale. Fuel 2021, 294, 120500. [Google Scholar] [CrossRef]
- Arif, M.; Lebedev, M.; Barifcani, A.; Iglauer, S. Influence of shale-total organic content on CO2 geo-storage potential. Geophys. Res. Lett. 2017, 44, 8769–8775. [Google Scholar] [CrossRef]
- Singh, H. Hydrogen storage in inactive horizontal shale gas wells: Techno-economic analysis for Haynesville shale. Appl. Energy 2022, 313, 118862. [Google Scholar] [CrossRef]
- Alafnan, S.; Falola, Y.; Al Mansour, O.; AlSamadony, K.; Awotunde, A.; Aljawad, M. Enhanced recovery from organic-rich shales through carbon dioxide injection: Molecular-level investigation. Energy Fuels 2020, 34, 16089–16098. [Google Scholar] [CrossRef]
- Zhou, F.; Hussain, F.; Guo, Z.; Yanici, S.; Cinar, Y. Adsorption/desorption characteristics for methane, nitrogen and carbon dioxide of coal samples from Southeast Qinshui Basin, China. Energy Explor. Exploit. 2013, 31, 645–665. [Google Scholar] [CrossRef]
- Zhou, F.; Hussain, F.; Cinar, Y. Injecting pure N2 and CO2 to coal for enhanced coalbed methane: Experimental observations and numerical simulation. Int. J. Coal Geol. 2013, 116, 53–62. [Google Scholar] [CrossRef]
- Rezaee, R. Fundamentals of Gas Shale Reservoirs; John Wiley & Sons: Hoboken, NJ, USA, 2015; Volume 1, pp. 89–137. [Google Scholar]
- Curtis, M.E.; Ambrose, R.J.; Sondergeld, C.H.; Rai, C.S. Investigation of the relationship between organic porosity and thermal maturity in the Marcellus Shale. In Proceedings of the North American Unconventional Gas Conference and Exhibition, The Woodlands, TX, USA, 14–16 June 2011; pp. 1–4. [Google Scholar]
- Alafnan, S.; Sultan, A.S.; Aljaberi, J. Molecular Fractionation in the Organic Materials of Source Rocks. ACS Omega 2020, 5, 18968–18974. [Google Scholar] [CrossRef]
- Welte, D.; Tissot, P. Petroleum Formation and Occurrence; Springer: Berlin/Heidelberg, Germany, 1984. [Google Scholar]
- Klewiah, I.; Berawala, D.S.; Walker, H.C.A.; Andersen, P.Ø.; Nadeau, P.H. Review of experimental sorption studies of CO2 and CH4 in shales. J. Nat. Gas Sci. Eng. 2020, 73, 103045. [Google Scholar] [CrossRef]
- Brunauer, S.; Deming, L.S.; Deming, W.E.; Teller, E. On a theory of the van der Waals adsorption of gases. J. Am. Chem. Soc. 1940, 62, 1723–1732. [Google Scholar] [CrossRef]
- Jia, B.; Chen, Z.; Xian, C. Investigations of CO2 storage capacity and flow behavior in shale formation. J. Pet. Sci. Eng. 2022, 208, 109659. [Google Scholar] [CrossRef]
- Heller, R.; Zoback, M. Adsorption of methane and carbon dioxide on gas shale and pure mineral samples. J. Unconv. Oil Gas Resour. 2014, 8, 14–24. [Google Scholar] [CrossRef]
- Bardelli, F.; Mondelli, C.; Didier, M.; Vitillo, J.G.; Cavicchia, D.R.; Robinet, J.-C.; Leone, L.; Charlet, L. Hydrogen uptake and diffusion in Callovo-Oxfordian clay rock for nuclear waste disposal technology. Appl. Geochem. 2014, 49, 168–177. [Google Scholar] [CrossRef]
- Zhao, T.; Li, X.; Zhao, H.; Li, M. Molecular simulation of adsorption and thermodynamic properties on type II kerogen: Influence of maturity and moisture content. Fuel 2017, 190, 198–207. [Google Scholar] [CrossRef]
- Zhang, T.; Ellis, G.S.; Ruppel, S.C.; Milliken, K.; Yang, R. Effect of organic-matter type and thermal maturity on methane adsorption in shale-gas systems. Org. Geochem. 2012, 47, 120–131. [Google Scholar] [CrossRef]
- Ji, L.; Zhang, T.; Milliken, K.L.; Qu, J.; Zhang, X. Experimental investigation of main controls to methane adsorption in clay-rich rocks. Appl. Geochem. 2012, 27, 2533–2545. [Google Scholar] [CrossRef]
- Luo, X.; Wang, S.; Wang, Z.; Jing, Z.; Lv, M.; Zhai, Z.; Han, T. Adsorption of methane, carbon dioxide and their binary mixtures on Jurassic shale from the Qaidam Basin in China. Int. J. Coal Geol. 2015, 150, 210–223. [Google Scholar] [CrossRef]
- Mahmoud, M.; Hamza, A.; Hussein, I.A.; Eliebid, M.; Kamal, M.S.; Abouelresh, M.; Shawabkeh, R.; Al-Marri, M.J. Carbon dioxide EGR and sequestration in mature and immature shale: Adsorption study. J. Pet. Sci. Eng. 2020, 188, 106923. [Google Scholar] [CrossRef]
- Arif, M.; Barifcani, A.; Iglauer, S. Solid/CO2 and solid/water interfacial tensions as a function of pressure, temperature, salinity and mineral type: Implications for CO2-wettability and CO2 geo-storage. Int. J. Greenh. Gas Control 2016, 53, 263–273. [Google Scholar] [CrossRef]
- Alafnan, S.; Solling, T.; Mahmoud, M. Effect of kerogen thermal maturity on methane adsorption capacity: A molecular modeling approach. Molecules 2020, 25, 3764. [Google Scholar] [CrossRef]
- Rani, S.; Padmanabhan, E.; Prusty, B.K. Review of gas adsorption in shales for enhanced methane recovery and CO2 storage. J. Pet. Sci. Eng. 2019, 175, 634–643. [Google Scholar] [CrossRef]
- Hosseini, M.; Arif, M.; Keshavarz, A.; Iglauer, S. Neutron scattering: A subsurface application review. Earth-Sci. Rev. 2021, 221, 103755. [Google Scholar] [CrossRef]
- Bousige, C.; Ghimbeu, C.M.; Vix-Guterl, C.; Pomerantz, A.E.; Suleimenova, A.; Vaughan, G.; Garbarino, G.; Feygenson, M.; Wildgruber, C.; Ulm, F.-J. Realistic molecular model of kerogen’s nanostructure. Nat. Mater. 2016, 15, 576–582. [Google Scholar] [CrossRef]
- Mastalerz, M.; He, L.; Melnichenko, Y.B.; Rupp, J.A. Porosity of coal and shale: Insights from gas adsorption and SANS/USANS techniques. Energy Fuels 2012, 26, 5109–5120. [Google Scholar] [CrossRef]
- Vandenbroucke, M.; Largeau, C. Kerogen origin, evolution and structure. Org. Geochem. 2007, 38, 719–833. [Google Scholar] [CrossRef]
- Strapoc, D.; Mastalerz, M.; Schimmelmann, A.; Drobniak, A.; Hasenmueller, N.R. Geochemical constraints on the origin and volume of gas in the New Albany Shale (Devonian–Mississippian), eastern Illinois Basin. AAPG Bull. 2010, 94, 1713–1740. [Google Scholar] [CrossRef]
- Vasileiadis, M.; Peristeras, L.D.; Papavasileiou, K.D.; Economou, I.G. Transport Properties of Shale Gas in Relation to Kerogen Porosity. J. Phys. Chem. C 2018, 122, 6166–6177. [Google Scholar] [CrossRef]
- Ho, T.A.; Criscenti, L.J.; Wang, Y. Nanostructural control of methane release in kerogen and its implications to wellbore production decline. Sci. Rep. 2016, 6, 28053. [Google Scholar] [CrossRef]
- Stoeckli, H.F. Microporous carbons and their characterization: The present state of the art. Carbon 1990, 28, 1–6. [Google Scholar] [CrossRef]
- Dubinin, M.I. Physical adsorption of gases and vapors in micropores. In Progress in Surface and Membrane Science; Elsevier: Amsterdam, The Netherlands, 1975; Volume 9, pp. 1–70. [Google Scholar]
- Sui, H.; Zhang, F.; Wang, Z.; Wang, D.; Wang, Y. Effect of Kerogen Maturity, Water Content for Carbon Dioxide, Methane, and Their Mixture Adsorption and Diffusion in Kerogen: A Computational Investigation. Langmuir 2020, 36, 9756–9769. [Google Scholar] [CrossRef]
- Guo, S. Experimental study on isothermal adsorption of methane gas on three shale samples from Upper Paleozoic strata of the Ordos Basin. J. Pet. Sci. Eng. 2013, 110, 132–138. [Google Scholar] [CrossRef]
- Guan, C.; Liu, S.; Li, C.; Wang, Y.; Zhao, Y. The temperature effect on the methane and CO2 adsorption capacities of Illinois coal. Fuel 2018, 211, 241–250. [Google Scholar] [CrossRef]
- Fianu, J.; Gholinezhad, J.; Hassan, M. Comparison of temperature-dependent gas adsorption models and their application to shale gas reservoirs. Energy Fuels 2018, 32, 4763–4771. [Google Scholar] [CrossRef]
- Jiang, Z.; Zhao, L.; Zhang, D. Study of adsorption behavior in shale reservoirs under high pressure. J. Nat. Gas Sci. Eng. 2018, 49, 275–285. [Google Scholar] [CrossRef]
- Arif, M.; Barifcani, A.; Zubair, T.; Lebedev, M.; Iglauer, S. CO2 wettability of shales and coals as a function of pressure, temperature and rank: Implications for CO2 sequestration and enhanced methane recovery. In PAPG/SPE Pakistan Section Annual Technical Conference and Exhibition; OnePetro: Islamabad, Pakistan, 2016. [Google Scholar]
- Arif, M.; Jones, F.; Barifcani, A.; Iglauer, S. Influence of surface chemistry on interfacial properties of low to high rank coal seams. Fuel 2017, 194, 211–221. [Google Scholar] [CrossRef]
- Awan, F.U.R.; Arif, M.; Iglauer, S.; Keshavarz, A. Coal fines migration: A holistic review of influencing factors. Adv. Colloid Interface Sci. 2021, 301, 102595. [Google Scholar] [CrossRef]
- Ungerer, P.; Rigby, D.; Leblanc, B.; Yiannourakou, M. Sensitivity of the aggregation behaviour of asphaltenes to molecular weight and structure using molecular dynamics. Mol. Simul. 2014, 40, 115–122. [Google Scholar] [CrossRef]
- Huang, L.; Ning, Z.; Wang, Q.; Qi, R.; Zeng, Y.; Qin, H.; Ye, H.; Zhang, W. Molecular simulation of adsorption behaviors of methane, carbon dioxide and their mixtures on kerogen: Effect of kerogen maturity and moisture content. Fuel 2018, 211, 159–172. [Google Scholar] [CrossRef]
- Ross, D.J.; Bustin, R.M. The importance of shale composition and pore structure upon gas storage potential of shale gas reservoirs. Mar. Pet. Geol. 2009, 26, 916–927. [Google Scholar] [CrossRef]
- Alafnan, S. Petrophysics of kerogens based on realistic structures. ACS Omega 2021, 6, 9549–9558. [Google Scholar] [CrossRef]
- Zhang, Y.; He, Z.; Jiang, S.; Lu, S.; Xiao, D.; Chen, G.; Zhao, J. Factors affecting shale gas accumulation in overmature shales case study from lower Cambrian shale in western Sichuan Basin, South China. Energy Fuels 2018, 32, 3003–3012. [Google Scholar] [CrossRef]
- Liu, Y.; Wilcox, J. Molecular simulation of CO2 adsorption in micro-and mesoporous carbons with surface heterogeneity. Int. J. Coal Geol. 2012, 104, 83–95. [Google Scholar] [CrossRef]
- Chen, G.; Zhang, J.; Lu, S.; Pervukhina, M.; Liu, K.; Xue, Q.; Tian, H.; Tian, S.; Li, J.; Clennell, M. Adsorption behavior of hydrocarbon on illite. Energy Fuels 2016, 30, 9114–9121. [Google Scholar] [CrossRef]
- Mosher, K.; He, J.; Liu, Y.; Rupp, E.; Wilcox, J. Molecular simulation of methane adsorption in micro-and mesoporous carbons with applications to coal and gas shale systems. Int. J. Coal Geol. 2013, 109, 36–44. [Google Scholar] [CrossRef]
- Yang, F.; Ning, Z.; Zhang, R.; Zhao, H.; Krooss, B.M. Investigations on the methane sorption capacity of marine shales from Sichuan Basin, China. Int. J. Coal Geol. 2015, 146, 104–117. [Google Scholar] [CrossRef]
- Chen, G.; Lu, S.; Liu, K.; Xue, Q.; Xu, C.; Tian, S.; Li, J.; Zhang, Y.; Tong, M.; Pang, X.; et al. Investigation of pore size effects on adsorption behavior of shale gas. Mar. Pet. Geol. 2019, 109, 1–8. [Google Scholar] [CrossRef]
- Liu, J.; Xie, H.; Wang, Q.; Chen, S.; Hu, Z. The Effect of Pore Size on Shale Gas Recovery with CO2 Sequestration: Insight into Molecular Mechanisms. Energy Fuels 2019, 33, 2897–2907. [Google Scholar] [CrossRef]
- Pang, Y.; Soliman, M.Y.; Deng, H.; Emadi, H. Analysis of Effective Porosity and Effective Permeability in Shale-Gas Reservoirs With Consideration of Gas Adsorption and Stress Effects. SPE J. 2017, 22, 1739–1759. [Google Scholar] [CrossRef]
- Memon, A.; Li, A.; Jacqueline, N.; Kashif, M.; Ma, M. Study of gas sorption, stress effects and analysis of effective porosity and permeability for shale gas reservoirs. J. Pet. Sci. Eng. 2020, 193, 107370. [Google Scholar] [CrossRef]
- Jia, B.; Xian, C.-G. Permeability measurement of the fracture-matrix system with 3D embedded discrete fracture model. Pet. Sci. 2022, 19, 1757–1765. [Google Scholar] [CrossRef]
- Ungerer, P.; Collell, J.; Yiannourakou, M. Molecular modeling of the volumetric and thermodynamic properties of kerogen: Influence of organic type and maturity. Energy Fuels 2015, 29, 91–105. [Google Scholar] [CrossRef]
- Kelemen, S.R.; Afeworki, M.; Gorbaty, M.L.; Sansone, M.; Kwiatek, P.J.; Walters, C.C.; Freund, H.; Siskin, M.; Bence, A.E.; Curry, D.J.; et al. Direct Characterization of Kerogen by X-ray and Solid-State 13C Nuclear Magnetic Resonance Methods. Energy Fuels 2007, 21, 1548–1561. [Google Scholar] [CrossRef]
- Alafnan, S. The Impact of Pore Structure on Kerogen Geomechanics. Geofluids 2021, 2021, 4093895. [Google Scholar] [CrossRef]
- Pathak, M.; Kweon, H.; Deo, M.; Huang, H. Kerogen swelling and confinement: Its implication on fluid thermodynamic properties in shales. Sci. Rep. 2017, 7, 12530. [Google Scholar] [CrossRef] [PubMed]
- Collell, J.; Galliero, G.; Vermorel, R.; Ungerer, P.; Yiannourakou, M.; Montel, F.; Pujol, M. Transport of multicomponent hydrocarbon mixtures in shale organic matter by molecular simulations. J. Phys. Chem. C 2015, 119, 22587–22595. [Google Scholar] [CrossRef]


Publisher’s Note: MDPI stays neutral with regard to jurisdictional claims in published maps and institutional affiliations. |
© 2022 by the authors. Licensee MDPI, Basel, Switzerland. This article is an open access article distributed under the terms and conditions of the Creative Commons Attribution (CC BY) license (https://creativecommons.org/licenses/by/4.0/).