Article

Effective Modulation by Lacosamide on Cumulative Inhibition of INa during High-Frequency Stimulation and Recovery of INa Block during Conditioning Pulse Train

1
Institute of Clinical Medicine, College of Medicine, National Cheng Kung University, Tainan 70101, Taiwan
2
Department of Pediatrics, National Cheng Kung University Hospital, College of Medicine, National Cheng Kung University, Tainan 70101, Taiwan
3
Department of Physical Medicine and Rehabilitation, National Cheng Kung University Hospital, College of Medicine, National Cheng Kung University, Tainan 70101, Taiwan
4
Institute of Molecular Medicine, College of Medicine, National Cheng Kung University, Tainan 70101, Taiwan
5
Department of Physiology, College of Medicine, National Cheng Kung University, Tainan 70101, Taiwan
6
Institute of Basic Medical Sciences, College of Medicine, National Cheng Kung University, Tainan 70101, Taiwan
*
Authors to whom correspondence should be addressed.
Co-First Author: These authors contributed equally to this work.
Int. J. Mol. Sci. 2022, 23(19), 11966; https://doi.org/10.3390/ijms231911966
Submission received: 12 September 2022 / Revised: 3 October 2022 / Accepted: 4 October 2022 / Published: 8 October 2022
(This article belongs to the Special Issue Ion Channels as a Potential Target in Pharmaceutical Designs)

Abstract

:
The effects of lacosamide (LCS, Vimpat®), an anti-convulsant and analgesic, on voltage-gated Na+ current (INa) were investigated. LCS suppressed both the peak (transient, INa(T)) and sustained (late, INa(L)) components of INa with the IC50 values of 78 and 34 μM found in GH3 cells and of 112 and 26 μM in Neuro-2a cells, respectively. In GH3 cells, the voltage-dependent hysteresis of persistent INa (INa(P)) during the triangular ramp pulse was strikingly attenuated, and the decaying time constant (τ) of INa(T) or INa(L) during a train of depolarizing pulses was further shortened by LCS. The recovery time course from the INa block elicited by the preceding conditioning train can be fitted by two exponential processes, while the single exponential increase in current recovery without a conditioning train was adequately fitted. The fast and slow τ’s of recovery from the INa block by the same conditioning protocol arose in the presence of LCS. In Neuro-2a cells, the strength of the instantaneous window INa (INa(W)) during the rapid ramp pulse was reduced by LCS. This reduction could be reversed by tefluthrin. Moreover, LCS accelerated the inactivation time course of INa activated by pulse train stimulation, and veratridine reversed its decrease in the decaying τ value in current inactivation. The docking results predicted the capability of LCS binding to some amino-acid residues in sodium channels owing to the occurrence of hydrophobic contact. Overall, our findings unveiled that LCS can interact with the sodium channels to alter the magnitude, gating, voltage-dependent hysteresis behavior, and use dependence of INa in excitable cells.

1. Introduction

LCS, a functionalized amino acid, is an antiepileptic and analgesic drug available orally and intravenously in clinical practice [1,2,3,4,5,6]. It is commonly administrated in patients with epilepsy and occasionally in patients with trigeminal neuralgia or other neuropathic pain [1,5,7,8,9,10,11,12]. A growing body of evidence demonstrated the effectiveness and tolerability of LCS in patients with epilepsy [13,14,15,16,17,18,19]. Earlier reports have shown that this compound can decrease the frequency of interictal spikes as well as high-frequency oscillations in mesial temporal lobe epilepsy or refractory focal epilepsy [13,20]. The antiepileptic ability of LCS was proposed mainly because it selectively enhances the voltage-dependence of the slow inactivation of Na+ current (INa) [5,7,21,22,23]. In addition to its antiepileptic effects, additional broad effects of LCS have been observed clinically [3,4]. For instance, a recent report showed that LCS could alter electrocardiographic changes in a status epilepticus animal model [24]. Another report showed that LCS could induce personality changes, which disappeared after its discontinuation [25]. Additional electrophysiological actions of LCS might explain its multiple therapeutic effects and need to be thoroughly established.
The voltage-gated Na+ currents form voltage-gated sodium channels (NaV) are critical for the generation and propagation of action potentials in excitable membranes [26,27]. These channels can briefly shift from the resting to the open state after depolarization, thereby allowing the flow of Na+ from the extracellular solution into the cell under the driving forces of the electrical and chemical gradients. After opening briefly in a voltage-dependent manner, the channels are shifted to the inactivated state(s), rendering INa intense but brief [27]. In addition to the voltage-dependence of the slow inactivation of INa, LCS has also been shown to enhance the frequency-dependent inhibition of INa [28]. However, whether the accumulative inhibition of INa inactivation during repetitive depolarization and/or recovery from INa inactivation during the preceding conditioning pulse train could be perturbed by LCS has not been adequately investigated. In the current study, the following attempts were undertaken to evaluate how LCS could lead to any adjustments to the magnitude, gating kinetics, voltage-dependent hysteresis (Hys(V)), and use dependence of INa residing in two different excitable cells, pituitary tumor (GH3) cells and neuroblastoma (Neuro-2a) cells. The observations could help to delineate the delicate modulation of functional activities in excitable cells occurring in vivo.

2. Results

2.1. Effects of LCS on Voltage-Gated Na+ Current (INa)

For the first stage of experiments, whether LCS would exert any perturbations on INa was tested. Pituitary tumor (GH3) cells were placed in Ca2+-free, Tyrode’s solution, which contained 10 mM tetraethylammonium chloride (TEA) and 0.5 mM CdCl2 to avoid interference by other types of ionic currents, such as K+ and Ca2+ currents. Upon membrane depolarization from a holding potential of −100 mV to −10 mV for 30 milliseconds (msec), the transient INa (INa(T)) was elicited, and it could be attenuated dose-dependently by LCS (Figure 1A). At one minute after adding 30 μM or 100 μM LCS, the INa(T) amplitude measured at the beginning of the depolarizing pulse was attenuated to 1012 ± 29 pA (n = 8, p < 0.05) or 783 ± 22 pA (n = 8, p < 0.05) from a control value of 1212 ± 32 pA (n = 8), respectively. When LCS was removed, the current amplitude returned to 1207 ± 31 pA (n = 8).
In addition, late INa (INa(L)) was measured at the end of the depolarizing test pulse. The extent of LCS-mediated inhibition of INa(L) was higher than that at the start of the pulse (i.e., INa(T)). For example, 100 μM LCS decreased the INa(L) amplitude from 74 ± 9 pA to 29 ± pA (n = 8, p < 0.05). Meanwhile, upon exposure to 100 μM LCS, the slow component in the inactivation time constant (τ) of INa(T) decreased from 12.2 ± 2.1 to 8.1 ± 1.3 msec (n = 8, p < 0.05). The relationship between LCS concentration and the inhibition of INa(T) and INa(L) is constructed in Figure 1B. It demonstrated a differential dose-dependent LCS-mediated inhibition in INa(T) and INa(L) elicited by the rapid membrane depolarization. Based on a modified Hill equation described in Materials and Methods, the IC50 values required for exerting a suppressive effect on INa(T) and INa(L) were further estimated as 78 and 34 μM, respectively, reflecting that these two values are distinguishable.
The inhibitory effects of LCS on INa were verified in another kind of excitable cell: Neuro-2a cells. LCS (30 or 100 μM) also suppressed both the amplitude of INa(T) and INa(L) elicited by the rapid membrane depolarization (Figure 2A). Figure 2B shows a differential dose-dependent response of LCS-induced suppression of INa(T) and INa(L) in Neuro-2a cells. Based on a modified Hill equation, the IC50 values to inhibit the INa(T) and INa(L) amplitude were 112 and 26 μM, respectively. Thus, LCS can suppress the magnitude of INa(T) and INa(L) in a time- and concentration-dependent manner both in GH3 cells and Neuro-2a cells.

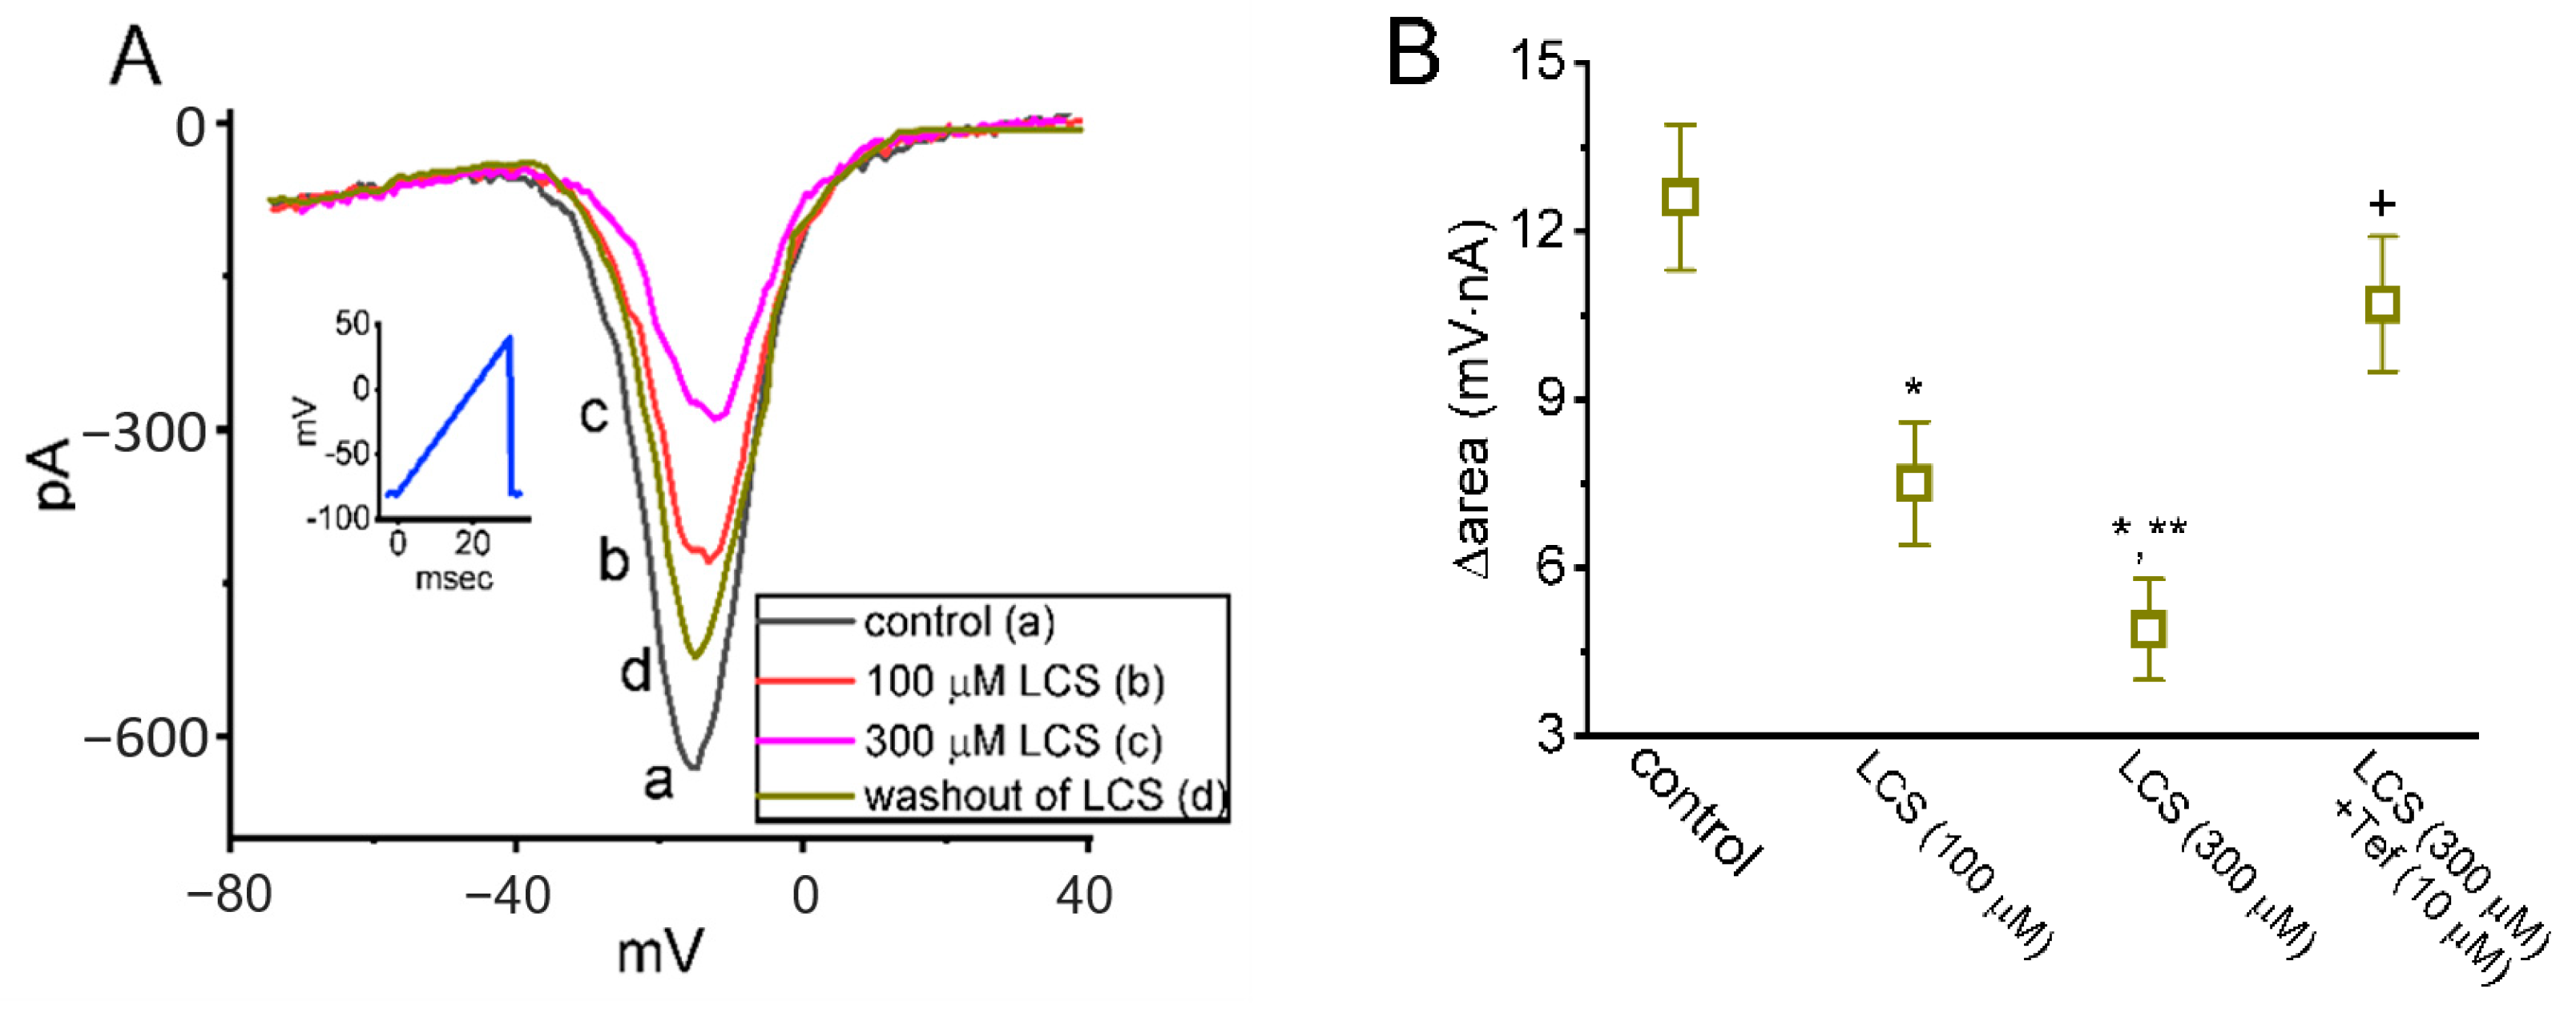
2.2. Effects of LCS on Persistent Na+ Current (INa(P)) Triggered by Isosceles-Triangular Ramp Voltage (Vramp)

The persistent Na+ current (INa(P)) is activated in the subthreshold voltage range and is also important in epilepsy by enhancing the repetitive firing capability of neurons. In this experiment, INa(P) was elicited in GH3 cells by an isosceles-triangular ramp voltage (Vramp), which consisted of an upsloping (ascending) voltage from −100 mV to +50 mV followed by a downsloping (descending) voltage from +50 mV back to −100 mV in 1 s [29,30,31]. Voltage-dependent hysteresis (Hys(V)) was observed in the instantaneous current–voltage (I–V) relationship of INa(P) and presented as two distinct Hys(V) loops of the INa amplitude: a high- (a counterclockwise direction) threshold loop and a low- (a clockwise direction) threshold loop (Figure 3A). Figure 3B shows the time course of the inhibitory effect of LCS (30 or 100 μM) on INa(P) amplitudes activated by double Vramp. Compared with the control situation without LCS, LCS reduced the INa(P) amplitudes on the loop of Hys(V) (Figure 3B,C). The 30 and 100 μM LCS attenuated the INa(P) amplitudes at the level of −5 mV of the ascending limb to 245 ± 21 pA (n = 8, p < 0.05) and 212 ± 17 pA (n = 8, p < 0.05) from control values of 313 ± 24 pA (n = 8), and the INa(P) amplitudes at the level of −60 mV of the descending limb to 151 ± 14 pA (n = 8, p < 0.5) and 101 ± 11 pA (n = 8, p < 0.05) from control values of 198 ± 17 pA (n = 8), respectively. The attenuation of INa(P) was reversed by application of tefluthrin (Tef, 10 μM), which is an activator of INa [30].

2.3. Effect of LCS on Window INa (INa(W)) Elicited by a Short Ascending Vramp

The next question is if the magnitude of INa(W) in response to the rapid ascending Vramp can be modified by LCS. The instantaneous INa(W) was evoked by an ascending Vramp from −80 to +40 mV for 30 msec (i.e., a ramp speed of 4 mV/msec) [32,33]. As shown in Figure 4A, the amplitude of INa(W) was markedly reduced within one minute while Neuro-2a cells were exposed to LCS. LCS (100 or 300 μM) decreased the amplitude of INa(W) measured at the level of −10 mV from a control value of 602 ± 27 pA (n = 7) to 442 ± 21 pA (n = 7, p < 0.05) or 296 ± 18 pA (n = 7, p < 0.05), respectively. After washout of LCS, the current amplitude at −10 mV was returned to 594 ± 24 pA (n = 7). Figure 4B illustrates a summary graph demonstrating the changes in ∆area of Vramp-elicited INa(W) measured at the voltage between −40 and +40 mV. It showed that LCS effectively diminished the INa(W)’s area and Tef (10 μM) could reverse the LCS-mediated decrease in Vramp-elicited INa(W)’s area.

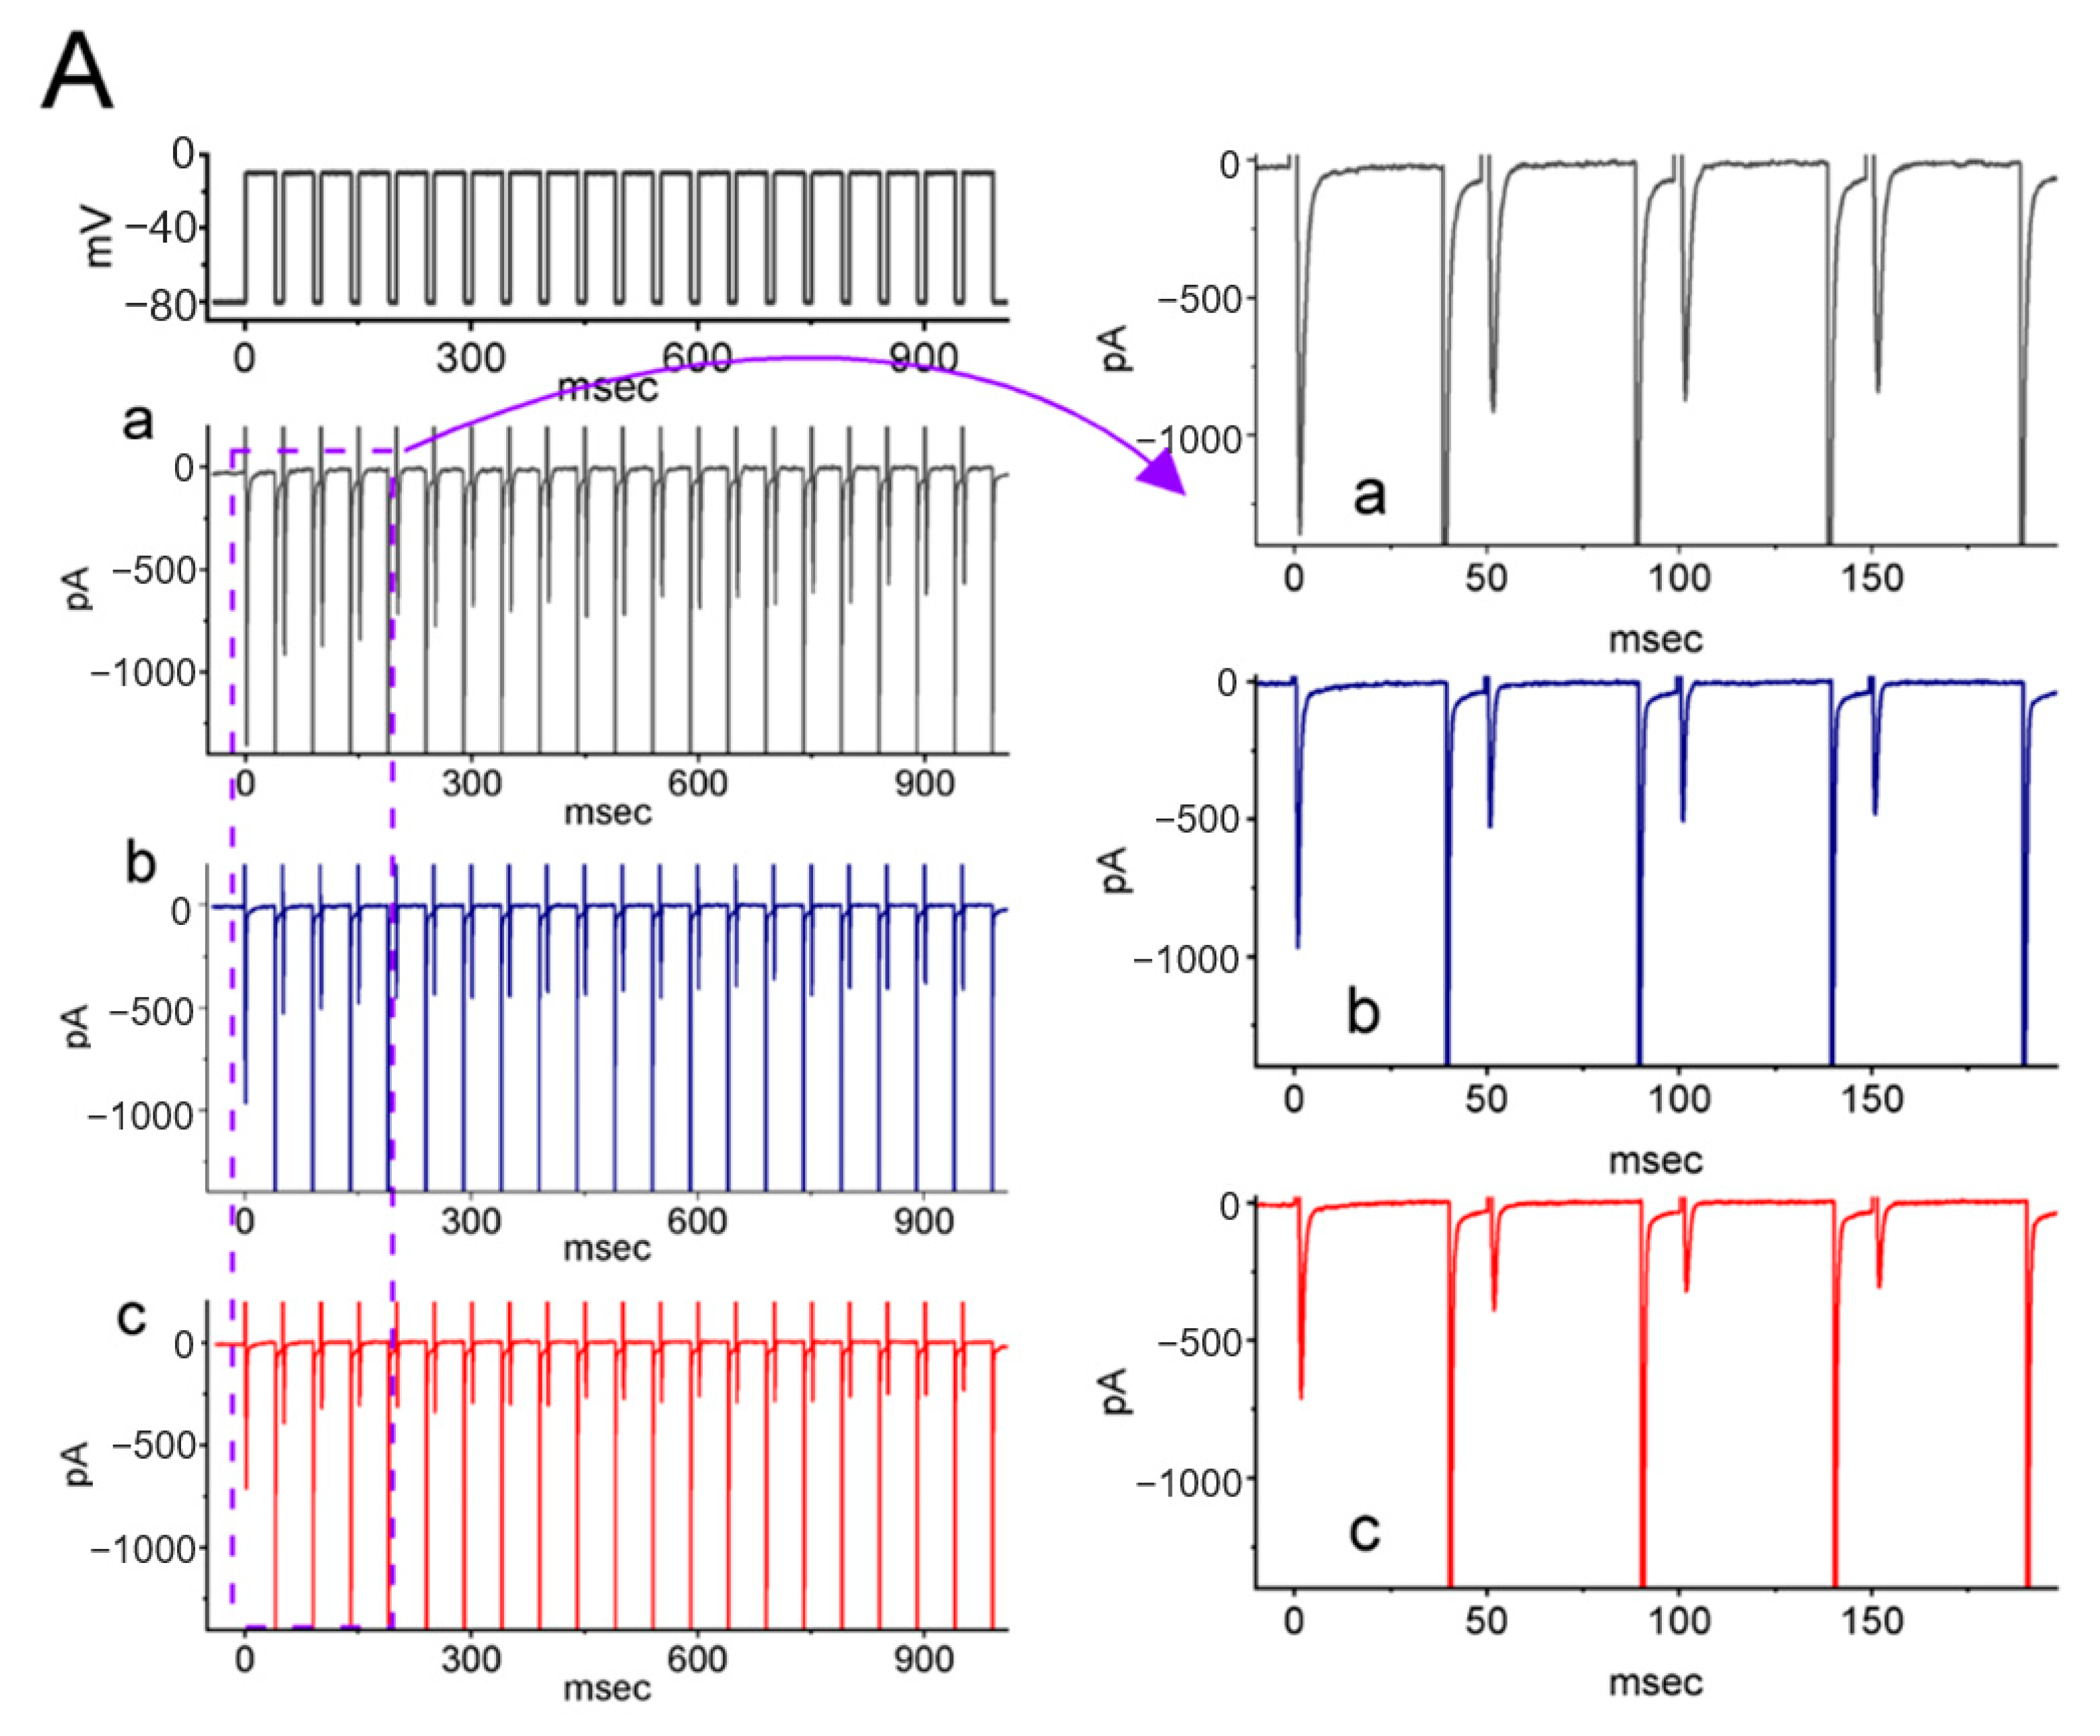
2.4. Effect of LCS on the Cumulative Inhibition of INa during a Train of Depolarizing Pulses

INa(T) inactivation was previously demonstrated to accumulate before being activated during repetitive short pulses, which consisted of repetitive depolarization from −80 mV to −10 mV for 1 s with 40 msec in each pulse at a rate of 20 Hz [32,34]. To see the effects of LCS on the cumulative inhibition of INa, the INa(T) or INa(L) amplitude with or without treatment of LCS was simultaneously measured at the beginning or the end of each depolarizing pulse. Without LCS, the INa(T) or INa(L) inactivation evoked by a 1 s repetitive depolarization showed decaying τ values of 86 ± 9 or 234 ± 22 msec (n = 8), respectively (Figure 5). This indicates a pronounced time-dependent decay of INa(T) or INa(L), which can be fitted with a single-exponential process. Under 30 and 100 μM LCS, the exponential time course of INa(T) or INa(L) elicited by the same train of depolarizing pulses was shortened to 64 ± 7 msec (n = 8, P < 0.05) and 31 ± 6 msec (n = 8, p < 0.05), or to 143 ± 9 msec (n = 8, p < 0.05) and 104 ± 6 msec (n = 8, p < 0.05), respectively. Thus, that accumulative inactivation of the current can be strikingly enhanced in the cells upon LCS exposure apart from a decrease in INa(T) and INa(L) amplitude.
The effects of LCS on the cumulative inhibition of INa were also verified in Neuro-2a cells. Consistently, LCS (100 μM) diminished the INa(T) magnitude and decreased the decaying τ value of INa(T) during repetitive depolarizations from a control value of 79 ± 9 msec to 39 ± 5 msec (n = 7, p < 0.05) (Figure 6A,B). In addition, the LCS-mediated reduction in decaying τ value of INa(T) could be partially reversed by veratridine (Figure 6C). Veratridine was a sodium channel agonist and was recently reported to modify the gating of the human NaV1.7 channel [35].

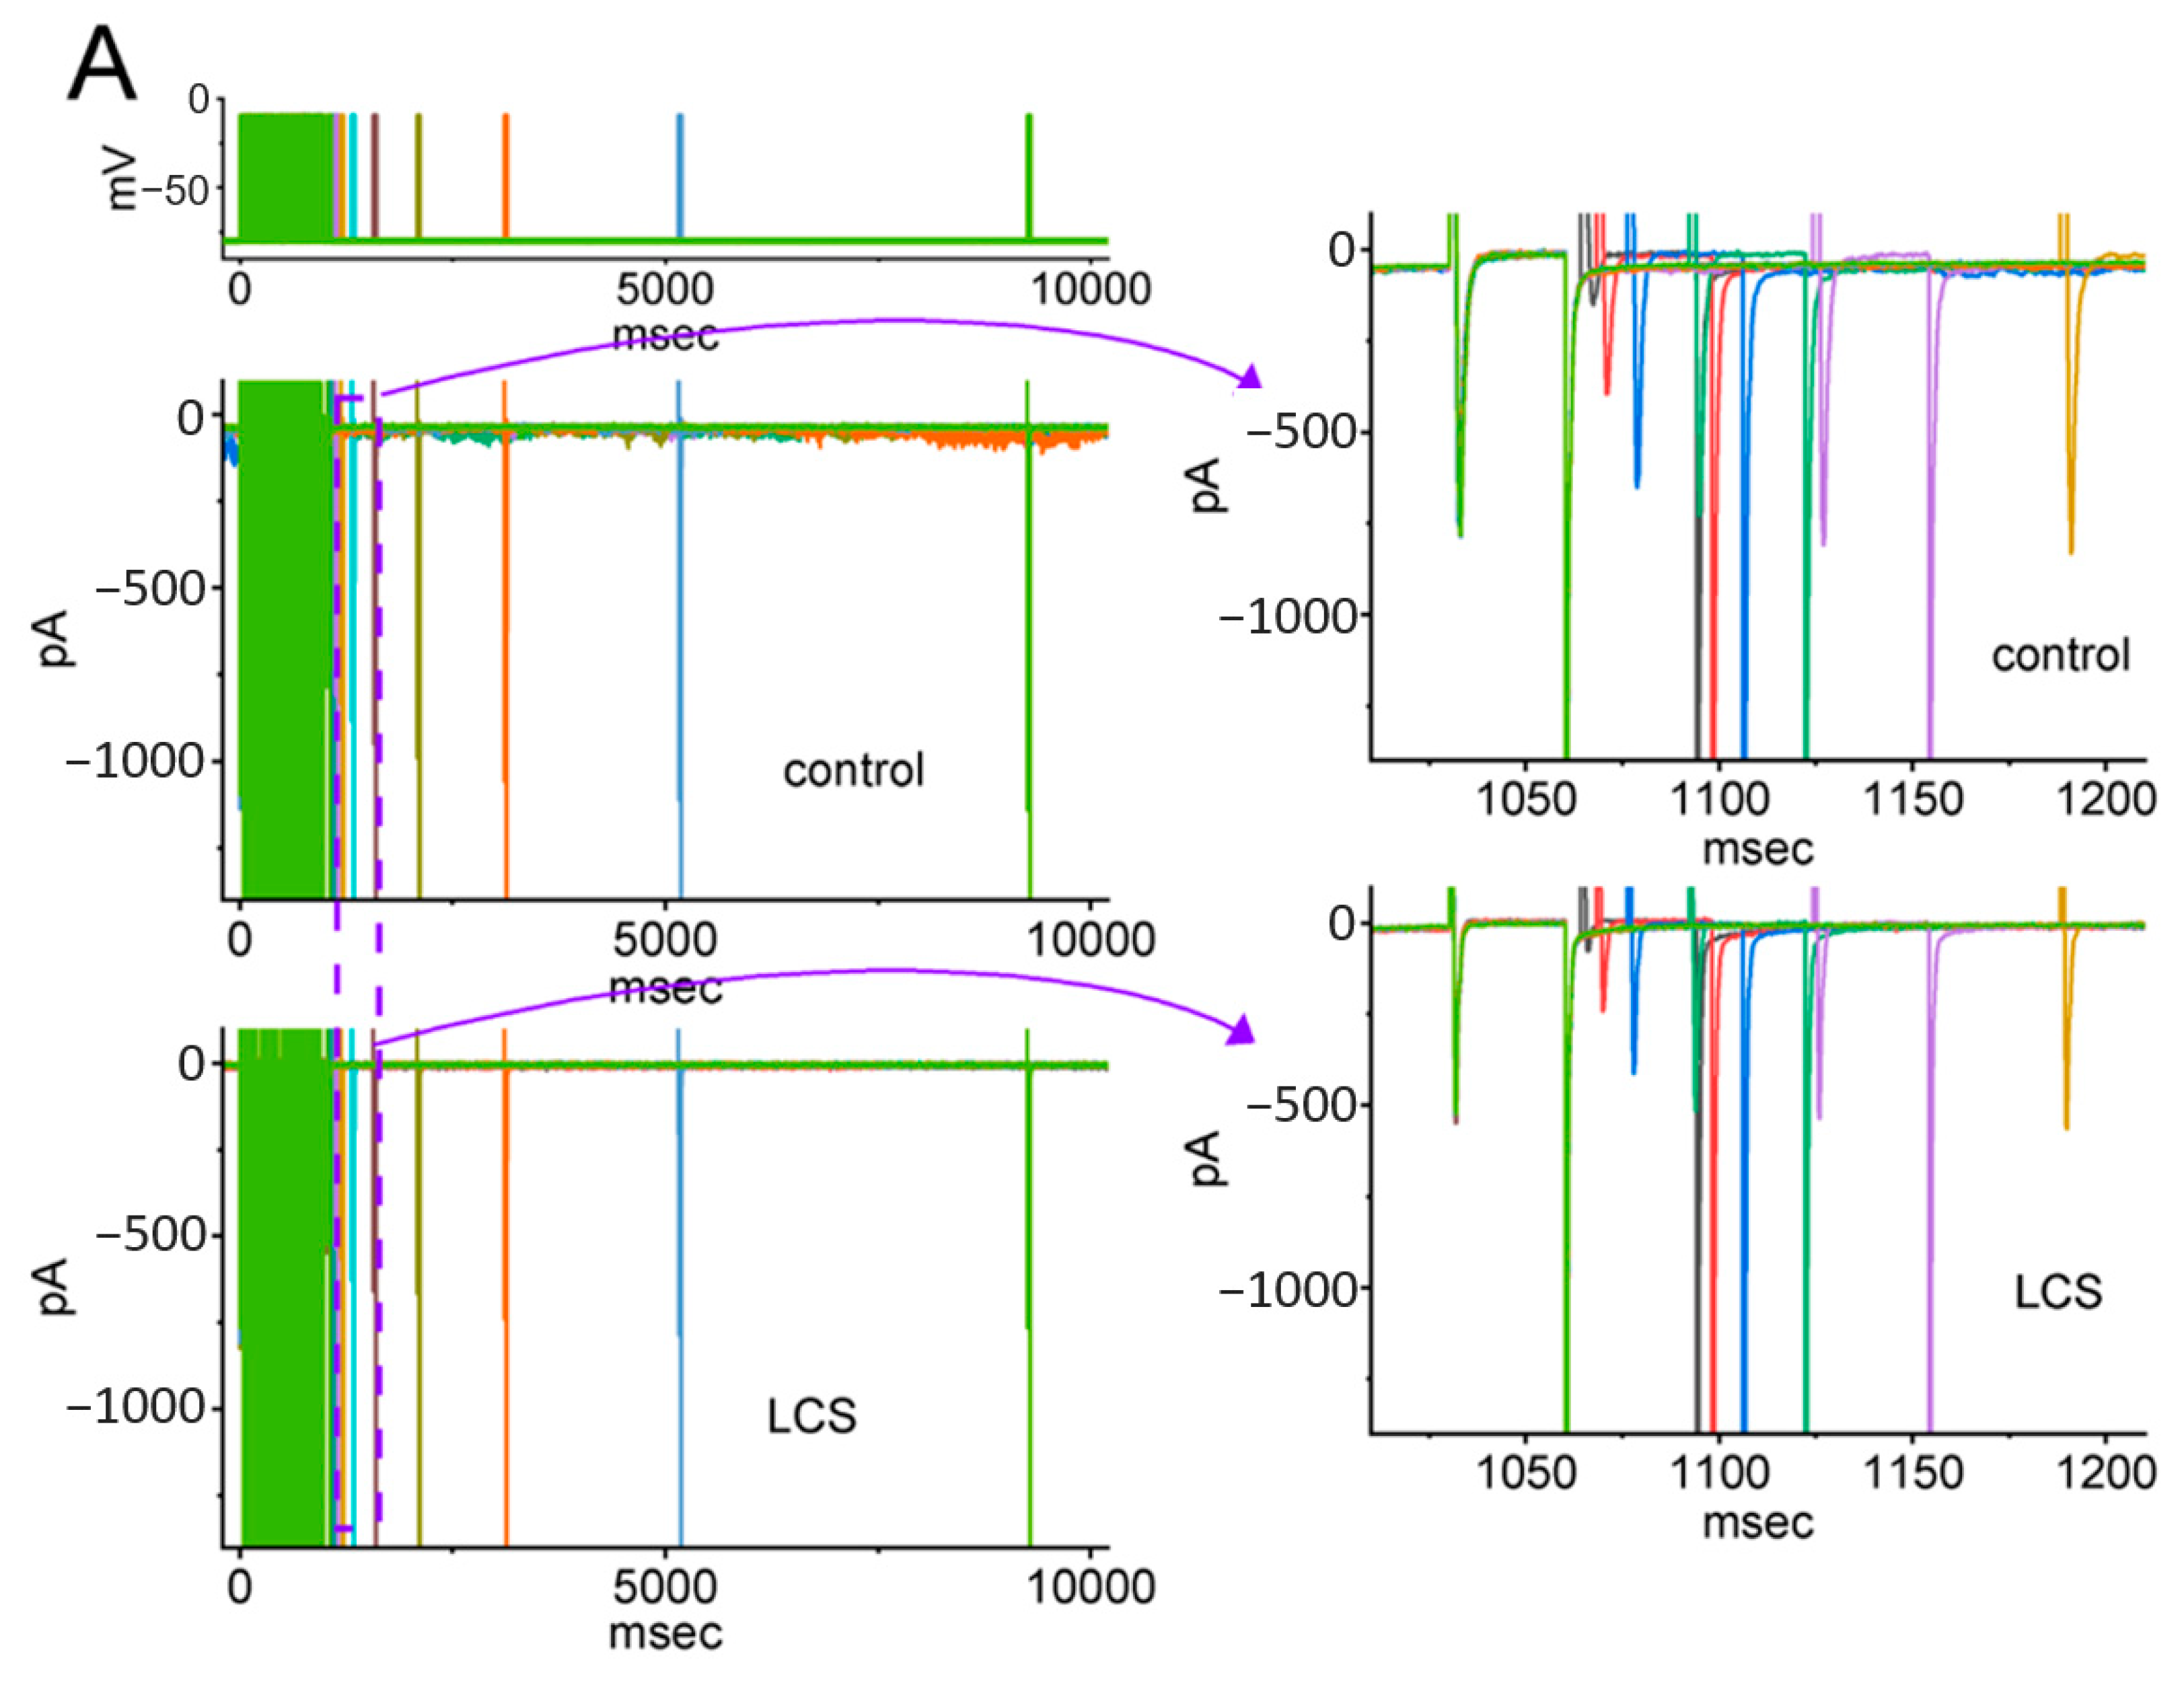
2.5. Modification by LCS of the Recovery Process of INa(T) Inactivation following Conditioning Train of Depolarizing Stimuli

Earlier investigations have disclosed a unique type of recovery from INa(T) inactivation evoked by a train of the preceding conditioning depolarizing stimuli [34,36,37]. The preceding conditioning train was composed of twenty 40 msec pulses separated by 5 msec intervals at −80 mV for 1 s (Figure 7A, top). Following such a conditioning train, the INa was produced by a two-step voltage protocol to measure the recovery time course of the current. The two-step voltage protocol included the first step that consisted of a 30 msec pulse from −80 to −10 mV and a second step that consisted of pulses for a variable length of time in a geometric progression (common ratio = 2) from −80 to −10 mV. The relative amplitude of recovery for current inactivation during this protocol was determined by the second step.
In the control situation (i.e., without LCS), the recovery from INa(T) inactivation elicited by the preceding conditioning depolarizing stimuli was noticed to emerge in a biphasic manner including a rapid rising recovery phase followed by a late slow phase (Figure 7A). It indicates a train of stimuli enabling the cells to resist the recovery from INa(T) inactivation. The recovery time course of this biphasic-manner INa(T) inactivation was constructed in Figure 7B. The experimental data points were well fitted with a sum of two exponential functions, i.e., fast (τfast) and slow time constant (τslow), as elaborated in Materials and Methods. Upon exposure to LCS (30 or 100 μM), both τfast and τslow in the recovery time course of current inactivation was increased (p < 0.05) compared to the control situation (Table 1).

3. Discussion

The principal finding in this study was that LCS could suppress INa in a time-, concentration- and frequency-dependent manner identified in GH3 and Neuro-2 cells. LCS induced differential inhibitions of INa(T) and INa(L) activated by a short depolarizing pulse. It also suppressed the high- or low-threshold amplitude of INa(P) elicited by the upright isosceles-triangular Vramp at either the upsloping or downsloping limb leading to a striking reduction in Hys(V) strength of the current. The accumulative inhibition of INa(T) and INa(L) during a train of depolarizing pulses was substantially enhanced by LCS, and the values of τfast and τslow in the recovery time course during the preceding conditioning train of depolarizing pulses were increased. Taken together, LCS could modify the magnitude, gating properties, use-dependence, and Hys(V) behaviors of INa, leading to the inhibition of INa(T), INa(L), INa(P), and INa(W).
In the present investigations, the non-equilibrium voltage-dependent hysteresis (Hys(V)) of INa(P) was observed by an upright isosceles-triangular Vramp with a duration of 1 s (Figure 3). This implies that the INa(P) magnitude is contingent on the pre-existing state(s) or conformation(s) of the NaV channel. There are two types of triangular Vramp-elicited INa(P), that is, low-threshold (i.e., activated at a voltage range near the resting potential) elicited upon the downsloping end of the triangular Vramp, and high-threshold (i.e., activated at a voltage range near the maximal INa(T)) elicited on the upsloping end of such Vramp [28]. LCS attenuated both types of triangular Vramp-elicited INa(P) of the Hys(V) behaviors and Tef could effectively reverse this LCS-induced reduction in Hys(V)’s strength in the current. In the literature, this Hys(V) behavior of triangular Vramp-elicited INa(P) has been demonstrated to link to the magnitude of background Na+ currents closely, and INa(L) and INa(P) during an extended period of time are likely to share the same NaV channels [29,31,34,38,39]. This result indicates that LCS could diminish the background Na+ currents conductance and reduce the subthreshold potential or depolarization drive in these excitable cells.
In addition, the time-dependent decline in INa(T) and INa(L) during a 20 Hz train of depolarizing voltage commands (i.e., 40 msec pulses applied from −80 to −10 mV at a rate of 20 Hz for 1 sec) was observed in an exponential fashion, as shown in Figure 5 and Figure 6. This accumulative inhibition is a use-dependent property of INa(T) and INa(L) during rapid repetitive stimuli or high-frequency firing [32,34,40,41,42,43]. LCS could enhance this accumulative inhibition through reducing not only the amplitude but also the τ value of INa(T) and INa(L). The LCS-mediated enhancement was only reversed partially by veratridine, a sodium channel agonist. This means that LCS would lead to a “loss-of-function” change of Na+ channels and keep the Na+ channels in inactivated states during repetitive depolarization to prevent excessive excitability. In addition to LCS, a recent study demonstrated that other sodium blockers, such as lidocaine, also had the use-dependent inhibition of corneal nerve activity [44]. It is consistent with the current investigations.
It is important to emphasize that the LCS increased the τfast and τslow of recovery from the INa(T) block elicited by the preceding conditioning train pulse and enlarged the value of A, as summarized in Table 1. This preceding conditioning train pulse consisted of rapid repetitive pulses, which mimics high-frequency firing on excitable cells and would cause a large fraction of NaV channels to shift toward the slowly recovering pool. The value of A indicates the fraction of the slow recovering pool of NaV channels. Taken together, LCS could cause a larger fraction of the NaV channels in an inactivated state and a longer recovery from inactivation after rapid repetitive stimuli or high-frequency firing. These results are partly relevant to the previous study that showed slow inactivation enhancement by LCS [21].
In this work, we further investigated how the protein of NaV could be delicately docked with LCS by using PyRx software (https://sourceforge.net/projects/pyrx/; accessed on 17 July 2022). The predicted binding sites with LCS are demonstrated in Figure 8. The LCS could form hydrophobic contacts with several residues, including Gly 76, Trp 77, Phe 80, Gln 122, Leu 125, and Leu 126. Phe 80 can interact with the N’-acetylamino acid N’-benzyl amide unit of LCS, Gly 76 and Trp 77 can dock to the linker that connects the two-aryl group, while Gln 122, Leu 125, and Leu 126 are noted to interact with the terminal aromatic ring. These three functional groups (i.e., N’-acetylamino acid N’-benzyl amide unit, the linker that connects the two aryl groups, and the terminal aromatic ring) in the molecule could be essential for its NaV-channel blocking activity [7]. However, as the 4′ position of the structural moiety in safinamide (α-aminoamide) does not affect the slow inactivation of NaV channels, the interaction with Phe 80 appears to be unimportant. The detailed structure of this NaV channel, which is a particularly good exemplar for hNaV pharmacology, was shown in an earlier study [45]. These results indicate that LCS can favorably interact with the amino-acid residues of the NaV channel with an estimated binding affinity of −5.0. Kcal/mol, which is adjacent to the transmembrane region (i.e., position: 123–148) or membrane segment (i.e., position: 79–95) of the channel. Consequently, when LCS reaches the NaV channels on the membrane, the interactions may raise the structural or steric constraints, thereby resulting in a substantial decrease in NaV-channel openings.
In summary, LCS could suppress INa in a time-, concentration-, and frequency-dependent manner and modify the magnitude, gating properties, use-dependence, and Hys(V) behaviors of INa, leading to inhibiting INa(T), INa(L), INa(P), and INa(W). Consequently, LCS could reduce the subthreshold potential, enhance the accumulative inhibition during repetitive depolarization, and prolong the recovery from inactivation after repetitive depolarization in excitable cells.

4. Materials and Methods

4.1. Chemicals, Drugs, and Solutions Used in This Study

Lacosamide (LCS, Vimpat®, R-enantiomer of 2-acetamido-N-benzyl-3-methoxy- propionamide, 2,3-diaminomaleonitrile, C13H18N2O3), tefluthrin (Tef), tetraethylammonium chloride (TEA), tetrodotoxin (TTX), and veratridine were supplied by Sigma-Aldrich (Merck, Taipei, Taiwan). For cell preparations, we obtained culture media, fetal bovine or calf serum, horse serum, L-glutamine, and trypsin/EDTA from HyCloneTM (Thermo Fisher, Kaohsiung, Taiwan). All other chemicals used in this work (e.g., CsOH, CsCl, CdCl2, and HEPES) were of laboratory grade and taken from standard sources. Double-distilled water deionized through a Milli-Q® purification system (Merck, Tainan, Taiwan) was used in all experiments.
The ionic composition of normal Tyrode’s solution buffered by HEPES was as follows (in mM): NaCl 136.5, CaCl2 1.8, KCl 5.4, MgCl2 0.53, glucose 5.5, and HEPES-NaOH buffer (pH 7.4). During the measurements recoding K+ currents, a patch electrode was filled with a solution (in mM): K-aspartate 130, KCl 20, MgCl2 1, KH2PO4 1, Na2ATP 0.1, Na2GTP 0.1, EGTA 0.1, and HEPES-KOH buffer (pH 7.2). To measure different patterns of voltage-gated Na+ current, we substituted K+ ions in the internal solution for equimolar Cs+ ions, and the pH value in the solution was adjusted to 7.2 by adding CsOH. The pipette solution and culture media presently used were filtered with an Acrodisc® syringe filter that contains a 0.2 mm Supor® nylon membrane (#4612; Pall Corp.; Genechain, Kaohsiung, Taiwan).

4.2. Cell Preparations

Both the mouse neuroblastoma cell line, Neuro-2a (N2a, BCRC-60026), and the pituitary adenomatous cell line, GH3 (BCRC-60015), were acquired from the Bioresource Collection and Research Center (Hsinchu, Taiwan). GH3 cells were in Ham’s F medium supplemented with 2.5% (v/v) fetal calf serum, 15% (v/v) horse serum, and 2 mM L-glutamine, while Neuro-2a cells were in Dulbecco’s modified Eagle’s medium with 10% (v/v) fetal bovine serum. These cells were maintained at 5% CO2 in a 37 ℃ water-jacketed incubator. Growth medium was replaced twice a week, and cells were split into subcultures once a week. Subcultures were made with trypsinization (0.025% trypsin solution (HyCloneTM) containing 0.01% sodium N, N-diethyldithiocarbamate and EDTA). Electrophysiological measurements were undertaken five or six days after cells were cultured up to 60–80% confluence [30].

4.3. Electrophysiological Measurements

During the few hours before the measurements, we harvested Neuro-2a or GH3 cells with 1% trypsin-EDTA solution, and a few drops of cell suspension were rapidly placed into a custom-built recording chamber fixed on the stage of an inverted DM-IL microscope (Leica; Major Instruments, Tainan, Taiwan). We then suspended cells at room temperature (20–25 °C) in normal Tyrode’s solution until cells attached to the chamber’s bottom before the recordings were made. The pipettes used were fabricated from Kimax-51 glass tubing with an 1.5–1.8 mm outer diameter (#34500; Kimble, Dogger, New Taipei City, Taiwan) with a vertical two-stage puller (PP-83; Narishige, Taiwan Instrument, Tainan, Taiwan). When filled with different internal solutions, the electrodes presently used for measurements had a tip resistance of 3–5 MΩ. Ionic currents were examined in the whole-cell configuration of a modified patch-clamp technique with the use of either an Axoclamp-2B (Molecular Devices, Sunnyvale, CA, USA) or an RK-400 amplifier (Bio-Logic, Claix, France), as described elsewhere [28]. GΩ-seals were achieved in an all-or-nothing fashion and resulted in a dramatic improvement in the signal-to-noise ratio. The liquid junction potentials, which occur when the compositions in bath solution and those of the pipette internal solution are different, became zeroed shortly before GΩ-seal formation was achieved, and the whole-cell data were then corrected as previously desribed [30].

4.4. Data Recordings

The signals were monitored and digitally captured and stored online at 10 kHz or more in an ASUS ExpertBook laptop computer (Yuan-Dai, Tainan, Taiwan). For efficient analog-to-digital (A/D) and digital-to-analog (D/A) conversion to proceed, a Digidata®-1440A digitizer connected with a laptop computer via a USB 2.0 port was delicately operated by pClamp 10.6 software run under Microsoft Windows 7 (Redmond, WA, USA). Amplified current signals were low-pass-filtered at 2 kHz with an FL-4 four-pole Bessel filter (Dagan, Minneapolis, MN, USA). The voltage-clamp protocols comprising various rectangular and ramp waveforms were specifically designed and were thereafter imposed on the tested cells through D/A conversion. As pulse-train stimulation was needed, we used a dual output pulse stimulator (Astro-Med Grass S88X; Grass, West Warwick, RI, USA).

4.5. Data Analyses

To assess the dose–response curve of LCS-mediated inhibition on the peak (transient, INa(T)) and sustained (late, INa(L)) components of depolarization-activated INa present in GH3 or Neuro-2a cells, INa’s were evoked by a 30 msec depolarizing pulse to −10 mV from a holding potential of −100 mV (indicated in the top part of Figure 1A and Figure 2A), and current amplitudes obtained with or without the exposure to different LCS concentrations (3 μM–1 mM) were measured at the beginning (INa(T)) and end (INa(L)) of the depolarizing pulses. The concentration needed to suppress 50% of the current amplitude (i.e., IC50) was appropriately determined according to the three-parameter logistic model (i.e., a modified form of the sigmoidal Hill equation) by use of goodness-of-fit assessments:
R e l a t i v e   a m p l i t u d e =   [ L C S ] n H × ( 1 a ) ( [ L C S ] n H + I C 50 n H ) + a
In this equation, [LCS] = the LCS concentration; nH = the Hill coefficient; IC50 = the concentration required for a 50% inhibition. Maximal inhibition (i.e., 1 − a) was also approximated in this formula.
By a two-step voltage protocol with varying interpulse intervals in a geometric progression (common ratio = 2), the recovery time course of INa(T) from the block activated in response to the 1 sec conditioning pulse train was constructed, and the results acquired with or without the addition of LCS to GH3 or Neuro-2a cells were thereafter drawn by plotting the relative INa(T) amplitude (normalized with respect to the steady-state amplitude activated at 0.1 Hz). A basic assumption of the analyses is that the recovery time course of the current established under these experimental conditions can be reliably described by an exponential function [34]. Because the recovery time course in GH3 cells exhibits a rapid rising recovery phase followed by a late slow phase, there should be at least two underlying exponential terms. Accordingly, the data points showing a recovery time course with or without the addition of LCS were fitted to the exponential function with the biexponential process, i.e.,
y = A × ( 1 e t τ f a s t ) + B × ( 1 e t τ s l o w )
where y is the relative amplitude of INa at time t, A or B is the relative amplitude of each exponential component, and τfast or τslow is the fast or slow time constant in the recovery of INa block, respectively.

4.6. Curve-Fitting Approximations and Statistical Analyses

Linear or nonlinear curve fitting to experimental datasets in this work was made with the interactive least-squares procedure by using various tools, such as Microsoft Excel®-embedded “Solver” (Microsoft, Redmond, WA, USA) and the OriginPro® 2021 program (OriginLab®; Scientific Formosa, Kaohsiung, Taiwan). The averaged results are presented as the mean ± standard error of the mean (SEM) with the sizes of independent samples (n) indicating cell numbers from which data were taken. The Student’s t-test (paired or unpaired) between the two different groups was applied. When differences among more than two groups were encountered, we performed either analysis of variance (ANOVA)-1 or ANOVA-2 with or without repeated measures, followed by the post hoc Fisher’s least significant difference test. Statistical significance (indicated with *, **, or + in the figures) was determined at a p value of <0.05.

Author Contributions

Conceptualization, S.-N.W., Y.-C.L., P.-M.W., C.-W.C. and Y.-F.T.; methodology, S.-N.W. and H.-Y.C.; software, H.-Y.C. and S.-N.W.; validation, H.-Y.C., T.-H.C. and M.-C.Y.; formal analysis, S.-N.W.; investigation, P.-M.W., H.-Y.C., T.-H.C., M.-C.Y., C.-W.C. and S.-N.W.; resources, S.-N.W.; data curation, Y.-C.L., C.-W.C. and S.-N.W.; writing—original draft preparation, S.-N.W., P.-M.W., Y.-C.L. and Y.-F.T.; writing—review and editing, S.-N.W., C.-W.C. and Y.-F.T.; project administration, S.-N.W., C.-W.C. and Y.-F.T.; funding acquisition, S.-N.W. and Y.-F.T. All authors have read and agreed to the published version of the manuscript.

Funding

This research was funded by the Ministry of Science and Technology (MOST-108-2314B-006-094; 110-2314-B-006-049; 110-2314-B-006-056; 111-2314-B-006-082) of Taiwan, and National Cheng Kung University Hospital (NCKUH-11102050; NCKUH-11102029).

Institutional Review Board Statement

Not applicable.

Informed Consent Statement

Not applicable.

Data Availability Statement

The original data are available upon reasonable request to the corresponding author.

Acknowledgments

The authors are grateful to Tzu-Hsien Chuang for the assistance.

Conflicts of Interest

The authors declare that they have no conflict of interest, financial or otherwise. The authors are responsible for the content of writing of the paper.

Abbreviations

Hys(V)voltage-dependent hysteresis
IC50concentration required for 50% inhibition
INavoltage-gated Na+ current
INa(L)late Na+ current
INa(P)persistent Na+ current
INa(T)transient (peak) Na+ current
INa(W)window Na+ current
LCSlacosamide (Vimpat®)
NaV channelvoltage-gated Na+ channel
SEMstandard error of mean
τtime constant
τfastfast time constant
τslowslow time constant
TEAtetraethylammonium chloride
Teftefluthrin
TTXtetrodotoxin
Vrampramp voltage

References

  1. Labau, J.I.R.; Estacion, M.; Tanaka, B.S.; De Greef, B.T.A.; Hoeijmakers, J.G.J.; Geerts, M.; Gerrits, M.M.; Smeets, H.J.M.; Faber, C.G.; Merkies, I.S.J.; et al. Differential effect of lacosamide on Nav1.7 variants from responsive and non-responsive patients with small fibre neuropathy. Brain 2020, 143, 771–782. [Google Scholar] [CrossRef] [PubMed] [Green Version]
  2. Casciato, S.; Quarato, P.P.; Gialluisi, A.; D’Aniello, A.; Mascia, A.; Grammaldo, L.G.; Di Gennaro, G. Lacosamide as first add-on or conversion monotherapy: A retrospective real-life study. Epilepsy Behav. 2021, 122, 108128. [Google Scholar] [CrossRef] [PubMed]
  3. Eilam, A.; Khmeliov, N.; Penker, D.; Gilad, R. Intravenous Lacosamide in Seizure Clusters: Dose and Efficacy. Clin. Neuropharmacol. 2021, 44, 85–88. [Google Scholar] [CrossRef] [PubMed]
  4. Shin, Y.-W.; Moon, J.; Cho, Y.W.; Kim, D.W.; Bin Hong, S.; Kim, D.-Y.; Chang, H.; Yoon, S.H.; Yu, K.-S.; Jang, I.-J.; et al. Tolerability of lacosamide rapid dose titration: A randomized, multicenter, prospective, open-label study. Epilepsy Behav. 2021, 115, 107663. [Google Scholar] [CrossRef] [PubMed]
  5. Muñoz-Vendrell, A.; Teixidor, S.; Sala-Padró, J.; Campoy, S.; Huerta-Villanueva, M. Intravenous lacosamide and phenytoin for the treatment of acute exacerbations of trigeminal neuralgia: A retrospective analysis of 144 cases. Cephalalgia 2022, 42, 3331024221092435. [Google Scholar] [CrossRef] [PubMed]
  6. Scott, L.J. Lacosamide: A Review in Focal Seizures in Patients with Epilepsy. Drugs 2015, 75, 2143–2154. [Google Scholar] [CrossRef] [PubMed]
  7. Wang, Y.; Wilson, S.M.; Brittain, J.M.; Ripsch, M.S.; Salomé, C.; Park, K.D.; White, F.A.; Khanna, R.; Kohn, H. Merging Structural Motifs of Functionalized Amino Acids and α-Aminoamides Results in Novel Anticonvulsant Compounds with Significant Effects on Slow and Fast Inactivation of Voltage-gated Sodium Channels and in the Treatment of Neuropathic Pain. ACS Chem. Neurosci. 2011, 2, 317–322. [Google Scholar] [CrossRef]
  8. Biton, V. Lacosamide for the treatment of diabetic neuropathic pain. Expert Rev. Neurother. 2008, 8, 1649–1660. [Google Scholar] [CrossRef]
  9. McCleane, G. Lacosamide for pain. Expert Opin. Investig. Drugs 2010, 19, 1129–1134. [Google Scholar] [CrossRef] [PubMed]
  10. Hearn, L.; Derry, S.; Moore, R.A. Lacosamide for neuropathic pain and fibromyalgia in adults. Cochrane Database Syst. Rev. 2012, 2012, Cd009318. [Google Scholar] [CrossRef]
  11. Carmland, M.E.; Kreutzfeldt, M.; Holbech, J.V.; Andersen, N.T.; Jensen, T.S.; Bach, F.W.; Sindrup, S.H.; Finnerup, N.B. Effect of lacosamide in peripheral neuropathic pain: Study protocol for a randomized, placebo-controlled, phenotype-stratified trial. Trials 2019, 20, 588. [Google Scholar] [CrossRef] [PubMed] [Green Version]
  12. Adamo, D.; Coppola, N.; Pecoraro, G.; Nicolò, M.; Mignogna, M.D. Lacosamide in trigeminal neuralgia: Report of a case refractory to first- and second-generation anticonvulsants. Cranio 2020, 1–5. [Google Scholar] [CrossRef]
  13. Huang, C.-W.W.; Brown, S.; Pillay, N.; Del Campo, M.; Tellez-Zenteno, J.; McLachlan, R.S. Electroencephalographic and Electrocardiographic Effect of Intravenous Lacosamide in Refractory Focal Epilepsy. J. Clin. Neurophysiol. 2018, 35, 365–369. [Google Scholar] [CrossRef]
  14. Wu, T.; Chuang, Y.C.; Huang, H.C.; Lim, S.N.; Hsieh, P.F.; Lee, W.T.; Cheng, M.-Y.; Tsai, M.-H.; Jou, S.-B.; Chang, C.-W.; et al. A prospective, multicenter, noninterventional study in Taiwan to evaluate the safety and tolerability of lacosamide as adjunctive therapy for epilepsy in clinical practice. Epilepsy Behav. 2020, 113, 107464. [Google Scholar] [CrossRef] [PubMed]
  15. Nortey, J.; Smith, D.; Seitzman, G.D.; Gonzales, J.A. Topical Therapeutic Options in Corneal Neuropathic Pain. Front. Pharmacol. 2021, 12, 769909. [Google Scholar] [CrossRef]
  16. Okanishi, T.; Fujii, Y.; Sakuma, S.; Shiraishi, H.; Motoi, H.; Yazaki, K.; Enoki, H.; Fujimoto, A. Lacosamide monotherapy for the treatment of childhood epilepsy with centrotemporal spikes. Brain Dev. 2022, 44, 380–385. [Google Scholar] [CrossRef]
  17. Panda, P.K.; Sharawat, I.K.; Dawman, L.; Panda, P.; Kasinathan, A.; Rathaur, V.K. Efficacy and Tolerability of Lacosamide in Lennox-Gastaut Syndrome: A Systematic Review and Meta-analysis. J. Neurosci. Rural. Pract. 2022, 13, 32–42. [Google Scholar] [CrossRef]
  18. Pozzi, M.; Zanotta, N.; Epifanio, R.; Baldelli, S.; Cattaneo, D.; Clementi, E.; Zucca, C. Lacosamide effectiveness and tolerability in patients with drug-resistant epilepsy and severe disability under polytherapy: Therapy optimization as emerging from an observational study. Epilepsy Behav. 2022, 128, 108598. [Google Scholar] [CrossRef]
  19. Ragoonanan, D.; Tran, N.; Levesque, M. Safety and Tolerability of Intravenous Push Lacosamide and Levetiracetam. J. Pharm. Pract. 2022, 8971900221087955. [Google Scholar] [CrossRef]
  20. Behr, C.; Lévesque, M.; Ragsdale, D.; Avoli, M. Lacosamide modulates interictal spiking and high-frequency oscillations in a model of mesial temporal lobe epilepsy. Epilepsy Res. 2015, 115, 8–16. [Google Scholar] [CrossRef]
  21. Errington, A.C.; Stohr, T.; Heers, C.; Lees, G. The investigational anticonvulsant lacosamide selectively enhances slow inactivation of voltage-gated sodium channels. Mol. Pharmacol. 2008, 73, 157–169. [Google Scholar] [CrossRef] [PubMed] [Green Version]
  22. Wang, G.K.; Wang, S.-Y. Block of human cardiac sodium channels by lacosamide: Evidence for slow drug binding along the activation pathway. Mol. Pharmacol. 2014, 85, 692–702. [Google Scholar] [CrossRef] [PubMed] [Green Version]
  23. Rogawski, M.A.; Tofighy, A.; White, H.S.; Matagne, A.; Wolff, C. Current understanding of the mechanism of action of the antiepileptic drug lacosamide. Epilepsy Res. 2015, 110, 189–205. [Google Scholar] [CrossRef] [PubMed]
  24. Sumbul, O.; Aygun, H. Electrocorticographic and electrocardiographic evaluation of lacosamide in a penicillin-induced status epilepticus model. Epilepsy Res. 2022, 180, 106866. [Google Scholar] [CrossRef] [PubMed]
  25. Hamard, J.; Rigal, M.; Gony, M.; Bagheri, H. Lacosamide-induced personality changes: An unexpected adverse effect. Fundam. Clin. Pharmacol. 2022, 36, 224–226. [Google Scholar] [CrossRef]
  26. Catterall, W.A.; Goldin, A.L.; Waxman, S.G. International Union of Pharmacology. XLVII. Nomenclature and structure-function relationships of voltage-gated sodium channels. Pharmacol. Rev. 2005, 57, 397–409. [Google Scholar] [CrossRef]
  27. Catterall, W.A.; Lenaeus, M.J.; Gamal El-Din, T.M. Structure and Pharmacology of Voltage-Gated Sodium and Calcium Channels. Annu. Rev. Pharmacol. Toxicol. 2020, 60, 133–154. [Google Scholar] [CrossRef] [Green Version]
  28. Huang, C.-W.; Hung, T.-Y.; Wu, S.-N. The inhibitory actions by lacosamide, a functionalized amino acid, on voltage-gated Na+ currents. Neuroscience 2015, 287, 125–136. [Google Scholar] [CrossRef]
  29. Wu, S.N.; Lo, Y.C.; Shen, A.Y.; Chen, B.S. Contribution of non-inactivating Na+ current induced by oxidizing agents to the firing behavior of neuronal action potentials: Experimental and theoretical studies from NG108-15 neuronal cells. Chin. J. Physiol. 2011, 54, 19–29. [Google Scholar] [CrossRef] [Green Version]
  30. Chang, W.T.; Wu, S.N. Characterization of Direct Perturbations on Voltage-Gated Sodium Current by Esaxerenone, a Nonsteroidal Mineralocorticoid Receptor Blocker. Biomedicines 2021, 9, 549. [Google Scholar] [CrossRef]
  31. Guérineau, N.C.; Monteil, A.; Lory, P. Sodium background currents in endocrine/neuroendocrine cells: Towards unraveling channel identity and contribution in hormone secretion. Front. Neuroendocrinol. 2021, 63, 100947. [Google Scholar] [CrossRef] [PubMed]
  32. Wu, C.L.; Chuang, C.W.; Cho, H.Y.; Chuang, T.H.; Wu, S.N. The Evidence for Effective Inhibition of I(Na) Produced by Mirogabalin ((1R,5S,6S)-6-(aminomethyl)-3-ethyl-bicyclo[3.2.0]hept-3-ene-6-acetic acid), a Known Blocker of Ca(V) Channels. Int. J. Mol. Sci. 2022, 23, 3845. [Google Scholar] [CrossRef] [PubMed]
  33. Morris, C.E.; Boucher, P.A.; Joós, B. Left-shifted nav channels in injured bilayer: Primary targets for neuroprotective nav antagonists? Front. Pharmacol. 2012, 3, 19. [Google Scholar] [CrossRef] [PubMed] [Green Version]
  34. Taddese, A.; Bean, B.P. Subthreshold sodium current from rapidly inactivating sodium channels drives spontaneous firing of tuberomammillary neurons. Neuron 2002, 33, 587–600. [Google Scholar] [CrossRef] [Green Version]
  35. Zhang, X.-Y.; Bi, R.-Y.; Zhang, P.; Gan, Y.-H. Veratridine modifies the gating of human voltage-gated sodium channel Nav1.7. Acta Pharmacol. Sin. 2018, 39, 1716–1724. [Google Scholar] [CrossRef] [PubMed] [Green Version]
  36. Wang, D.W.; Mistry, A.M.; Kahlig, K.M.; Kearney, J.A.; Xiang, J.; George, A.L.J. Propranolol blocks cardiac and neuronal voltage-gated sodium channels. Front. Pharmacol. 2010, 1, 144. [Google Scholar] [CrossRef] [Green Version]
  37. Weiser, T.; Qu, Y.; Catterall, W.A.; Scheuer, T. Differential interaction of R-mexiletine with the local anesthetic receptor site on brain and heart sodium channel alpha-subunits. Mol. Pharmacol. 1999, 56, 1238–1244. [Google Scholar] [CrossRef]
  38. Simasko, S.M. A background sodium conductance is necessary for spontaneous depolarizations in rat pituitary cell line GH3. Am. J. Physiol. 1994, 266 Pt 1, C709–C719. [Google Scholar] [CrossRef] [PubMed]
  39. Wu, S.-N.; Chen, B.-S.; Hsu, T.-I.; Peng, H.; Wu, Y.-H.; Lo, Y.-C. Analytical studies of rapidly inactivating and noninactivating sodium currents in differentiated NG108-15 neuronal cells. J. Theor. Biol. 2009, 259, 828–836. [Google Scholar] [CrossRef] [PubMed]
  40. Carter, B.C.; Bean, B.P. Incomplete inactivation and rapid recovery of voltage-dependent sodium channels during high-frequency firing in cerebellar Purkinje neurons. J. Neurophysiol. 2011, 105, 860–871. [Google Scholar] [CrossRef]
  41. Tsai, D.; Morley, J.W.; Suaning, G.J.; Lovell, N.H. Frequency-dependent reduction of voltage-gated sodium current modulates retinal ganglion cell response rate to electrical stimulation. J. Neural Eng. 2011, 8, 066007. [Google Scholar] [CrossRef] [PubMed]
  42. Ghovanloo, M.-R.; Aimar, K.; Ghadiry-Tavi, R.; Yu, A.; Ruben, P. Physiology and Pathophysiology of Sodium Channel Inactivation. Curr. Top Membr. 2016, 78, 479–509. [Google Scholar] [PubMed]
  43. Navarro, M.A.; Salari, A.; Lin, J.L.; Cowan, L.M.; Penington, N.J.; Milescu, M.; Milescu, L.S. Sodium channels implement a molecular leaky integrator that detects action potentials and regulates neuronal firing. eLife 2020, 9, e54940. [Google Scholar] [CrossRef] [PubMed]
  44. Luna, C.; Mizerska, K.; Quirce, S.; Belmonte, C.; Gallar, J.; Acosta, M.D.C.; Meseguer, V. Sodium channel blockers modulate abnormal activity of regenerating nociceptive corneal nerves after surgical lesion. Investig. Opthalmol. Vis. Sci. 2021, 62, 2. [Google Scholar] [CrossRef]
  45. Sula, A.; Hollingworth, D.; Ng, L.C.; Larmore, M.; DeCaen, P.G.; Wallace, B. A tamoxifen receptor within a voltage-gated sodium channel. Mol. Cell 2021, 81, 1160–1169.e5. [Google Scholar] [CrossRef]
Figure 1. Effects of LCS on voltage-gated Na+ current (INa) in GH3 cells. (A) The top part shows the voltage-clamp protocol. The middle part is the representative current traces obtained in (a, black) the control period (i.e., no LCS) and in 30 μM LCS (b, blue) or 100 μM LCS (c, red). The bottom part represents the expanded record from the purple dashed box. (B) Concentration-dependent relationship of LCS on transient (peak component, open blue squares) and late (sustained component, open red circles) INa evoked by short membrane depolarization (mean ± SEM; n = 8 for each point). The continuous gray line denotes the goodness-of-fit to a modified Hill equation, as stated in Section 4.
Ijms 23 11966 g001
Figure 2. Effect of LCS on INa recorded from Neuro-2a cells. (A) The voltage-clamp protocol was on the top. The middle part was the representative current traces in response to depolarizing command pulses from −100 to −10 mV, a: control (i.e., no LCS, black); b: 30 μM LCS (blue); c: 100 μM LCS (red). The panels on the right side indicate the expanded records (i.e., INa(L) and INa(T)) from each purple dashed box. (B) Dose-dependent relationship of LCS on INa(T) (peak component, blue squares) and INa(L) (sustained component, red circles) evoked by short membrane depolarization from −100 to −10 mV (mean ± SEM; n = 8 for each point). The continuous gray line represents the best fit to a modified Hill equation, as described in Section 4.
Ijms 23 11966 g002
Figure 3. Inhibitory effect of LCS on persistent INa (INa(P)) activated by an isosceles-triangular ramp voltage (Vramp) residing in GH3 cells. (A) The voltage-clamp protocol of Vramp is shown on the top. The blue or red color indicates the current trajectory at the ascending or descending limb of Vramp, respectively. The dashed black arrow in each panel denotes the direction of the INa(P) trajectory by which the time goes during elicitation by such upright isosceles-triangular Vramp. (B) Time course of inhibitory effect of LCS (30 or 100 μM) during double Vramp. Vramp was applied every 4 s, and INa(P) (open square) at −5 mV (ascending limb) or −60 mV (descending limb) was then measured. The horizontal bar shown above indicates the addition of LCS (30 or 100 μM). (C) Summary graphs demonstrating effects of LCS (30 or 100 μM) and LCS (100 μM) plus tefluthrin (Tef, 10 μM) on INa amplitude activated by the upsloping (left, high-threshold INa(P) (at −5 mV)) and downsloping (right, low-threshold INa(P) (at −60 mV)) Vramp (mean ± SEM; n = 8 for each point). * Significantly different from controls (p < 0.05), ** significantly different from LCS (30 μM)-alone group (p < 0.05), and + significantly different from LCS (100 μM)-alone group (p < 0.05).
Ijms 23 11966 g003aIjms 23 11966 g003b
Figure 4. Modification by LCS of instantaneous window INa (INa(W)) evoked in response to short ascending Vramp in Neuro-2a cells. (A) Representative current traces were acquired in the control period (a, black), during cell exposure to 100 μM LCS (b, red) or 300 μM LCS (c, pink), and washout of LCS (d, brown). The voltage protocol is illustrated in the inset, and the downward deflection indicates instantaneous inward current (i.e., INa(W)) elicited by a short ascending Vramp. (B) Summary graph demonstrating attenuating effect of LCS (100 or 300 μM) and LCS (300 μM) plus Tef (10 μM) on the ∆area of INa(W) (mean ± SEM; n = 7 for each point). Each area in this work was measured at the voltages ranging between −40 and +40 mV during the ascending Vramp. * Significantly different from control (p < 0.05), ** significantly different from LCS (100 μM) group (p < 0.05), and + significantly different from LCS (300 μM) group (p < 0.05).
Ijms 23 11966 g004
Figure 5. Effect of LCS on INa(T) activated by a train of depolarizing pulses in GH3 cells. The train consisted of twenty 40 msec pulses (stepped to −10 mV) separated by 10 msec intervals at −80 mV for 1 s. (A) Representative current traces were acquired in the control period ((a), no LCS, black) and during exposure to 30 μM ((b), blue) or 100 μM LCS ((c), red). The top part shows the voltage-clamp protocol applied. The right side of (A) represents the expanded records from the purple dashed box on the left side. (B) The relationship of the amplitude of INa(T) ((a), (left)) or INa(L) ((b), (right)) versus the pulse-train duration in the absence (black circles) and presence of 30 μM LCS (open blue circles) or 100 μM LCS (open red squares) was constructed (mean ± SEM; n = 8 for each point). The INa(T) or INa(L) amplitude was measured at the beginning or end of each depolarizing step, respectively.
Ijms 23 11966 g005aIjms 23 11966 g005b
Figure 6. Effect of LCS on INa(T) during a train of depolarizing pulses in Neuro-2a cells. (A) The top part is the voltage-clamp protocol. Representative current traces during the control period ((a), black) or exposure to 100 μM LCS ((b), red) were presented. (B) The relationship of the relative amplitude of INa(T) versus the pulse duration with (open red circles) or without (blue squares) LCS (100 μM) (mean ± SEM; n = 7 for each point). Each smooth line is well fitted to a single exponential. (C) Summary graph demonstrating the effect of LCS (30 or 100 μM) and LCS (100 μM) plus veratridine (30 μM) on the τ value of INa(T) during repetitive depolarizing pulses (mean ± SEM; n = 7 for each point). * Significantly different from control (p < 0.05), ** significantly different from LCS (30 μM)-alone group (p < 0.05), and + significantly different from LCS (100 μM)-alone group (p < 0.05).
Ijms 23 11966 g006
Figure 7. The recovery of INa inactivation during the train of conditioning depolarizing pulses modified by the presence of LCS. (A) The voltage-clamp protocol is shown on the top. Representative current traces were taken in the control period (middle part) and during exposure to 100 μM LCS (lower part). The right side of (A) denotes the expanded records from the purple dashed box on the left side. (B) The relationship of the relative amplitude of INa(T) versus the interpulse interval was obtained in the absence (blue circles) and presence (open red circles) of 100 μM LCS (mean ± SEM; n = 8 for each point). The blue or red smooth curve taken with or without the application of LCS was least-squares fitted with a two-exponential function, as detailed in Section 4, while the parameters are illustrated in Table 1.
Ijms 23 11966 g007aIjms 23 11966 g007b
Figure 8. Predicted docking results demonstrating an interaction with NaV channel and lacosamide (LCS). The protein structure of the NaV (SCN) channel was acquired from PDB (PDB ID: 6Z8C), while the chemical structure of LCS was from PubChem (Compound CID: 219078). The structure of the NaV channel was docked with the LCS molecule through PyRx (https://pyrx.sourceforge.io/, accessed on 5 June 2022). The diagram of the interaction between NaV and the LCS molecule was generated by LigPlot+ (https://www.ebi.ac.uk/thornton-srv/software/LIGPLOT/, accessed on 15 June 2022). Note that the red arcs with spokes that radiate toward the ligand (i.e., LCS, in the center) represent the hydrophobic contacts.
Ijms 23 11966 g008
Table 1. Summary of data demonstrating the parameter values for the modulatory effect of LCS on the recovery of INa block during the preceding train pulse observed in pituitary GH3 cells. These parameters are elaborated in detail in Section 4.
Nτfast (msec)τslow (msec)AB
Control812.2 ± 0.4885 ± 160.71 ± 0.040.28 ± 0.02
LCS (30 μM)813.6 ± 0.6 *972 ± 17 *0.78 ± 0.04 *0.22 ± 0.02 *
LCS (100 μM)814.1 ± 0.6 *1045 ± 19 *0.81 ± 0.04 *0.18 ± 0.02 *
All values are mean ± SEM. * Significantly different from controls (p < 0.05).
Publisher’s Note: MDPI stays neutral with regard to jurisdictional claims in published maps and institutional affiliations.

