Article

Effect of Pt Decoration on the Optical Properties of Pristine and Defective MoS2: An Ab-Initio Study

by
Juan Manuel Ramírez-de-Arellano
1,*,
Ali Fransuani Jiménez-González
2,
Mónica Canales
1 and
Luis Fernando Magaña
2
1
Tecnologico de Monterrey, Escuela de Ingeniería y Ciencias, Calle del Puente 222, Mexico City 14380, Mexico
2
Instituto de Física, Universidad Nacional Autónoma de México, Apartado Postal 20-364, Mexico City 01000, Mexico
*
Author to whom correspondence should be addressed.
Int. J. Mol. Sci. 2022, 23(19), 11199; https://doi.org/10.3390/ijms231911199
Submission received: 31 August 2022 / Revised: 20 September 2022 / Accepted: 21 September 2022 / Published: 23 September 2022
(This article belongs to the Collection Feature Papers in Materials Science)

Abstract

:
Using structural relaxation calculations and first-principles molecular dynamics (FPMD), we performed numerical simulations to explore the interaction of a 2D MoS2 surface and a platinum atom, calculating the optical properties of the resulting material. We explored three initial positions for the interaction of the Pt atom and the pristine MoS2 surface, plus another position between Pt and the MoS2 surface with a sulfur vacancy VS. The surface absorbed the Pt atom in all cases considered, with absorption energies ranging from −2.77 eV to −5.83 eV. We calculated the optical properties and band structure of the two cases with the largest absorption energies (−3.45 eV and −5.83 eV). The pristine MoS2 is a semiconductor with a gap of around 1.80 eV. With the adsorption of the Pt atom (the −3.45 eV case), the material reduces its band gap to 0.95 eV. Additionally, the optical absorption in the visible range is greatly increased. The energy band structure of the 2D MoS2 with a sulfur vacancy VS shows a band gap of 0.74 eV, with consequent changes in its optical properties. After the adsorption of Pt atoms in the VS vacancy, the material has a band gap of 1.06 eV. In this case, the optical absorption in the visible range increases by about eight times. The reflectivity in the infrared range gets roughly doubled for both situations of the Pt-absorbed atom considered. Finally, we performed two FPMD runs at 300 K to test the stability of the cases with the lowest and highest absorption energies observed, confirming the qualitative results obtained with the structural relaxations.

1. Introduction

Bidimensional materials show different interesting physical properties, making them suitable for many potential applications, including energy storage [1,2,3], biomedical research [4,5,6], field-effect transistors (FETs) [7,8,9,10], as well as sensors and biosensing [11,12]. One of these materials is Molybdenum disulfide, MoS2, a layered dichalcogenide with a hexagonal structure reminiscent of graphene. Like graphene, the bonds between layers are weaker, allowing for a relatively easy dislocation [13,14,15,16]. Monolayer MoS2 is also a direct-gap semiconductor with a band gap of 1.8 eV [17] with potential applications that have been explored in fields as diverse as ultrafast photonics, the treatment of antibiotic-polluted water, drug-delivery purposes, water splitting, and FETs [18,19,20,21,22,23,24].
Studying the band structure and optical properties of such 2D materials helps explore their potential applications. The band structure of MoS2 has been previously explored, including the effect of interlayer pressure [25]. Here, we studied the changes produced in the optical properties of MoS2 when adsorbing Pt. The present work consists of two stages: First we performed static calculations on four cases of interaction (see Section 2.2). Then, in a second stage, we took two cases—the lowest and the highest adsorption energies—and calculated their optical properties and band structure (Section 2.3 onwards). These results were compared with those of the pristine MoS2 surface. Additionally, we performed first principles molecular dynamics (FPMD) calculations at 300 K on two cases to further explore the qualitative behavior that was previously found with the structural relaxations.
In this work we considered pristine MoS2 as well as MoS2 with a sulfur monovacancy (also labeled as Vs) on the unit cell. Vacancies on MoS2 have been previously studied experimentally and by first-principles calculations, finding relatively low formation energies for a Vs vacancy [16,26], which in turn makes it relatively easy to find.

2. Results

2.1. Pristine MoS2 Layer

Figure 1a,b shows the hexagonal unit cell considered. With a cell parameter of 6.3 Å, it contains 12 atoms: eight S atoms and four Mo atoms. We chose the size of the cell to ensure a sufficiently long distance between one element of the system and its repetition in the next cell since the code we used (Quantum ESPRESSO) considers periodic boundary conditions. The unit cell is then large enough to give a sufficiently good amount of information while avoiding spurious interactions. Starting from this cell, we removed one S atom to create a vacancy. After performing a structural relaxation on the pristine MoS2, we calculated its projected density of states (PDOS) [27], obtaining a gap of 1.8 eV (see Figure 1c), which is in agreement with previously reported works [25]. Below the Fermi level, there is a hybridization of orbitals p and d from molybdenum with orbitals s and p from sulfur. Above 2 eV, there is a hybridization of the same orbitals, but the contribution of orbital p from Mo is negligible.

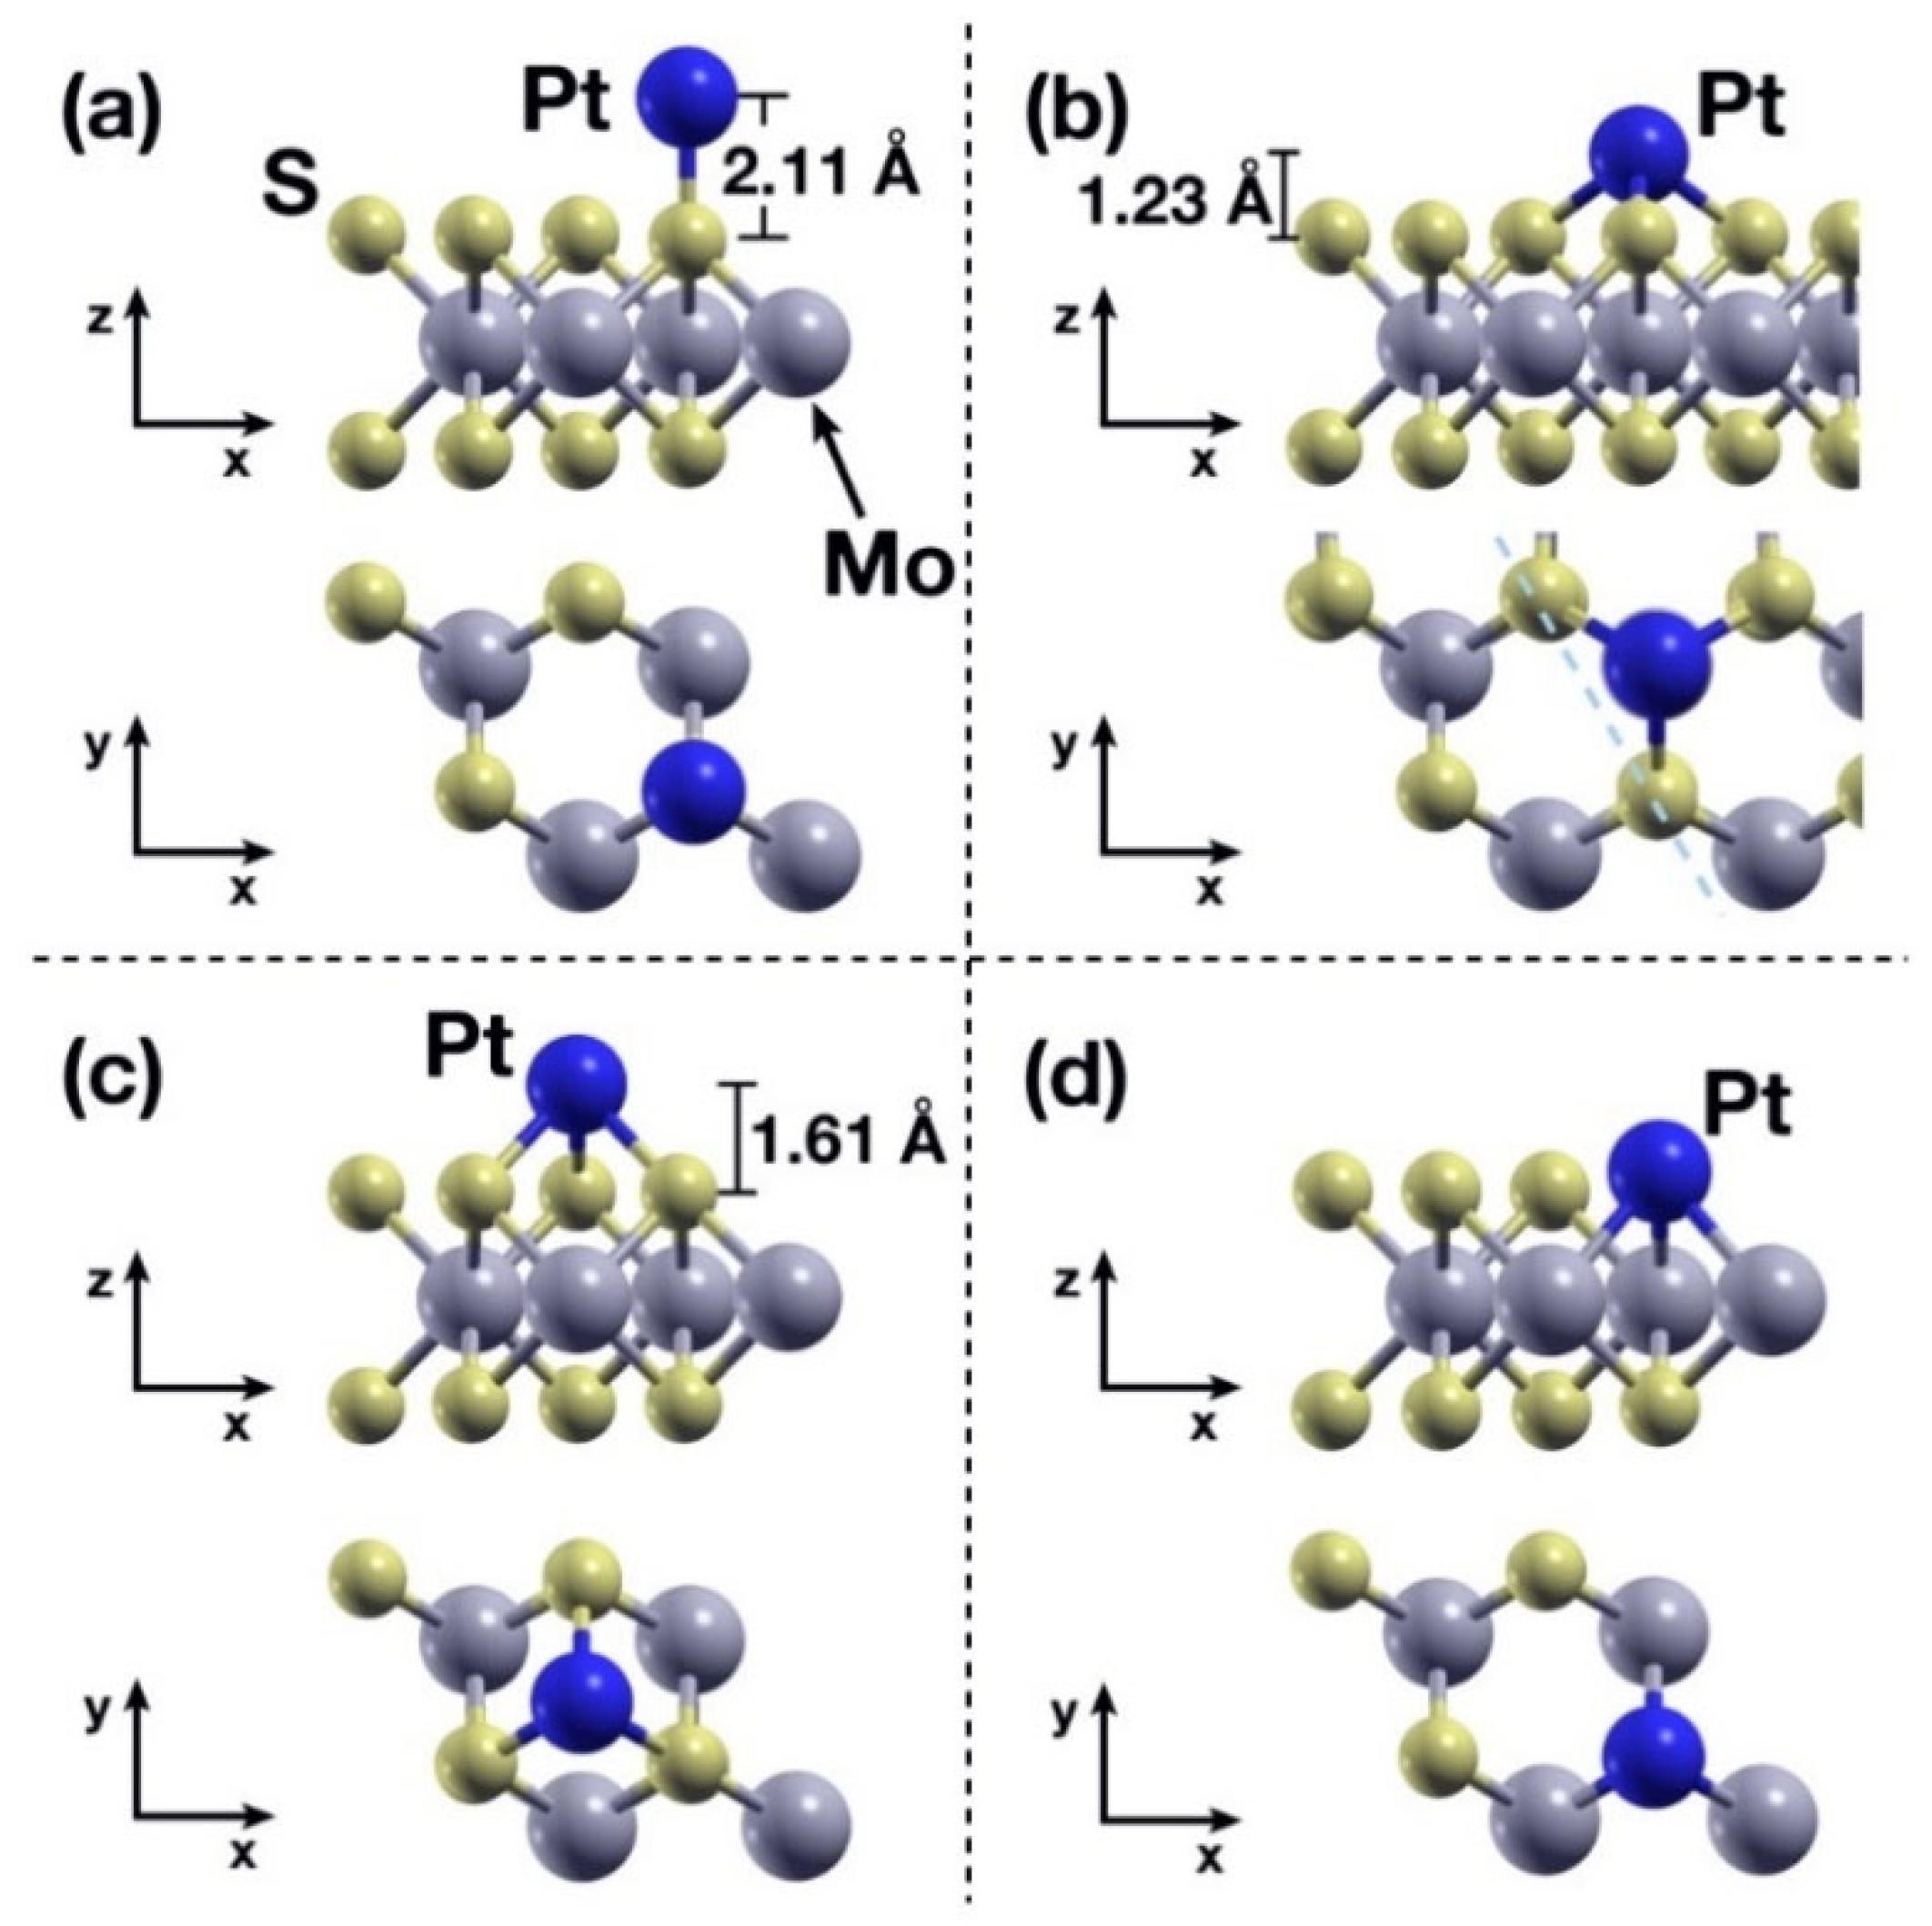
2.2. Static Calculations: Pt-Absorption on the MoS2 Layer

We considered four initial configurations for the interaction between the Pt atom and the MoS2 surface, as shown in Figure 2. The Pt atom was placed in the following initial positions: Directly above an S atom (Figure 2a); directly above the bonding line between two adjacent S atoms (Figure 2b); above the center of the triangle formed by three adjacent S atoms (Figure 2c); and above a VS vacancy (Figure 2d). In the last case, the system was previously relaxed structurally so the VS vacancy would be properly taken into account. In all cases, the initial vertical distance between the Pt atom and the superior plane of S atoms was 3 Å.
Figure 3 shows the final configurations of the corresponding cases from Figure 2, while Table 1 shows the absorption energies for each case, obtained according to Equation (5), Section 4. In case (b), the Pt atom displaces horizontally as well, ending up directly above the closest Mo atom (Figure 3b). In Figure 3b, we included part of the repeated cell—due to the use of periodic boundary conditions—to show that the Pt atom is anchored by the closest three S atoms and the Mo atom directly below it, resulting in this case being the second strongest of the four considered. Case (d)—the Pt atom being absorbed in the VS site—is the one with the strongest chemisorption interaction (Figure 3d).

2.3. PDOS for the Pristine and Defective MoS2 Surfaces + Pt

Of the four cases considered above, we calculated the PDOS, band structures and optical properties for cases (b) and (d) from Figure 2 and Figure 3, as they were the ones with the strongest interactions. We took only these two cases to keep this work from being unnecessarily large, while still being able to extract significant conclusions from the results. In particular, the largest absorption energy of case (b)—when compared with the other two cases (a and c) involving a Pt atom and the pristine surface—would also make it the most stable and likely among cases a, b and c.
Figure 4 (top) shows the PDOS of the resulting optimized configuration (See Figure 3b). The effect of the absorbed Pt atom is a reduction of the band gap, which for this case was found to be 0.95 eV. Between −7.0 and 0 eV, there is a strong hybridization between the Mo 4d orbital, the Pt 5d orbital and the S 3s and 3p orbitals. A weaker hybridization with the 4p Mo orbital is also present. Between 1.0 and 3.5 eV there is a strong hybridization as well, this time between the Mo 4d orbital, the S 3s and 3p orbitals, and the Pt 6s orbital.
Figure 4 (bottom) shows the PDOS for case (d), in which the Pt atom is absorbed on the VS site of the MoS2 + VS system. The band gap reduction—from 1.8 eV to 1.06 eV—is not as big as in case (b), when compared to the pristine MoS2 surface. The orbitals hybridization is overall similar to the previous case.

2.4. Band Structures of the Pristine and Defective MoS2 Surfaces + Pt

Using the final relaxed configurations of the pristine case plus the cases considered in Section 2.2 and Section 2.3, as well as the MoS2 + VS surface alone, we calculated the energy band structure of each case. In Figure 5, showing the results, the Fermi energy is normalized at zero.
The proposed manipulation of the MoS2 surface causes an overall reduction in the band gap related to the pristine surface. The pristine surface is a semiconductor with a band gap of 1.8 eV, as expected. The adsorption of a Pt atom on the pristine MoS2 (case (b)) does not change that property, but it reduces the band gap to 0.95 eV. Interestingly, the addition of a VS vacancy induces a further reduction in the band gap, down to 0.74 eV. But this change gets overturned by the adsorption of a Pt atom on the VS site, and the band gap gets increased to 1.06 eV. The changes in the band structure implied substantial changes in the optical properties of the surface, as shown in the next section.

2.5. Optical Properties

For the cases considered from Section 2.2 onwards, we calculated the optical absorption spectra in the infrared (IR), visible (VIS), and ultraviolet (UV) range along the Z-axis (see Figure 6). Figure 7 shows the reflectivity.
The optical absorption in the infrared region has its most significant values for the surface of Pt adsorbed on pristine MoS2 and the smallest for MoS2 with a vacancy. We have the same behavior in the visible range, except for the interval between 2.90 eV and 3.25 eV, where the smallest values correspond to MoS2 with a vacancy. In the ultraviolet region, Pt on the pristine MoS2 has the most significant absorption, keeping the overall shape related to pristine MoS2 with about the same positions for peaks and valleys. In this case, the absorption between 6.00 eV and 7.00 eV is approximately 46% larger compared to the pristine surface.
In the case of reflectivity, the most substantial change related to pristine MoS2 is between 0 eV and 5.00 eV and comes from the Pt adsorbed on non-defective MoS2. In the same region, the smallest values correspond to MoS2 with a vacancy. The most considerable value for reflectivity is for Pt adsorbed on defective MoS2, which occurs around 8.6 eV (see Figure 7).

2.6. FPMD Calculation for the Weakest and Strongest Interactions

Finally, to explore the stability of the combined systems in real-life situations, we used first principles molecular dynamics calculations (see the Materials and Methods section for more details on the FPMD calculation). We chose the weakest and strongest interaction energies—cases (a) and (d) from Figure 2 and Figure 3—for an FPMD calculation at 300 K. Figure 8 shows the initial and final configurations of said cases, along with an energy evolution plot. In both cases, the initial configuration was the same as that considered in the structural relaxations.
The ab initio molecular dynamics calculation at 300 K showed fundamentally the same qualitative behavior, with the MoS2 surface absorbing the Pt atom. Figure 8I shows the initial and final positions of the Pt atom during the adsorption process on the pristine MoS2 layer (case b), along with the energy evolution of the system during the 3561-iterations FPMD calculation.
Figure 8II shows a similar plot for the FPMD calculation of the Pt interacting with the MoS2 + VS system. Again, the qualitative behavior of the system is the same as that of Section 2.2. The FPMD run consisted of 2800 iterations and the Pt atom is absorbed in the VS site rather early in the calculation.

3. Discussion

We performed static calculations and then FPMD simulations to investigate the Pt adsorption effect on the optical properties of 2D MoS2. We considered pristine and defective MoS2 at 300 K and atmospheric pressure. The initial static calculations show that the strongest interaction (chemisorption) occurs when the Pt atom is absorbed at a VS site of the surface, with an absorption energy of −5.83 eV. When a pristine MoS2 surface is considered, the strongest interaction occurs when the Pt atom is initially placed above an SS bond line, with it ending up being absorbed above the closest Mo atom.
The inclusion of either the Pt atom or a VS vacancy on the MoS2 surface results in an overall reduction of its band gap. The initial pristine surface is found to be a semiconductor with a band gap of 1.8 eV, which agrees with previous works. The adsorption of a Pt atom (case b) reduces the band gap to 0.95 eV. Including a VS vacancy reduces the band gap to 0.74 eV, as seen from the band structure diagram (Figure 5). However, the subsequent adsorption of a Pt atom on the VS site (case d) again increases the band gap to a value of 1.06 eV. The changes in the band structure implied substantial changes in the optical properties of the surface. It remains a point of interest to use the Kubelka–Munk function relation along with its Tauc plot [29] to confirm the band-gap values obtained, considering that the method is robust mainly for polycrystalline semiconductors [30].
Regarding previous experimental and theoretical results on the interaction between Pt and MoS2, it is known that Pt atoms are more likely to occupy sites on a tubular MoS2 structure rather than on a planar one [31]. On the planar 2D MoS2, the Pt atoms tend to cluster. Thus, the Pt decoration for photocatalysis or gas sensors on 2D MoS2 involves Pt nanoparticles [32,33,34,35] instead of single Pt atoms. Our results may explain this fact. The cohesive energy of Pt is 5.84 eV/atom [36], while we obtained an adsorption energy of 3.45 eV for a Pt atom on the pristine 2D MoS2 surface. It can be inferred then that the Pt atoms will tend to cluster instead of being adsorbed on the surface. Furthermore, we found that the adsorption energy of a Pt atom on a VS vacancy (5.83 eV) is strikingly close to the Pt cohesive energy. In this way, a 2D MoS2 surface with VS vacancies could likely absorb a single Pt atom on the vacancy.
A question arises about the possibility of plasmons causing an enhanced Pt decoration on the MoS2 surface, as plasmons are present in metallic systems. When MoS2 is decorated with Pt nanoparticles—which are small metallic particles—we would have plasmons on those particles. But in the system considered in this work, we included a Pt atom, not metallic nanoparticles decorating the surface. Thus, we don’t expect to have plasmons.
The vacancy we are considering in our unit cell is equivalent to a 12.5% vacancy density on the surface. For future works it is of interest to explore the effects that varying the vacancy density could have on the MoS2 properties and on its interaction with Pt.
The optical absorption in the infrared region has its most significant values for the surface of Pt adsorbed on pristine MoS2 (case b) and the smallest for MoS2 with a vacancy. We have the same behavior in the visible range, except for the interval between 2.90 eV and 3.25 eV, where the smallest values correspond to MoS2 with a vacancy. In the ultraviolet region, Pt on the pristine MoS2 has the most significant absorption, keeping the overall shape related to pristine MoS2 with about the same positions for peaks and valleys. In this case, the absorption between 6.0 eV and 7.0 eV is approximately 46% larger compared to the clean material.
For the reflectivity, the most substantial change related to pristine MoS2 is between 0 eV and 5.00 eV and comes from the Pt adsorbed on non-defective MoS2. In the same region, the smallest values correspond to MoS2 with a vacancy. The maximum reflectivity is for Pt adsorbed on defective MoS2, which occurs at around 8.60 eV.
Understanding the optical properties of MoS2—and the effect that vacancies alone and in combination with the Pt decoration have on them—is essential, as it could be helpful in the developing of FETs-related technologies. The modulation of the band structure and its related optical properties found in this work could be extended to other surfaces of the transition metal dichalcogenides such as tungsten disulfide or WS2. This material has a similar 2H phase structure and a direct band gap as MoS2 [16,37], but more research is needed on it to explore the transferability of these results to it and to other 2D materials of the same family.
For future research we are exploring the potential of these combined systems in sensor technologies, particularly for pollutant molecule sensing devices.

4. Materials and Methods

All ab initio calculations in this work were made using the Quantum ESPRESSO code [38,39] within the Density Functional Theory (DFT), the pseudopotential formalism, and the projector-augmented wave (PAW) method [40]. All the calculations were non-relativistic, non-spin polarized, with cut-off energy of 80 Ry (1088 eV), and threshold energy for convergence of 1.0 × 10⁻⁶ eV. This code suite considers periodic boundary conditions and plane-wave expansions. For the static calculations we considered an 8 × 8 × 2 k-mesh grid, using the PBE XC functional expression [41] and the semiempirical Grimme’s DFT-D3 Van der Waals correction [42]. The terms “structural relaxations” and “static calculations” are used indistinctly in this work and correspond to the calculation option ‘relax’ in the Quantum ESPRESSO input file.
Additionally, we considered Born-Oppenheimer first principles molecular dynamics (FPMD) as implemented by Quantum ESPRESSO. FPMD is the method chosen whenever bonds may be broken or formed, or in the presence of complex bonding as in transition metals, which is the case here. We were also interested in considering the effect of vibrations, rotations, velocities, and interactions for all particles of our system, and FPMD allows us to do that. Due to its nature, large and “chemically complex” systems can be better handled by FPMD methods [27,43,44,45]. The FPMD calculations considered a 551 k-points mesh within the Monkhorst–Pack special k-point scheme [46], which is the same scheme considered in the static calculations. Stochastic velocity rescaling is used to control the temperature of 300 K considered in this work. For the time step, we used the default value of 20.0 a.u. in Rydberg atomic units (not Hartree atomic units), where 1 a.u.= 4.8378 × 10⁻¹⁷ s = 0.048378 fs. This is equivalent to a time step of 0.96756 ≈ 1 fs. The convergence parameter considered for the MD calculations was set as 1.0 × 10⁻⁴ eV.
The valence electronic states considered are, for hydrogen: 1s, for molybdenum: 4d5 5s1, for sulfur: 3s2 3p4, for platinum: 5d9 6s1. As a previous step to calculate the PDOS using the projwfc.x program of Quantum ESPRESSO, we performed geometrical optimizations with an 882 k-points mesh. XCrySDen software was used for visualization purposes [47].
We calculated the energy band structure to obtain the imaginary part of the dielectric tensor. We used the Kramers-Kronig relations [48] to obtain the real part, following the procedure explained in more detail in a previous work [49]. We obtained the reflectivity and the optical absorption by considering the two components of the tensor, using the following equations (where n is the refractive index and k is the extinction coefficient):
R i i ( ω ) = ( n 1 ) 2 + k 2 ( n + 1 ) 2 + k 2
A i i ( ω ) = 2 ω k ( ω ) c
where
n i i = | ε i i ( ω ) | + Re ε i i ( ω ) 2  
k i i ( ω ) = | ε i i ( ω ) |   Re ε i i ( ω ) 2
We calculated the adsorption energy for all static calculation cases, using the following formula [28]:
E adsorption = E system   1 + system   2 E system   1 E system   2
Each term of the right side in Equation (5) is taken from the converged structural relaxation calculation of the corresponding system.

Author Contributions

Conceptualization, J.M.R.-d.-A. and L.F.M.; Data curation, J.M.R.-d.-A., M.C. and A.F.J.-G.; Formal analysis, J.M.R.-d.-A. and L.F.M.; Funding acquisition, J.M.R.-d.-A. and L.F.M.; Investigation, J.M.R.-d.-A., M.C., A.F.J.-G. and L.F.M.; Methodology, J.M.R.-d.-A., A.F.J.-G. and L.F.M.; Project administration, J.M.R.-d.-A. and L.F.M.; Resources, L.F.M.; Validation, J.M.R.-d.-A., M.C., A.F.J.-G. and L.F.M.; Writing—original draft, J.M.R.-d.-A. and L.F.M.; Writing—review and editing, J.M.R.-d.-A. and L.F.M. All authors have read and agreed to the published version of the manuscript.

Funding

This research was funded by Dirección General de Asuntos del Personal Académico de la Universidad Nacional Autónoma de México, grant number IN113220. The APC was funded by Tecnologico de Monterrey.

Institutional Review Board Statement

Not applicable.

Informed Consent Statement

Not applicable.

Acknowledgments

We thank Dirección General de Asuntos del Personal Académico de la Universidad Nacional Autónoma de México for their partial financial support by Grant IN113220. We also give thanks for UNAM-Miztli-Super-Computing Center’s technical assistance by the project LANCAD-UNAM-DGTIC-030. J.M.R.-d.-A. would like to thank Rolando Pérez Álvarez (UAEM) and Ernesto Manuel Hernández Cooper (Tecnologico de Monterrey) for their valuable comments regarding this work.

Conflicts of Interest

The authors declare no conflict of interest.

References

  1. Arellano, L.G.; De Santiago, F.; Miranda, Á.; Pérez, L.A.; Salazar, F.; Trejo, A.; Nakamura, J.; Cruz-Irisson, M. Ab Initio Study of Hydrogen Storage on Metal-Decorated GeC Monolayers. Int. J. Hydrogen Energy 2021, 46, 29261–29271. [Google Scholar] [CrossRef]
  2. Reddy, A.L.M.; Srivastava, A.; Gowda, S.R.; Gullapalli, H.; Dubey, M.; Ajayan, P.M. Synthesis Of Nitrogen-Doped Graphene Films For Lithium Battery Application. ACS Nano 2010, 4, 6337–6342. [Google Scholar] [CrossRef] [PubMed]
  3. Moschetto, S.; Bolognesi, M.; Prescimone, F.; Brucale, M.; Mezzi, A.; Ortolani, L.; Caporali, M.; Pingue, P.; Serrano-Ruiz, M.; Pisignano, D.; et al. Large-Area Oxidized Phosphorene Nanoflakes Obtained by Electrospray for Energy-Harvesting Applications. ACS Appl. Nano Mater. 2021, 4, 3476–3485. [Google Scholar] [CrossRef]
  4. Palmieri, V.; Perini, G.; De Spirito, M.; Papi, M. Graphene Oxide Touches Blood: In Vivo Interactions of Bio-Coronated 2D Materials. Nanoscale Horiz. 2019, 4, 273–290. [Google Scholar] [CrossRef]
  5. Donskyi, I.S.; Chen, Y.; Nickl, P.; Guday, G.; Qiao, H.; Achazi, K.; Lippitz, A.; Unger, W.E.S.; Böttcher, C.; Chen, W.; et al. Self-Degrading Graphene Sheets for Tumor Therapy. Nanoscale 2020, 12, 14222–14229. [Google Scholar] [CrossRef] [PubMed]
  6. Borandeh, S.; Alimardani, V.; Abolmaali, S.S.; Seppälä, J. Graphene Family Nanomaterials in Ocular Applications: Physicochemical Properties and Toxicity. Chem. Res. Toxicol. 2021, 34, 1386–1402. [Google Scholar] [CrossRef] [PubMed]
  7. Chang, P.; Liu, X.; Liu, F.; Du, G. First-Principles Based Ballistic Transport Simulation of Monolayer and Few-Layer InSe FETs. Jpn. J. Appl. Phys. 2019, 58, SBBA02. [Google Scholar] [CrossRef]
  8. Gonzalez-Medina, J.M.; Ruiz, F.G.; Marin, E.G.; Godoy, A.; Gámiz, F. Simulation Study of the Electron Mobility in Few-Layer MoS2 Metal–Insulator-Semiconductor Field-Effect Transistors. Solid-State Electron. 2015, 114, 30–34. [Google Scholar] [CrossRef]
  9. Wang, C.; Peng, L.; Wells, S.A.; Cain, J.D.; Huang, Y.-K.; Rhoads, L.A.; Dravid, V.P.; Hersam, M.C.; Grayson, M.A. Field-Effect Conductivity Scaling for Two-Dimensional Materials with Tunable Impurity Density. 2D Mater. 2022, 9, 031002. [Google Scholar] [CrossRef]
  10. Wu, H.; Cui, Y.; Xu, J.; Yan, Z.; Xie, Z.; Hu, Y.; Zhu, S. Multifunctional Half-Floating-Gate Field-Effect Transistor Based on MoS 2 –BN–Graphene van Der Waals Heterostructures. Nano Lett. 2022, 22, 2328–2333. [Google Scholar] [CrossRef]
  11. Sosa, A.N.; Cid, B.J.; Hernández-Hernández, I.J.; Miranda, Á. Effects of Substitutional Doping and Vacancy Formation on the Structural and Electronic Properties of Siligene: A DFT Study. Mater. Lett. 2022, 307, 130993. [Google Scholar] [CrossRef]
  12. Pessanha, T.M.; Paschoalino, W.J.; Deroco, P.B.; Kogikoski, S.; De Moraes, A.C.M.; Carvalho Castro Silva, C.; Kubota, L.T. Interfacial Capacitance of Graphene Oxide Films Electrodes: Fundamental Studies on Electrolytes Interface Aiming (Bio)Sensing Applications. Electroanalysis 2022, 34, 692–700. [Google Scholar] [CrossRef]
  13. Dickinson, R.G.; Pauling, L. The Crystal Structure of Molybdenite. J. Am. Chem. Soc. 1923, 45, 1466–1471. [Google Scholar] [CrossRef]
  14. Schönfeld, B.; Huang, J.J.; Moss, S.C. Anisotropic mean-square displacements (MSD) in single-crystals of 2H-and 3R-MoS2. Acta Crystallogr. Sect. B Struct. Sci. 1983, 39, 404–407. [Google Scholar] [CrossRef]
  15. Gupta, A.; Sakthivel, T.; Seal, S. Recent Development in 2D Materials beyond Graphene. Prog. Mater. Sci. 2015, 73, 44–126. [Google Scholar] [CrossRef]
  16. Xiong, Z.; Zhong, L.; Wang, H.; Li, X. Structural Defects, Mechanical Behaviors, and Properties of Two-Dimensional Materials. Materials 2021, 14, 1192. [Google Scholar] [CrossRef]
  17. Mak, K.F.; Lee, C.; Hone, J.; Shan, J.; Heinz, T.F. Atomically Thin MoS2: A New Direct-Gap Semiconductor. Phys. Rev. Lett. 2010, 105, 136805. [Google Scholar] [CrossRef]
  18. Zhang, H.; Lu, S.B.; Zheng, J.; Du, J.; Wen, S.C.; Tang, D.Y.; Loh, K.P. Molybdenum Disulfide (MoS_2) as a Broadband Saturable Absorber for Ultra-Fast Photonics. Opt. Express 2014, 22, 7249. [Google Scholar] [CrossRef]
  19. Yin, W.; Yan, L.; Yu, J.; Tian, G.; Zhou, L.; Zheng, X.; Zhang, X.; Yong, Y.; Li, J.; Gu, Z.; et al. High-Throughput Synthesis of Single-Layer MoS2 Nanosheets as a Near-Infrared Photothermal-Triggered Drug Delivery for Effective Cancer Therapy. ACS Nano 2014, 8, 6922–6933. [Google Scholar] [CrossRef]
  20. Liang, W.; Luo, X. Theoretical Studies of MoS 2 and Phosphorene Drug Delivery for Antituberculosis Drugs. J. Phys. Chem. C 2020, 124, 8279–8287. [Google Scholar] [CrossRef]
  21. Wang, J.; Wang, Z.; Cheng, Y.; Cao, L.; Bai, F.; Yue, S.; Xie, P.; Ma, J. Molybdenum Disulfide (MoS2): A Novel Activator of Peracetic Acid for the Degradation of Sulfonamide Antibiotics. Water Res. 2021, 201, 117291. [Google Scholar] [CrossRef] [PubMed]
  22. Liao, L.; Yang, L.; Zhao, G.; Zhou, H.; Cai, F.; Li, Y.; Wang, X.; Yu, F. Boosting pH-Universal Hydrogen Evolution of Molybdenum Disulfide Particles by Interfacial Engineering . Chin. J. Chem. 2021, 39, 288–294. [Google Scholar] [CrossRef]
  23. Liaqat, A.; Yin, Y.; Hussain, S.; Wen, W.; Wu, J.; Guo, Y.; Dang, C.; Ho, C.-H.; Liu, Z.; Yu, P.; et al. An All Two-Dimensional Vertical Heterostructure Graphene/CuInP2S6/MoS2 for Negative Capacitance Field Effect Transistor. Nanotechnology 2022, 33, 125703. [Google Scholar] [CrossRef] [PubMed]
  24. Vatalaro, M.; De Rose, R.; Lanuzza, M.; Magnone, P.; Conti, S.; Iannaccone, G.; Crupi, F. Assessment of Paper-Based MoS2 FET for Physically Unclonable Functions. Solid-State Electron. 2022, 194, 108391. [Google Scholar] [CrossRef]
  25. Espejo, C.; Rangel, T.; Romero, A.H.; Gonze, X.; Rignanese, G.-M. Band Structure Tunability in MoS 2 under Interlayer Compression: A DFT and GW Study. Phys. Rev. B 2013, 87, 245114. [Google Scholar] [CrossRef]
  26. Zhou, W.; Zou, X.; Najmaei, S.; Liu, Z.; Shi, Y.; Kong, J.; Lou, J.; Ajayan, P.M.; Yakobson, B.I.; Idrobo, J.-C. Intrinsic Structural Defects in Monolayer Molybdenum Disulfide. Nano Lett. 2013, 13, 2615–2622. [Google Scholar] [CrossRef]
  27. Lee, J.G. Computational Materials Science: An Introduction, 2nd ed.; CRC Press, Taylor & Francis Group: Boca Raton, FL, USA, 2017; ISBN 978-1-4987-4973-2. [Google Scholar]
  28. Oura, K. (Ed.) Surface Science: An Introduction; Advanced Texts in Physics; Springer: Berlin, Germany; New York, NY, USA, 2003; ISBN 978-3-540-00545-2. [Google Scholar]
  29. Patel, M.; Chavda, A.; Mukhopadhyay, I.; Kim, J.; Ray, A. Nanostructured SnS with Inherent Anisotropic Optical Properties for High Photoactivity. Nanoscale 2016, 8, 2293–2303. [Google Scholar] [CrossRef]
  30. Viezbicke, B.D.; Patel, S.; Davis, B.E.; Birnie, D.P. Evaluation of the Tauc Method for Optical Absorption Edge Determination: ZnO Thin Films as a Model System: Tauc Method for Optical Absorption Edge Determination. Phys. Status Solidi 2015, 252, 1700–1710. [Google Scholar] [CrossRef]
  31. Jiao, S.; Kong, M.; Hu, Z.; Zhou, S.; Xu, X.; Liu, L. Pt Atom on the Wall of Atomic Layer Deposition (ALD)-Made MoS 2 Nanotubes for Efficient Hydrogen Evolution. Small 2022, 18, 2105129. [Google Scholar] [CrossRef]
  32. Park, J.; Mun, J.; Shin, J.-S.; Kang, S.-W. Highly Sensitive Two-Dimensional MoS 2 Gas Sensor Decorated with Pt Nanoparticles. R. Soc. Open Sci. 2018, 5, 181462. [Google Scholar] [CrossRef] [Green Version]
  33. Liao, Y.; Zhang, C.; Ji, J.; Jin, P.; Zhou, X. Facile, Rapid, and Well-Controlled Preparation of Pt Nanoparticles Decorated on Single Surface of Mos 2 Nanosheets and Application in HER. ChemNanoMat 2020, 6, 435–441. [Google Scholar] [CrossRef]
  34. Ren, W.; Zhang, H.; Cheng, C. Ultrafine Pt Nanoparticles Decorated MoS 2 Nanosheets with Significantly Improved Hydrogen Evolution Activity. Electrochim. Acta 2017, 241, 316–322. [Google Scholar] [CrossRef]
  35. Burman, D.; Santra, S.; Pramanik, P.; Guha, P.K. Pt Decorated MoS 2 Nanoflakes for Ultrasensitive Resistive Humidity Sensor. Nanotechnology 2018, 29, 115504. [Google Scholar] [CrossRef] [PubMed]
  36. Kittel, C. Chapter 3: Crystal Binding and Elastic Constants. In Introduction to Solid State Physics; Wiley: Hoboken, NJ, USA, 2005; p. 50. ISBN 978-0-471-41526-8. [Google Scholar]
  37. Yang, Y.; Zhang, Y.; Ye, H.; Yu, Z.; Liu, Y.; Su, B.; Xu, W. Structural and Electronic Properties of 2H Phase Janus Transition Metal Dichalcogenide Bilayers. Superlattices Microstruct. 2019, 131, 8–14. [Google Scholar] [CrossRef]
  38. Giannozzi, P.; Baroni, S.; Bonini, N.; Calandra, M.; Car, R.; Cavazzoni, C.; Ceresoli, D.; Chiarotti, G.L.; Cococcioni, M.; Dabo, I.; et al. Quantum Espresso: A Modular and Open-Source Software Project for Quantum Simulations of Materials. J. Phys. Condens. Matter 2009, 21, 395502. [Google Scholar] [CrossRef] [PubMed]
  39. Giannozzi, P.; Andreussi, O.; Brumme, T.; Bunau, O.; Buongiorno Nardelli, M.; Calandra, M.; Car, R.; Cavazzoni, C.; Ceresoli, D.; Cococcioni, M.; et al. Advanced Capabilities for Materials Modelling with Quantum ESPRESSO. J. Phys. Condens. Matter 2017, 29, 465901. [Google Scholar] [CrossRef]
  40. Blöchl, P.E. Projector Augmented-Wave Method. Phys. Rev. B 1994, 50, 17953–17979. [Google Scholar] [CrossRef]
  41. Perdew, J.P.; Burke, K.; Ernzerhof, M. Generalized Gradient Approximation Made Simple. Phys. Rev. Lett. 1996, 77, 3865, Erratum in Phys. Rev. Lett. 1997, 78, 1396–1396. [Google Scholar] [CrossRef]
  42. Grimme, S.; Antony, J.; Ehrlich, S.; Krieg, H. A Consistent and Accurate Ab Initio Parametrization of Density Functional Dispersion Correction (DFT-D) for the 94 Elements H-Pu. J. Chem. Phys. 2010, 132, 154104. [Google Scholar] [CrossRef]
  43. Frenkel, D.; Smit, B. Understanding Molecular Simulation: From Algorithms to Applications, 2nd ed.; Computational science series; Academic Press: San Diego, CA, USA, 2002; ISBN 978-0-12-267351-1. [Google Scholar]
  44. Marx, D.; Hutter, J. Ab Initio Molecular Dynamics: Theory and Implementation. In Modern Methods and Algorithms of Quantum Chemistry, Proceedings; Grotendorst, J., Ed.; NIC Series; John von Neumann Institute for Computing: Jülich, Germany, 2000; Volume 3, pp. 329–477. ISBN 3-00-005834-6. [Google Scholar]
  45. Marx, D.; Hutter, J. Ab Initio Molecular Dynamics: Basic Theory and Advanced Methods, 1st ed.; Cambridge University Press: Cambridge, UK, 2012; ISBN 978-1-107-66353-4. [Google Scholar]
  46. Monkhorst, H.J.; Pack, J.D. Special Points for Brillouin-Zone Integrations. Phys. Rev. B 1976, 13, 5188–5192. [Google Scholar] [CrossRef]
  47. Kokalj, A. XCrySDen—A New Program for Displaying Crystalline Structures and Electron Densities. J. Mol. Graph. Model. 1999, 17, 176–179. [Google Scholar] [CrossRef]
  48. Lucarini, V. (Ed.) Kramers-Kronig Relations in Optical Materials Research; Springer Series in Optical Sciences; Springer: Berlin, Germany; New York, NY, USA, 2005; ISBN 978-3-540-23673-3. [Google Scholar]
  49. Jiménez-González, A.F.; Ramírez-de-Arellano, J.M.; Magaña, L.F. Substantial Variations in the Optical Absorption and Reflectivity of Graphene When the Concentrations of Vacancies and Doping with Fluorine, Nitrogen, and Oxygen Change. Int. J. Mol. Sci. 2021, 22, 6832. [Google Scholar] [CrossRef] [PubMed]
Figure 1. (a) XY-plane view of the unit cell considered for the pristine MoS2. It contains 12 atoms: four Mo and eight S atoms. The cell parameter is 6.3 Å. (b) XZ-plane view of the unit cell. (c) The PDOS for the pristine MoS2, showing a gap of 1.8 eV.
Ijms 23 11199 g001
Figure 2. Initial configurations considered for the static calculations. The Pt atom is placed (a) above an S atom; (b) at the midpoint above the line between two adjacent S atoms; (c) above the center of the triangle formed by three adjacent S atoms; (d) Above a previously introduced VS vacancy. In all cases, the vertical distance between the Pt atom and the plane of S atoms was 3 Å.
Ijms 23 11199 g002
Figure 3. Final configurations considered for the static calculations of Section 2.2. The Pt atom is initially placed (a) above an S atom; (b) at the midpoint above the line between two adjacent S atoms; (c) above the center of the triangle formed by three adjacent S atoms; (d) Above a previously introduced VS vacancy. In the four cases the absorption energies can be catalogued as chemisorption [28], with the largest energy being that of case (d): The Pt atom is absorbed by the surface at the VS vacancy site. See also Table 1.
Ijms 23 11199 g003
Figure 4. (Top) The PDOS of the pristine MoS2 interacting with a Pt atom, corresponding to case (b) in Figure 2 and Figure 3. Here, the Pt atom was initially placed above an S-S bond. The band gap is reduced to 0.95 eV in this case. (Bottom) The PDOS of the MoS2 + VS system after interacting with a Pt atom, corresponding to case (d) in Figure 2 and Figure 3. The Pt atom was initially placed above the VS vacancy, this being the strongest interaction among the cases considered. The band gap is 1.06 eV in this case.
Ijms 23 11199 g004
Figure 5. The energy band structure calculations for the pristine MoS2, the same system with an adsorbed Pt atom, the surface with vacancies, and the latter with an adsorbed Pt atom. The Fermi energy is normalized at 0 eV. The band gaps are1.8 eV, 0.95 eV, 0.74 eV and 1.06 eV, respectively.
Ijms 23 11199 g005
Figure 6. Absorption spectra in the infrared (left), visible (center), and UV (right) ranges, along the direction perpendicular to the surface for the systems we have investigated: pristine MoS2; Pt adsorbed on pristine MoS2 (case b); MoS2 with a sulfur vacancy (MoS2 + VS); and the latter surface with a Pt atom adsorbed on the VS site (MoS2 + VS+Pt). The vertical scale is the same for the three sections of the plot, but the range shown differs to make the features of each section more clear.
Ijms 23 11199 g006
Figure 7. Reflectivity spectra for the cases considered. The substitutionally absorbed Pt atom increases the reflectivity overall. Most of the reflectivity is observed in the visible spectra, with a negligible amount observed at energies beyond 20 eV.
Ijms 23 11199 g007
Figure 8. Energy evolution for the first principles molecular dynamics calculations performed. We considered the two extreme cases: (I) those with the lowest absorption energy, corresponding to case (a) in Figure 2 and Figure 3; and (II) with the highest one, corresponding to case (d) in Figure 2 and Figure 3. The FPMD calculations shown ran for 3561 and 2800 iterations, respectively. In both cases the qualitatively behavior agrees with the structural relaxation calculations previously performed.
Ijms 23 11199 g008
Table 1. Adsorption energies Eads (in eV) of the Pt atom on the MoS2 surface, for the cases considered in static calculations. The energies are calculated according to Equation (5) from Section 4.
Case 1DescriptionEads
aPt over S, pristine MoS2−2.77
bPt over S-S bond, pristine MoS2−3.45
cPt over S-S-S triangle, pristine MoS2−2.94
dPt over VS vacancy−5.83
1 The labelling of the cases corresponds to that in Figure 2 and Figure 3.
Publisher’s Note: MDPI stays neutral with regard to jurisdictional claims in published maps and institutional affiliations.

