
Reorganization of the Landscape of Translated mRNAs in NSUN2-Deficient Cells and Specific Features of NSUN2 Target mRNAs

 ,
,  ,
,  and
and 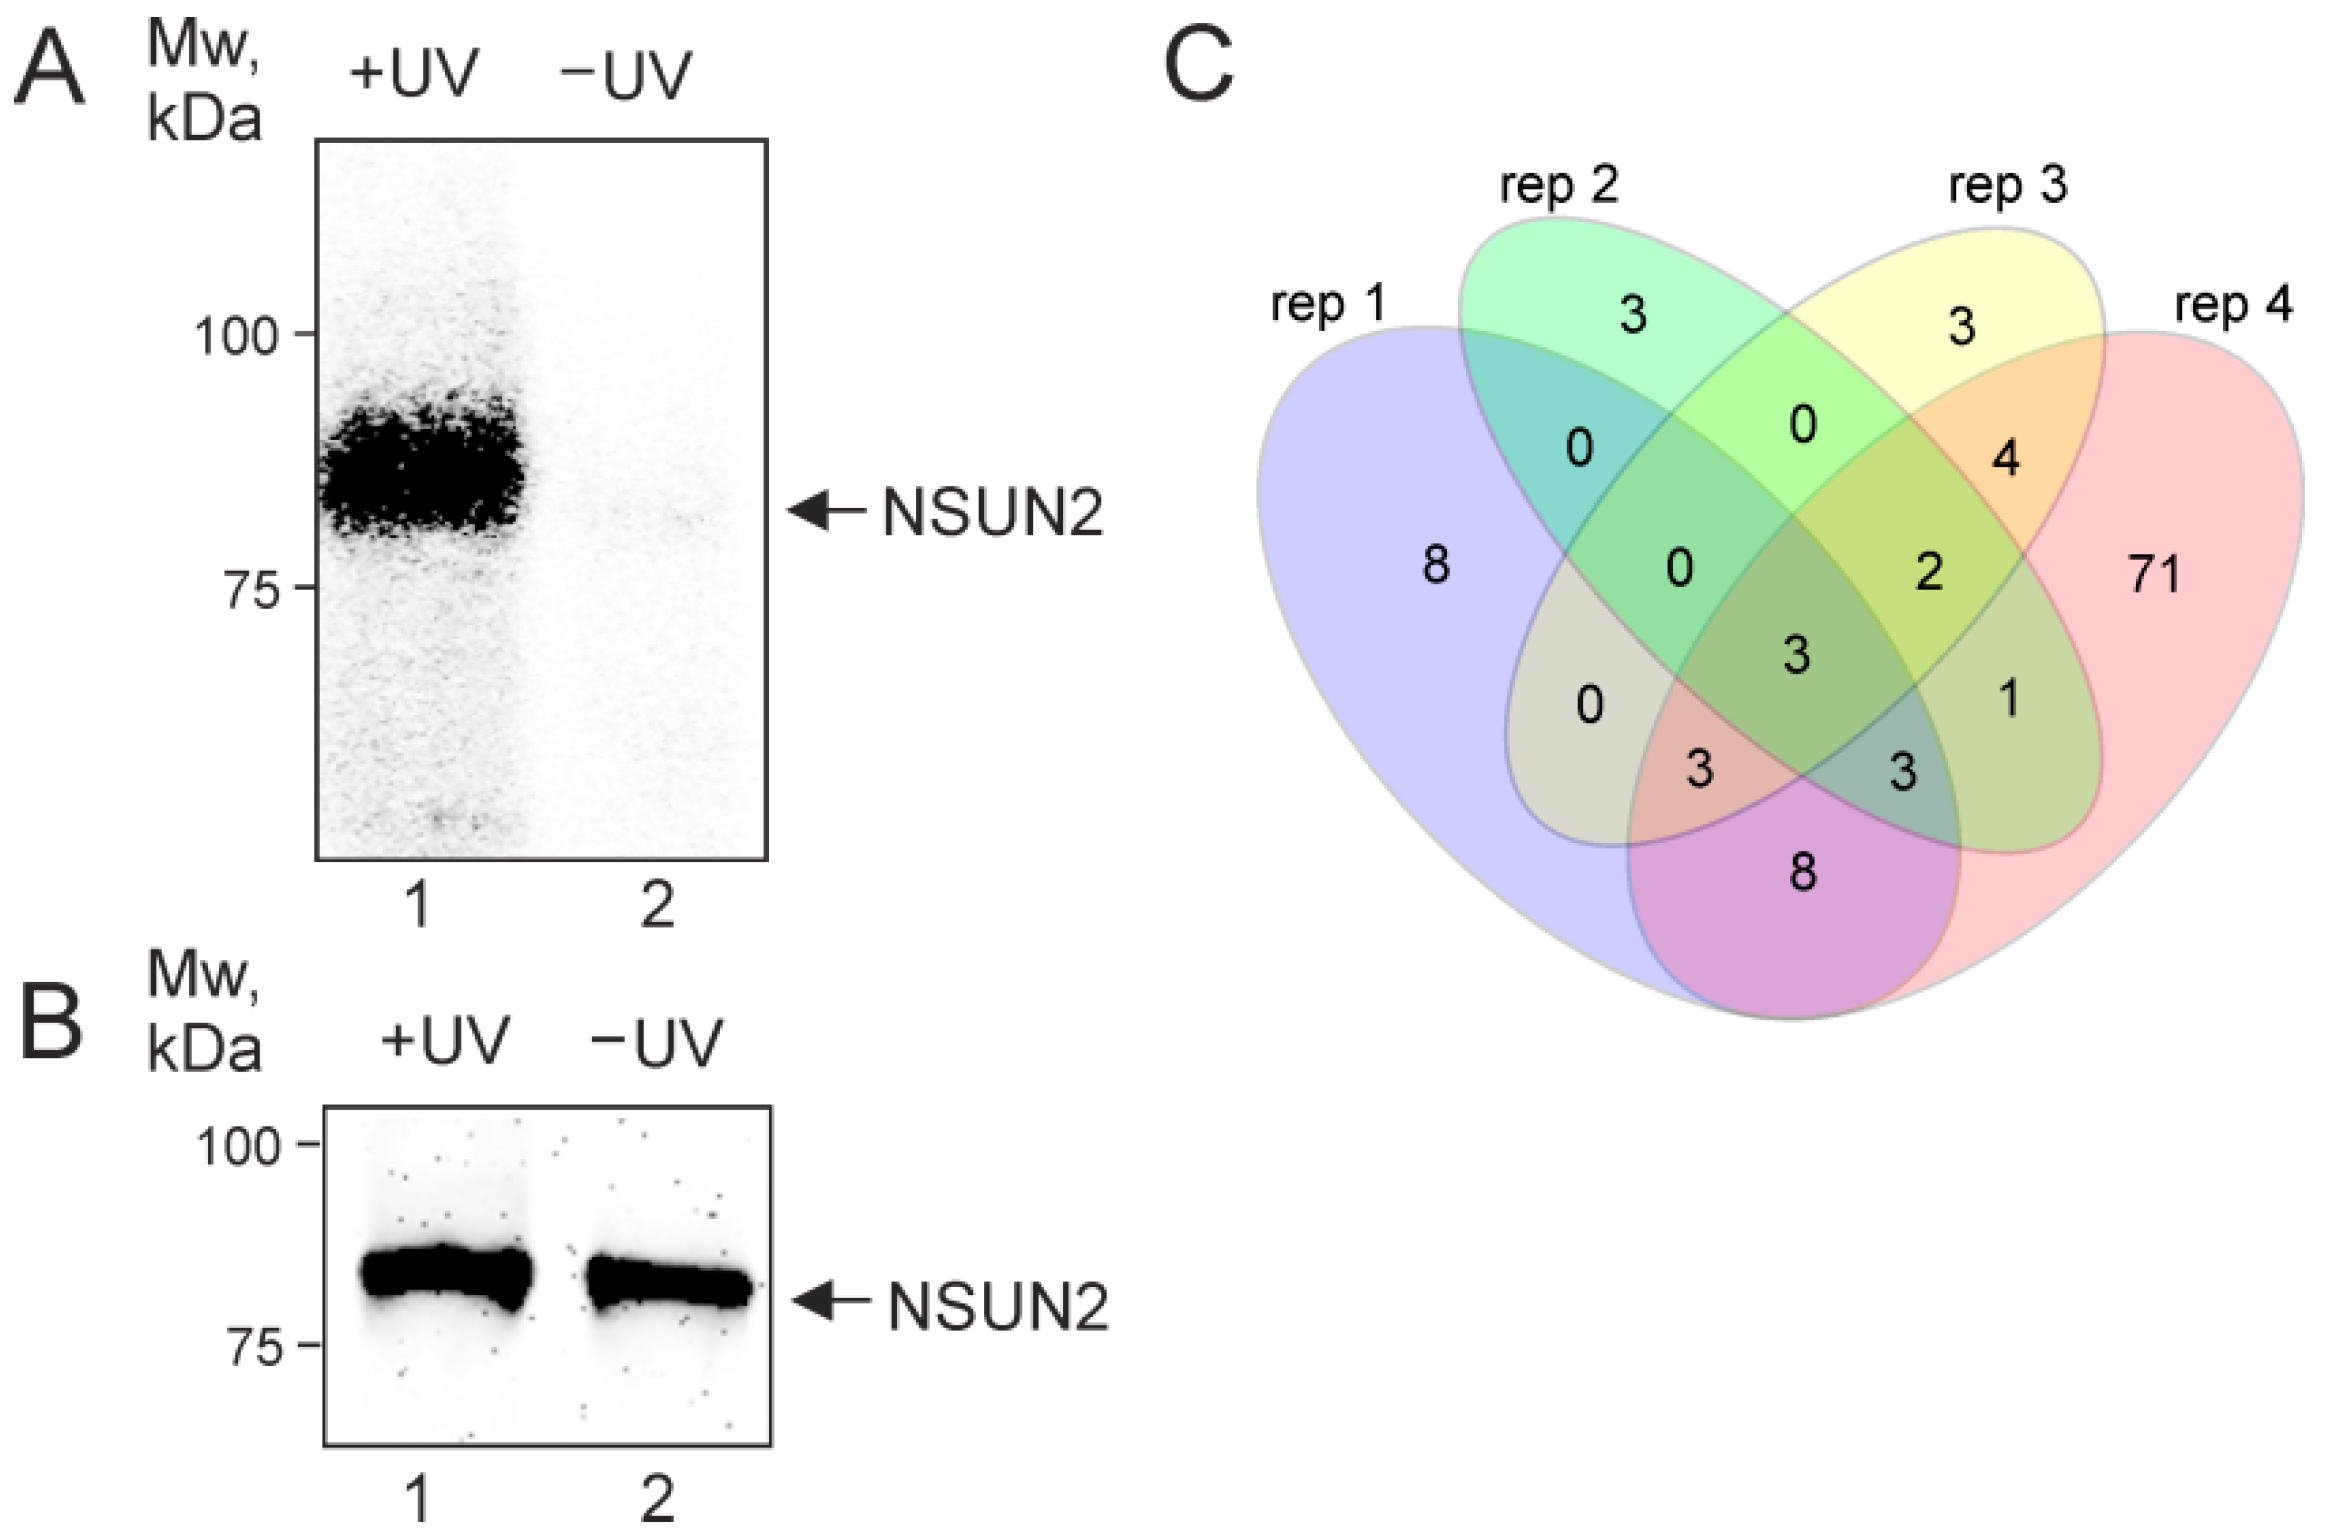
Abstract
:1. Introduction
2. Results
2.1. NSUN2 In-Cell Cross-Linking
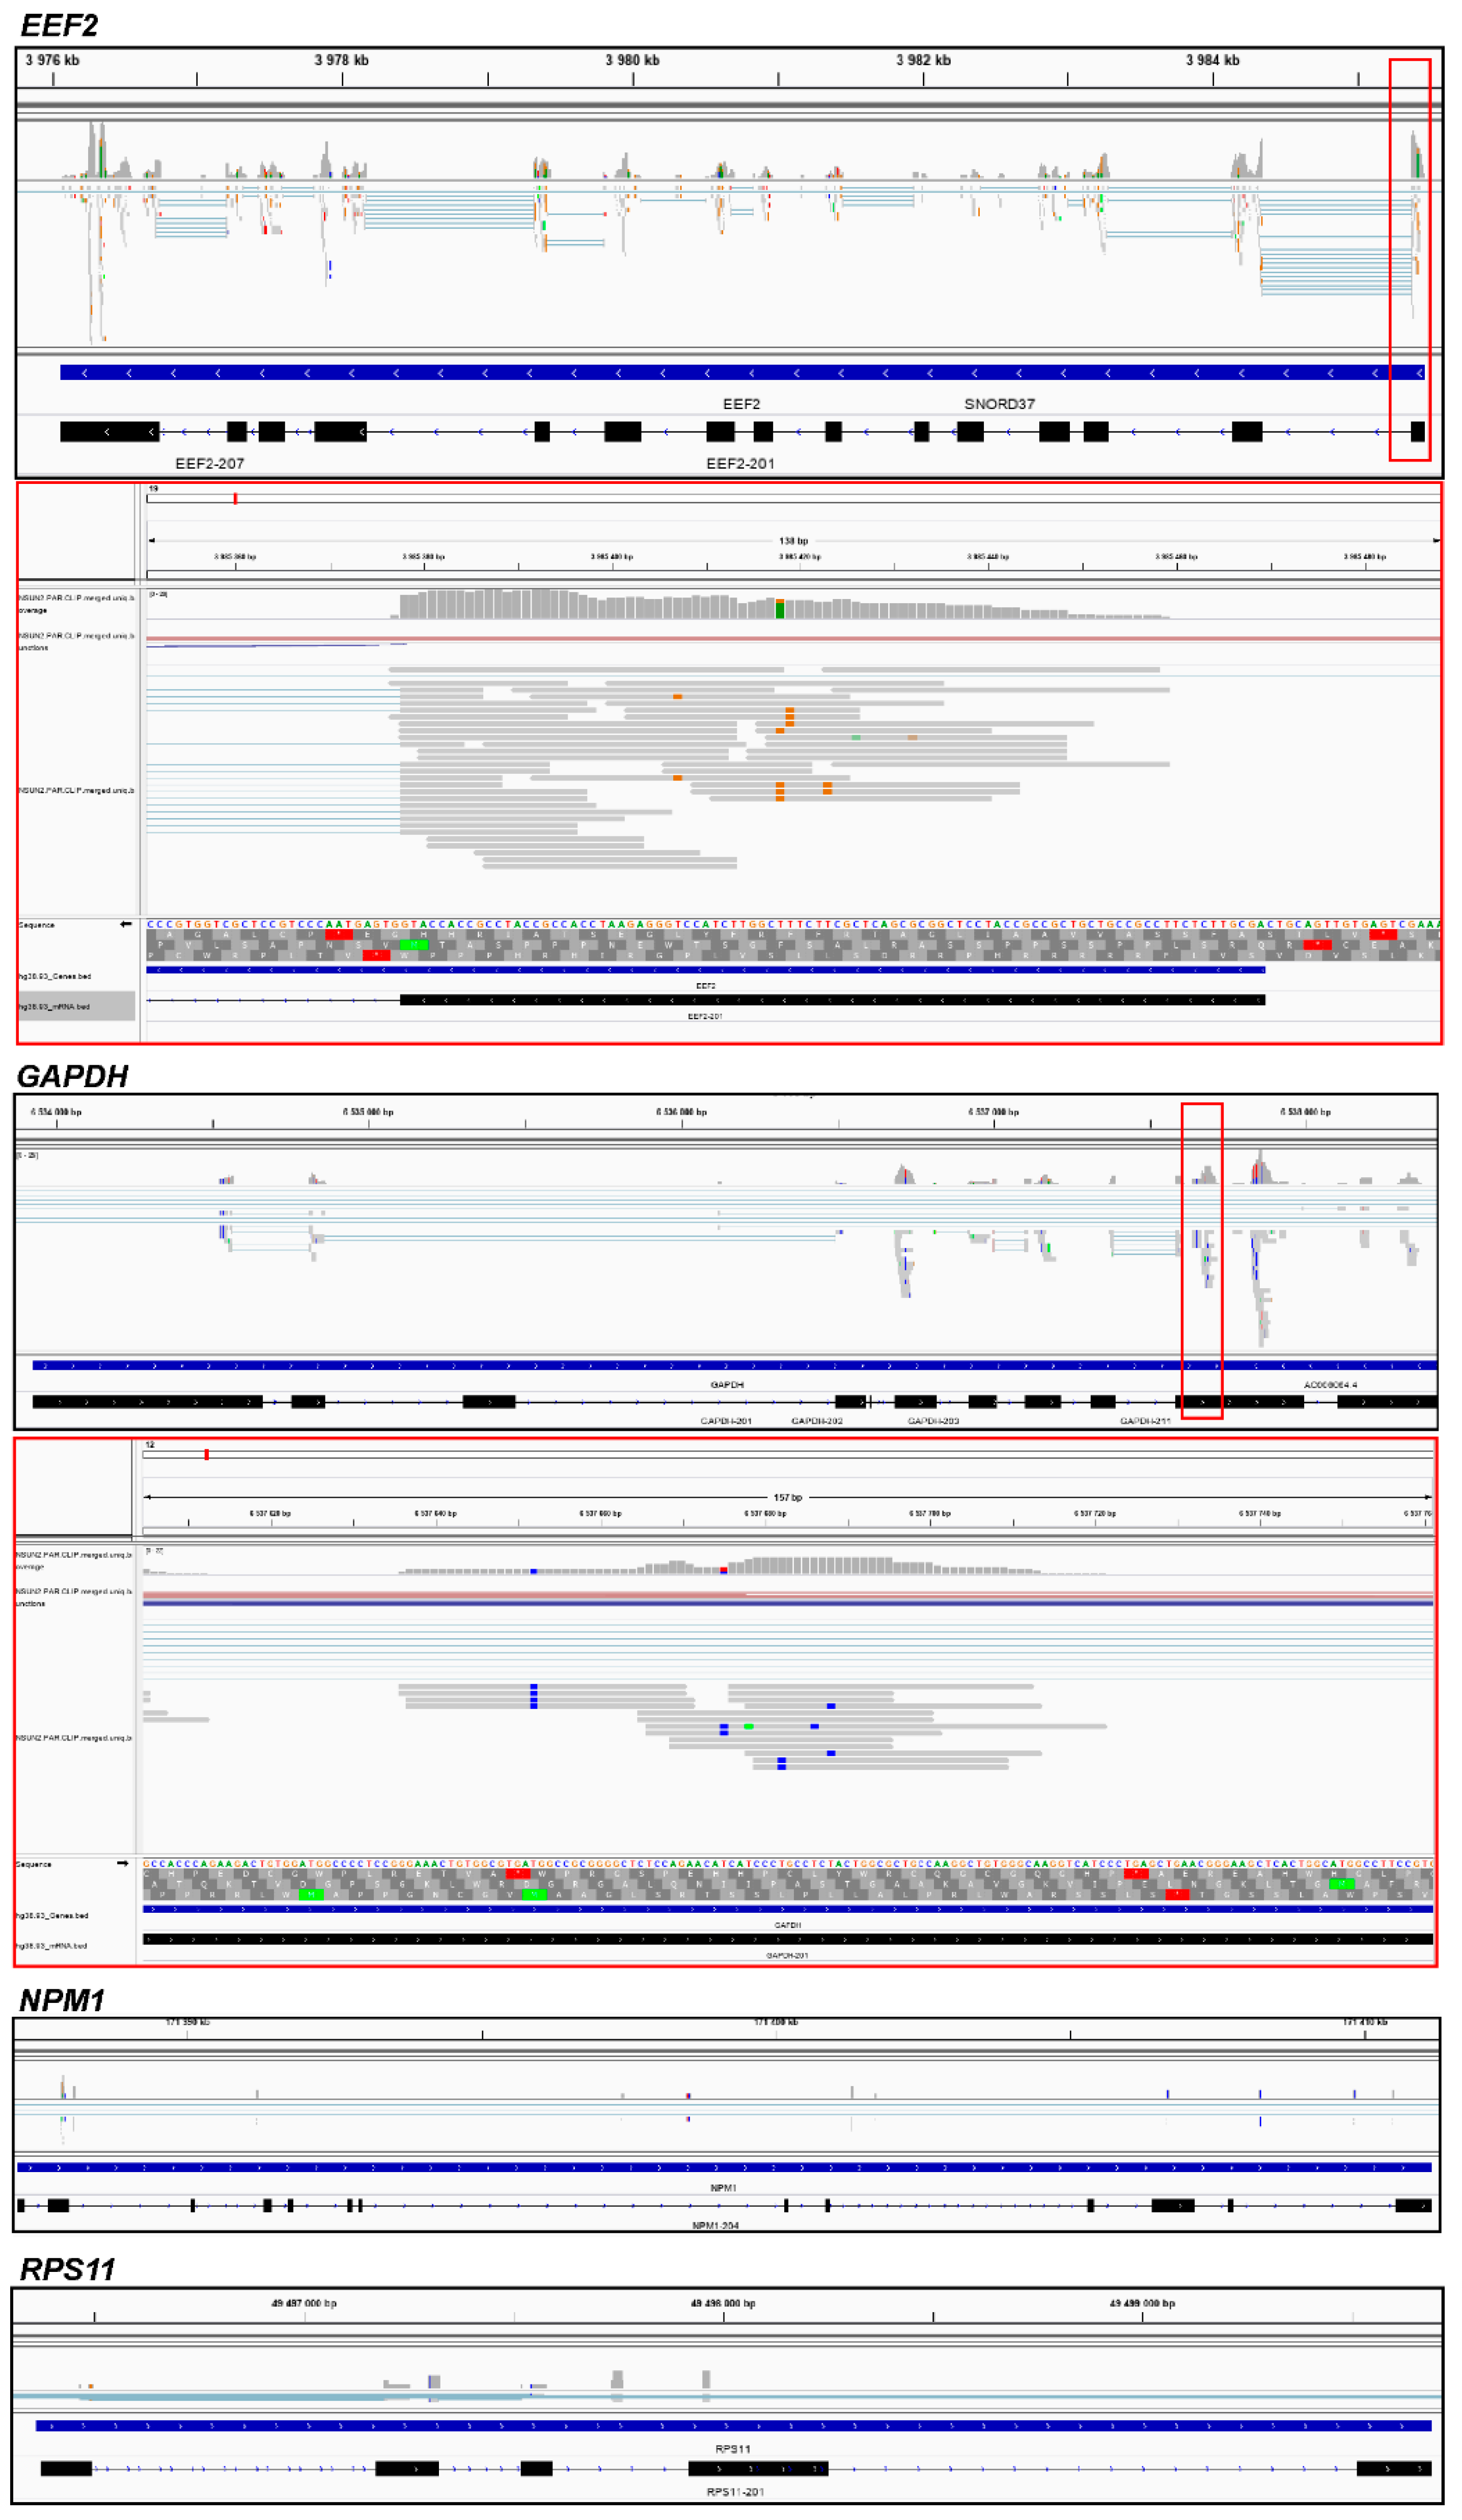
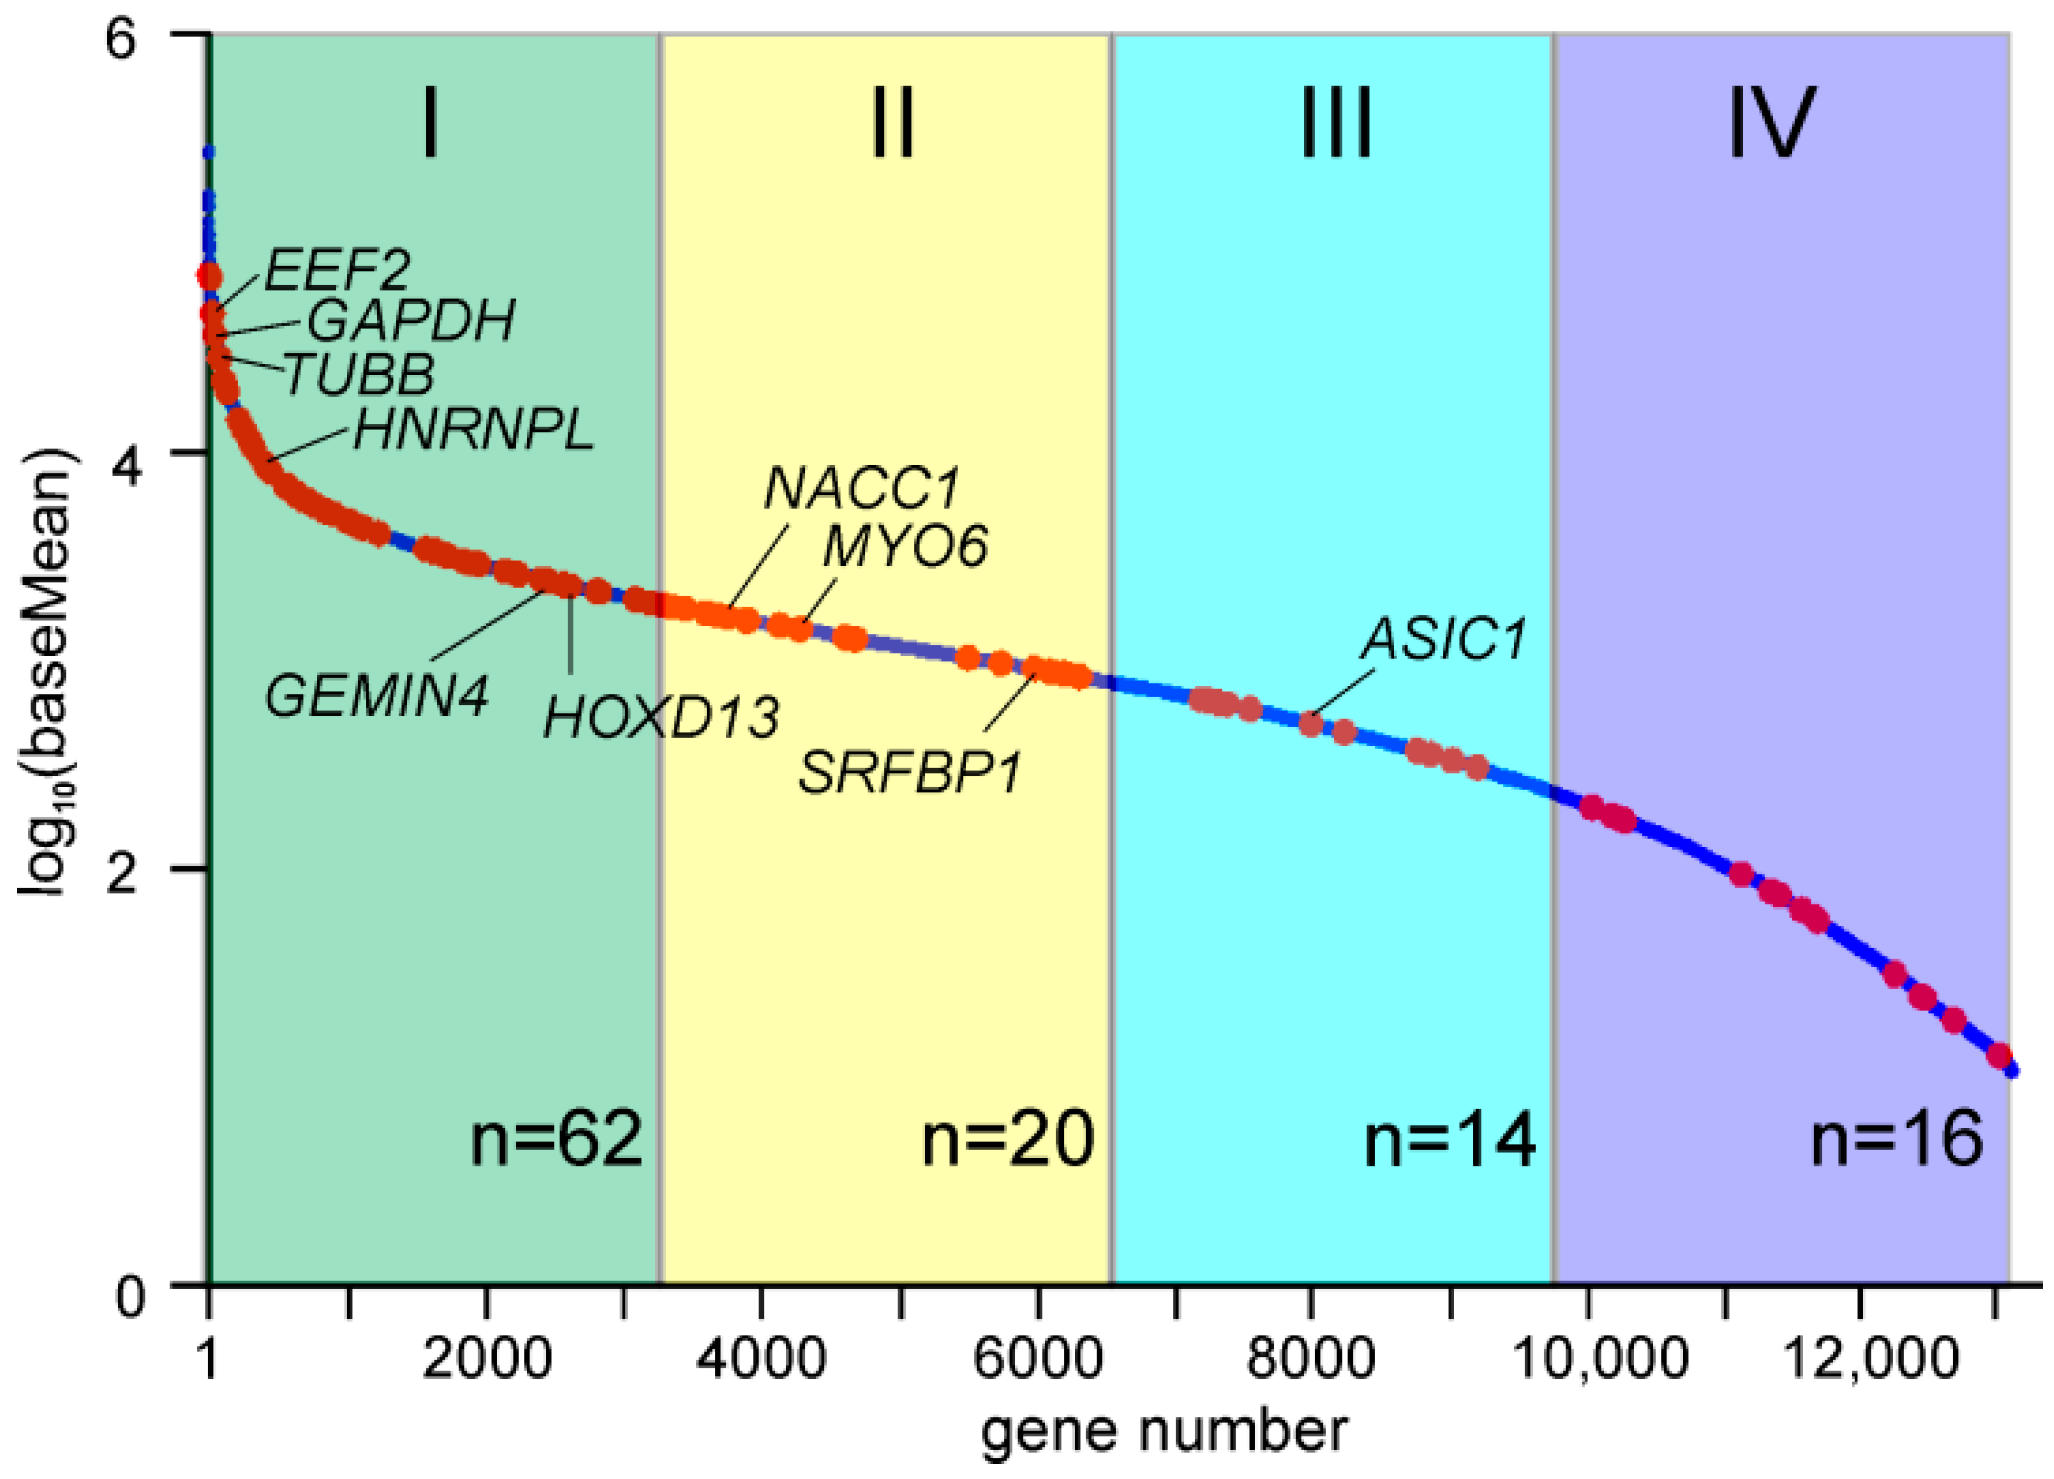
2.2. NSUN2-Cross-Linked RNAs
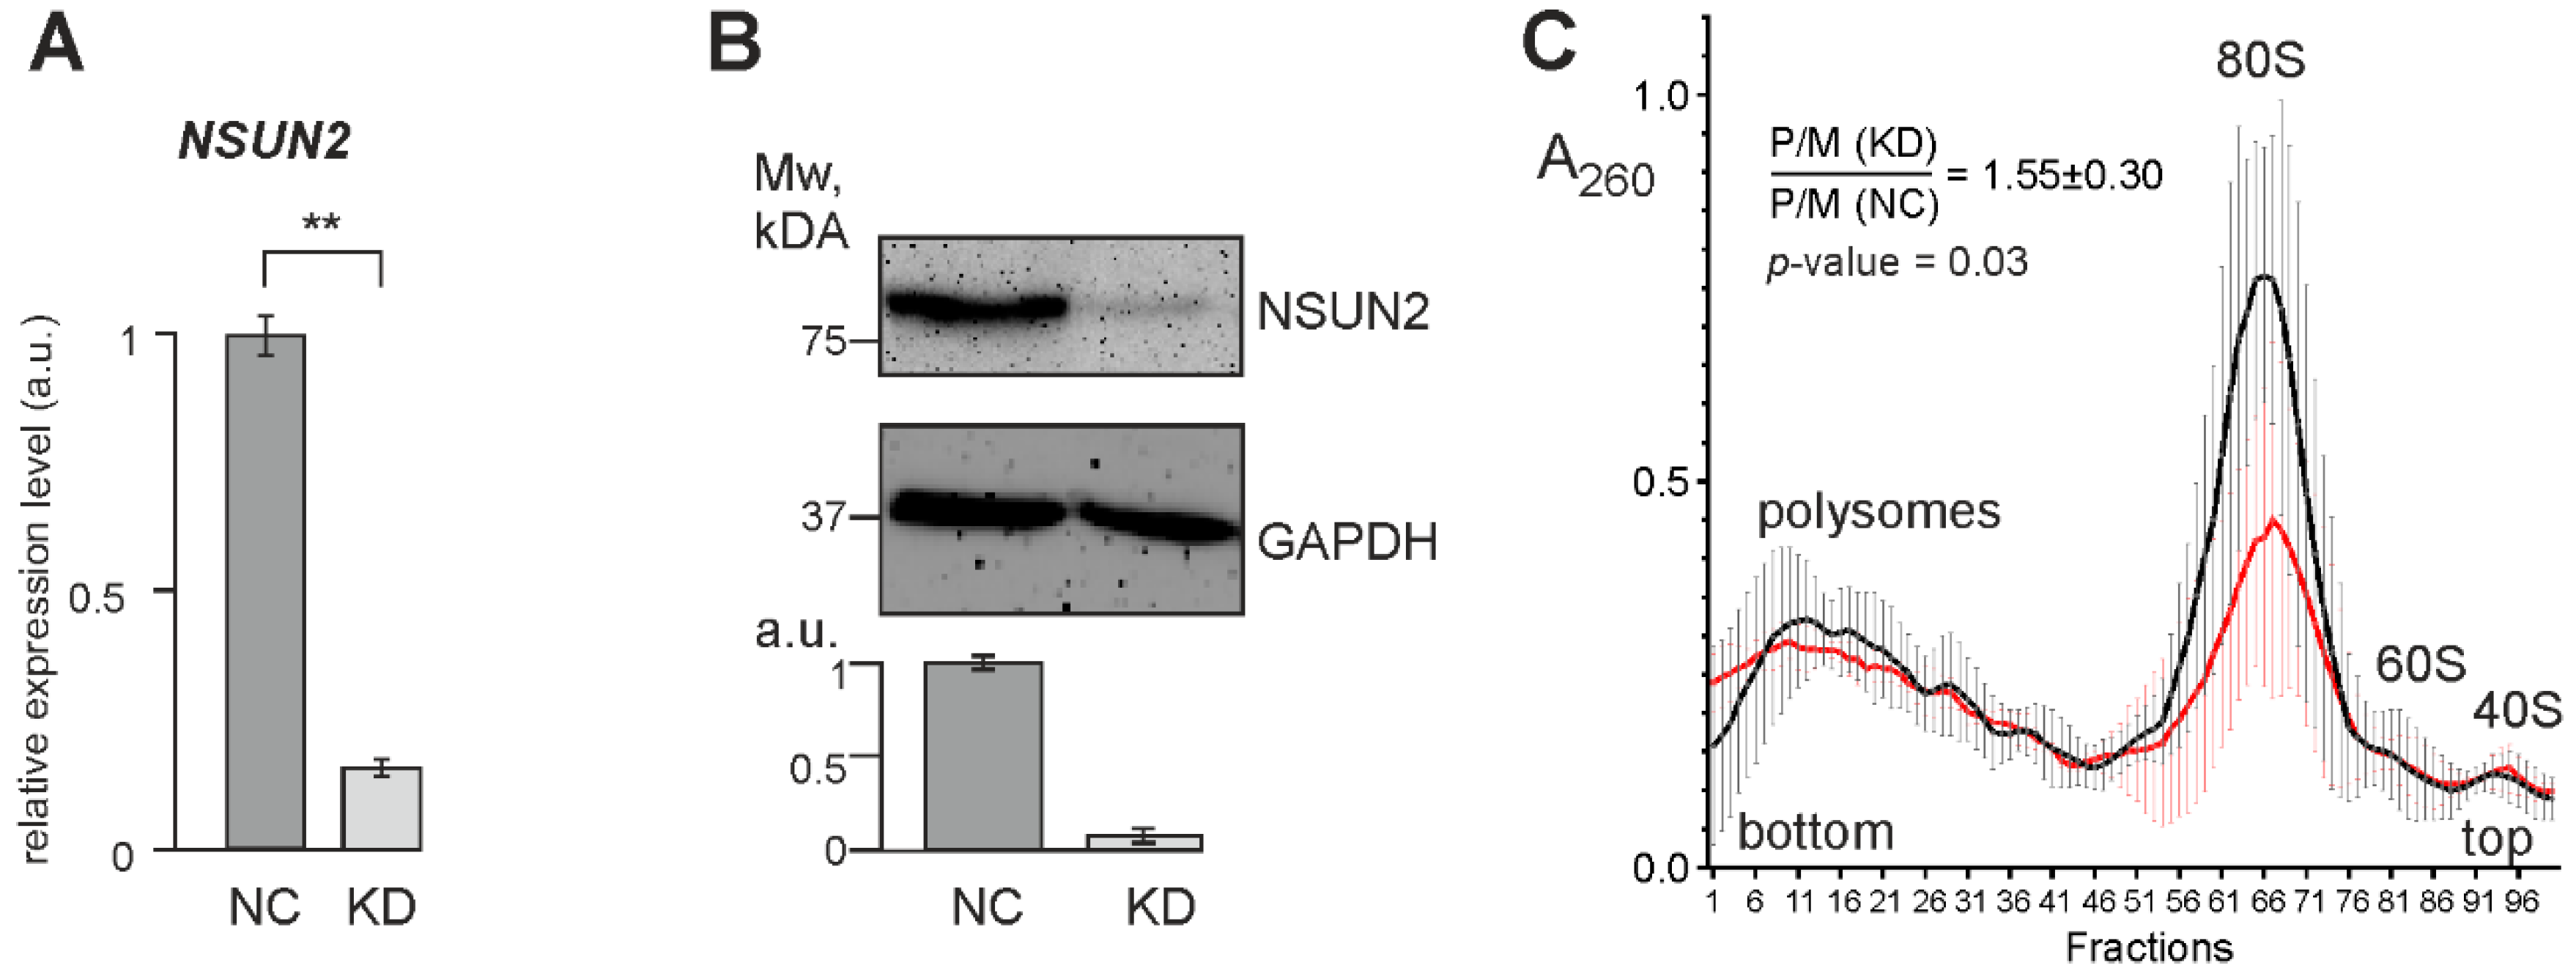
2.3. Knockdown of NSUN2
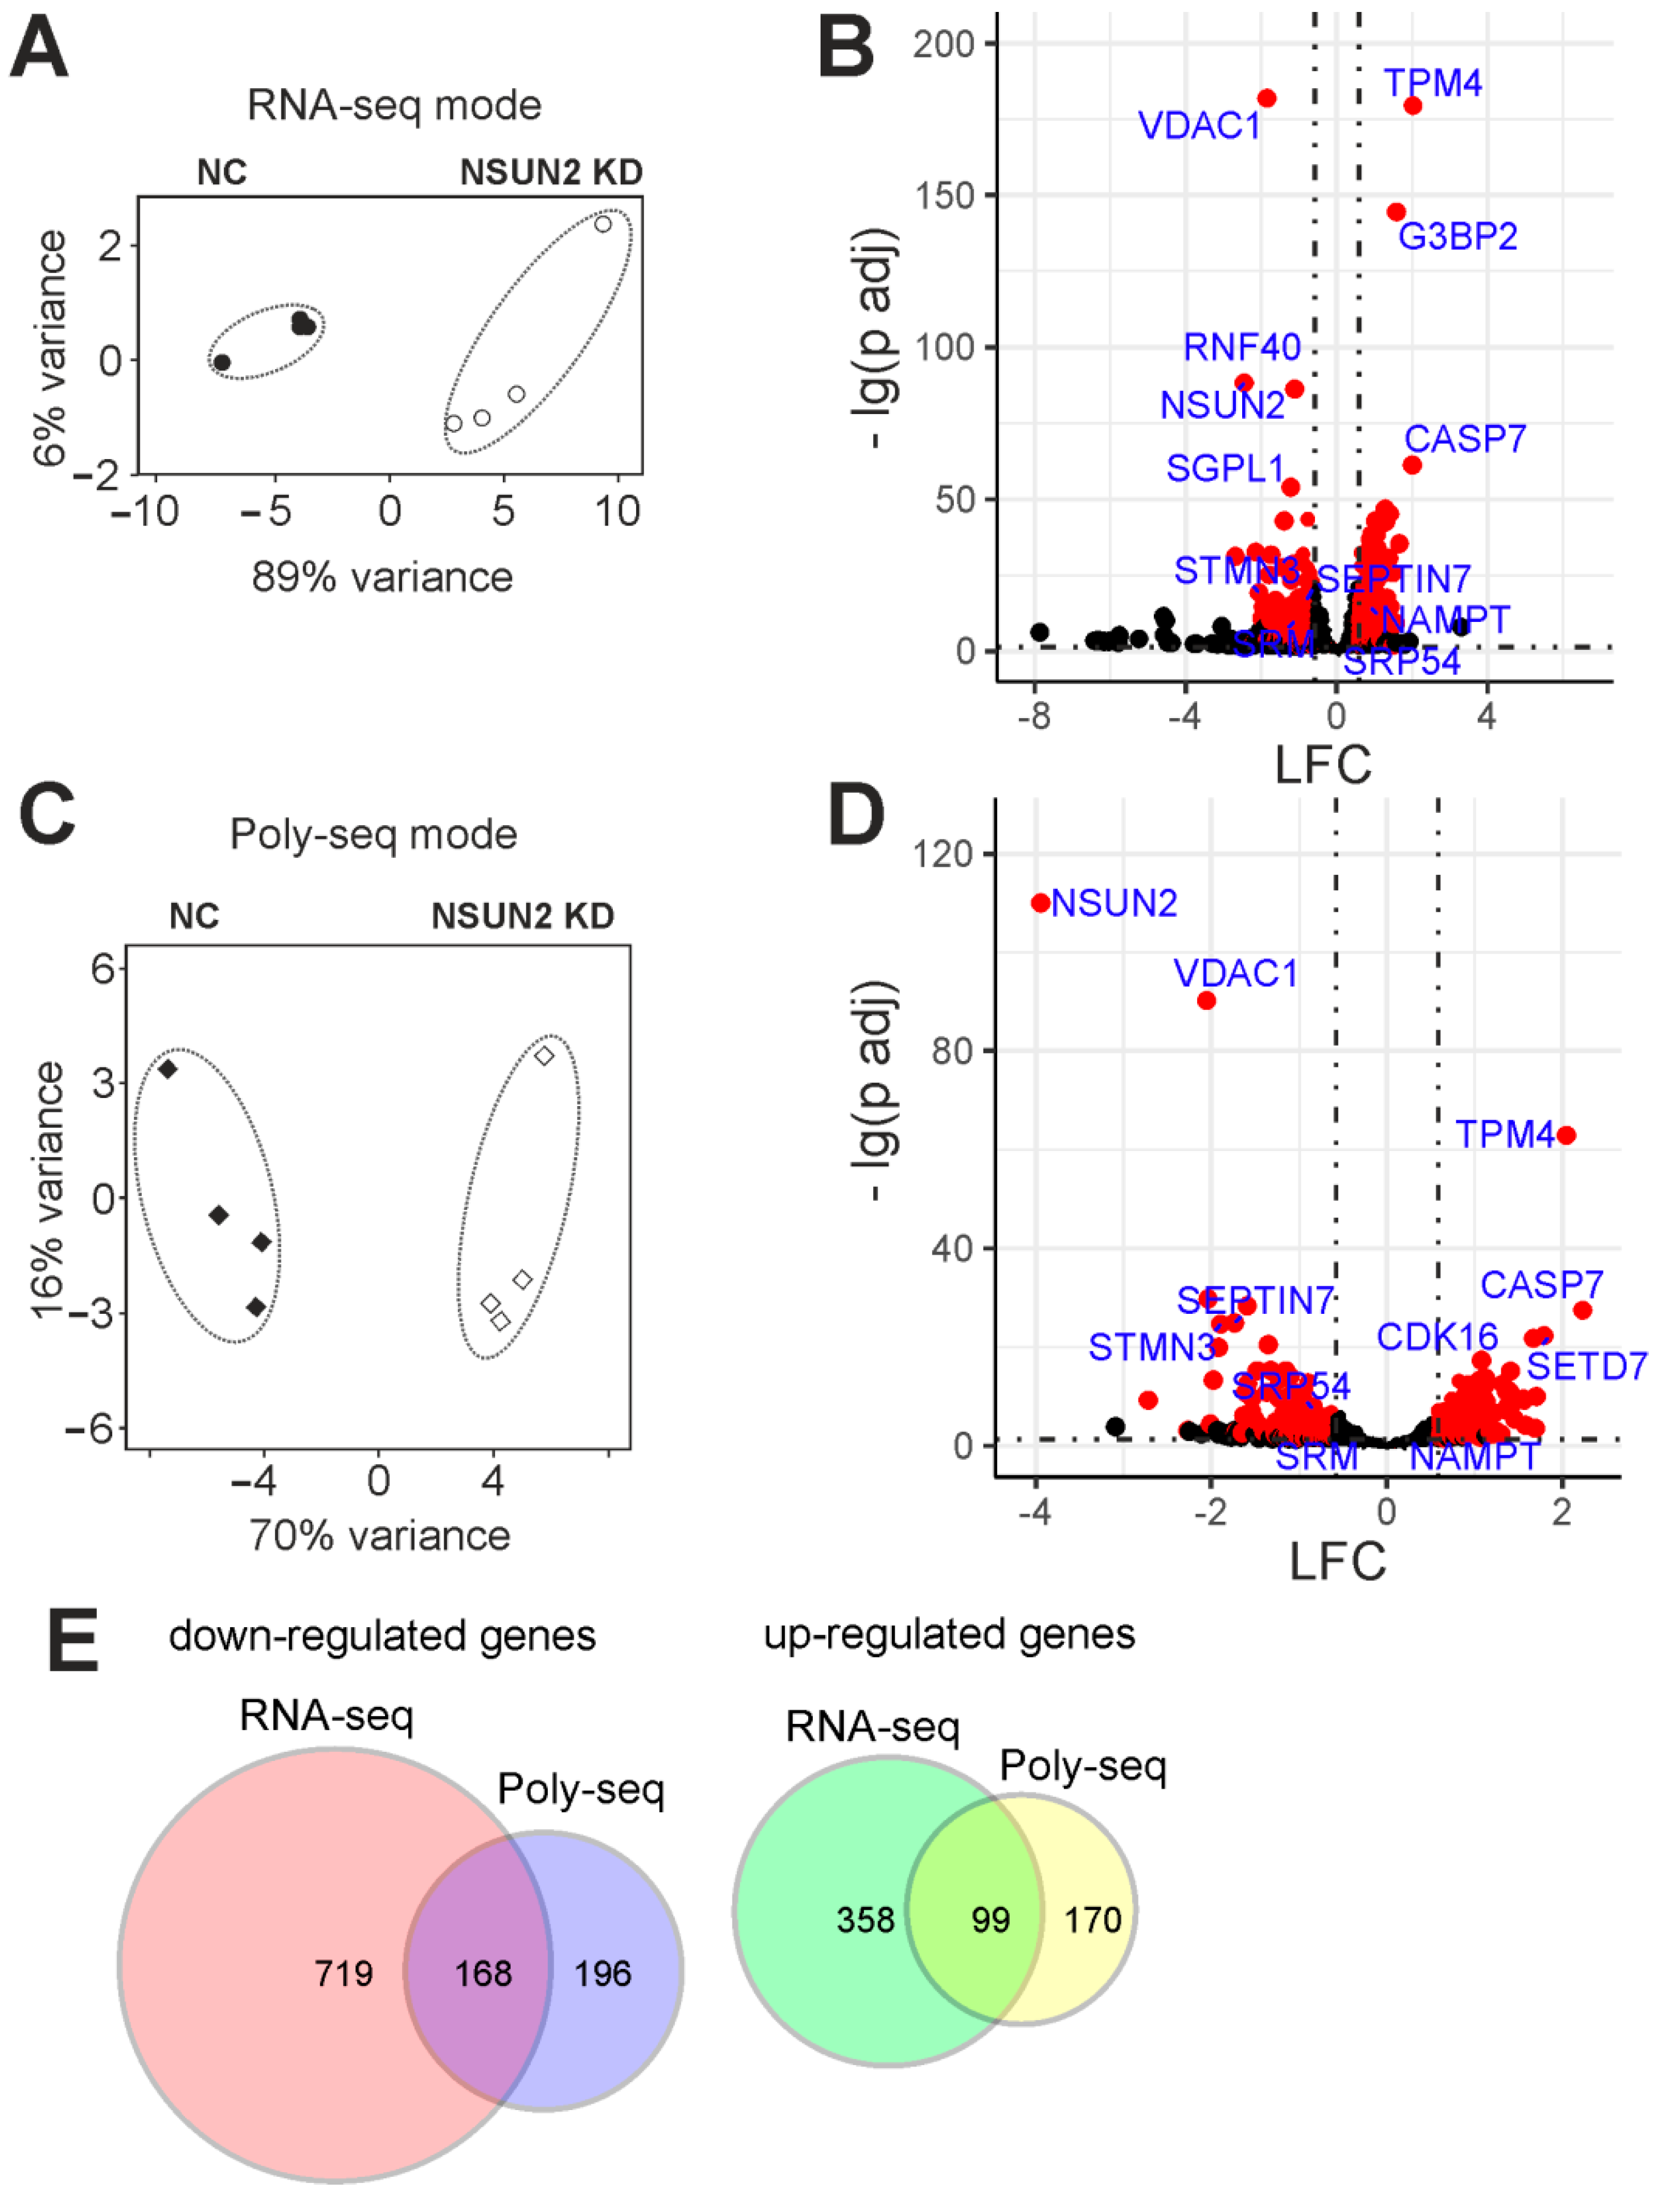
2.4. Differentially Expressed Genes of Cells with and without NSUN2 Knockdown
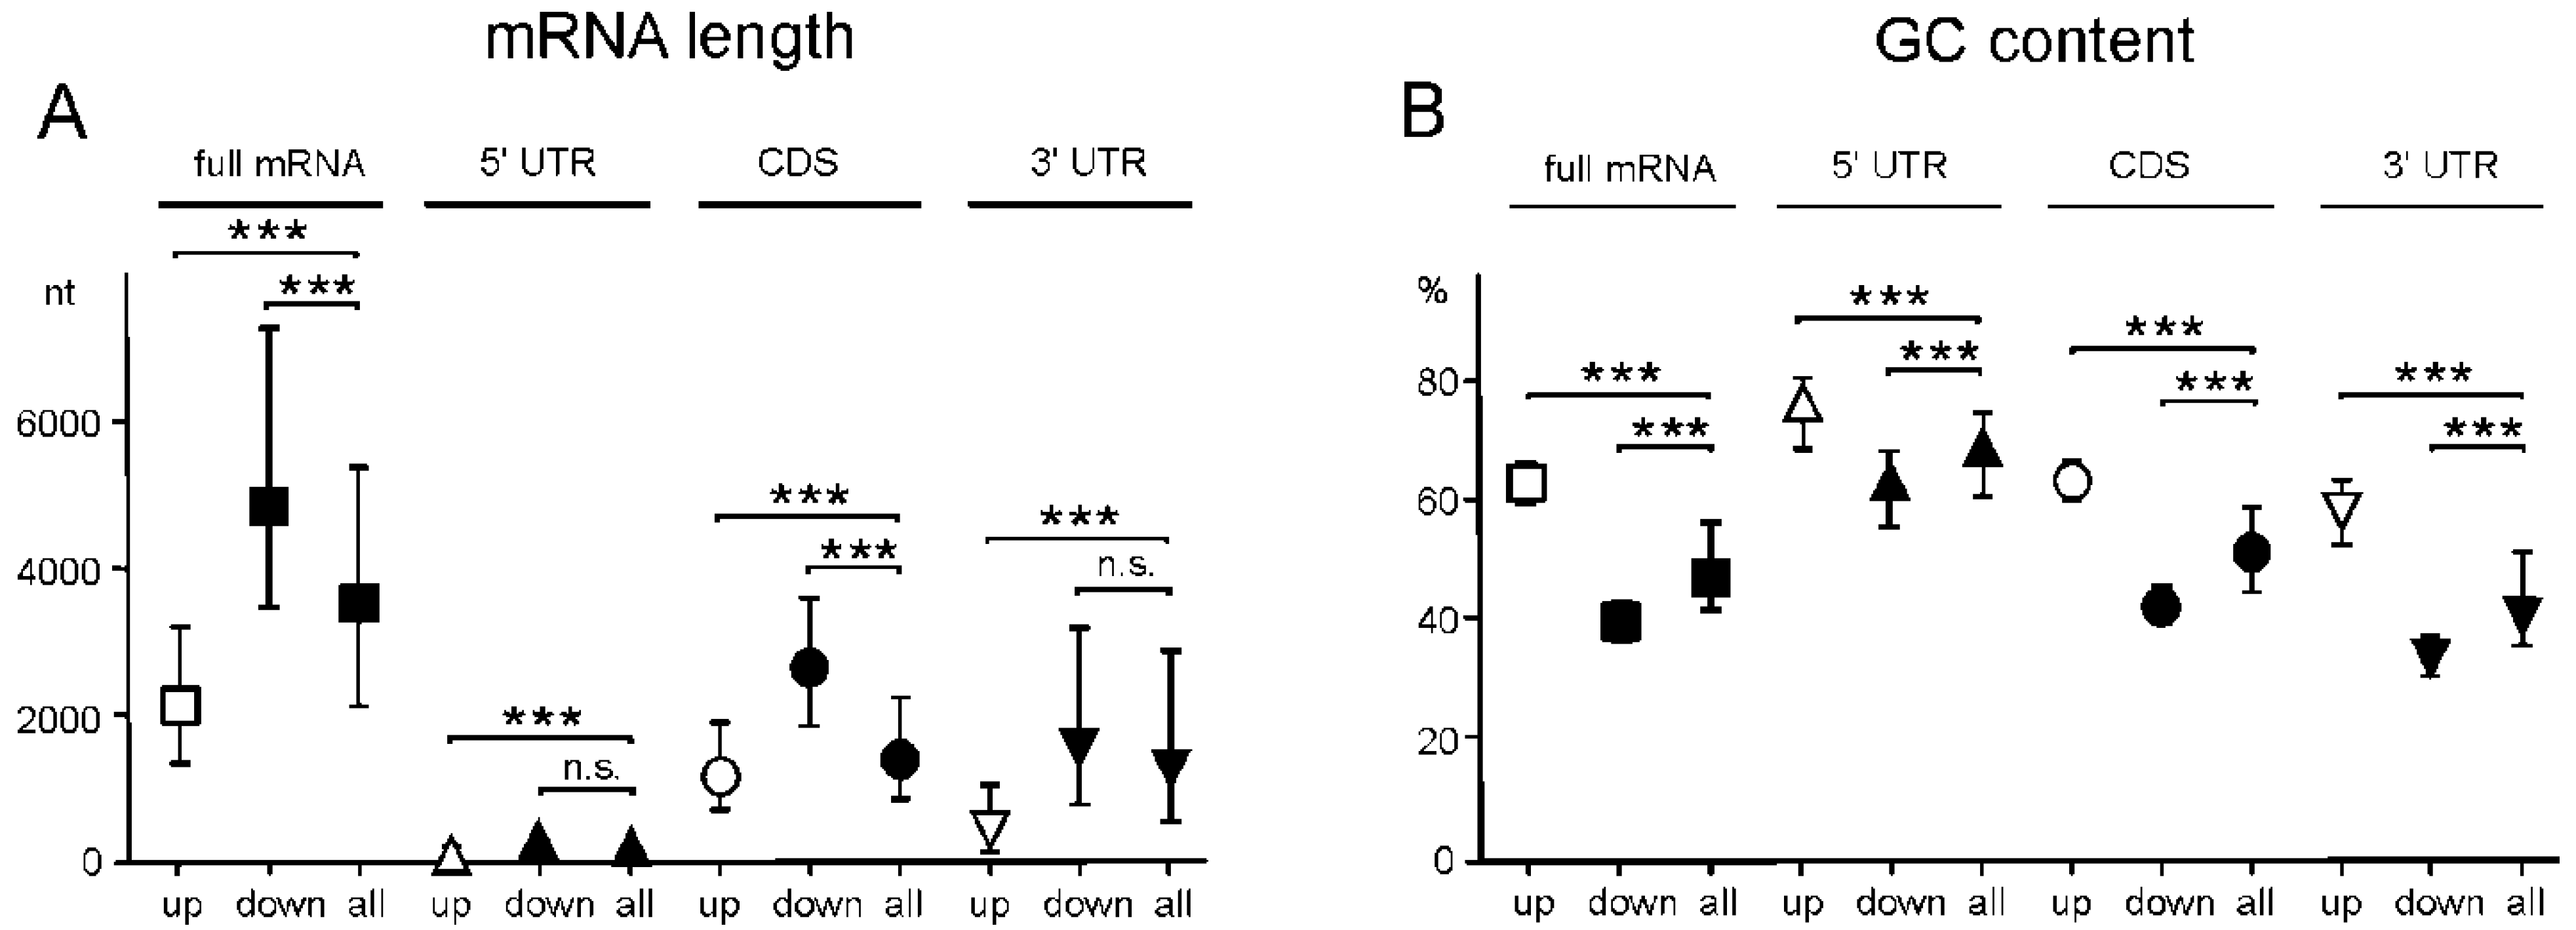
2.5. Genes with Differential Translation Efficiencies for Cells with and without NSUN2 Knockdown
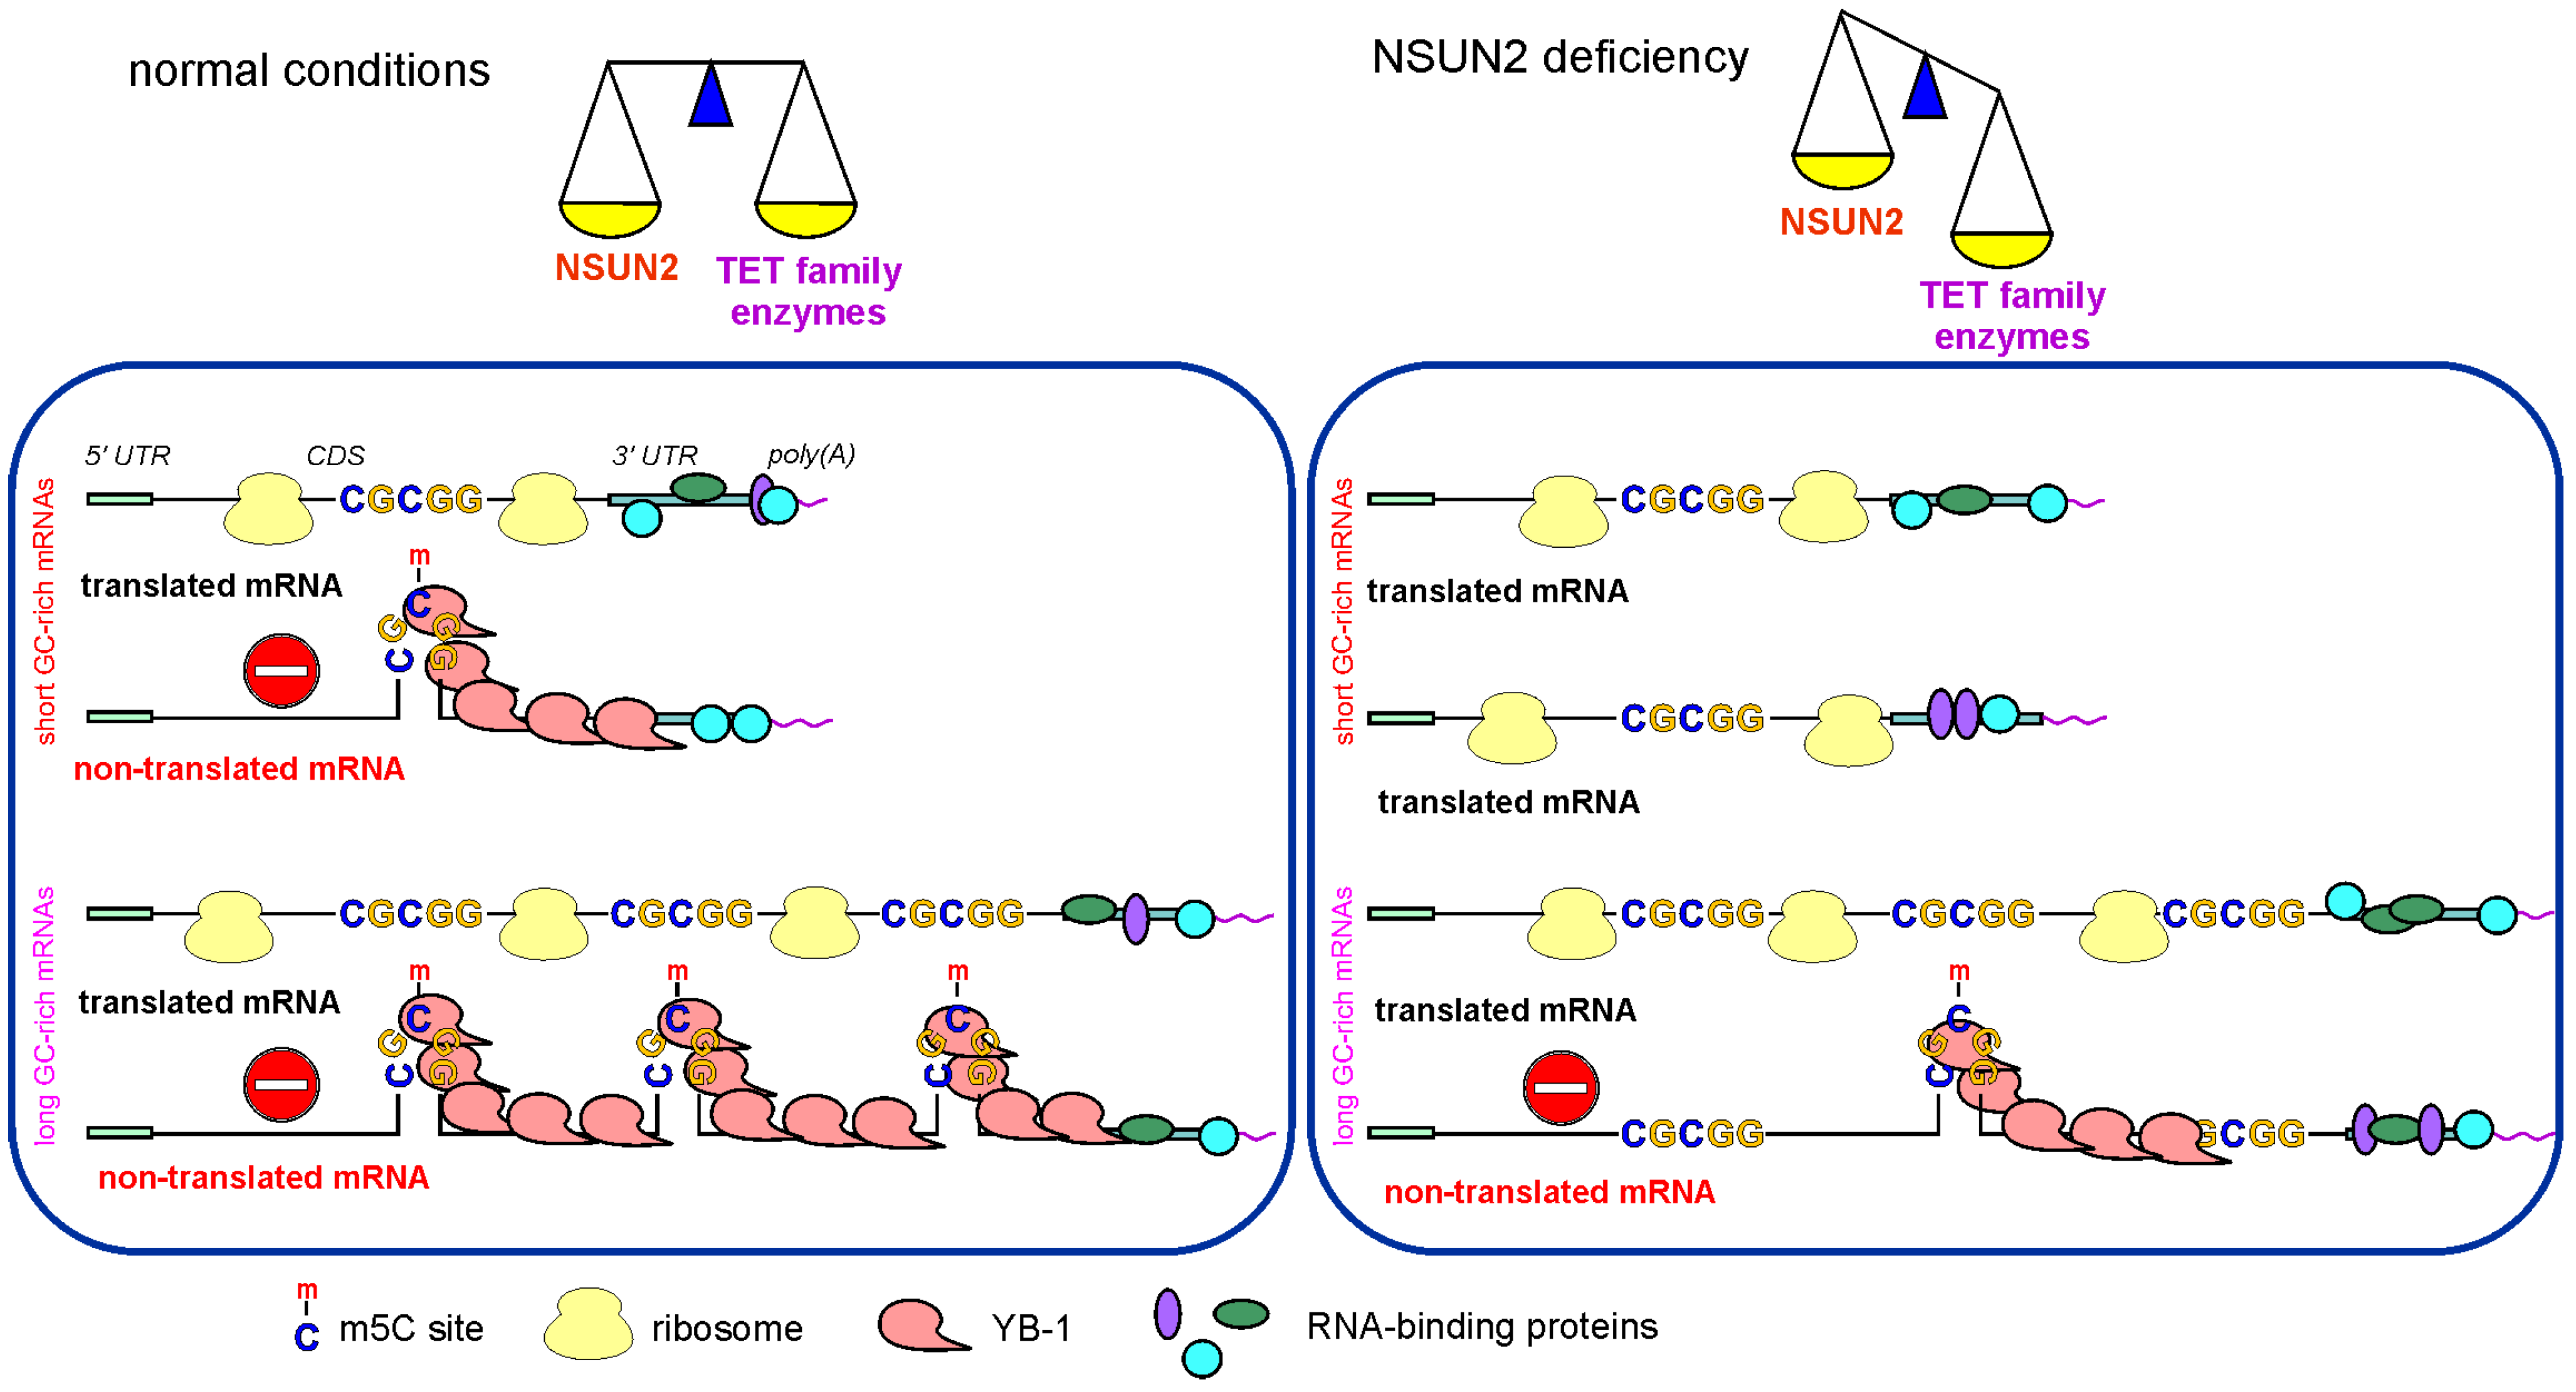
3. Discussion
4. Materials and Methods
4.1. Materials
4.2. In-Cell Cross-Linking
4.3. Preparation of cDNA Libraries from Cross-Linked RNA Fragments, NGS, and Bioinformatics Analysis of the PAR-CLIP-Derived Data
4.4. Cell Culture, NSUN2 mRNA Knockdown, and Determination of NSUN2 Content
4.5. Preparation of RNA Samples from NSUN2 Knockdown Cells
4.6. Preparation of DNA Libraries for RNA-Seq, Their NGS, and the Bioinformatics Processing of the Data Obtained
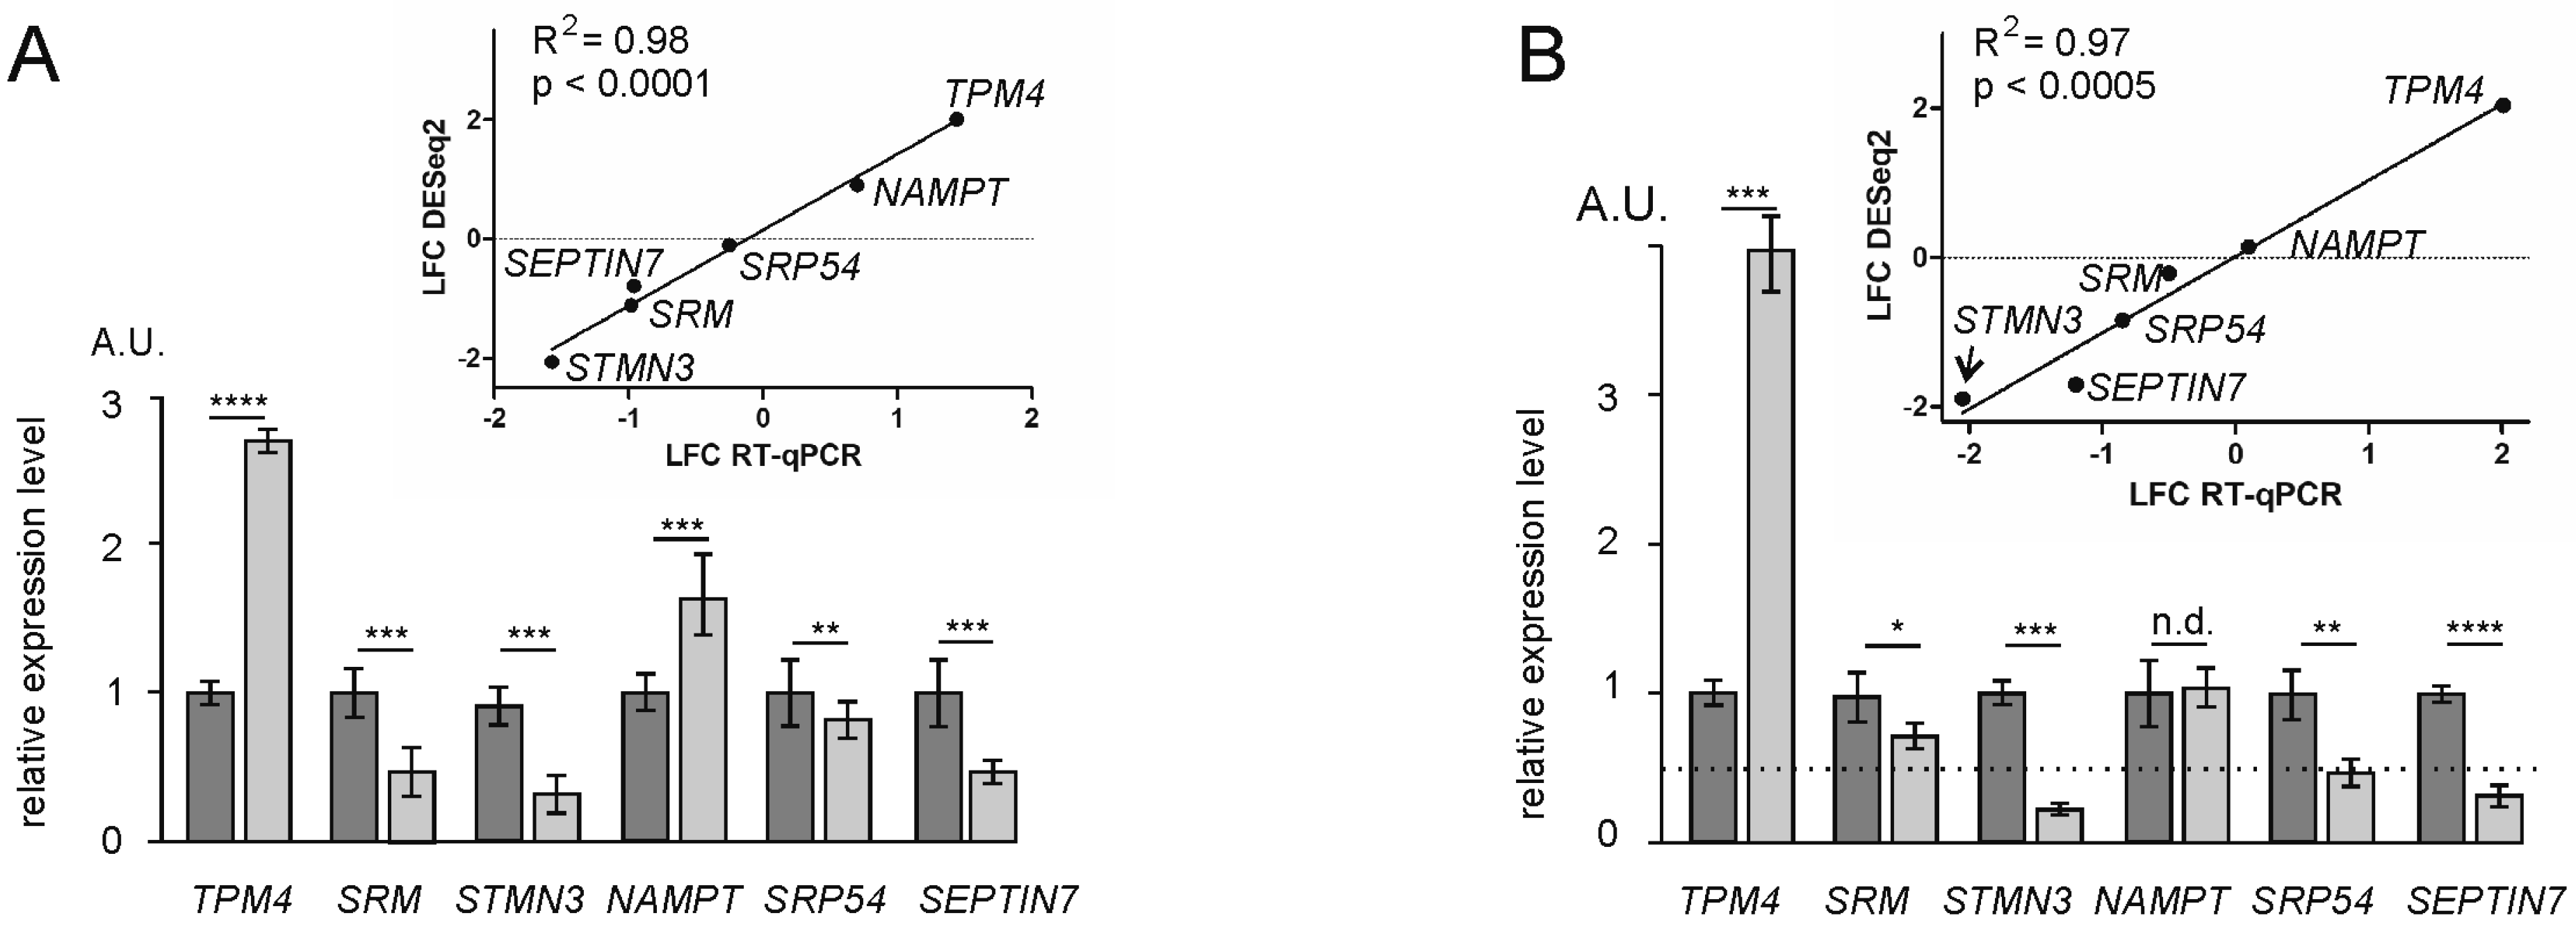
4.7. Validation of RNA-Seq and Poly-Seq Data by RT-qPCR
5. Conclusions
Supplementary Materials
Author Contributions
Funding
Institutional Review Board Statement
Informed Consent Statement
Data Availability Statement
Acknowledgments
Conflicts of Interest
References
- Bohnsack, K.E.; Hobartner, C.; Bohnsack, M.T. Eukaryotic 5-methylcytosine (m(5)C) RNA methyltransferases: Mechanisms, cellular functions, and links to disease. Genes 2019, 10, 102. [Google Scholar] [CrossRef] [PubMed]
- Trixl, L.; Lusser, A. Getting a hold on cytosine methylation in mRNA. Nat. Struct. Mol. Biol. 2019, 26, 339–340. [Google Scholar] [CrossRef] [PubMed]
- Xue, C.; Zhao, Y.; Li, L. Advances in RNA cytosine-5 methylation: Detection, regulatory mechanisms, biological functions and links to cancer. Biomark. Res. 2020, 8, 43. [Google Scholar] [CrossRef] [PubMed]
- Chellamuthu, A.; Gray, S.G. The RNA methyltransferase NSUN2 and its potential roles in cancer. Cells 2020, 9, 1758. [Google Scholar] [CrossRef]
- Brzezicha, B.; Schmidt, M.; Makalowska, I.; Jarmolowski, A.; Pienkowska, J.; Szweykowska-Kulinska, Z. Identification of human tRNA:m5C methyltransferase catalysing intron-dependent m5C formation in the first position of the anticodon of the Pre-tRNA Leu (CAA). Nucleic Acids Res. 2006, 34, 6034–6043. [Google Scholar] [CrossRef]
- Auxilien, S.; Guerineau, V.; Szweykowska-Kulinska, Z.; Golinelli-Pimpaneau, B. The human tRNA m(5)C methyltransferase Misu is multisite-specific. RNA Biol. 2012, 9, 1331–1338. [Google Scholar] [CrossRef]
- Schumann, U.; Zhang, H.N.; Sibbritt, T.; Pan, A.; Horvath, A.; Gross, S.; Clark, S.J.; Yang, L.; Preiss, T. Multiple links between 5-methylcytosine content of mRNA translation. BMC Biol. 2020, 18, 40. [Google Scholar] [CrossRef] [PubMed]
- Cui, X.; Liang, Z.; Shen, L.; Zhang, Q.; Bao, S.; Geng, Y.; Zhang, B.; Leo, V.; Vardy, L.A.; Lu, T.; et al. 5-Methylcytosine RNA methylation in Arabidopsis thaliana. Mol. Plant. 2017, 10, 1387–1399. [Google Scholar] [CrossRef]
- Huang, T.; Chen, W.; Liu, J.; Gu, N.; Zhang, R. Genome-wide identification of mRNA 5-methylcytosine in mammals. Nat. Struct. Mol. Biol. 2019, 26, 380–388. [Google Scholar] [CrossRef]
- Yang, X.; Yang, Y.; Sun, B.F.; Chen, Y.S.; Xu, J.W.; Lai, W.Y.; Li, A.; Wang, X.; Bhattarai, D.P.; Xiao, W.; et al. 5-methylcytosine promotes mRNA Export—NSUN2 as the methyltransferase and ALYREF as an m(5)C reader. Cell Res. 2017, 27, 606–625. [Google Scholar] [CrossRef] [Green Version]
- Dai, X.; Gonzalez, G.; Li, L.; Li, J.; You, C.; Miao, W.; Hu, J.; Fu, L.; Zhao, Y.; Li, R.; et al. Ythdf2 binds to 5-methylcytosine in RNA and modulates the maturation of ribosomal RNA. Anal. Chem. 2020, 92, 1346–1354. [Google Scholar] [CrossRef] [PubMed]
- Eliseeva, I.A.; Kim, E.R.; Guryanov, S.G.; Ovchinnikov, L.P.; Lyabin, D.N. Y-box-binding protein 1 (Yb-1) and its functions. Biochemistry 2011, 76, 1402–1433. [Google Scholar] [CrossRef] [PubMed]
- Lyabin, D.N.; Eliseeva, I.A.; Ovchinnikov, L.P. YB-1 protein: Functions and regulation. Wiley Interdiscip. Rev. RNA 2014, 5, 95–110. [Google Scholar] [CrossRef]
- Alemasova, E.E.; Naumenko, K.N.; Moor, N.A.; Lavrik, O.I. Y-box-binding protein 1 stimulates abasic site cleavage. Biochemistry 2017, 82, 1521–1528. [Google Scholar] [CrossRef]
- Shurtleff, M.J.; Temoche-Diaz, M.M.; Karfilis, K.V.; Ri, S.; Schekman, R. Y-box protein 1 is required to sort microRNAs into exosomes in cells and in a cell-free reaction. eLife 2016, 5, e19276. [Google Scholar] [CrossRef]
- Shurtleff, M.J.; Yao, J.; Qin, Y.; Nottingham, R.M.; Temoche-Diaz, M.M.; Schekman, R.; Lambowitz, A.M. Broad role for Ybx1 in defining the small noncoding RNA composition of exosomes. Proc. Natl. Acad. Sci. USA 2017, 114, E8987–E8995. [Google Scholar] [CrossRef]
- Yang, Y.; Wang, L.; Han, X.; Yang, W.L.; Zhang, M.; Ma, H.L.; Sun, B.F.; Li, A.; Xia, J.; Chen, J.; et al. RNA 5-methylcytosine facilitates the maternal-to-zygotic transition by preventing maternal mRNA decay. Mol. Cell 2019, 75, 1188–1202.e11. [Google Scholar] [CrossRef] [PubMed]
- Kossinova, O.A.; Gopanenko, A.V.; Tamkovich, S.N.; Krasheninina, O.A.; Tupikin, A.E.; Kiseleva, E.; Yanshina, D.D.; Malygin, A.A.; Ven’yaminova, A.G.; Kabilov, M.R.; et al. Cytosolic YB-1 and NSUN2 are the only proteins recognizing specific motifs present in mRNAs enriched in exosomes. Biochim. Biophys. Acta Proteins Proteom. 2017, 1865, 664–673. [Google Scholar] [CrossRef]
- Batagov, A.O.; Kuznetsov, V.A.; Kurochkin, I.V. Identification of nucleotide patterns enriched in secreted RNAs as putative cis-acting elements targeting them to exosome nano-vesicles. BMC Genom. 2011, 12, S18. [Google Scholar] [CrossRef]
- Yanshina, D.D.; Kossinova, O.A.; Gopanenko, A.V.; Krasheninina, O.A.; Malygin, A.A.; Venyaminova, A.G.; Karpova, G.G. Structural features of the interaction of the 3’-untranslated region of mRNA containing exosomal RNA-specific motifs with YB-1, a potential mediator of mRNA sorting. Biochimie 2018, 144, 134–143. [Google Scholar] [CrossRef]
- Gopanenko, A.V.; Malygin, A.A.; Kossinova, O.A.; Tupikin, A.E.; Kabilov, M.R.; Karpova, G.G. Degenerate consensus sequences in the 3’-untranslated regions of cellular mRNAs as specific motifs potentially involved in the YB-1-mediated packaging of these mRNAs. Biochimie 2020, 170, 152–162. [Google Scholar] [CrossRef] [PubMed]
- Chen, X.; Li, A.; Sun, B.F.; Yang, Y.; Han, Y.N.; Yuan, X.; Chen, R.X.; Wei, W.S.; Liu, Y.; Gao, C.C.; et al. 5-methylcytosine promotes pathogenesis of bladder cancer through stabilizing mRNAs. Nat. Cell. Biol. 2019, 21, 978–990. [Google Scholar] [CrossRef]
- Hafner, M.; Landthaler, M.; Burger, L.; Khorshid, M.; Hausser, J.; Berninger, P.; Rothballer, A.; Ascano, M., Jr.; Jungkamp, A.C.; Munschauer, M.; et al. Transcriptome-wide identification of RNA-binding protein and mRNA target sites by PAR-CLIP. Cell 2010, 141, 129–141. [Google Scholar] [CrossRef] [PubMed]
- Garzia, A.; Morozov, P.; Sajek, M.; Meyer, C.; Tuschl, T. PAR-CLIP for discovering target sites of RNA-binding proteins. Methods Mol. Biol. 2018, 1720, 55–75. [Google Scholar] [CrossRef] [PubMed]
- Danan, C.; Manickavel, S.; Hafner, M. PAR-CLIP: A method for transcriptome-wide identification of RNA binding protein interaction sites. Methods Mol. Biol. 2022, 2404, 167–188. [Google Scholar] [CrossRef]
- Bulygin, K.N.; Repkova, M.N.; Ven’yaminova, A.G.; Graifer, D.M.; Karpova, G.G.; Frolova, L.Y.; Kisselev, L.L. Positioning of the mRNA stop signal with respect to polypeptide chain release factors and ribosomal proteins in 80S ribosomes. FEBS Lett. 2002, 514, 96–101. [Google Scholar] [CrossRef]
- Piovesan, A.; Pelleri, M.C.; Antonaros, F.; Strippoli, P.; Caracausi, M.; Vitale, L. On the length, weight and GC content of the human genome. BMC Res. Notes 2019, 12, 106. [Google Scholar] [CrossRef]
- Hussain, S.; Sajini, A.A.; Blanco, S.; Dietmann, S.; Lombard, P.; Sugimoto, Y.; Paramor, M.; Gleeson, J.G.; Odom, D.T.; Ule, J.; et al. NSUN2-mediated cytosine-5 methylation of vault noncoding RNA determines its processing into regulatory small RNAs. Cell Rep. 2013, 4, 255–261. [Google Scholar] [CrossRef]
- Fricke, M.; Gerst, R.; Ibrahim, B.; Niepmann, M.; Marz, M. Global importance of RNA secondary structures in protein-coding sequences. Bioinformatics 2019, 35, 579–583. [Google Scholar] [CrossRef]
- Tuorto, F.; Liebers, R.; Musch, T.; Schaefer, M.; Hofmann, S.; Kellner, S.; Frye, M.; Helm, M.; Stoecklin, G.; Lyko, F. “RNA cytosine methylation by DNMT2 and NSUN2 promotes tRNA stability and protein synthesis. Nat. Struct. Mol. Biol. 2012, 19, 900–905. [Google Scholar] [CrossRef]
- Abelson, H.T.; Johnson, L.F.; Penman, S.; Green, H. Changes in RNA in relation to growth of the fibroblast: II. The lifetime of mRNA, rRNA, and tRNA in resting and growing cells. Cell 1974, 1, 161–165. [Google Scholar] [CrossRef]
- Dai, W.; Li, A.; Yu, N.J.; Nguyen, T.; Leach, R.W.; Wühr, M.; Kleiner, R.E. Activity-based RNA-modifying enzyme probing reveals DUS3L-mediated dihydrouridylation. Nat. Chem. Biol. 2021, 17, 1178–1187. [Google Scholar] [CrossRef] [PubMed]
- Okano, H.; Imai, T.; Okabe, M. Musashi: A translational regulator of cell fate. J. Cell Sci. 2002, 115, 1355–1359. [Google Scholar] [CrossRef] [PubMed]
- Onishi, H.; Kino, Y.; Morita, T.; Futai, E.; Sasagawa, N.; Ishiuradoi, S. MBNL1 associates with YB-1 in cytoplasmic stress granules. J. Neurosci. Res. 2008, 86, 1994–2002. [Google Scholar] [CrossRef]
- Matsuki, H.; Takahashi, M.; Higuchi, M.; Makokha, G.N.; Oie, M.; Fujii, M. Both G3BP1 and G3BP2 contribute to stress granule formation. Genes Cells 2013, 18, 135–146. [Google Scholar] [CrossRef]
- Makarov, E.M.; Owen, N.; Bottrill, A.; Makarova, O.V. Functional mammalian spliceosomal complex E contains SMN complex proteins in addition to U1 and U2 snRNPs. Nucleic Acids Res. 2012, 40, 2639–2652. [Google Scholar] [CrossRef] [PubMed]
- Kargapolova, Y.; Levin, M.; Lackner, K.; Danckwardt, S. sCLIP-an integrated platform to study RNA-Protein interactomes in biomedical research: Identification of CSTF2tau in alternative processing of small nuclear RNAs. Nucleic Acids Res. 2017, 45, 6074–6086. [Google Scholar] [CrossRef]
- Gopanenko, A.V.; Kolobova, A.V.; Meschaninova, M.I.; Venyaminova, A.G.; Tupikin, A.E.; Kabilov, M.R.; Malygin, A.A.; Karpova, G.G. “Knockdown of the ribosomal protein eL29 in mammalian cells leads to significant changes in gene expression at the transcription level. Cells 2020, 9, 1228. [Google Scholar] [CrossRef]
- Babaylova, E.S.; Gopanenko, A.V.; Tupikin, A.E.; Kabilov, M.R.; Malygin, A.A.; Karpova, G.G. Deficiency of the ribosomal protein uL5 leads to significant rearrangements of the transcriptional and translational landscapes in mammalian cells. Int. J. Mol. Sci. 2021, 22, 13485. [Google Scholar] [CrossRef]
- Ahmed, M.; Kim, D.R. PCR: An R package for quality assessment, analysis and testing of qPCR data. PeerJ 2018, 6, e4473. [Google Scholar] [CrossRef] [Green Version]


Publisher’s Note: MDPI stays neutral with regard to jurisdictional claims in published maps and institutional affiliations. |
© 2022 by the authors. Licensee MDPI, Basel, Switzerland. This article is an open access article distributed under the terms and conditions of the Creative Commons Attribution (CC BY) license (https://creativecommons.org/licenses/by/4.0/).
Share and Cite
Kossinova, O.A.; Gopanenko, A.V.; Babaylova, E.S.; Tupikin, A.E.; Kabilov, M.R.; Malygin, A.A.; Karpova, G.G. Reorganization of the Landscape of Translated mRNAs in NSUN2-Deficient Cells and Specific Features of NSUN2 Target mRNAs. Int. J. Mol. Sci. 2022, 23, 9740. https://doi.org/10.3390/ijms23179740
Kossinova OA, Gopanenko AV, Babaylova ES, Tupikin AE, Kabilov MR, Malygin AA, Karpova GG. Reorganization of the Landscape of Translated mRNAs in NSUN2-Deficient Cells and Specific Features of NSUN2 Target mRNAs. International Journal of Molecular Sciences. 2022; 23(17):9740. https://doi.org/10.3390/ijms23179740
Chicago/Turabian StyleKossinova, Olga A., Alexander V. Gopanenko, Elena S. Babaylova, Alexey E. Tupikin, Marsel R. Kabilov, Alexey A. Malygin, and Galina G. Karpova. 2022. "Reorganization of the Landscape of Translated mRNAs in NSUN2-Deficient Cells and Specific Features of NSUN2 Target mRNAs" International Journal of Molecular Sciences 23, no. 17: 9740. https://doi.org/10.3390/ijms23179740
APA StyleKossinova, O. A., Gopanenko, A. V., Babaylova, E. S., Tupikin, A. E., Kabilov, M. R., Malygin, A. A., & Karpova, G. G. (2022). Reorganization of the Landscape of Translated mRNAs in NSUN2-Deficient Cells and Specific Features of NSUN2 Target mRNAs. International Journal of Molecular Sciences, 23(17), 9740. https://doi.org/10.3390/ijms23179740