
Nanopore Sequencing for De Novo Bacterial Genome Assembly and Search for Single-Nucleotide Polymorphism

 , , , , and
Abstract
:
1. Introduction
2. Results and Discussion
2.1. Characterization of Samples
2.2. Genomic Rearrangements
2.3. Single Nucleotide Variations
3. Materials and Methods
3.1. Characterization of Strains
3.2. Resistant Clones Obtaining by Spontaneous Mutagenesis
3.3. Minimal Inhibition Concentration Measurement
3.4. Genomic DNA Extraction
3.5. DNA Quality Control after Purification
3.6. Nanopore Sequencing
3.7. Data Analysis
4. Conclusions
Author Contributions
Funding
Informed Consent Statement
Data Availability Statement
Acknowledgments
Conflicts of Interest
Appendix A
- Set a heating block to 55 °C, and place the vial with Elution Buffer in the heating block.
- Add to the sample
- 400 μL of Lysis Solution AS,
- 5 μL of RNase A,
- 10 μL of Proteinase K. Mix well.
- Incubate the tubes at 55 °C for 10 min with vortexing 2 times:
- 0 s (samples were mixed gently without vortexing),
- 5 s,
- 10 s,
- 30 s.
- Add 300 μL of Sorption Solution to the sample. Mix 2 times:
- 0 s (samples were mixed gently without vortexing),
- 5 s,
- 10 s,
- 30 s.
- Place a spin column in a collection tube. Add the lysate to the column. Centrifuge the column for 45 s. Discard the collection tube and place the spin column into a clean collection tube.
- Add 500 μL of Wash Solution A, centrifuge the column for 30 s. Discard the collection tube and place the spin column into a clean collection tube.
- Add 500 μL of Wash Solution B, centrifuge the column for 3 min. Discard the collection tube.

| Sample Vortexing Time | 0 s | 5 s | 10 s | 30 s |
|---|---|---|---|---|
| Mean read length (gel electrophoresis), bp | 13,101.7 ± 72.4 | 12,851.1 ± 167.5 | 13,021.5 ± 51.4 | 12,942.5 ± 121.1 |
References
- Zhang, P.; Jiang, D.; Wang, Y.; Yao, X.; Luo, Y.; Yang, Z. Comparison of De Novo Assembly Strategies for Bacterial Genomes. Int. J. Mol. Sci. 2021, 22, 7668. [Google Scholar] [CrossRef]
- Kumar, K.R.; Cowley, M.J.; Davis, R.L. Next-Generation Sequencing and Emerging Technologies. Semin. Thromb. Hemost. 2019, 45, 661–673. [Google Scholar] [CrossRef] [PubMed]
- Lu, H.; Giordano, F.; Ning, Z. Oxford Nanopore MinION Sequencing and Genome Assembly. Genom. Proteom. Bioinform. 2016, 14, 265–279. [Google Scholar] [CrossRef] [PubMed] [Green Version]
- Loman, N.J.; Quick, J.; Simpson, J.T. A complete bacterial genome assembled de novo using only nanopore sequencing data. Nat. Methods 2015, 12, 733–735. [Google Scholar] [CrossRef]
- Chen, Z.; Erickson, D.L.; Meng, J. Benchmarking hybrid assembly approaches for genomic analyses of bacterial pathogens using Illumina and Oxford Nanopore sequencing. BMC Genom. 2020, 21, 631. [Google Scholar] [CrossRef]
- Gao, Y.; Ma, L.; Liu, G.E. Initial Analysis of Structural Variation Detections in Cattle Using Long-Read Sequencing Methods. Genes 2022, 13, 828. [Google Scholar] [CrossRef] [PubMed]
- Alili, R.; Belda, E.; Le, P.; Wirth, T.; Zucker, J.-D.; Prifti, E.; Clément, K. Exploring Semi-Quantitative Metagenomic Studies Using Oxford Nanopore Sequencing: A Computational and Experimental Protocol. Genes 2021, 12, 1496. [Google Scholar] [CrossRef]
- Fatima, N.; Petri, A.; Gyllensten, U.; Feuk, L.; Ameur, A. Evaluation of Single-Molecule Sequencing Technologies for Structural Variant Detection in Two Swedish Human Genomes. Genes 2020, 11, 1444. [Google Scholar] [CrossRef] [PubMed]
- Begum, G.; Albanna, A.; Bankapur, A.; Nassir, N.; Tambi, R.; Berdiev, B.K.; Akter, H.; Karuvantevida, N.; Kellam, B.; Alhashmi, D.; et al. Long-Read Sequencing Improves the Detection of Structural Variations Impacting Complex Non-Coding Elements of the Genome. Int. J. Mol. Sci. 2021, 22, 2060. [Google Scholar] [CrossRef] [PubMed]
- Maestri, S.; Maturo, M.G.; Cosentino, E.; Marcolungo, L.; Iadarola, B.; Fortunati, E.; Rossato, M.; Delledonne, M. A Long-Read Sequencing Approach for Direct Haplotype Phasing in Clinical Settings. Int. J. Mol. Sci. 2020, 21, 9177. [Google Scholar] [CrossRef] [PubMed]
- Liao, Y.-C.; Cheng, H.-W.; Wu, H.-C.; Kuo, S.-C.; Lauderdale, T.-L.Y.; Chen, F.-J. Completing Circular Bacterial Genomes With Assembly Complexity by Using a Sampling Strategy From a Single MinION Run With Barcoding. Front. Microbiol. 2019, 10, 2068. [Google Scholar] [CrossRef] [PubMed]
- Ferreira, F.A.; Helmersen, K.; Visnovska, T.; Jørgensen, S.B.; Aamot, H.V. Rapid nanopore-based DNA sequencing protocol of antibiotic-resistant bacteria for use in surveillance and outbreak investigation. Microb. Genom. 2021, 7, 000557. [Google Scholar] [CrossRef] [PubMed]
- Long, H.; Miller, S.F.; Strauss, C.; Zhao, C.; Cheng, L.; Ye, Z.; Griffin, K.; Te, R.; Lee, H.; Chen, C.-C.; et al. Antibiotic treatment enhances the genome-wide mutation rate of target cells. Proc. Natl. Acad. Sci. USA 2016, 113, E2498–E2505. [Google Scholar] [CrossRef] [PubMed] [Green Version]
- Kennedy, S.; Rice, D.A.; Cush, P.F. Neuropathology of experimental 3-nitro-4-hydroxyphenylarsonic acid toxicosis in pigs. Vet. Pathol. 1986, 23, 454–461. [Google Scholar] [CrossRef] [Green Version]
- Available online: https://www.ncbi.nlm.nih.gov/genome/167?genome_assembly_id=1819718 (accessed on 8 January 2022).
- Baba, T.; Ara, T.; Hasegawa, M.; Takai, Y.; Okumura, Y.; Baba, M.; Datsenko, K.A.; Tomita, M.; Wanner, B.L.; Mori, H. Construction of Escherichia coli K-12 in-frame, single-gene knockout mutants: The Keio collection. Mol. Syst. Biol. 2006, 2, 2006.0008. [Google Scholar] [CrossRef] [Green Version]
- Maithani, D.; Sharma, A.; Gangola, S.; Chaudhary, P.; Bhatt, P. Insights into applications and strategies for discovery of microbial bioactive metabolites. Microbiol. Res. 2022, 261, 127053. [Google Scholar] [CrossRef]
- Wilson, D.N. Ribosome-targeting antibiotics and mechanisms of bacterial resistance. Nat. Rev. Microbiol. 2014, 12, 35–48. [Google Scholar] [CrossRef]
- Li, F.; Handsaker, B.; Wysoker, A.; Fennell, T.; Ruan, J.; Homer, N.; Marth, G.; Abecasis, G.; Durbin, R. 1000 Genome Project Data Processing Subgroup. The Sequence Alignment/Map format and SAMtools. Bioinformatics 2009, 25, 2078–2079. [Google Scholar] [CrossRef] [Green Version]
- Danecek, P.; Bonfield, J.K.; Liddle, J.; Marshall, J.; Ohan, V.; Pollard, M.O.; Whitwham, A.; Keane, T.; McCarthy, S.A.; Davies, R.M.; et al. Twelve years of SAMtools and BCFtools. Gigascience 2021, 10, giab008. [Google Scholar] [CrossRef]
- Li, H. Minimap2: Pairwise alignment for nucleotide sequences. Bioinformatics 2018, 34, 3094–3100. [Google Scholar] [CrossRef]
- Li, H. New strategies to improve minimap2 alignment accuracy. Bioinformatics 2021, 37, 4572–4574. [Google Scholar] [CrossRef] [PubMed]
- Shafin, K.; Pesout, T.; Lorig-Roach, R.; Haukness, M.; Olsen, H.E.; Bosworth, C.; Armstrong, J.; Tigyi, K.; Maurer, N.; Koren, S.; et al. Nanopore sequencing and the Shasta toolkit enable efficient de novo assembly of eleven human genomes. Nat. Biotechnol. 2020, 38, 1044–1053. [Google Scholar] [CrossRef] [PubMed]
- Koren, S.; Walenz, B.P.; Berlin, K.; Miller, J.R.; Bergman, N.H.; Phillippy, A.M. Canu: Scalable and accurate long-read assembly via adaptive k-mer weighting and repeat separation. Genome Res. 2017, 27, 722–736. [Google Scholar] [CrossRef] [PubMed] [Green Version]
- Chen, Y.; Nie, F.; Xie, S.-Q.; Zheng, Y.-F.; Dai, Q.; Bray, T.; Wang, Y.-X.; Xing, J.-F.; Huang, Z.-J.; Wang, D.-P.; et al. Efficient assembly of nanopore reads via highly accurate and intact error correction. Nat. Commun. 2021, 12, 60. [Google Scholar] [CrossRef]
- Kolmogorov, M.; Yuan, J.; Lin, Y.; Pevzner, P.A. Assembly of long, error-prone reads using repeat graphs. Nat. Biotechnol. 2019, 37, 540–546. [Google Scholar] [CrossRef]
- Kolmogorov, M.; Bickhart, D.M.; Behsaz, B.; Gurevich, A.; Rayko, M.; Shin, S.B.; Kuhn, K.; Yuan, J.; Polevikov, E.; Smith, T.P.L.; et al. metaFlye: Scalable long-read metagenome assembly using repeat graphs. Nat. Methods 2020, 17, 1103–1110. [Google Scholar] [CrossRef]
- Medaka: Sequence Correction Provided by ONT Research. Available online: https://github.com/nanoporetech/medaka (accessed on 8 January 2022).
- Timms, A.R.; Steingrimsdottir, H.; Lehmann, A.R.; Bridges, B.A. Mutant sequences in the rpsL gene of Escherichia coli B/r: Mechanistic implications for spontaneous and ultraviolet light mutagenesis. Mol. Gen. Genet. MGG 1992, 232, 89–96. [Google Scholar] [CrossRef]
- Van Acken, U. Proteinchemical studies on ribosomal proteins S4 and S12 from ram (ribosomal ambiguity) mutants of Escherichia coli. Mol. Gen. Genet. MGG 1975, 140, 61–68. [Google Scholar] [CrossRef]
- Bjorkman, J.; Samuelsson, P.; Andersson, D.I.; Hughes, D. Novel ribosomal mutations affecting translational accuracy, antibiotic resistance and virulence of Salmonella typhimurium. Mol. Microbiol. 1999, 31, 53–58. [Google Scholar] [CrossRef]
- Wick, R.R.; Judd, L.M.; Holt, K.E. Performance of neural network basecalling tools for Oxford Nanopore sequencing. Genome Biol. 2019, 20, 129. [Google Scholar] [CrossRef] [Green Version]
- Robinson, J.T.; Thorvaldsdóttir, H.; Winckler, W.; Guttman, M.; Lander, E.S.; Getz, G.; Mesirov, J.P. Integrative genomics viewer. Nat. Biotechnol. 2011, 29, 24–26. [Google Scholar] [CrossRef] [Green Version]
- Alikhan, N.-F.; Petty, N.K.; Ben Zakour, N.L.; Beatson, S.A. BLAST Ring Image Generator (BRIG): Simple prokaryote genome comparisons. BMC Genom. 2011, 12, 402. [Google Scholar] [CrossRef] [Green Version]
- Lin, H.-N.; Hsu, W.-L. GSAlign: An efficient sequence alignment tool for intra-species genomes. BMC Genom. 2020, 21, 182. [Google Scholar] [CrossRef]
- Murigneux, V.; Roberts, L.W.; Forde, B.M.; Phan, M.-D.; Nhu, N.T.K.; Irwin, A.D.; Harris, P.N.A.; Paterson, D.L.; Schembri, M.A.; Whiley, D.M.; et al. MicroPIPE: Validating an end-to-end workflow for high-quality complete bacterial genome construction. BMC Genom. 2021, 22, 474. [Google Scholar] [CrossRef] [PubMed]
- Moss, E.L.; Maghini, D.G.; Bhatt, A.S. Complete, closed bacterial genomes from microbiomes using nanopore sequencing. Nat. Biotechnol. 2020, 38, 701–707. [Google Scholar] [CrossRef] [Green Version]
- Sanders, C.I.; Ne Ville, C.J.; Orwin, P.M. Complete Genome Sequences of Four Isolated Bacteria from an Undergraduate Microbiology Course Using a Hybrid Assembly Approach. Microbiol. Resour. Announc. 2022, 11, e01022-21. [Google Scholar] [CrossRef]


| Sample | T1 | T2 | T3 | T4 | T5 |
|---|---|---|---|---|---|
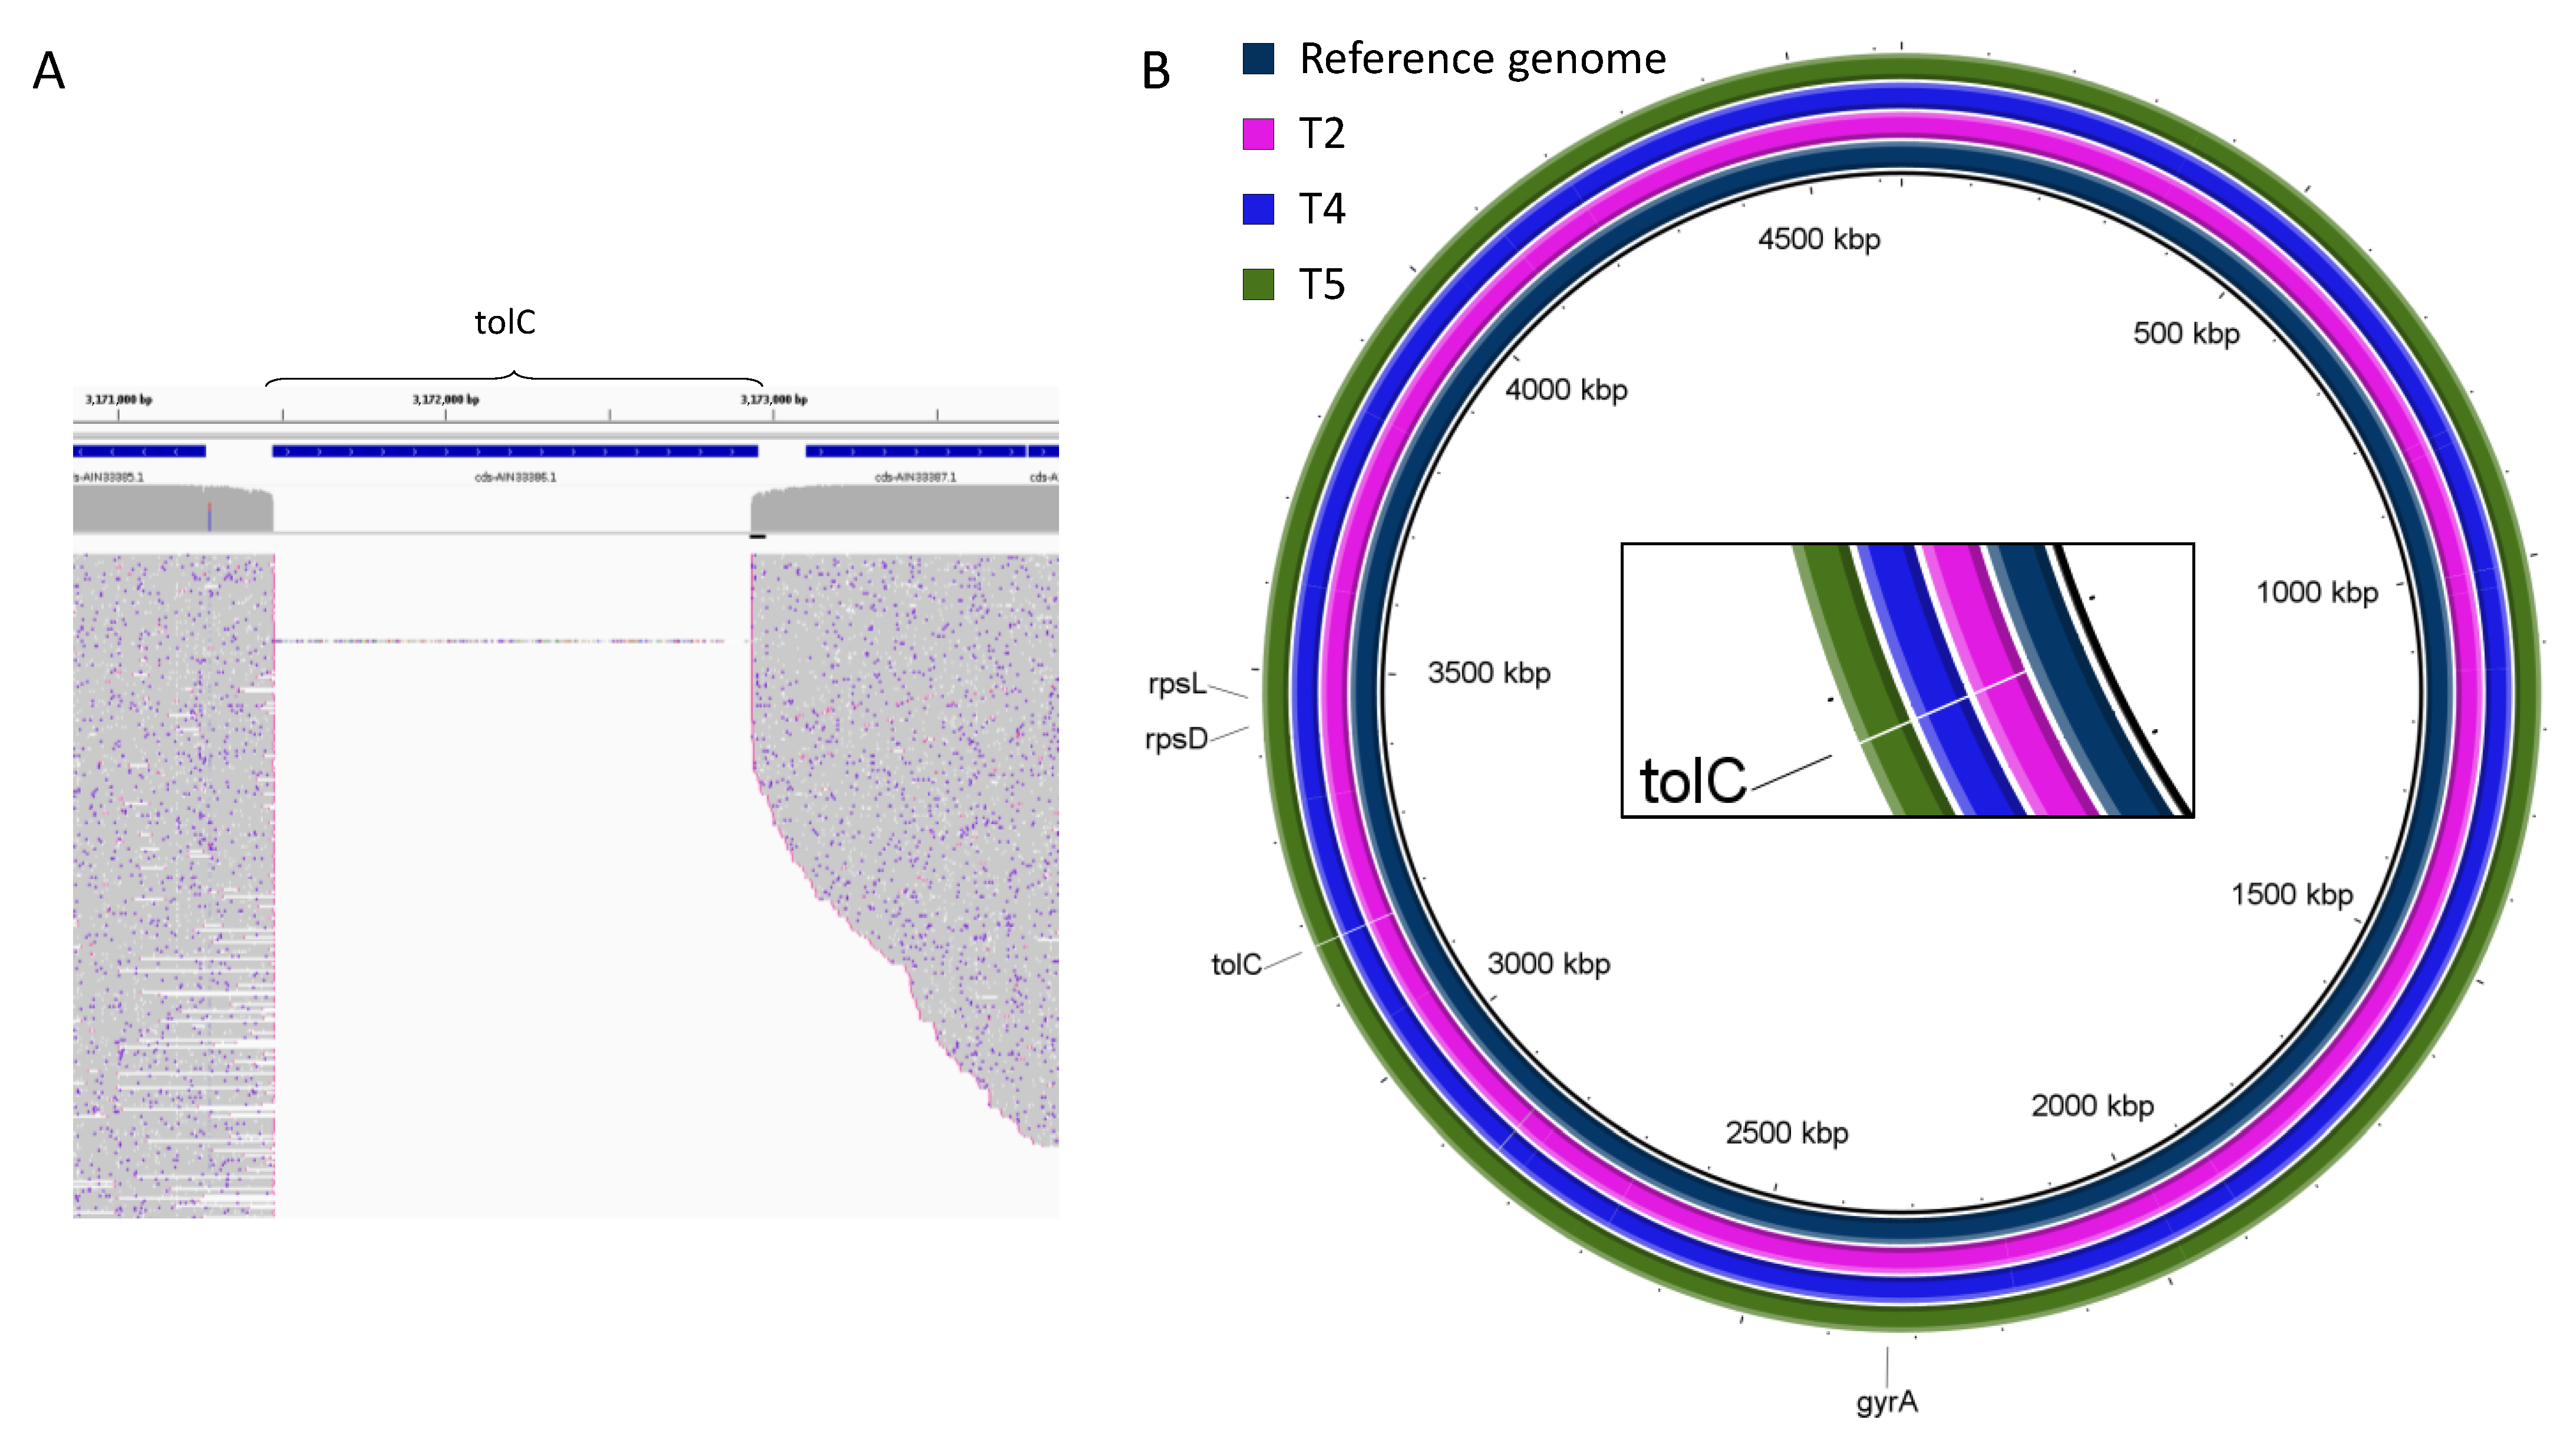
| Deletion | tolC | tolC | tolC | tolC | tolC |
| Gene with SNV | - | - | gyrA | rpsL | rpsL, rpsD |
| Total bases, Mbp | 4377.9 | 1952.1 | 114.8 | 663.5 | 831.7 |
| Number of reads | 3,888,954 | 935,363 | 62,748 | 70,397 | 97,636 |
| Mean coverage | 952× | 424× | 25× | 144× | 181× |
| Mean read length (ONT data), bp | 1126 | 2087 | 1829 | 9425 | 8518 |
| Mean read length (gel electrophoresis), bp | 12,000 | 12,759 | 12,916 | 13,244 | 13,255 |
| Sample | Gene | SNV and Its Coordinate | Fraction | Coverage Depth (Error Probability) | SNV in De Novo Genomes, Yes/No |
|---|---|---|---|---|---|
| T3 | gyrA | 248: C → T | 1 | 21× (0.01%) | 1/0 |
| T4 | rpsL | 272: C → T | 1 | 150× (0.5%) | 1/0 |
| 1/2 | 92× (3%), 58× (1%) | 2/0 | |||
| 1/4 | 50× (0.2%), 42× (0.7%), 31× (1%), 27× (0.3%) | 3/1 | |||
| 1/8 | 27× (0.3%), 23× (1%), 22× (2%), 20× (3%), 16× (5%), 15× (0.6%), 9× (28%),- | 5/3 | |||
| T5 | rpsD | 599: T → A | 1 | 165× (0.001%) | 1/0 |
| 1/2 | 91× (0.006%), 74× (0.002%) | 2/0 | |||
| 1/4 | 53× (0.01%), 45× (0.002%), 38× (0.01%), 29× (0.02%) | 4/0 | |||
| 1/8 | 26× (0.01%), 24× (0.01%), 17× (0.01%), 21× (0.004%), 15× (0.02%),-,-,- | 8/0 | |||
| T5 | rpsL | 272: C → T | 1 | 171× (0.4%) | 1/0 |
| 1/2 | 96× (1%), 75× (0.3%) | 2/0 | |||
| 1/4 | 50× (0.6%), 46× (2%), 41× (3%), 33× (3%) | 4/0 | |||
| 1/8 | 27× (5%), 27× (1%), 25× (2%), 23x (2%), 20× (5%), 19× (45%), -, - | 5/3 |
Publisher’s Note: MDPI stays neutral with regard to jurisdictional claims in published maps and institutional affiliations. |
© 2022 by the authors. Licensee MDPI, Basel, Switzerland. This article is an open access article distributed under the terms and conditions of the Creative Commons Attribution (CC BY) license (https://creativecommons.org/licenses/by/4.0/).
Share and Cite
Khrenova, M.G.; Panova, T.V.; Rodin, V.A.; Kryakvin, M.A.; Lukyanov, D.A.; Osterman, I.A.; Zvereva, M.I. Nanopore Sequencing for De Novo Bacterial Genome Assembly and Search for Single-Nucleotide Polymorphism. Int. J. Mol. Sci. 2022, 23, 8569. https://doi.org/10.3390/ijms23158569
Khrenova MG, Panova TV, Rodin VA, Kryakvin MA, Lukyanov DA, Osterman IA, Zvereva MI. Nanopore Sequencing for De Novo Bacterial Genome Assembly and Search for Single-Nucleotide Polymorphism. International Journal of Molecular Sciences. 2022; 23(15):8569. https://doi.org/10.3390/ijms23158569
Chicago/Turabian StyleKhrenova, Maria G., Tatiana V. Panova, Vladimir A. Rodin, Maxim A. Kryakvin, Dmitrii A. Lukyanov, Ilya A. Osterman, and Maria I. Zvereva. 2022. "Nanopore Sequencing for De Novo Bacterial Genome Assembly and Search for Single-Nucleotide Polymorphism" International Journal of Molecular Sciences 23, no. 15: 8569. https://doi.org/10.3390/ijms23158569
APA StyleKhrenova, M. G., Panova, T. V., Rodin, V. A., Kryakvin, M. A., Lukyanov, D. A., Osterman, I. A., & Zvereva, M. I. (2022). Nanopore Sequencing for De Novo Bacterial Genome Assembly and Search for Single-Nucleotide Polymorphism. International Journal of Molecular Sciences, 23(15), 8569. https://doi.org/10.3390/ijms23158569