Article

Bile Acid–Drug Interaction via Organic Anion-Transporting Polypeptide 4C1 Is a Potential Mechanism of Altered Pharmacokinetics of Renally Excreted Drugs

1
Faculty of Pharmaceutical Sciences, Tohoku University, Sendai 980-8578, Japan
2
Department of Pharmaceutical Sciences, Tohoku University Hospital, Sendai 980-8574, Japan
3
Department of Pharmacy, Yamagata University Hospital, Yamagata 990-9585, Japan
4
Graduate School of Medical Science, Yamagata University, Yamagata 990-9585, Japan
5
Division of Nephrology, Endocrinology, and Vascular Medicine, Graduate School of Medicine, Tohoku University, Sendai 980-8574, Japan
6
Division of Medical Science, Graduate School of Biomedical Engineering, Tohoku University, Sendai 980-8579, Japan
7
Department of Clinical Biology and Hormonal Regulation, Graduate School of Medicine, Tohoku University, Sendai 980-8575, Japan
*
Author to whom correspondence should be addressed.
These authors contributed equally to this work.
Int. J. Mol. Sci. 2022, 23(15), 8508; https://doi.org/10.3390/ijms23158508
Submission received: 8 July 2022 / Revised: 27 July 2022 / Accepted: 29 July 2022 / Published: 31 July 2022
(This article belongs to the Collection State-of-the-Art Molecular Endocrinology and Metabolism in Japan)

Abstract

:
Patients with liver diseases not only experience the adverse effects of liver-metabolized drugs, but also the unexpected adverse effects of renally excreted drugs. Bile acids alter the expression of renal drug transporters, however, the direct effects of bile acids on drug transport remain unknown. Renal drug transporter organic anion-transporting polypeptide 4C1 (OATP4C1) was reported to be inhibited by chenodeoxycholic acid. Therefore, we predicted that the inhibition of OATP4C1-mediated transport by bile acids might be a potential mechanism for the altered pharmacokinetics of renally excreted drugs. We screened 45 types of bile acids and calculated the IC50, Ki values, and bile acid–drug interaction (BDI) indices of bile acids whose inhibitory effect on OATP4C1 was >50%. From the screening results, lithocholic acid (LCA), glycine-conjugated lithocholic acid (GLCA), and taurine-conjugated lithocholic acid (TLCA) were newly identified as inhibitors of OATP4C1. Since the BDI index of LCA was 0.278, LCA is likely to inhibit OATP4C1-mediated transport in clinical settings. Our findings suggest that dose adjustment of renally excreted drugs may be required in patients with renal failure as well as in patients with hepatic failure. We believe that our findings provide essential information for drug development and safe drug treatment in clinics.

1. Introduction

In clinical practice, liver and renal functions are used as indices for dose determination of liver-metabolized and renally excreted drugs, respectively. Nevertheless, adverse events occur due to the elevation of plasma drug concentrations, even after considering the patients’ conditions, including the liver and kidney function tests [1]. One of the reported causes is uremic toxins which accumulate in the blood of patients with renal failure, thus affecting hepatic drug transport and metabolism [2,3] and altering the dynamics of liver-metabolized drugs in patients with renal failure.
However, only limited reports have described the mechanism underlying altered dynamics of renally excreted drugs in patients with liver failure. In these patients, the plasma concentration of bile acids significantly increases. Renal drug transporters in the proximal tubular cells are essential for the elimination of some renally excreted drugs [4]. The expressions of renal transporters such as organic anion transporter (OAT) 1, OAT3, multidrug resistance-associated protein (MRP) 2, and MRP4 were altered in a cholestatic model [5,6,7,8]. However, the effect of bile acid–drug interaction (BDI) on renal drug transporters has not been investigated.
Bile acids, the major components of bile, are amphipathic steroidal molecules synthesized from cholesterol [9] that facilitate the absorption of lipids, lipid-soluble nutrients, and drugs [9]. Bile acids also play a critical role in essential physiological functions such as glucose metabolism [10], cholesterol metabolism [11,12,13,14], cellular immunity [15,16], and energy homeostasis [17]. The dynamics of bile acids are regulated by the enterohepatic circulation, in which they are synthesized in the hepatocytes, excreted into the intestine via the bile duct, reabsorbed in the ileum, and returned to hepatocytes via the portal vein. Approximately 95% of bile acids remain in the enterohepatic circulation; however, bile acids that escape from reabsorption in the ileum are lost in the feces or they are minimally transferred to the systemic circulation and excreted into the urine by the kidney [18]. The deposition of bile acids is regulated by transporters such as Na+-taurocholate cotransporting polypeptide (NTCP) [19,20,21], organic anion-transporting polypeptide (OATP) 1B1 [19,20,21], OATP1B3 [19,20,21], bile salt export pump [22,23], apical sodium-dependent bile acid transporter [21,24,25], and organic solute transporter α/β [26,27]. Recently, glycochenodeoxycholic acid 3-sulfate (GCDCA-3S) has been reported as a marker of drug interactions with OATP1B1 and OATP1B3 [28]. Since bile acids interact with several drug transporters, BDIs on renal drug transporters were expected.
OATP4C1 is the only member of the OATP family expressed in the kidneys. It localizes to the basolateral membrane of the renal proximal tubular cells and is involved in the excretion of thyroid hormone [29], cyclic adenosine monophosphate [29], uremic toxins [30,31,32,33], cardiac glycosides (ouabain and digoxin) [29,34,35], methotrexate [29], and sitagliptin [36] into the urine. We have previously shown that 10 drugs, namely, nicardipine, spironolactone, fluvastatin, crizotinib, levofloxacin, clarithromycin, ritonavir, saquinavir, quinidine, and verapamil, strongly inhibited OATP4C1 [37]. Moreover, OATP4C1 is responsible for the uptake of remdesivir in the renal proximal tubular cells [38]. Thus, OATP4C1 is recognized as a new player in drug handling within the kidneys. Since Yamaguchi et al. [39] reported that the bile acid chenodeoxycholic acid (CDCA) inhibits OATP4C1-mediated transport, we predicted that other bile acids might interact with OATP4C1. Thus, we hypothesized that the altered dynamics of renally excreted drugs in patients with liver failure may be attributed to the interaction of bile acids with drug transporters, especially OATP4C1.
The aim of our study is to assess the effect of bile acids on OATP4C1-mediated transport to clarify the mechanisms underlying the altered dynamics of renally excreted drugs in patients with liver failure. The findings of this study will aid in dose adjustment of renally excreted drugs not only for patients with renal failure but also for those with liver failure.

2. Results

2.1. Screening of the Inhibitory Effect of Bile Acids on OATP4C1-Mediated Transport

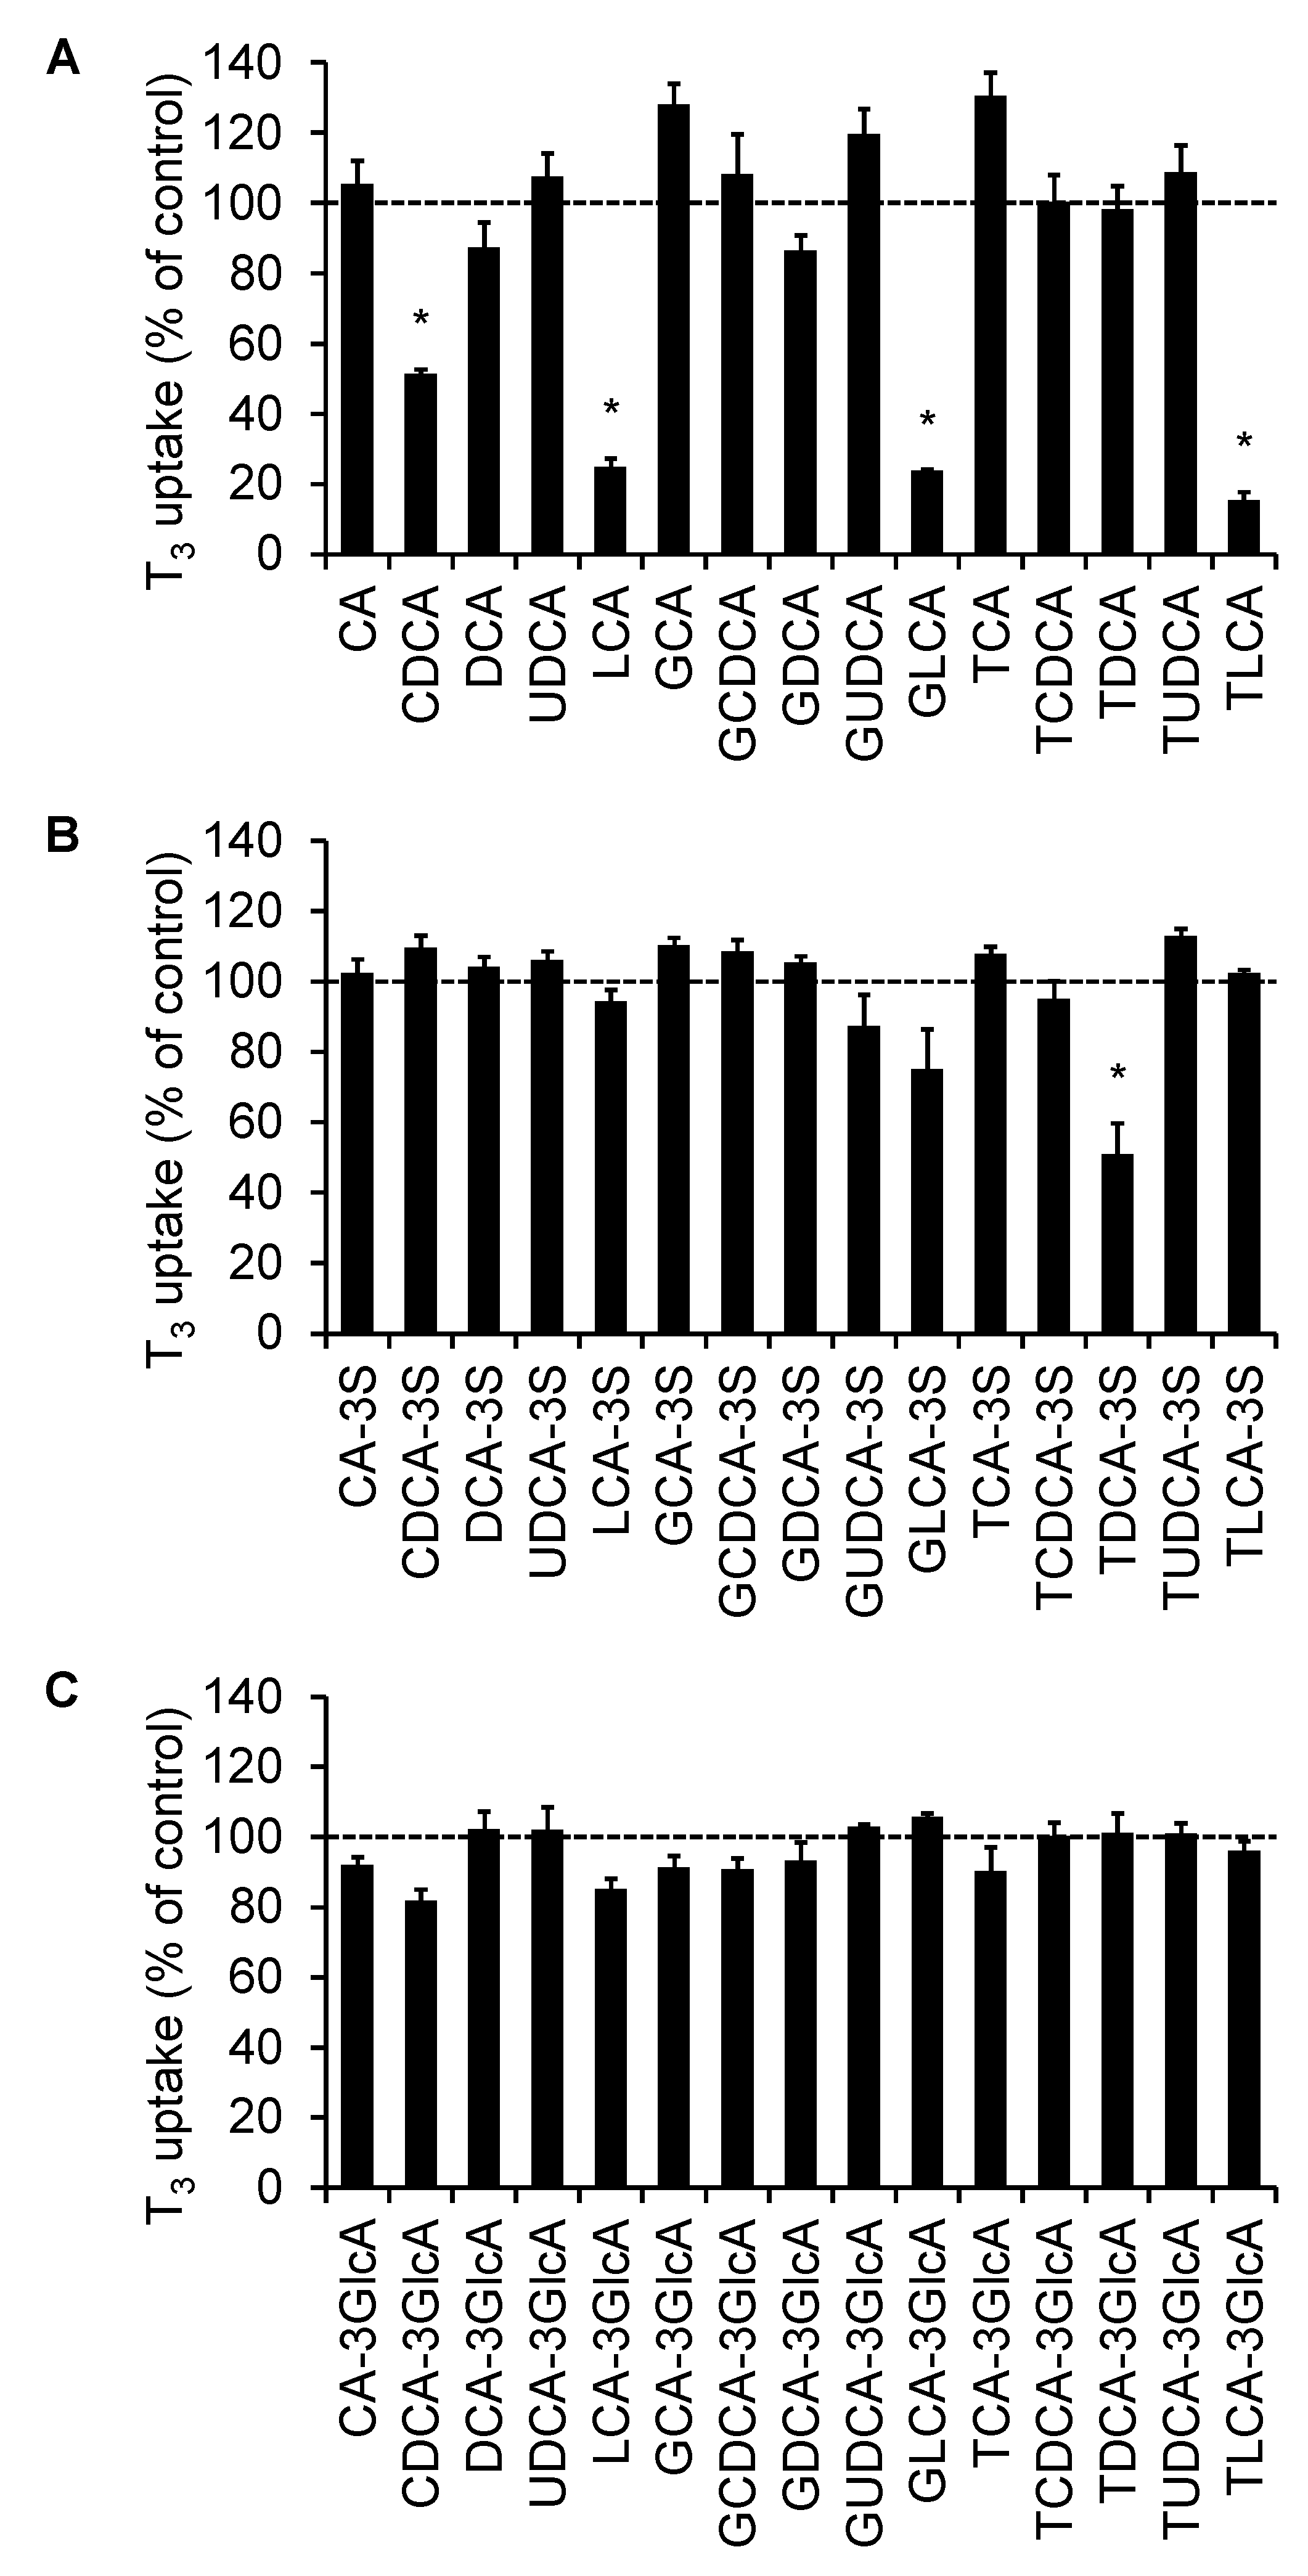
To determine whether bile acids affected the OATP4C1-mediated transport, OATP4C1-overexpressing cells were used. The effect of 45 bile acids (Figure 1) was measured on T3 transport via OATP4C1. The screening concentrations of bile acids were 50 µM for CA-3S, LCA-3S, TDCA-3S, LCA-3-glucuronide (LCA-3GlcA), and GLCA-3GlcA and 100 µM for the other 40 types of bile acids. Although most bile acids did not exhibit inhibitory effects, CDCA (positive control) significantly inhibited the OATP4C1-mediated T3 transport by 49.8%. In addition, LCA, GLCA, TLCA, and TDCA-3S showed significant inhibition on the OATP4C1-mediated T3 transport (75.2, 76.3, 84.7, and 49.1%, respectively) (Figure 2).

2.2. The Concentration-Dependent Inhibitory Effect of Bile Acids

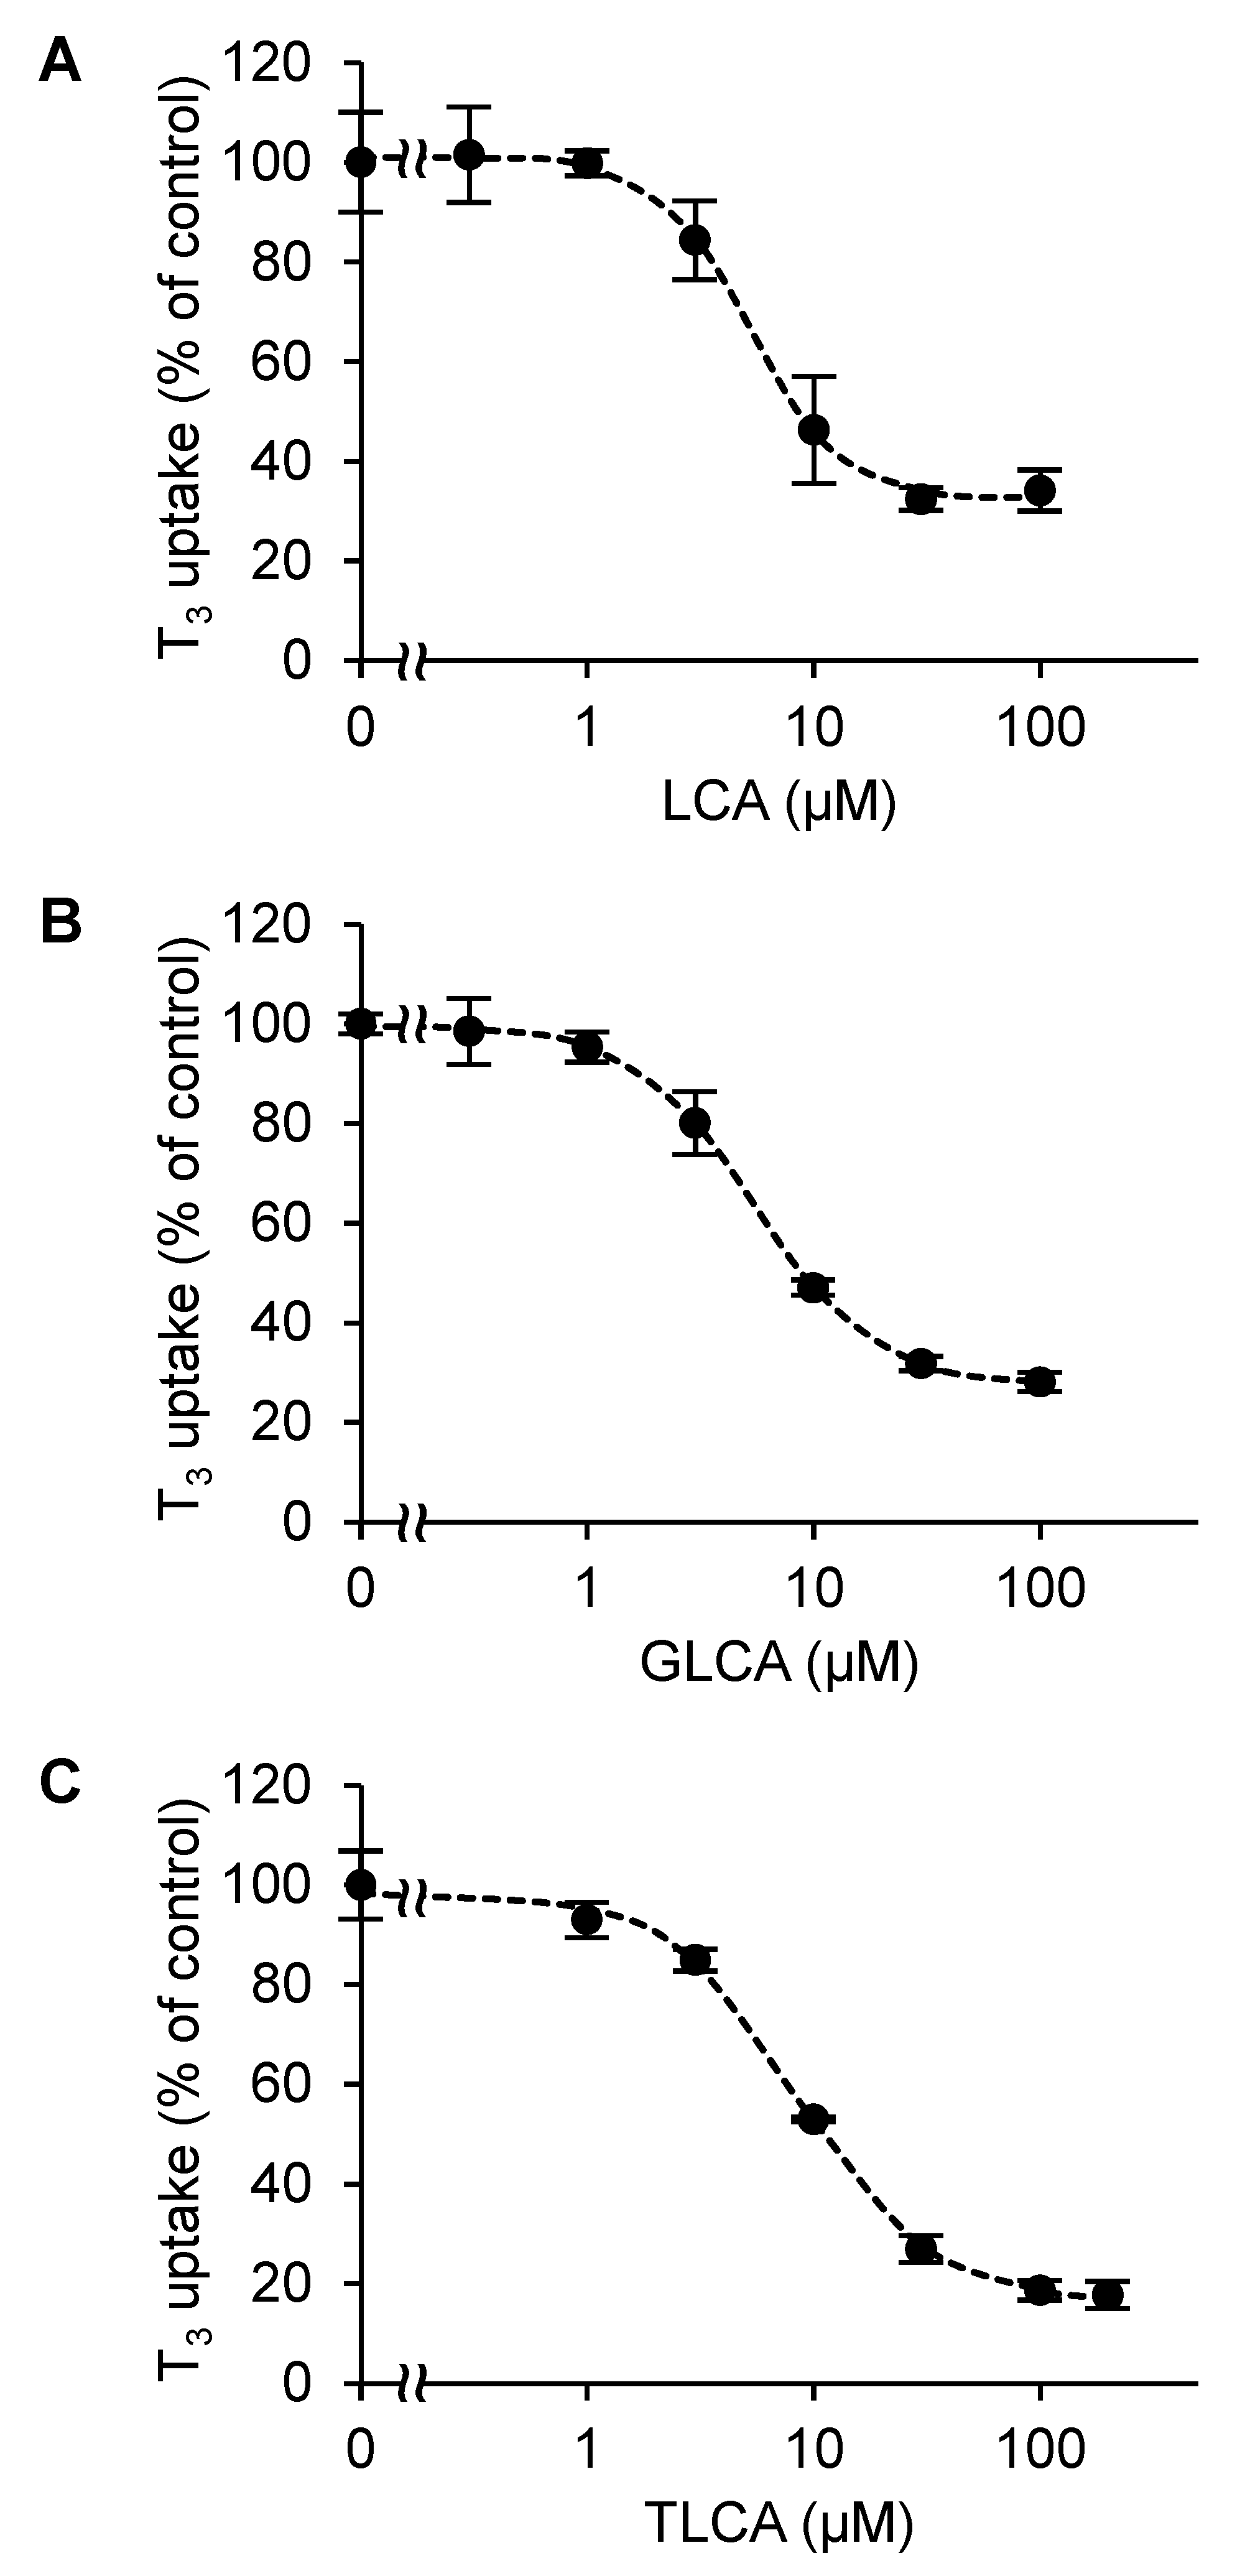
Since LCA, GLCA, and TLCA showed more than 50% inhibition of the OATP4C1-mediated T3 transport, we examined whether this inhibitory effect was concentration-dependent. The activity of the transporter was investigated at six different concentrations (0.3, 1, 3, 10, 30, and 100 µM for LCA and GLCA, and 1, 3, 10, 30, 100, and 200 µM for TLCA), and the data were plotted. All these bile acids resulted in a concentration-dependent inhibition of the OATP4C1-mediated T3 transport. The inhibition curves were drawn using JMP Pro 16, and the IC50 values of LCA, GLCA, and TLCA for OATP4C1 were 6.12 ± 1.21, 9.90 ± 0.475, and 12.3 ± 0.891 µM, respectively (Figure 3). The Ki values of these bile acids calculated using Equation (1) were 5.23 ± 1.03 µM for LCA, 8.46 ± 0.406 µM for GLCA, and 10.5 ± 0.762 µM for TLCA (Table 1).

2.3. Calculation of the BDI Index

To determine the influence of the inhibition of these bile acids on the clinical situation, the BDI indices were calculated by referring to the DDI index using the maximum available concentration of bile acids in the blood. The concentrations of bile acids used to calculate the BDI index are summarized in Table 2. The maximum BDI index of LCA, which showed the strongest inhibition of the OATP4C1-mediated T3 transport, was 0.278. Meanwhile, the BDI indices of GLCA and TLCA for the OATP4C1-mediated T3 uptake were 0.00982 and 0.00554, respectively (Table 2). LCA showed the highest BDI index for the inhibition of the OATP4C1-mediated T3 uptake of the three bile acids; thus, LCA–drug interaction via the renal drug transporter OATP4C1 may occur in patients with liver failure.

2.4. Effect of Bile Acids on Cell Viability

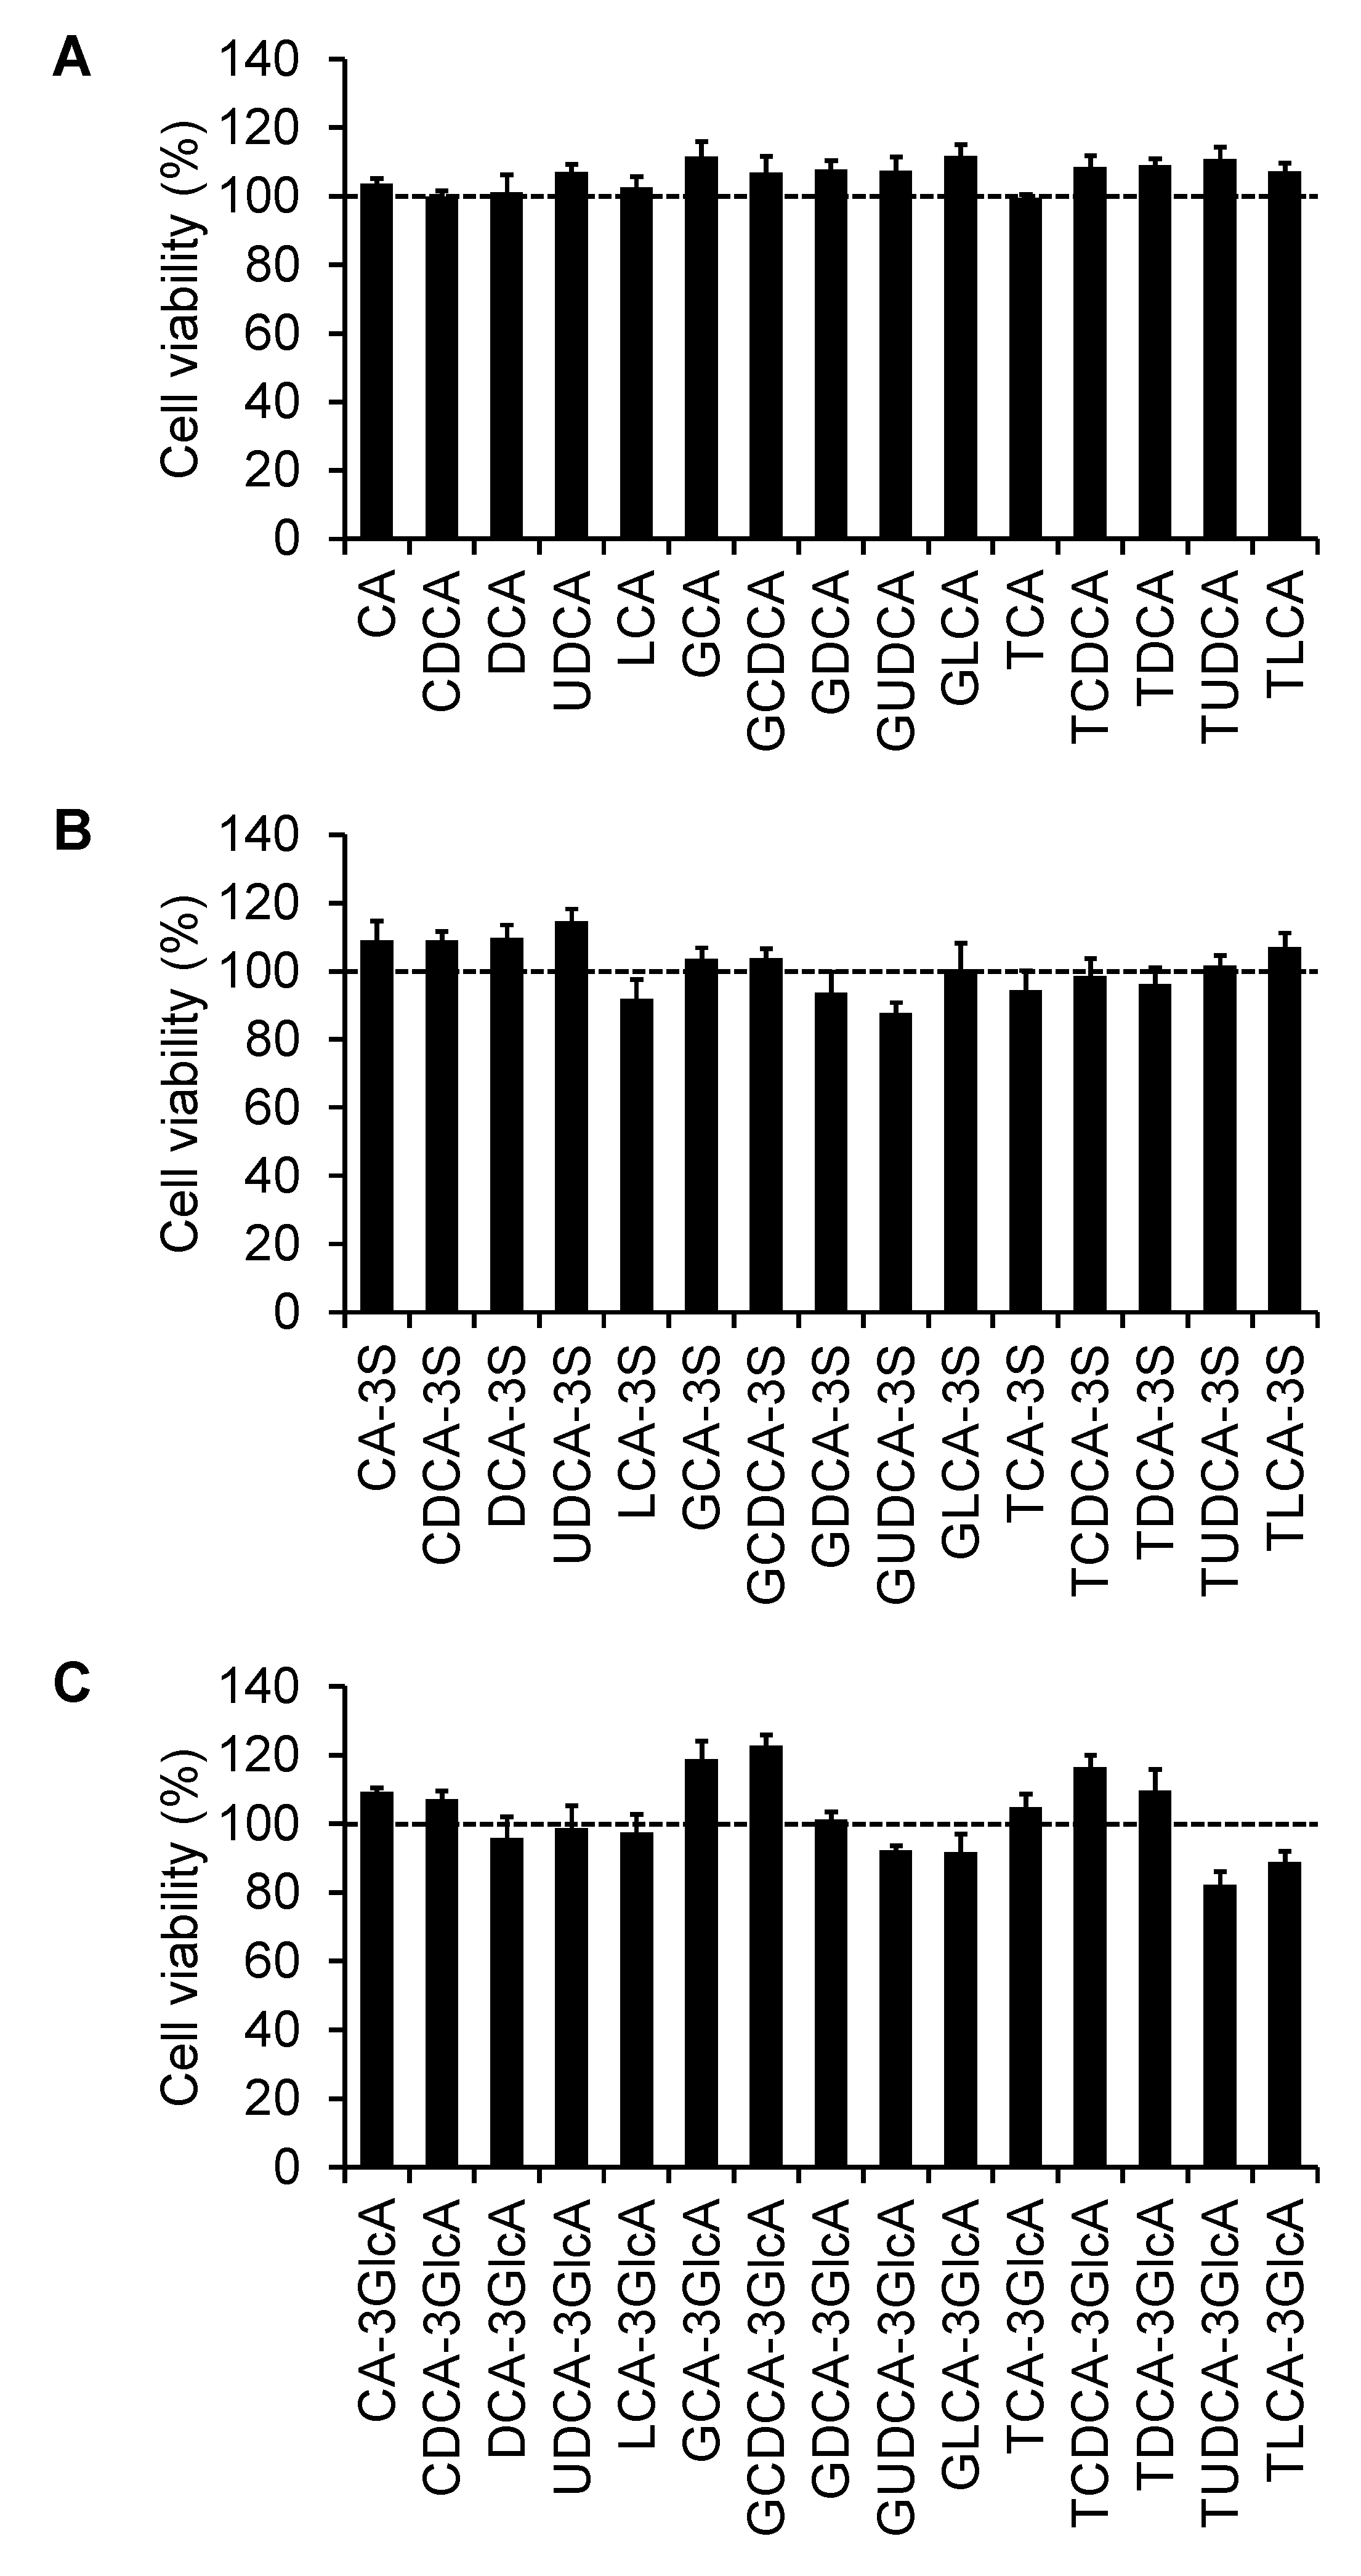
To confirm that the inhibitory effect of bile acids on the OATP4C1-mediated T3 transport was not due to cell toxicity, the cellular viability was assessed in the presence of bile acids. The cells were incubated for 10 min with the bile acids using the same concentrations used for screening and the viability was evaluated. The 45 examined bile acids did not affect the cell viability (Figure 4). Moreover, TLCA did not induce cellular toxicity at 200 µM, which was the maximum concentration used in the concentration-dependent study (data not shown). Therefore, the observed decrease in T3 transport is due to the direct interaction between bile acids and OATP4C1.

3. Discussion

Renal failure affects the dynamics of liver-metabolized drugs by elevating the levels of plasma uremic toxins [2,3]. In liver diseases, bile acids accumulate in the systemic circulation and alter the expression of renal drug transporters that are essential for the excretion of renally excreted drugs [5,6,7,8]. However, the relationship between bile acids and the altered dynamics of renally excreted drugs remains unknown. Bile acids were reported as markers of drug interaction with OATP1B1 and OATP1B3 [28]. Yamaguchi et al. [39] showed that the bile acid CDCA inhibits the renal drug transporter OATP4C1. Based on these reports, we hypothesized that the altered dynamics of renally excreted drugs in patients with liver failure may be due to the BDIs via drug transporters, especially OATP4C1.
In this study, we assessed the effect of bile acids on OATP4C1-mediated transport to elucidate the reason behind the alterations in the dynamics of renally excreted drugs in patients with liver failure. To our knowledge, this is the first report to clarify and summarize the interaction between bile acids and OATP4C1-mediated transport. We screened the effects of 45 types of bile acids on OATP4C1-mediated transport and calculated the IC50 and Ki values of bile acids having an inhibitory effect greater than 50%. We also evaluated the possibility of occurrence of the inhibition of these bile acids in the clinical situation using BDI indices.
First, the effect of 45 types of bile acids on the OATP4C1-mediated transport was investigated; OATP4C1 is the only member of the OATP family that is expressed in the kidneys. The screening results conformed with previous reports, wherein CDCA inhibited the OATP4C1-mediated transport. LCA, GLCA, and TLCA were newly identified as strong inhibitors of the OATP4C1-mediated transport. GLCA and TLCA are the 24-glycine and taurine conjugates of LCA, respectively. On the other hand, the LCA 3-conjugates, namely LCA-3S and LCA-3GlcA, did not inhibit the OATP4C1-mediated transport. Thus, the position and direction of the hydroxyl groups bound to the steroid skeleton could influence the inhibitory effect of bile acids. Next, we evaluated whether the inhibitory effect of bile acids was concentration-dependent. Our results revealed that LCA, GLCA, and TLCA inhibited the OATP4C1-mediated T3 transport in a concentration-dependent manner. The IC50 values of LCA, GLCA, and TLCA were 6.12, 9.90, and 12.3 µM, respectively, while the Ki values were 5.23, 8.46, and 10.5 µM, respectively. Although some bile acids induce cell toxicity [43], the inhibitory effects of the bile acids used in this study on the OATP4C1-mediated T3 transport were not mediated through decreasing cellular viability.
Thereafter, we determined whether LCA, GLCA, and TLCA inhibited the OATP4C1-mediated T3 transport in a clinical setting. Using the blood concentrations of these bile acids of patients with liver disease as a reference, the BDI indices were calculated. For patients with intrahepatic cholestasis of pregnancy, the serum LCA level was 1.7 ± 0.5 µM [40], while the serum GLCA levels were 42.14 ± 133.29 ng/mL (0.0972 µM) in patients with alcoholic liver disease (ALD) [41], 69.6 ± 59.7 nM for patients with severe drug-induced liver injury [44], and 26.80 ± 68.74 ng/mL (0.0618 µM) for patients with primary biliary cirrhosis [41]. Greco et al. [42] reported that the serum TLCA level in patients with post-hepatitis liver cirrhosis was 0.033 ± 0.017 µg/mL (0.0682 µM), while Zhang et al. [45] reported that the plasma TLCA level was 0.020 ± 0.015 µM for patients with cholangiocarcinoma, 0.014 ± 0.013 µM for patients with hepatocellular carcinoma, and 0.010 ± 0.008 µM for patients with gallbladder cancer. Sang et al. [41] reported that the serum TLCA level was 13.63 ± 32.54 ng/mL (0.0282 µM) in patients with ALD. The BDI indices for LCA, GLCA, and TLCA were calculated as 0.278, 0.00982, and 0.00554, respectively. Brites et al. [40] reported that the maximum concentration of serum LCA was 6.0 µM; hence, the BDI index of LCA may reach 0.980. Since 0.1 was suggested as the cutoff value for the DDI index by the regulatory authorities [37], the BDI index for LCA was considered significant, whereas GLCA and TLCA exhibited negligible BDI indices. Meanwhile, the BDI indices obtained in our study were the maximum values, while the IC50 values of bile acids were used instead of the Ki values based on previous reports [37]. Our results showed a slight difference between the Ki and IC50 values since we used a lower concentration of T3 in comparison with the Km value. Therefore, the BDI indices calculated using the IC50 values in this study are reliable. To calculate the exact BDI indices, the protein-binding rates of bile acids should be considered. LCA barely interacts with OATP4C1 under normal conditions in healthy individuals because it binds to serum albumin [46,47,48]. However, the protein-binding rate of drugs in patients with liver failure decreases due to the reduction in albumin synthesis, decline in albumin activity, or conformational changes in albumin [49,50,51]. Hence, the protein-binding rate of LCA may decrease in patients with liver disease. LCA also binds to lipoproteins, such as low-density lipoprotein and high-density lipoprotein [47], which are known to function as carriers of drugs, including antidepressants and antiarrhythmic agents [52]. These drugs may compete for lipoprotein binding under conditions of lower serum albumin levels. Thus, free LCA levels are likely to increase due to the blocking of lipoprotein binding by the unbound drugs, which exist at high levels in patients with liver disease. When the ratio of unbound LCA increases in patients with liver failure, an interaction between LCA and OATP4C1 may occur according to the calculated BDI index. Accordingly, the BDI indices calculated in the present study can be useful for predicting BDIs via OATP4C1 in patients with liver failure. To evaluate the clinical significance of BDI via OATP4C1, an in vivo study using an animal model will be required in the future. Moreover, further in vitro studies to clarify BDI via renal drug transporters (OATs, etc.) are required.
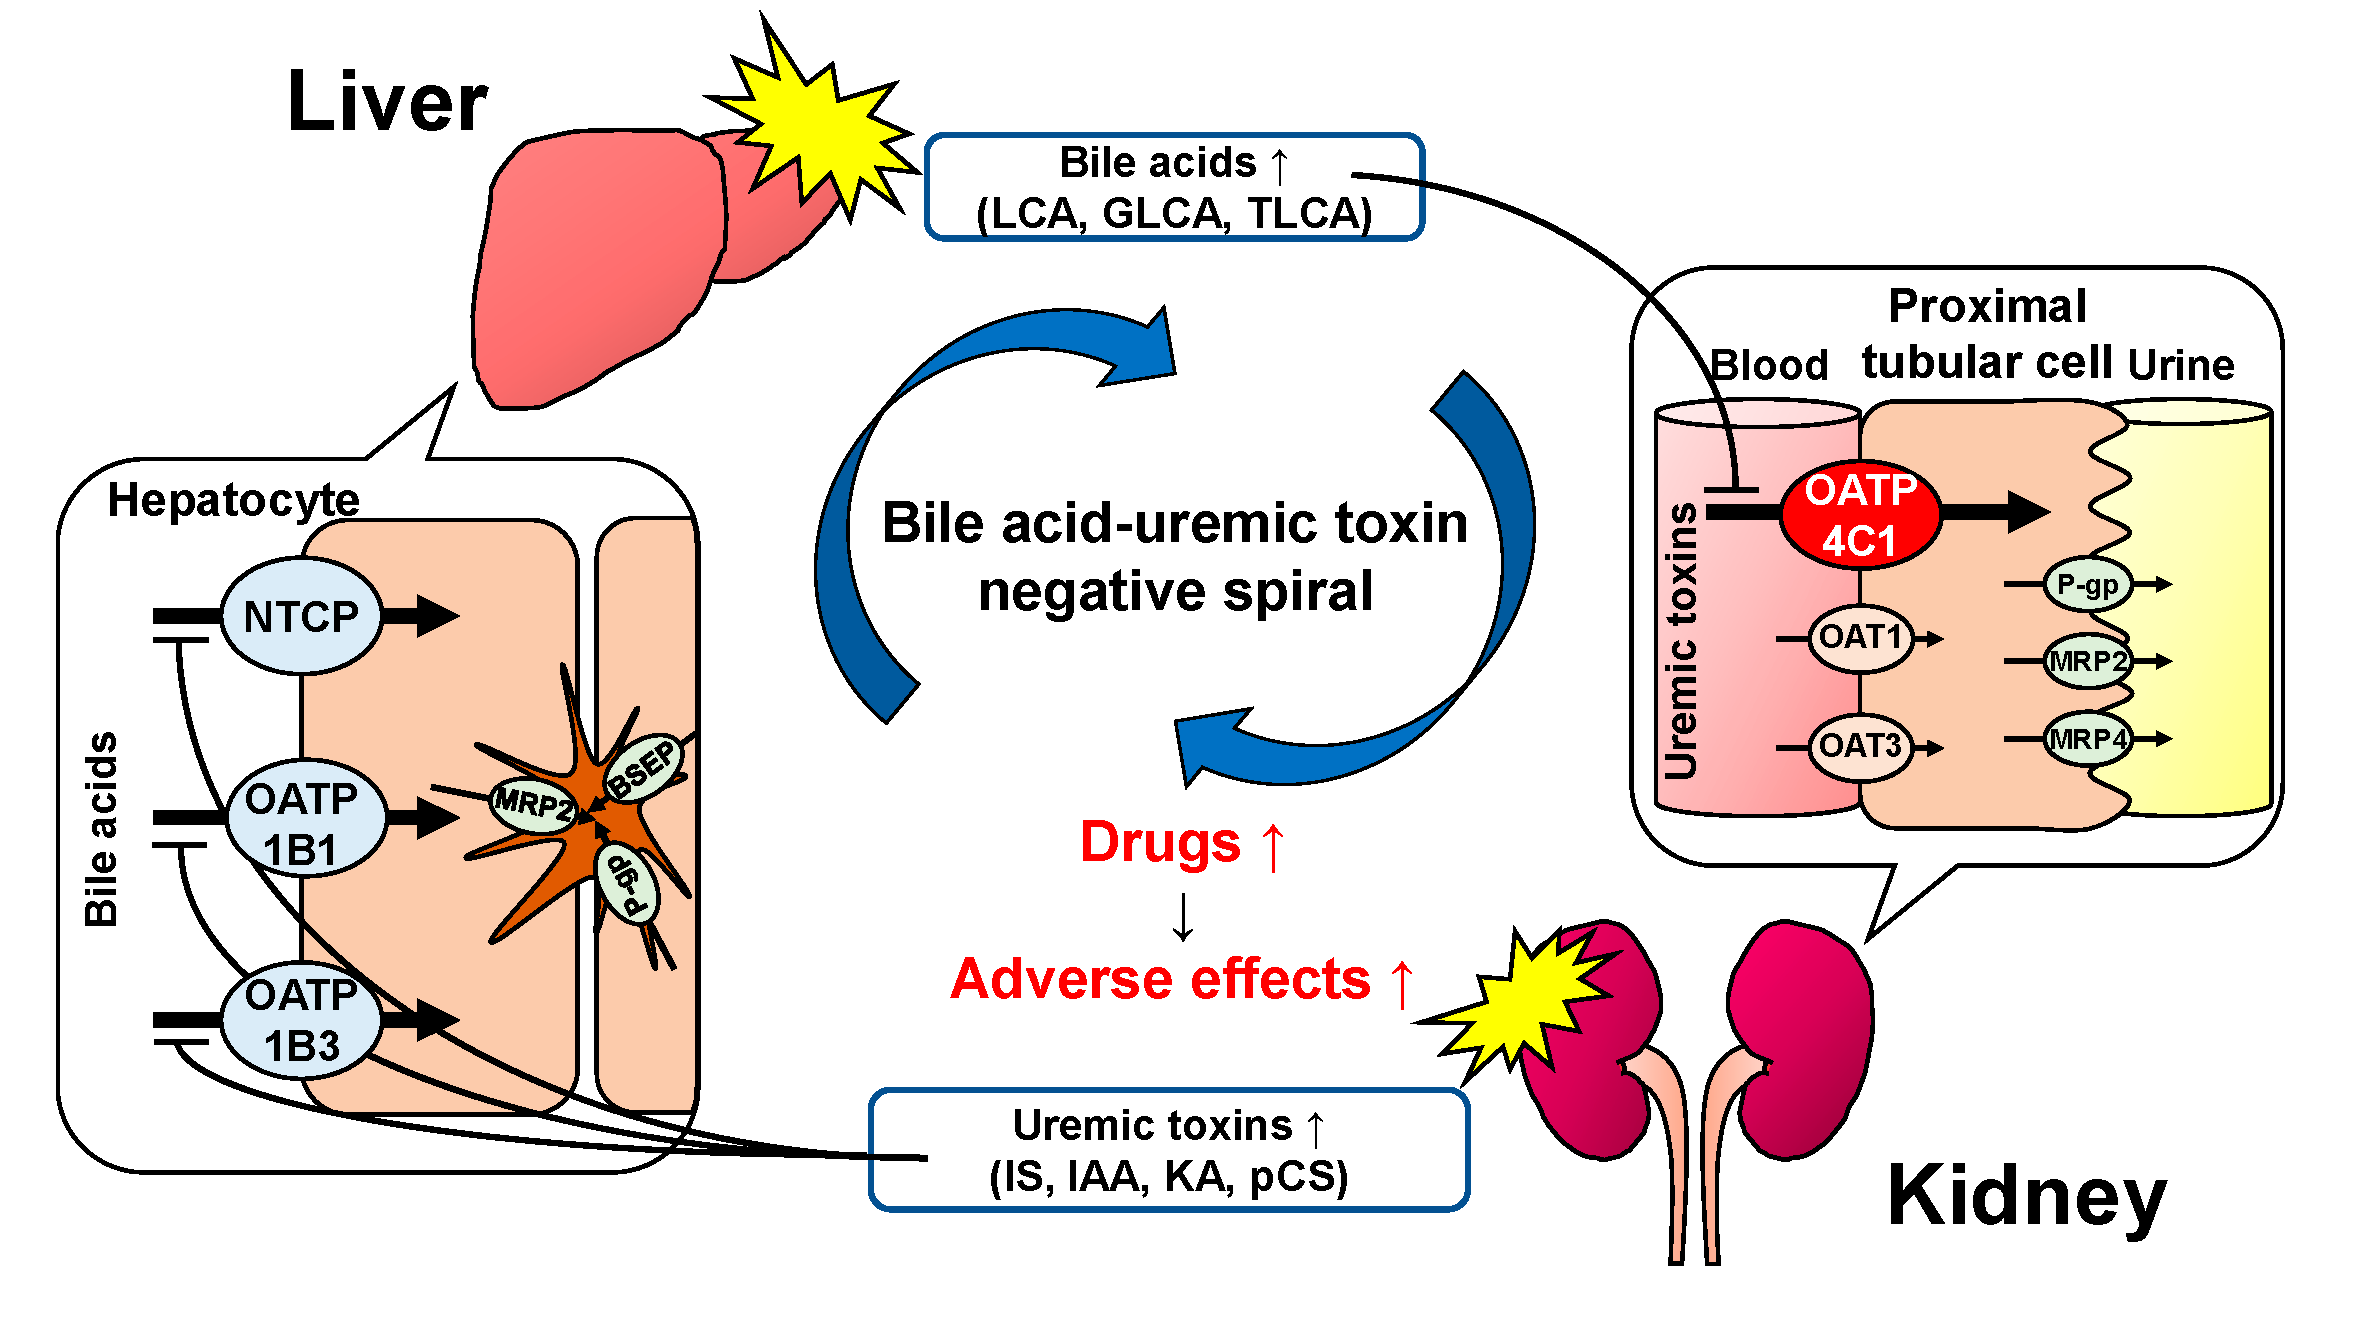
OATP4C1 is involved in the excretion of uremic toxins that accumulate in the blood of patients with renal failure [30]. Moreover, renal transporters, including OATP4C1, are downregulated in renal failure [53]. Our previous study [54], in addition to another report [55], revealed that the elevated uremic toxins in the blood inhibited the hepatic transporters OATP1B1, OATP1B3, and NTCP, which regulate the bile acid dynamics. As the present study revealed that the bile acids inhibited the OATP4C1-mediated transport, it may cause the accumulation of uremic toxins. This resulted in the inhibition of bile acid uptake into hepatocytes with a further increase in bile acids in the blood. Thus, the inhibition of OATP4C1 and hepatic bile acid transporters leads to the accumulation of uremic toxins and bile acids. We named this negative spiral as the “bile acid–uremic toxin negative spiral” (Figure 5) that occurs not only in patients with renal failure but also in patients with liver disease. However, further studies are required to confirm this hypothesis.

4. Materials and Methods

4.1. Materials

Cholic acid (CA), CDCA, and taurine-conjugated lithocholic acid (TLCA) were purchased from Sigma-Aldrich (St. Louis, MO, USA). Deoxycholic acid (DCA) and LCA were purchased from FUJIFILM Wako Pure Chemical Corporation (Osaka, Japan). Triiodothyronine (T3), Cell Count Reagent SF, glycine-conjugated ursodeoxycholic acid (GUDCA), taurine-conjugated cholic acid (TCA), ursodeoxycholic acid (UDCA), taurine-conjugated ursodeoxycholic acid (TUDCA), and TCA-3S were purchased from Nacalai Tesque, Inc. (Kyoto, Japan). UDCA-3S was purchased from Alsachim (Illkirch-Graffenstaden, France). Glycine-conjugated cholic acid (GCA), GCDCA, glycine-conjugated deoxycholic acid (GDCA), glycine-conjugated lithocholic acid (GLCA), taurine-conjugated chenodeoxycholic acid (TCDCA), taurine-conjugated deoxycholic acid (TDCA), and GCA-3S were previously synthesized in our laboratory [56]. All the other 27 bile acids, not available in the market, were kindly provided by the Junshin Clinic Bile Acid Institute (Tokyo, Japan). All other chemicals were commercially available and had the highest possible purities.

4.2. Cell Culture

MDCKII cells transfected with OATP4C1 or an empty vector were previously established in our laboratory [39]. OATP4C1/MDCKII and mock cells were cultured in Dulbecco’s modified Eagle’s medium supplemented with 10% fetal bovine serum (GibcoTM, Thermo Fisher Scientific Inc., Waltham, MA, USA) and G418 (0.5 mg/mL, Nacalai Tesque, Inc., Kyoto, Japan) at 37 °C under 5% CO2 and 95% humidified air.

4.3. Transport Study

The cellular uptake of T3 was measured in monolayer cell cultures grown in 24-well plates. Cells were seeded at a density of 2.0 × 10⁵ cells/well. Thereafter, they were incubated for 24 h in a culture medium containing 5 mM sodium butyrate before the uptake study. The cells were washed once, followed by preincubation in Krebs–Henseleit (KH) buffer (118 mM NaCl, 23.8 mM NaHCO3, 4.83 mM KCl, 0.96 mM KH2PO4, 1.20 mM MgSO4, 12.5 mM N-(2-hydroxyethyl) piperazine-N’-2-ethanesulfonic acid, 5.0 mM D-glucose, and 1.53 mM CaCl2; pH 7.4). Cellular uptake was initiated by adding KH buffer containing T3 with or without each bile acid. The uptake was terminated after 10 min by replacing the incubation buffer with ice-cold KH buffer. The cells were then washed twice with ice-cold KH buffer. The concentration of T3 was measured using liquid chromatography/tandem mass spectrometry. The cellular uptake was presented as the uptake amount divided by the cellular protein amount quantified by the Bradford protein assay. The experiment was performed in triplicate (n = 3) and was repeated three times.
All bile acids were dissolved in dimethyl sulfoxide (DMSO) and the final concentration of DMSO was less than 0.5%.

4.4. Sample Preparation

The cells were scraped and homogenized in 200 µL of water after the uptake was terminated. Deproteinization was performed by adding equal volumes of acetonitrile containing pravastatin as the internal standard. After vortexing, the mixture was centrifuged at 15,000× g for 5 min at 20 °C, and the supernatant was measured.

4.5. Liquid Chromatography/Tandem Mass Spectrometry (LC/MS/MS) Condition

LC/MS/MS was used to measure the T3 concentrations. For chromatographic separation, a Shimadzu Nexera HPLC System (Shimadzu Corporation, Kyoto, Japan) was used with a Cosmosil 5C18-MS-II column (Nacalai Tesque, Inc.). The mobile phase was water/acetonitrile (70:30, v/v), containing 0.1% acetic acid at a flow rate of 0.2 mL/min. The column temperature was maintained at 40 °C and the sample injection volume was 5 µL.
Mass spectrometric analysis was performed using an API 5000 (Sciex LLC, Framingham, MA, USA) tandem mass spectrometer. The T3 concentration was measured in negative ion mode. Selected reaction monitoring was performed and m/z 650 > 127 for T3 and m/z 423 > 101 for pravastatin were acquired. The collected data were analyzed using Analyst software (version 1.5, SCIEX LLC, Framingham, MA, USA).

4.6. Inhibitory Effect of Bile Acids

We investigated the concentration dependence of bile acids, which resulted in more than 50% inhibition of OATP4C1-mediated T3 uptake. The inhibition curve was fitted to the Rodbard model. The half-maximum inhibitory concentration (IC50) values of the bile acids were calculated using JMP Pro 16 (SAS Institute Inc., Cary, NC, USA). We then acquired the absolute inhibitory constant (Ki) using the following equation (Equation (1)) [57], where [S] is the substrate concentration and Km is the Michaelis–Menten constant. The experiment was performed in triplicate (n = 3) and was repeated three times.
K i = IC 50 1 + [ S ] K m

4.7. BDI Index Prediction

The BDI index was calculated using the drug–drug interaction (DDI) index equation [37]. To evaluate the BDI index, we used the IC50 values from our in vitro study and the maximum plasma concentration (Cmax) of each bile acid. Then, the possibility of a clinical BDI was predicted to infer the significance of our findings in clinical situations. We used the following equation to calculate the BDI index (Equation (2)) [37].
BDI   index = C max IC 50

4.8. Effect of Bile Acids on Cell Viability

Cell viability in the presence of bile acids was measured in monolayer cell cultures grown in 96-well plates using Cell Count Reagent SF (Nacalai Tesque, Inc.). Cells were seeded at a density of 1.0 × 10⁴ cells/well, and incubated for 24 h in a culture medium containing 5 mM sodium butyrate before the experiment. After washing, the culture medium was replaced with serum-free culture medium containing bile acid. After 10 min, the incubation was terminated by replacing the medium with Cell Count Reagent SF/culture medium (1:10, v/v). The color reaction was performed at 37 °C under 5% CO2 and 95% humidified air for 3 h and the absorbance was determined at 450 nm using Infinite 200 PRO (TECAN Group Ltd., Männedorf, Switzerland). Absorbance at 600 nm was used as the reference. The experiment was performed in quintuplicate (n = 5) and was repeated three times.

4.9. Statistical Analysis

Data are expressed as mean ± standard error of the mean. The one-way analysis of variance (ANOVA) followed by Tukey’s test was performed for multiple statistical comparisons. The data were analyzed using JMP Pro 16 (SAS Institute Inc.). Statistical significance was indicated by p values less than 0.05.

5. Conclusions

Based on the screening results of 45 types of bile acids, LCA, GLCA, and TLCA are newly detected as inhibitors of OATP4C1-mediated T3 transport. Dose adjustment of renally excreted drugs may be required in patients with renal failure as well as those with hepatic failure due to the possible interaction of LCA with OATP4C1 in clinical situations. Our findings provide critical information for drug development and drug therapy safety in clinical settings by preventing unanticipated side effects in patients with renal failure as well as in those with hepatic failure.

Author Contributions

M.Y.; T.S.; Y.S.; M.M.: Participated in research design, M.Y.; T.S.; A.O.: Conducted experiments and data analysis, M.Y.; T.S.; A.O.; M.K. (Masaki Kumondai); Y.S.; M.K. (Masafumi Kikuchi); M.M.; H.Y.; T.A.; N.M.: Manuscript writing and editing. All authors have read and agreed to the published version of the manuscript.

Funding

This research was supported by the Japan Society for the Promotion of Science KAKENHI (Nos. 20K16037 and 22K15311).

Institutional Review Board Statement

Not applicable.

Informed Consent Statement

Not applicable.

Data Availability Statement

Not applicable.

Conflicts of Interest

The authors declare no conflict of interest.

Abbreviations

3GlcA, 3-glucuronide; 3S, 3-sulfate; ALD, alcoholic liver disease; BDI, bile acid–drug interaction; CA, cholic acid; CDCA, chenodeoxycholic acid; Cmax, maximum plasma concentration; DCA, deoxycholic acid; DDI, drug–drug interaction; DMSO, dimethyl sulfoxide; GCA, glycine-conjugated cholic acid; GCDCA, glycine-conjugated chenodeoxycholic acid; GDCA, glycine-conjugated deoxycholic acid; GLCA, glycine-conjugated lithocholic acid; GUDCA, glycine-conjugated ursodeoxycholic acid; IC50, half-maximum inhibitory concentration; Ki, absolute inhibitory constant; LC/MS/MS, liquid chromatography/tandem mass spectrometry; LCA, lithocholic acid; NTCP, Na+-taurocholate cotransporting polypeptide; MRP, multidrug resistance-associated protein; OAT, organic anion transporter; OATP, organic anion-transporting polypeptide; T3, triiodothyronine; TCA, taurine-conjugated cholic acid; TCDCA, taurine-conjugated chenodeoxycholic acid; TDCA, taurine-conjugated deoxycholic acid; TLCA, taurine-conjugated lithocholic acid; TUDCA, taurine-conjugated ursodeoxycholic acid; UDCA, ursodeoxycholic acid.

References

  1. Narisue, M.; Sugimoto, Y.; Shibata, R.; Otsubo, T.; Hirata, S. High Incidence of Adverse Events in Patients with Impaired Renal Function Taking Pregabalin, Even When Dose Is Adjusted for Renal Function. Nihon Toseki Igakkai Zasshi 2015, 48, 155–161. [Google Scholar] [CrossRef] [Green Version]
  2. Fujita, K.; Sunakawa, Y.; Miwa, K.; Akiyama, Y.; Sugiyama, M.; Kawara, K.; Ishida, H.; Yamashita, K.; Mizuno, K.; Saji, S.; et al. Delayed Elimination of SN-38 in Cancer Patients with Severe Renal Failure. Drug Metab. Dispos. 2011, 39, 161–164. [Google Scholar] [CrossRef] [Green Version]
  3. Fujita, K.I.; Masuo, Y.; Okumura, H.; Watanabe, Y.; Suzuki, H.; Sunakawa, Y.; Shimada, K.; Kawara, K.; Akiyama, Y.; Kitamura, M.; et al. Increased Plasma Concentrations of Unbound SN-38, the Active Metabolite of Irinotecan, in Cancer Patients with Severe Renal Failure. Pharm. Res. 2016, 33, 269–282. [Google Scholar] [CrossRef]
  4. Yin, J.; Wang, J. Renal Drug Transporters and Their Significance in Drug-Drug Interactions. Acta Pharm. Sin. B 2016, 6, 363–373. [Google Scholar] [CrossRef] [PubMed] [Green Version]
  5. Brandoni, A.; Villar, S.R.; Picena, J.C.; Anzai, N.; Endou, H.; Torres, A.M. Expression of Rat Renal Cortical OAT1 and OAT3 in Response to Acute Biliary Obstruction. Hepatology 2006, 43, 1092–1100. [Google Scholar] [CrossRef] [PubMed]
  6. Brandoni, A.; Anzai, N.; Kanai, Y.; Endou, H.; Torres, A.M. Renal Elimination of P-Aminohippurate (PAH) in Response to Three Days of Biliary Obstruction in the Rat. The Role of OAT1 and OAT3. Biochim. Biophys. Acta Mol. Basis Dis. 2006, 1762, 673–682. [Google Scholar] [CrossRef] [PubMed] [Green Version]
  7. Tanaka, Y.; Kobayashi, Y.; Gabazza, E.C.; Higuchi, K.; Kamisako, T.; Kuroda, M.; Takeuchi, K.; Iwasa, M.; Kaito, M.; Adachi, Y. Increased Renal Expression of Bilirubin Glucuronide Transporters in a Rat Model of Obstructive Jaundice. Am. J. Physiol. Liver Physiol. 2002, 282, G656–G662. [Google Scholar] [CrossRef] [Green Version]
  8. Denk, G.U.; Soroka, C.J.; Takeyama, Y.; Chen, W.S.; Schuetz, J.D.; Boyer, J.L. Multidrug Resistance-Associated Protein 4 Is up-Regulated in Liver but down-Regulated in Kidney in Obstructive Cholestasis in the Rat. J. Hepatol. 2004, 40, 585–591. [Google Scholar] [CrossRef] [PubMed]
  9. De Aguiar Vallim, T.Q.; Tarling, E.J.; Edwards, P.A. Pleiotropic Roles of Bile Acids in Metabolism. Cell Metab. 2013, 17, 657–669. [Google Scholar] [CrossRef] [Green Version]
  10. Thomas, C.; Gioiello, A.; Noriega, L.; Strehle, A.; Oury, J.; Rizzo, G.; Macchiarulo, A.; Yamamoto, H.; Mataki, C.; Pruzanski, M.; et al. TGR5-Mediated Bile Acid Sensing Controls Glucose Homeostasis. Cell Metab. 2009, 10, 167–177. [Google Scholar] [CrossRef] [Green Version]
  11. Makishima, M.; Okamoto, A.Y.; Repa, J.J.; Tu, H.; Learned, R.M.; Luk, A.; Hull, M.V.; Lustig, K.D.; Mangelsdorf, D.J.; Shan, B. Identification of a Nuclear Receptor for Bite Acids. Science 1999, 284, 1362–1365. [Google Scholar] [CrossRef]
  12. Parks, D.J.; Blanchard, S.G.; Bledsoe, R.K.; Chandra, G.; Consler, T.G.; Kliewer, S.A.; Stimmel, J.B.; Willson, T.M.; Zavacki, A.M.; Moore, D.D.; et al. Bile Acids: Natural Ligands for an Orphan Nuclear Receptor. Science 1999, 284, 1365–1368. [Google Scholar] [CrossRef]
  13. Wang, H.; Chen, J.; Hollister, K.; Sowers, L.C.; Forman, B.M. Endogenous Bile Acids Are Ligands for the Nuclear Receptor FXR/BAR. Mol. Cell 1999, 3, 543–553. [Google Scholar] [CrossRef]
  14. Staudinger, J.L.; Goodwin, B.; Jones, S.A.; Hawkins-Brown, D.; MacKenzie, K.I.; LaTour, A.; Liu, Y.; Klaassen, C.D.; Brown, K.K.; Reinhard, J.; et al. The Nuclear Receptor PXR Is a Lithocholic Acid Sensor That Protects against Liver Toxicity. Proc. Natl. Acad. Sci. USA 2001, 98, 3369–3374. [Google Scholar] [CrossRef] [Green Version]
  15. Kawamata, Y.; Fujii, R.; Hosoya, M.; Harada, M.; Yoshida, H.; Miwa, M.; Fukusumi, S.; Habata, Y.; Itoh, T.; Shintani, Y.; et al. A G Protein-Coupled Receptor Responsive to Bile Acids. J. Biol. Chem. 2003, 278, 9435–9440. [Google Scholar] [CrossRef] [Green Version]
  16. Wang, Y.D.; Chen, W.D.; Yu, D.; Forman, B.M.; Huang, W. The G-Protein-Coupled Bile Acid Receptor, Gpbar1 (TGR5), Negatively Regulates Hepatic Inflammatory Response through Antagonizing Nuclear Factor Kappa Light-Chain Enhancer of Activated B Cells (NF-ΚB) in Mice. Hepatology 2011, 54, 1421–1432. [Google Scholar] [CrossRef] [Green Version]
  17. Watanabe, M.; Houten, S.M.; Mataki, C.; Christoffolete, M.A.; Kim, B.W.; Sato, H.; Messaddeq, N.; Harney, J.W.; Ezaki, O.; Kodama, T.; et al. Bile Acids Induce Energy Expenditure by Promoting Intracellular Thyroid Hormone Activation. Nature 2006, 439, 484–489. [Google Scholar] [CrossRef]
  18. Li, T.; Chiang, J.Y.L. Bile Acid Signaling in Metabolic Disease and Drug Therapy. Pharmacol. Rev. 2014, 66, 948–983. [Google Scholar] [CrossRef] [Green Version]
  19. Hagenbuch, B.; Meier, P.J. Molecular Cloning, Chromosomal Localization, and Functional Characterization of a Human Liver Na+/Bile Acid Cotransporter. J. Clin. Investig. 1994, 93, 1326–1331. [Google Scholar] [CrossRef] [Green Version]
  20. Meier, P.J. Molecular Mechanisms of Hepatic Bile Salt Transport from Sinusoidal Blood into Bile. Am. J. Physiol. Liver Physiol. 1995, 269, G801–G812. [Google Scholar] [CrossRef]
  21. Meier, P.J.; Stieger, B. Bile Salt Transporters. Annu. Rev. Physiol. 2002, 64, 635–661. [Google Scholar] [CrossRef] [PubMed]
  22. Keppler, D.; König, J.; Büchler, M. The Canalicular Multidrug Resistance Protein, CMRP/MRP2, a Novel Conjugate Export Pump Expressed in the Apical Membrane of Hepatocytes. Adv. Enzyme Regul. 1997, 37, 321–333. [Google Scholar] [CrossRef]
  23. Gerloff, T.; Stieger, B.; Hagenbuch, B.; Madon, J.; Landmann, L.; Roth, J.; Hofmann, A.F.; Meier, P.J. The Sister of P-Glycoprotein Represents the Canalicular Bile Salt Export Pump of Mammalian Liver. J. Biol. Chem. 1998, 273, 10046–10050. [Google Scholar] [CrossRef] [PubMed] [Green Version]
  24. Chignard, N.; Mergey, M.; Veissière, D.; Parc, R.; Capeau, J.; Poupon, R.; Paul, A.; Housset, C. Bile Acid Transport and Regulating Functions in the Human Biliary Epithelium. Hepatology 2001, 33, 496–503. [Google Scholar] [CrossRef] [PubMed]
  25. Shneider, B.L. Intestinal Bile Acid Transport: Biology, Physiology, and Pathophysiology. J. Pediatr. Gastroenterol. Nutr. 2001, 32, 407–417. [Google Scholar] [CrossRef]
  26. Seward, D.J.; Koh, A.S.; Boyer, J.L.; Ballatori, N. Functional Complementation between a Novel Mammalian Polygenic Transport Complex and an Evolutionarily Ancient Organic Solute Transporter, OSTα-OSTβ. J. Biol. Chem. 2003, 278, 27473–27482. [Google Scholar] [CrossRef] [Green Version]
  27. Dawson, P.A.; Hubbert, M.; Haywood, J.; Craddock, A.L.; Zerangue, N.; Christian, W.V.; Ballatori, N. The Heteromeric Organic Solute Transporter α-β, Ostα-Ostβ, Is an Ileal Basolateral Bile Acid Transporter. J. Biol. Chem. 2005, 280, 6960–6968. [Google Scholar] [CrossRef] [Green Version]
  28. Takehara, I.; Terashima, H.; Nakayama, T.; Yoshikado, T.; Yoshida, M.; Furihata, K.; Watanabe, N.; Maeda, K.; Ando, O.; Sugiyama, Y.; et al. Investigation of Glycochenodeoxycholate Sulfate and Chenodeoxycholate Glucuronide as Surrogate Endogenous Probes for Drug Interaction Studies of OATP1B1 and OATP1B3 in Healthy Japanese Volunteers. Pharm. Res. 2017, 34, 1601–1614. [Google Scholar] [CrossRef]
  29. Mikkaichi, T.; Suzuki, T.; Onogawa, T.; Tanemoto, M.; Mizutamari, H.; Okada, M.; Chaki, T.; Masuda, S.; Tokui, T.; Eto, N.; et al. Isolation and Characterization of a Digoxin Transporter and Its Rat Homologue Expressed in the Kidney. Proc. Natl. Acad. Sci. USA 2004, 101, 3569–3574. [Google Scholar] [CrossRef] [PubMed] [Green Version]
  30. Toyohara, T.; Suzuki, T.; Morimoto, R.; Akiyama, Y.; Souma, T.; Shiwaku, H.O.; Takeuchi, Y.; Mishima, E.; Abe, M.; Tanemoto, M.; et al. SLCO4C1 Transporter Eliminates Uremic Toxins and Attenuates Hypertension and Renal Inflammation. J. Am. Soc. Nephrol. 2009, 20, 2546–2555. [Google Scholar] [CrossRef] [PubMed] [Green Version]
  31. Kikuchi, K.; Saigusa, D.; Kanemitsu, Y.; Matsumoto, Y.; Thanai, P.; Suzuki, N.; Mise, K.; Yamaguchi, H.; Nakamura, T.; Asaji, K.; et al. Gut Microbiome-Derived Phenyl Sulfate Contributes to Albuminuria in Diabetic Kidney Disease. Nat. Commun. 2019, 10, 1835. [Google Scholar] [CrossRef] [PubMed]
  32. Taghikhani, E.; Maas, R.; Fromm, M.F.; König, J. The Renal Transport Protein OATP4C1 Mediates Uptake of the Uremic Toxin Asymmetric Dimethylarginine (ADMA) and Efflux of Cardioprotective L-Homoarginine. PLoS ONE 2019, 14, e0213747. [Google Scholar] [CrossRef] [PubMed]
  33. Taghikhani, E.; Maas, R.; Taudte, R.V.; Gessner, A.; Fromm, M.F.; König, J. Vectorial Transport of the Arginine Derivatives Asymmetric Dimethylarginine (ADMA) and l-Homoarginine by OATP4C1 and P-Glycoprotein Studied in Double-Transfected MDCK Cells. Amino Acids 2020, 52, 975–985. [Google Scholar] [CrossRef]
  34. Yamaguchi, H.; Miyamori, K.; Sato, T.; Ogura, J.; Kobayashi, M.; Yamada, T.; Mano, N.; Iseki, K. Quantification of Intracellular and Extracellular Digoxin and Ouabain by Liquid Chromatography/Electrospray Ionization Tandem Mass Spectrometry. J. Chromatogr. B 2014, 972, 73–80. [Google Scholar] [CrossRef]
  35. Yamaguchi, H.; Mano, N. Analysis of Membrane Transport Mechanisms of Endogenous Substrates Using Chromatographic Techniques. Biomed. Chromatogr. 2019, 33, e4495. [Google Scholar] [CrossRef] [PubMed]
  36. Chu, X.Y.; Bleasby, K.; Yabut, J.; Cai, X.; Chan, G.H.; Hafey, M.J.; Xu, S.; Bergman, A.J.; Braun, M.P.; Dean, D.C.; et al. Transport of the Dipeptidyl Peptidase-4 Inhibitor Sitagliptin by Human Organic Anion Transporter 3, Organic Anion Transporting Polypeptide 4C1, and Multidrug Resistance P-Glycoprotein. J. Pharmacol. Exp. Ther. 2007, 321, 673–683. [Google Scholar] [CrossRef] [Green Version]
  37. Sato, T.; Mishima, E.; Mano, N.; Abe, T.; Yamaguchi, H. Potential Drug Interactions Mediated by Renal Organic Anion Transporter OATP4C1. J. Pharmacol. Exp. Ther. 2017, 362, 271–277. [Google Scholar] [CrossRef] [Green Version]
  38. Sato, T.; Maekawa, M.; Mano, N.; Abe, T.; Yamaguchi, H. Role of Oatp4c1 in Renal Handling of Remdesivir and Its Nucleoside Analog Gs-441524: The First Approved Drug for Patients with COVID-19. J. Pharm. Pharm. Sci. 2021, 24, 227–236. [Google Scholar] [CrossRef]
  39. Yamaguchi, H.; Sugie, M.; Okada, M.; Mikkaichi, T.; Toyohara, T.; Abe, T.; Goto, J.; Hishinuma, T.; Shimada, M.; Mano, N. Transport of Estrone 3-Sulfate Mediated by Organic Anion Transporter OATP4C1: Estrone 3-Sulfate Binds to the Different Recognition Site for Digoxin in OATP4C1. Drug Metab. Pharmacokinet. 2010, 25, 314–317. [Google Scholar] [CrossRef]
  40. Brites, D.; Rodrigues, C.M.P.; Oliveira, N.; Cardoso, M.D.C.; Graça, L.M. Correction of Maternal Serum Bile Acid Profile during Ursodeoxycholic Acid Therapy in Cholestasis of Pregnancy. J. Hepatol. 1998, 28, 91–98. [Google Scholar] [CrossRef]
  41. Sang, C.; Wang, X.; Zhou, K.; Sun, T.; Bian, H.; Gao, X.; Wang, Y.; Zhang, H.; Jia, W.; Liu, P.; et al. Bile Acid Profiles Are Distinct among Patients with Different Etiologies of Chronic Liver Disease. J. Proteome Res. 2021, 20, 2340–2351. [Google Scholar] [CrossRef]
  42. Greco, A.V.; Mingrone, G. Serum Bile Acid Concentrations in Mild Liver Cirrhosis. Clin. Chim. Acta 1993, 221, 183–189. [Google Scholar] [CrossRef]
  43. Perez, M.J.; Britz, O. Bile-Acid-Induced Cell Injury and Protection. World J. Gastroenterol. 2009, 15, 1677–1689. [Google Scholar] [CrossRef]
  44. Xie, Z.; Zhang, L.; Chen, E.; Lu, J.; Xiao, L.; Liu, Q.; Zhu, D.; Zhang, F.; Xu, X.; Li, L. Targeted Metabolomics Analysis of Bile Acids in Patients with Idiosyncratic Drug-Induced Liver Injury. Metabolites 2021, 11, 852. [Google Scholar] [CrossRef]
  45. Zhang, X.; Yang, Z.; Shi, Z.; Zhu, Z.; Li, C.; Du, Z.; Zhang, Y.; Wang, Z.; Jiao, Z.; Tian, X.; et al. Analysis of Bile Acid Profile in Plasma to Differentiate Cholangiocarcinoma from Benign Biliary Diseases and Healthy Controls. J. Steroid Biochem. Mol. Biol. 2021, 205, 105775. [Google Scholar] [CrossRef]
  46. Malavolti, M.; Fromm, H.; Ceryak, S.; Shehan, K.L. Interaction of Potentially Toxic Bile Acids with Human Plasma Proteins: Binding of Lithocholic (3α-Hydroxy-5β-Cholan-24-Oic) Acid to Lipoproteins and Albumin. Lipids 1989, 24, 673–676. [Google Scholar] [CrossRef]
  47. Ceryak, S.; Bouscarel, B.; Fromm, H. Comparative Binding of Bile Acids to Serum Lipoproteins and Albumin. J. Lipid Res. 1993, 34, 1661–1674. [Google Scholar] [CrossRef]
  48. Ceryak, S.; Bouscarel, B.; Malavolti, M.; Fromm, H. Extrahepatic Deposition and Cytotoxicity of Lithocholic Acid: Studies in Two Hamster Models of Hepatic Failure and in Cultured Human Fibroblasts. Hepatology 1998, 27, 546–556. [Google Scholar] [CrossRef] [Green Version]
  49. Fanali, G.; Di Masi, A.; Trezza, V.; Marino, M.; Fasano, M.; Ascenzi, P. Human Serum Albumin: From Bench to Bedside. Mol. Aspects Med. 2012, 33, 209–290. [Google Scholar] [CrossRef]
  50. Domenicali, M.; Baldassarre, M.; Giannone, F.A.; Naldi, M.; Mastroroberto, M.; Biselli, M.; Laggetta, M.; Patrono, D.; Bertucci, C.; Bernardi, M.; et al. Posttranscriptional Changes of Serum Albumin: Clinical and Prognostic Significance in Hospitalized Patients with Cirrhosis. Hepatology 2014, 60, 1851–1860. [Google Scholar] [CrossRef]
  51. Baldassarre, M.; Naldi, M.; Zaccherini, G.; Bartoletti, M.; Antognoli, A.; Laggetta, M.; Gagliardi, M.; Tufoni, M.; Domenicali, M.; Waterstradt, K.; et al. Determination of Effective Albumin in Patients with Decompensated Cirrhosis: Clinical and Prognostic Implications. Hepatology 2021, 74, 2058–2073. [Google Scholar] [CrossRef]
  52. Wasan, K.M.; Cassidy, S.M. Role of Plasma Lipoproteins in Modifying the Biological Activity of Hydrophobic Drugs. J. Pharm. Sci. 1998, 87, 411–424. [Google Scholar] [CrossRef] [PubMed]
  53. Komazawa, H.; Yamaguchi, H.; Hidaka, K.; Ogura, J.; Kobayashi, M.; Iseki, K. Renal Uptake of Substrates for Organic Anion Transporters Oat1 and Oat3 and Organic Cation Transporters Oct1 and Oct2 Is Altered in Rats with Adenine-Induced Chronic Renal Failure. J. Pharm. Sci. 2013, 102, 1086–1094. [Google Scholar] [CrossRef]
  54. Sato, T.; Yamaguchi, H.; Kogawa, T.; Abe, T.; Mano, N. Organic Anion Transporting Polypeptides 1B1 and 1B3 Play an Important Role in Uremic Toxin Handling and Drug-Uremic Toxin Interactions in the Liver. J. Pharm. Pharm. Sci. 2014, 17, 475–484. [Google Scholar] [CrossRef]
  55. Weigand, K.M.; Schirris, T.J.J.; Houweling, M.; van den Heuvel, J.J.M.W.; Koenderink, J.B.; Dankers, A.C.A.; Russel, F.G.M.; Greupink, R. Uremic Solutes Modulate Hepatic Bile Acid Handling and Induce Mitochondrial Toxicity. Toxicol. Vitr. 2019, 56, 52–61. [Google Scholar] [CrossRef]
  56. Goto, J.; Miura, H.; Inada, M.; Nambara, T.; Nagakura, T.; Suzuki, H. Studies on Steroids. J. Chromatogr. A 1988, 452, 119–129. [Google Scholar] [CrossRef]
  57. Brouwer, K.L.R.; Keppler, D.; Hoffmaster, K.A.; Bow, D.A.J.; Cheng, Y.; Lai, Y.; Palm, J.E.; Stieger, B.; Evers, R. In Vitro Methods to Support Transporter Evaluation in Drug Discovery and Development. Clin. Pharmacol. Ther. 2013, 94, 95–112. [Google Scholar] [CrossRef] [Green Version]
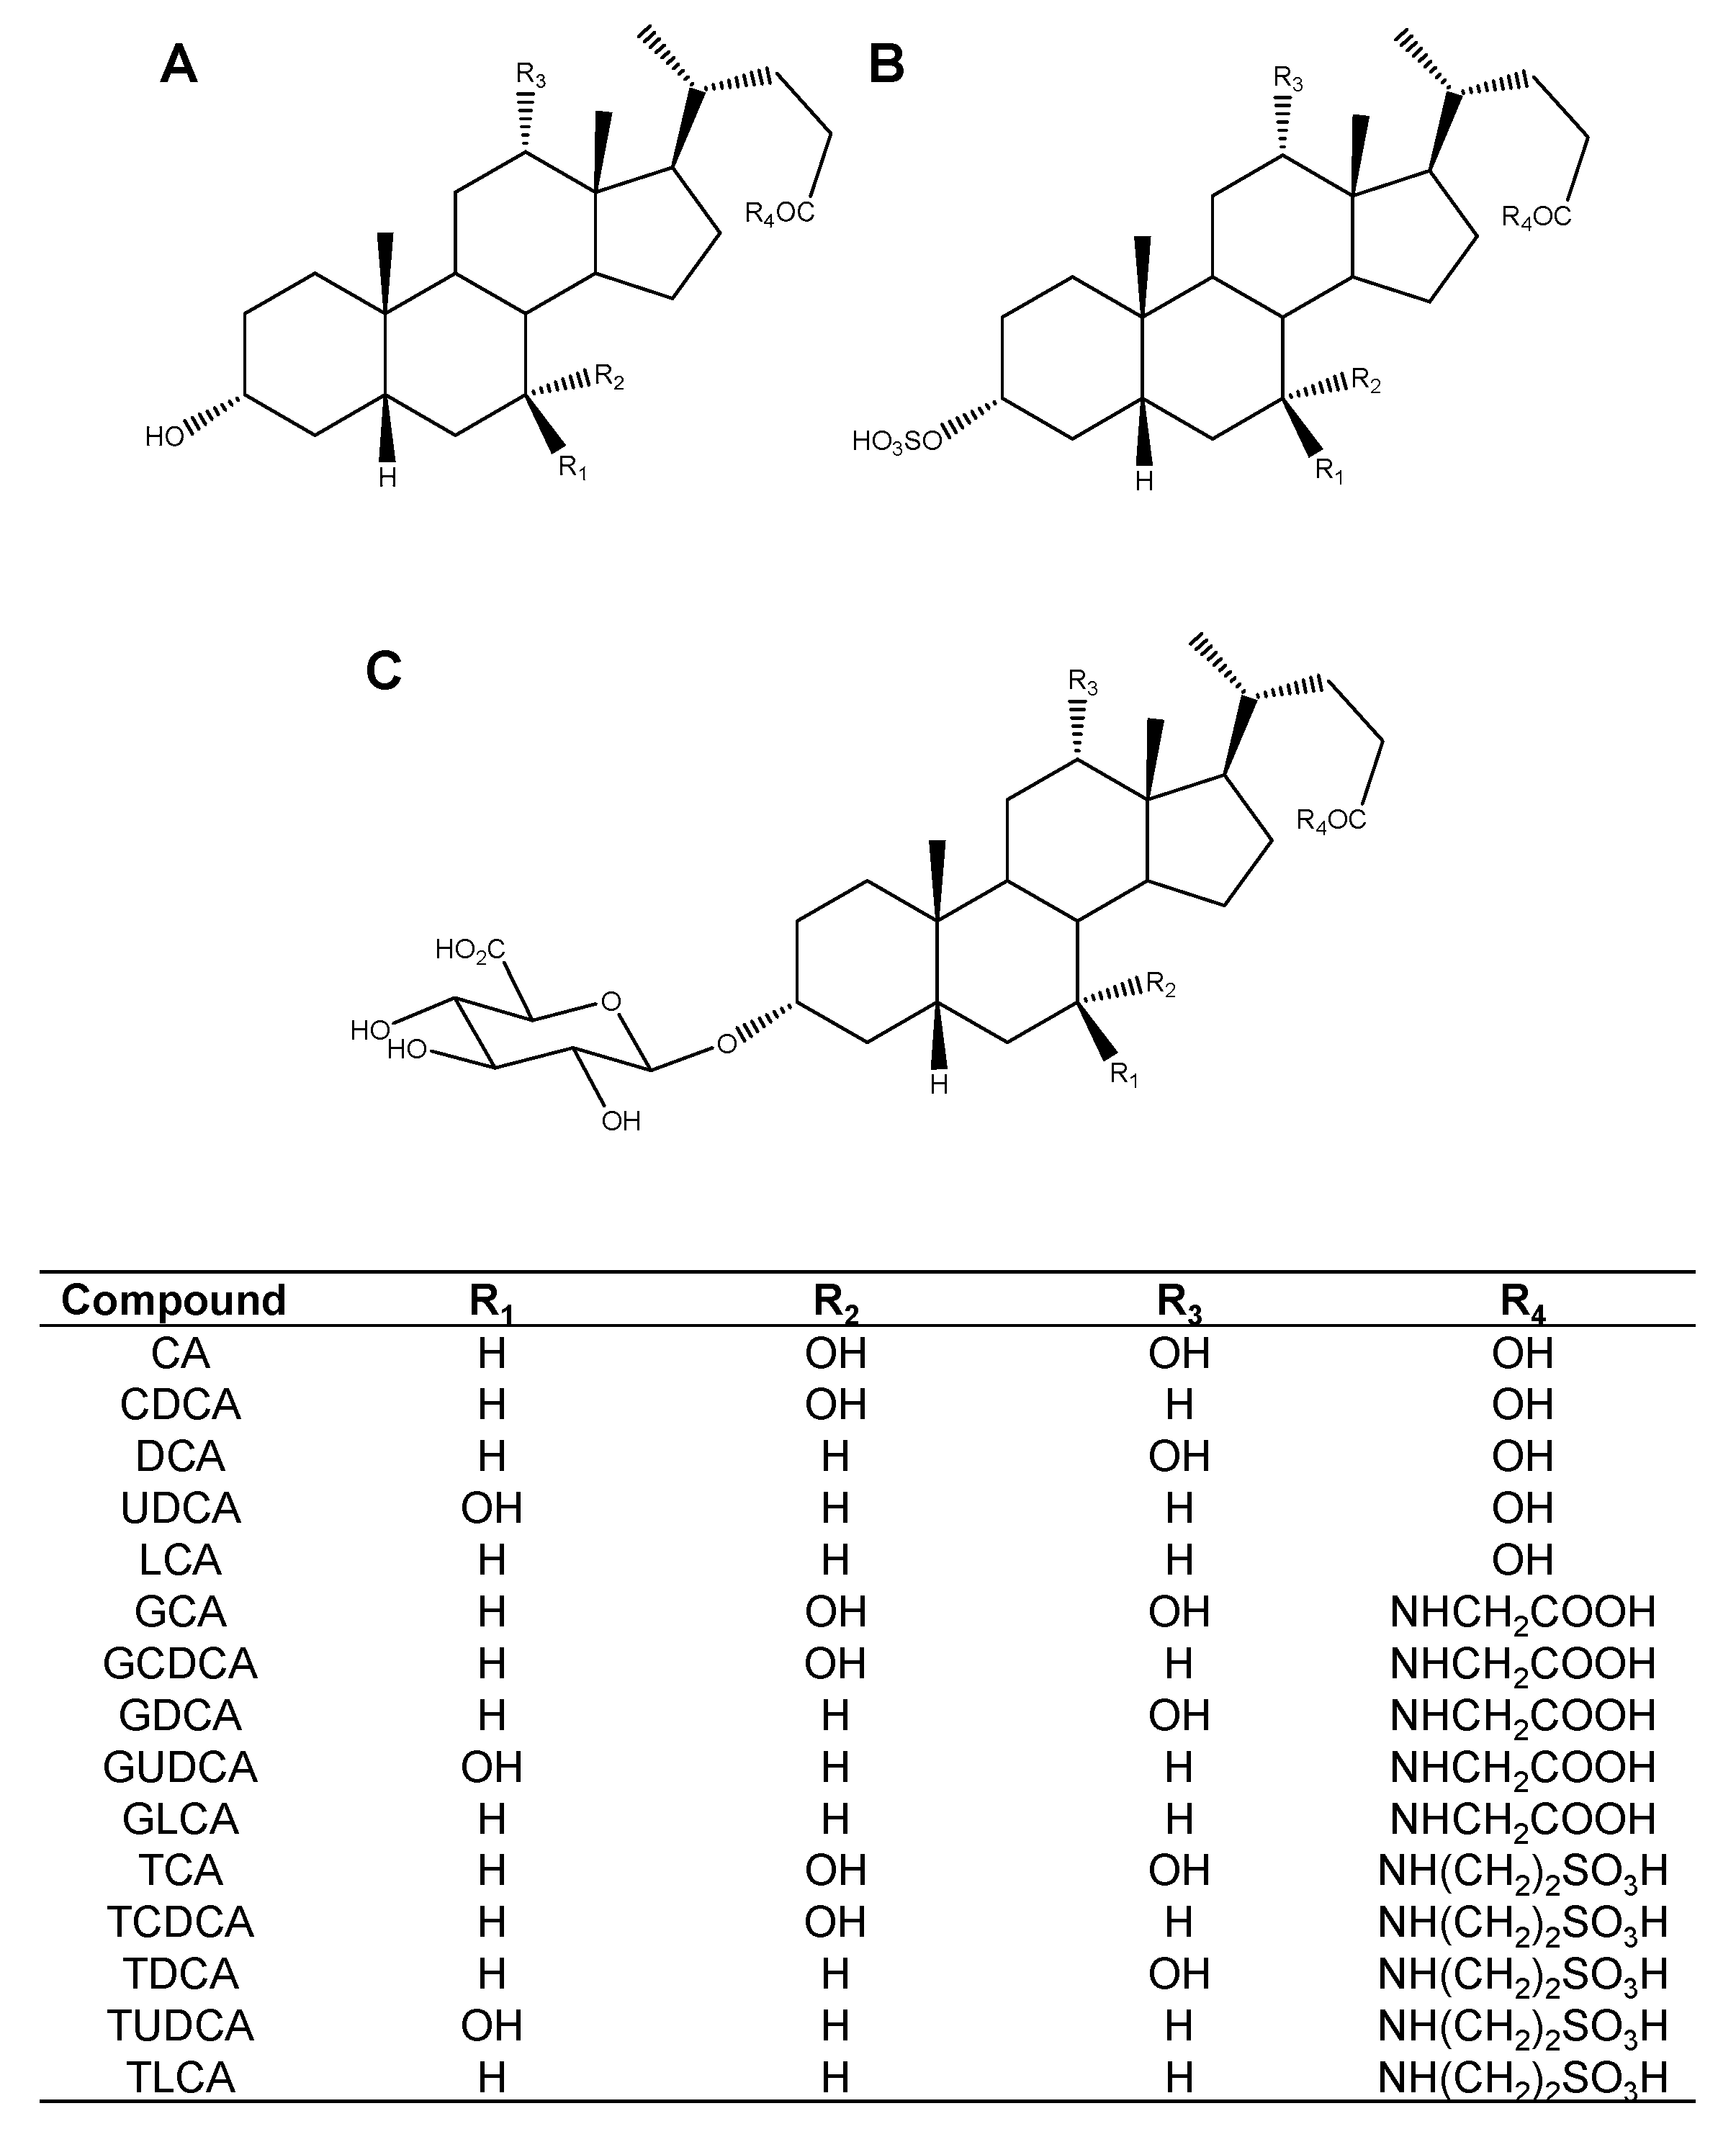
Figure 1. Chemical structures of (A) unconjugated, glycine-conjugated, and taurine-conjugated bile acids, (B) bile acid 3-sulfates, and (C) bile acid 3-glucuronides.
Ijms 23 08508 g001
Figure 2. Inhibitory effect of 45 bile acids on OATP4C1-mediated T3 transport. (A) unconjugated, glycine-conjugated, and taurine-conjugated bile acids, (B) bile acid 3-sulfates, and (C) bile acid 3-glucuronides. The T3 concentration was 1 µM and cells were incubated for 10 min at 37 °C. The bile acid concentrations were 50 µM for CA-3S, LCA-3S, TDCA-3S, LCA-3GlcA, and GLCA-3GlcA, and 100 µM for the other 40 types of bile acids. The OATP4C1-mediated transport was calculated by subtracting the nonspecific uptake of T3 by the mock cells from the total cellular uptake by the OATP4C1-expressing cells. Each column and bar represent the mean ± standard error of the mean (n = 3). The data are shown as the percentages of transport relative to the control. An asterisk indicates a significant difference from the control by one-way analysis of variance (ANOVA) followed by Tukey’s test (p < 0.05).
Ijms 23 08508 g002
Figure 3. Concentration dependence of the inhibitory effect of the bile acids on the OATP4C1-mediated T3 transport. (A) LCA, (B) GLCA, and (C) TLCA. The T3 concentration was 1 µM and the cells were incubated for 10 min at 37 °C. The bile acid concentrations were 0, 0.3, 1, 3, 10, 30, and 100 µM for LCA and GLCA, and 0, 1, 3, 10, 30, 100, and 200 µM for TLCA. The OATP4C1-mediated transport was calculated by subtracting the nonspecific uptake of T3 by the mock cells from the total cellular uptake by the OATP4C1-expressing cells. Each point and bar represent the mean ± standard error of the mean (n = 3). The data are shown as the percentages of transport relative to the control. The dotted lines represent the fitted line obtained by nonlinear least squares regression analysis.
Ijms 23 08508 g003
Figure 4. Effect of (A) unconjugated, glycine-conjugated, and taurine-conjugated bile acids, (B) bile acid 3-sulfates, and (C) bile acid 3-glucuronides on cellular viability. The bile acid concentrations were 50 µM for CA-3S, LCA-3S, TDCA-3S, LCA-3GlcA, and GLCA-3GlcA, and 100 µM for the other 40 types of bile acids. The OATP4C1-expressing cells were incubated for 10 min at 37 °C. After a 3 h color reaction, the absorbance was measured at 450 nm. Data are shown as mean ± standard error of the mean (n = 5). Data are presented as the percentages of cell viability obtained from the control.
Ijms 23 08508 g004
Figure 5. Hypothetical scheme of the “bile acid–uremic toxin negative spiral”. OATP4C1 inhibition by bile acids causes the accumulation of uremic toxins, which may inhibit the bile acid uptake into hepatocytes via NTCP and OATPs. Further accumulation of uremic toxins and bile acids may be induced by the inhibition of OATP4C1 and hepatic bile acid transporters.
Ijms 23 08508 g005
Table 1. IC50 and Ki values of LCA, GLCA, and TLCA.
Bile AcidIC50 (µM)Ki (µM)
LCA6.12 ± 1.215.23 ± 1.03
GLCA9.90 ± 0.4758.46 ± 0.406
TLCA12.3 ± 0.89110.5 ± 0.762
Data are represented as mean ± standard error of the mean.
Table 2. BDI indices of LCA, GLCA, and TLCA.
Bile AcidIC50 (µM)Cmax (µM)BDI Index
LCA6.12 ± 1.211.7 [40]0.278
GLCA9.90 ± 0.4750.0972 [41]0.00982
TLCA12.3 ± 0.8910.0682 [42]0.00554
The IC50 values are shown as mean ± standard error of the mean.
Publisher’s Note: MDPI stays neutral with regard to jurisdictional claims in published maps and institutional affiliations.