Article

Ibuprofen Favors Binding of Amyloid-β Peptide to Its Depot, Serum Albumin

by
Ekaterina A. Litus
1,*,
Alexey S. Kazakov
1,
Evgenia I. Deryusheva
1,
Ekaterina L. Nemashkalova
1,
Marina P. Shevelyova
1,
Andrey V. Machulin
2,
Aliya A. Nazipova
1,
Maria E. Permyakova
1,
Vladimir N. Uversky
3 and
Sergei E. Permyakov
1,*
1
Institute for Biological Instrumentation, Pushchino Scientific Center for Biological Research of the Russian Academy of Sciences, 142290 Pushchino, Russia
2
Skryabin Institute of Biochemistry and Physiology of Microorganisms, Pushchino Scientific Center for Biological Research of the Russian Academy of Sciences, 142290 Pushchino, Russia
3
Department of Molecular Medicine, Byrd Alzheimer’s Research Institute, Morsani College of Medicine, University of South Florida, Tampa, FL 33612, USA
*
Authors to whom correspondence should be addressed.
Int. J. Mol. Sci. 2022, 23(11), 6168; https://doi.org/10.3390/ijms23116168
Submission received: 15 April 2022 / Revised: 24 May 2022 / Accepted: 28 May 2022 / Published: 31 May 2022

Abstract

:
The deposition of amyloid-β peptide (Aβ) in the brain is a critical event in the progression of Alzheimer’s disease (AD). This Aβ deposition could be prevented by directed enhancement of Aβ binding to its natural depot, human serum albumin (HSA). Previously, we revealed that specific endogenous ligands of HSA improve its affinity to monomeric Aβ. We show here that an exogenous HSA ligand, ibuprofen (IBU), exerts the analogous effect. Plasmon resonance spectroscopy data evidence that a therapeutic IBU level increases HSA affinity to monomeric Aβ40/Aβ42 by a factor of 3–5. Using thioflavin T fluorescence assay and transmission electron microcopy, we show that IBU favors the suppression of Aβ40 fibrillation by HSA. Molecular docking data indicate partial overlap between the IBU/Aβ40-binding sites of HSA. The revealed enhancement of the HSA–Aβ interaction by IBU and the strengthened inhibition of Aβ fibrillation by HSA in the presence of IBU could contribute to the neuroprotective effects of the latter, previously observed in mouse and human studies of AD.

1. Introduction

About 70–80% of all dementia cases (over 55 million people worldwide, according to World Health Organization, WHO) correspond to Alzheimer’s disease (AD), which represents a progressive neurodegenerative disorder leading to brain atrophy and death (reviewed in ref. [1,2]). Due to increasing life expectancy in developed countries, AD is a global threat, lacking effective curative or preventive means despite the enormous efforts of the scientific community and multibillion research investments. The key histopathological hallmarks of AD are the accumulation of harmful extracellular amyloid β peptide (Aβ) plaques and neurofibrillary tangles of hyperphosphorylated tau protein in the hippocampus and neocortex [2,3,4]. The Aβ deposition begins 2–3 decades prior to clinical manifestation of AD and precedes the development of tau pathology, which better correlates with the appearance of clinical symptoms [2,3]. Meanwhile, the definite crosstalk between Aβ and tau protein observed in immunotherapy of AD points out that both these pathways should be targeted in AD therapy [3]. Indeed, the anti-Aβ monoclonal antibody aducanumab recently became a first targeted treatment approved by the Food and Drug Administration for AD, whereas two other antibodies targeting Aβ await their accelerated approval [2,5]. Therefore, the anti-Aβ therapy proved to be a viable tactic for the prevention of AD.
The Aβ is a 37–49-residue-long peptide enzymatically cleaved from the amyloid precursor protein, with the two major forms being: the 40-residue Aβ40 and the 42-residue Aβ42 [2,6]. Multimerization of monomeric Aβ leads to the formation of soluble toxic oligomers, protofibrils, and insoluble mature fibrils, which assemble into amyloid plaques [6]. Therefore, the Aβ therapeutics in clinical trials pursue avoidance of Aβ aggregation, aside from reduction of Aβ production and enhancement of Aβ clearance [3]. Notably, some of the plasma and cerebrospinal fluid (CSF) proteins prevent Aβ polymerization via binding to Aβ, with the highest contribution (over 60%) being from the serum albumin [7]. In fact, the most abundant blood plasma and CSF protein (60–80% of the total protein [8]), human serum albumin (HSA), binds about 89% of the total Aβ in plasma [9]. The much lower HSA level in CSF compared to that in the blood serum (3 μM versus ca. 645 μM [10], respectively) likely explains the fact that the Aβ plaques accumulate in the central nervous system but not in the peripheral tissues, where the abundant HSA efficiently suppresses Aβ multimerization [7]. The protective effect of plasma HSA is further supported by its antioxidant activity due to the C34 thiol and detoxification activity owing to the HSA’s ability to bind a wide range of substances, including endogenous toxins [8]. Meanwhile, even the relatively low HSA level observed in CSF inhibits Aβ fibrillation in vitro [11], thereby indicating the therapeutic potential of HSA.
The Aβ-buffering role of HSA could be exploited for AD therapy by directed improvement of HSA’s affinity to Aβ, as exemplified by the addition of certain low-molecular-weight ligands of HSA: arachidonic/linoleic acid or serotonin (the maximal effect is a 17-fold increase in HSA’s affinity to Aβ [12,13]). Other HSA ligands typically act in the opposite direction, as shown for tolbutamide [7], cholesterol, palmitic acid, and warfarin [14]. The more radical approach to therapeutic use of HSA is Aβ removal via replacement of endogenous albumin with therapeutic HSA through a plasma exchange [15]. The respective clinical trials evidence slowdown of cognitive and functional decline in AD [16,17,18]. Finally, direct delivery of exogenous HSA into the murine brain via intracerebroventricular administration gave positive results [19].
In the present work, we show that therapeutic levels of one more HSA ligand, ibuprofen (2-[4-(2-methylpropyl)phenyl]propanoic acid, IBU), notably improve HSA affinity to monomeric Aβ, leading to the enhanced suppression of the Aβ fibrillation by HSA in vitro. IBU is an over-the-counter, non-steroidal, anti-inflammatory drug from the Essential Medicines List of the WHO, widely used for relief of pain, fever, and inflammation (reviewed in [20]). Its therapeutic indications include rheumatoid- and osteo-arthritis, cystic fibrosis, orthostatic hypotension, dental pain, dysmenorrhea, fever, and headache [21]. IBU exerts multifactorial action on the different pathways involved in acute and chronic inflammation, including inhibition of the prostaglandin synthesis via inhibition of the cyclooxygenases COX-1 and COX-2, suppression of the leucocyte functions, modulation of the nitric oxide and cytokine production, etc. [20]. The water solubility of ibuprofen at pH values above 7 (pKa = 5.3) reaches 0.1–1 M [22,23]. At therapeutic levels, 99% of IBU is bound to blood plasma proteins [24]. HSA binds single IBU molecules with an equilibrium dissociation constant, Kd, of 0.4 µM and 6–7 IBU molecules with a Kd value of 51 µM [25]. The primary IBU-binding site of HSA is located in the center of the drug site 2 of the subdomain IIIA (sites FA3-FA4), whilst the secondary site is located at the interface between subdomains IIA and IIB in a cleft that overlaps with the site FA6 [26]. IBU binding stabilizes the tertiary structure of HSA but does not affect its secondary structure [27].
Numerous studies evidence various neuroprotective effects of IBU intake in mouse models of AD, including suppression of the inflammatory processes, reduction in the Aβ sprand tau protein depositions, and lowering of the cognitive and memory deficits [28,29,30,31,32,33,34,35]. Similarly, retrospective human epidemiological studies revealed that long-term use of nonsteroidal anti-inflammatory drugs, including IBU, is protective against AD [36,37,38]. The IBU-induced Aβ trapping by HSA shown here in vitro points out the existence of an additional molecular mechanism behind these observations, which likely complements the other positive effects of IBU, such as suppression of chronic inflammation and Aβ42 level, scavenging of free radicals, and γ-secretase modulation [20,39,40].

2. Results and Discussions

2.1. Modulation of HSA Affinity to Monomeric Aβ by IBU

The interaction between fatty-acid-free HSA and Aβ at 25 °C was studied by surface plasmon resonance (SPR) spectroscopy mainly as described earlier [12,13]. The recombinant human Aβ40/Aβ42 or Flemish variant of Aβ40 [41], Aβ40(A21G), was immobilized on the surface of the SPR sensor chip by amine coupling. To ensure the monomeric state of Aβ, the non-covalently bound Aβ molecules were thoroughly washed from the chip surface until stabilization of the SPR signal using several water solutions: 2% sodium dodecyl sulfate (SDS), 100 mM HCl, 20 mM ethylenediaminetetraacetic acid (EDTA) pH 8.0 with 1% SDS. The defatted HSA sample extracted from blood under non-denaturing conditions [42] was used as an analyte. Briefly, 0.5–8 µM HSA in the physiologically relevant running buffer (20 mM Tris-HCl, 140 mM NaCl, 4.9 mM KCl, 1 mM MgCl2, 2.5 mM CaCl2, pH 7.4) was passed over the chip surface for 300 s, followed by flushing of the chip with the running buffer. The measurements were performed either in the absence or presence of 100 µM IBU, which corresponds to therapeutic IBU level in plasma [43,44] and is sufficient for HSA saturation with IBU [25]. The resulting SPR data exhibited a characteristic concentration-dependent association–dissociation pattern and were well described by the heterogeneous ligand model (1) (Figure 1) with the kinetic and equilibrium association/dissociation constants shown in Table 1.
Unexpectedly, Kd for HSA–Aβ40/Aβ42 complexes are 2–3 orders of magnitude lower compared to those reported earlier under identical solution conditions [13]. This inconsistency can be resolved considering that we washed the non-covalently bound Aβ molecules from the chip surface using two additional solutions, aside from the 2% SDS solution used earlier [13], thereby ensuring a more monomeric state of Aβ. Notably, despite the differences in the absolute values of the Kd estimates obtained here and in the previous works [12,13], the general regularities remain the same: HSA’s affinities to Aβ40 and Aβ42 are nearly equal, whereas the A21G mutation increases HSA’s affinity to Aβ40 by a factor of 2.5–10 [12] or 1.5–4 (Table 1).
Addition of the 100 µM IBU notably favors the HSA–Aβ40/Aβ42 interaction: the Kd values are decreased by a factor of 3–5 (Table 1). The effect is less noticeable in the case of Aβ40(A21G): the Kd values are lowered by 60–70%. In all cases, the Kd decline induced by IBU is mainly due to the slowdown in the HSA–Aβ complex dissociation, which is manifested as a flattening of the dissociation phase of the SPR curve (Figure 1).

2.2. Influence of IBU on Suppression of Aβ Fibrillation by HSA

The improved Aβ trapping by HSA in the presence of IBU (Table 1) is expected to decrease the free Aβ concentration, leading to the slowdown of the Aβ fibrillation. HSA per se is able to interact with monomeric and multimeric forms of Aβ, thereby interfering with the Aβ fibrillation [7,9,11,14,45,46]. Furthermore, some of the HSA ligands are shown to affect the suppression of Aβ fibrillation by HSA [7,14]. To explore the influence of IBU on this process, we used the thioflavin T (ThT) fluorescence assay [47,48]. Kinetics of the fibrillation process for 20 µM Aβ40/Aβ40(A21G) in the absence/presence of 2–10 µM HSA (corresponds to HSA level in cerebrospinal fluid of 3 µM [10]) or/and 20 µM IBU (close to therapeutic IBU level [43,44]) at 30 °C was followed by fluorescence of 10 µM ThT for 190 h (Figure 2 and Figure 3).
In accord with the literature data for Aβ40 [11], addition of the 5–10 µM HSA drastically decreases the final ThT fluorescence intensity, indicating the prevention of Aβ40/Aβ40(A21G) fibrillation (Figure 2A,C). Although 20 µM IBU alone does not induce statistically significant suppression of the fibrillation process (Figure 2B,D and Figure 3), the addition of IBU strengthens the suppression of Aβ40 fibrillation by 2 µM HSA (Figure 3A). Meanwhile, the fibrillation of Aβ40(A21G) is efficiently prevented by 2 µM HSA regardless of IBU’s presence (Figure 2C and Figure 3B).
Since the kinetics of the Aβ40 fibrillation (Figure 3A) is adequately described by the Boltzmann sigmoid function (Equation (2)), the fibrillation process was quantitated by the values of lag time (tlag, Figure 4A) and apparent rate constant (kapp, Figure 4B). The addition of 20 µM IBU did not affect the kapp value but shortened the lag phase by a factor of 2, pointing out the presence of the IBU interaction with Aβ40, in line with the previous experimental and theoretical studies [49,50,51,52]. Meantime, 2 µM HSA prolonged the lag phase of Aβ40 fibrillation by ~60% regardless of IBU presence, with a decline in the tlag value by 21% in response to IBU. The combination of HSA and IBU decreased the kapp value by 17%.
It should be noted that the efficient suppression of 25–50 µM Aβ40/Aβ42 fibrillation was previously reported at an IBU concentration as low as 10 µM [49]. The notable discrepancy with our data could be due to the use in the previous study [49] of synthetic Aβ samples, which exhibit altered properties (lowered propensity to fibrillation and neurotoxicity [53]), and to differences in Aβ pretreatment.
Overall, the ThT fluorescence assay reveals that 20 µM IBU favors the suppression of fibrillation of 20 µM Aβ40 by 2 µM HSA along with the minor opposite effects: shortening of the lag phase and decrease in the apparent rate constant of the process.

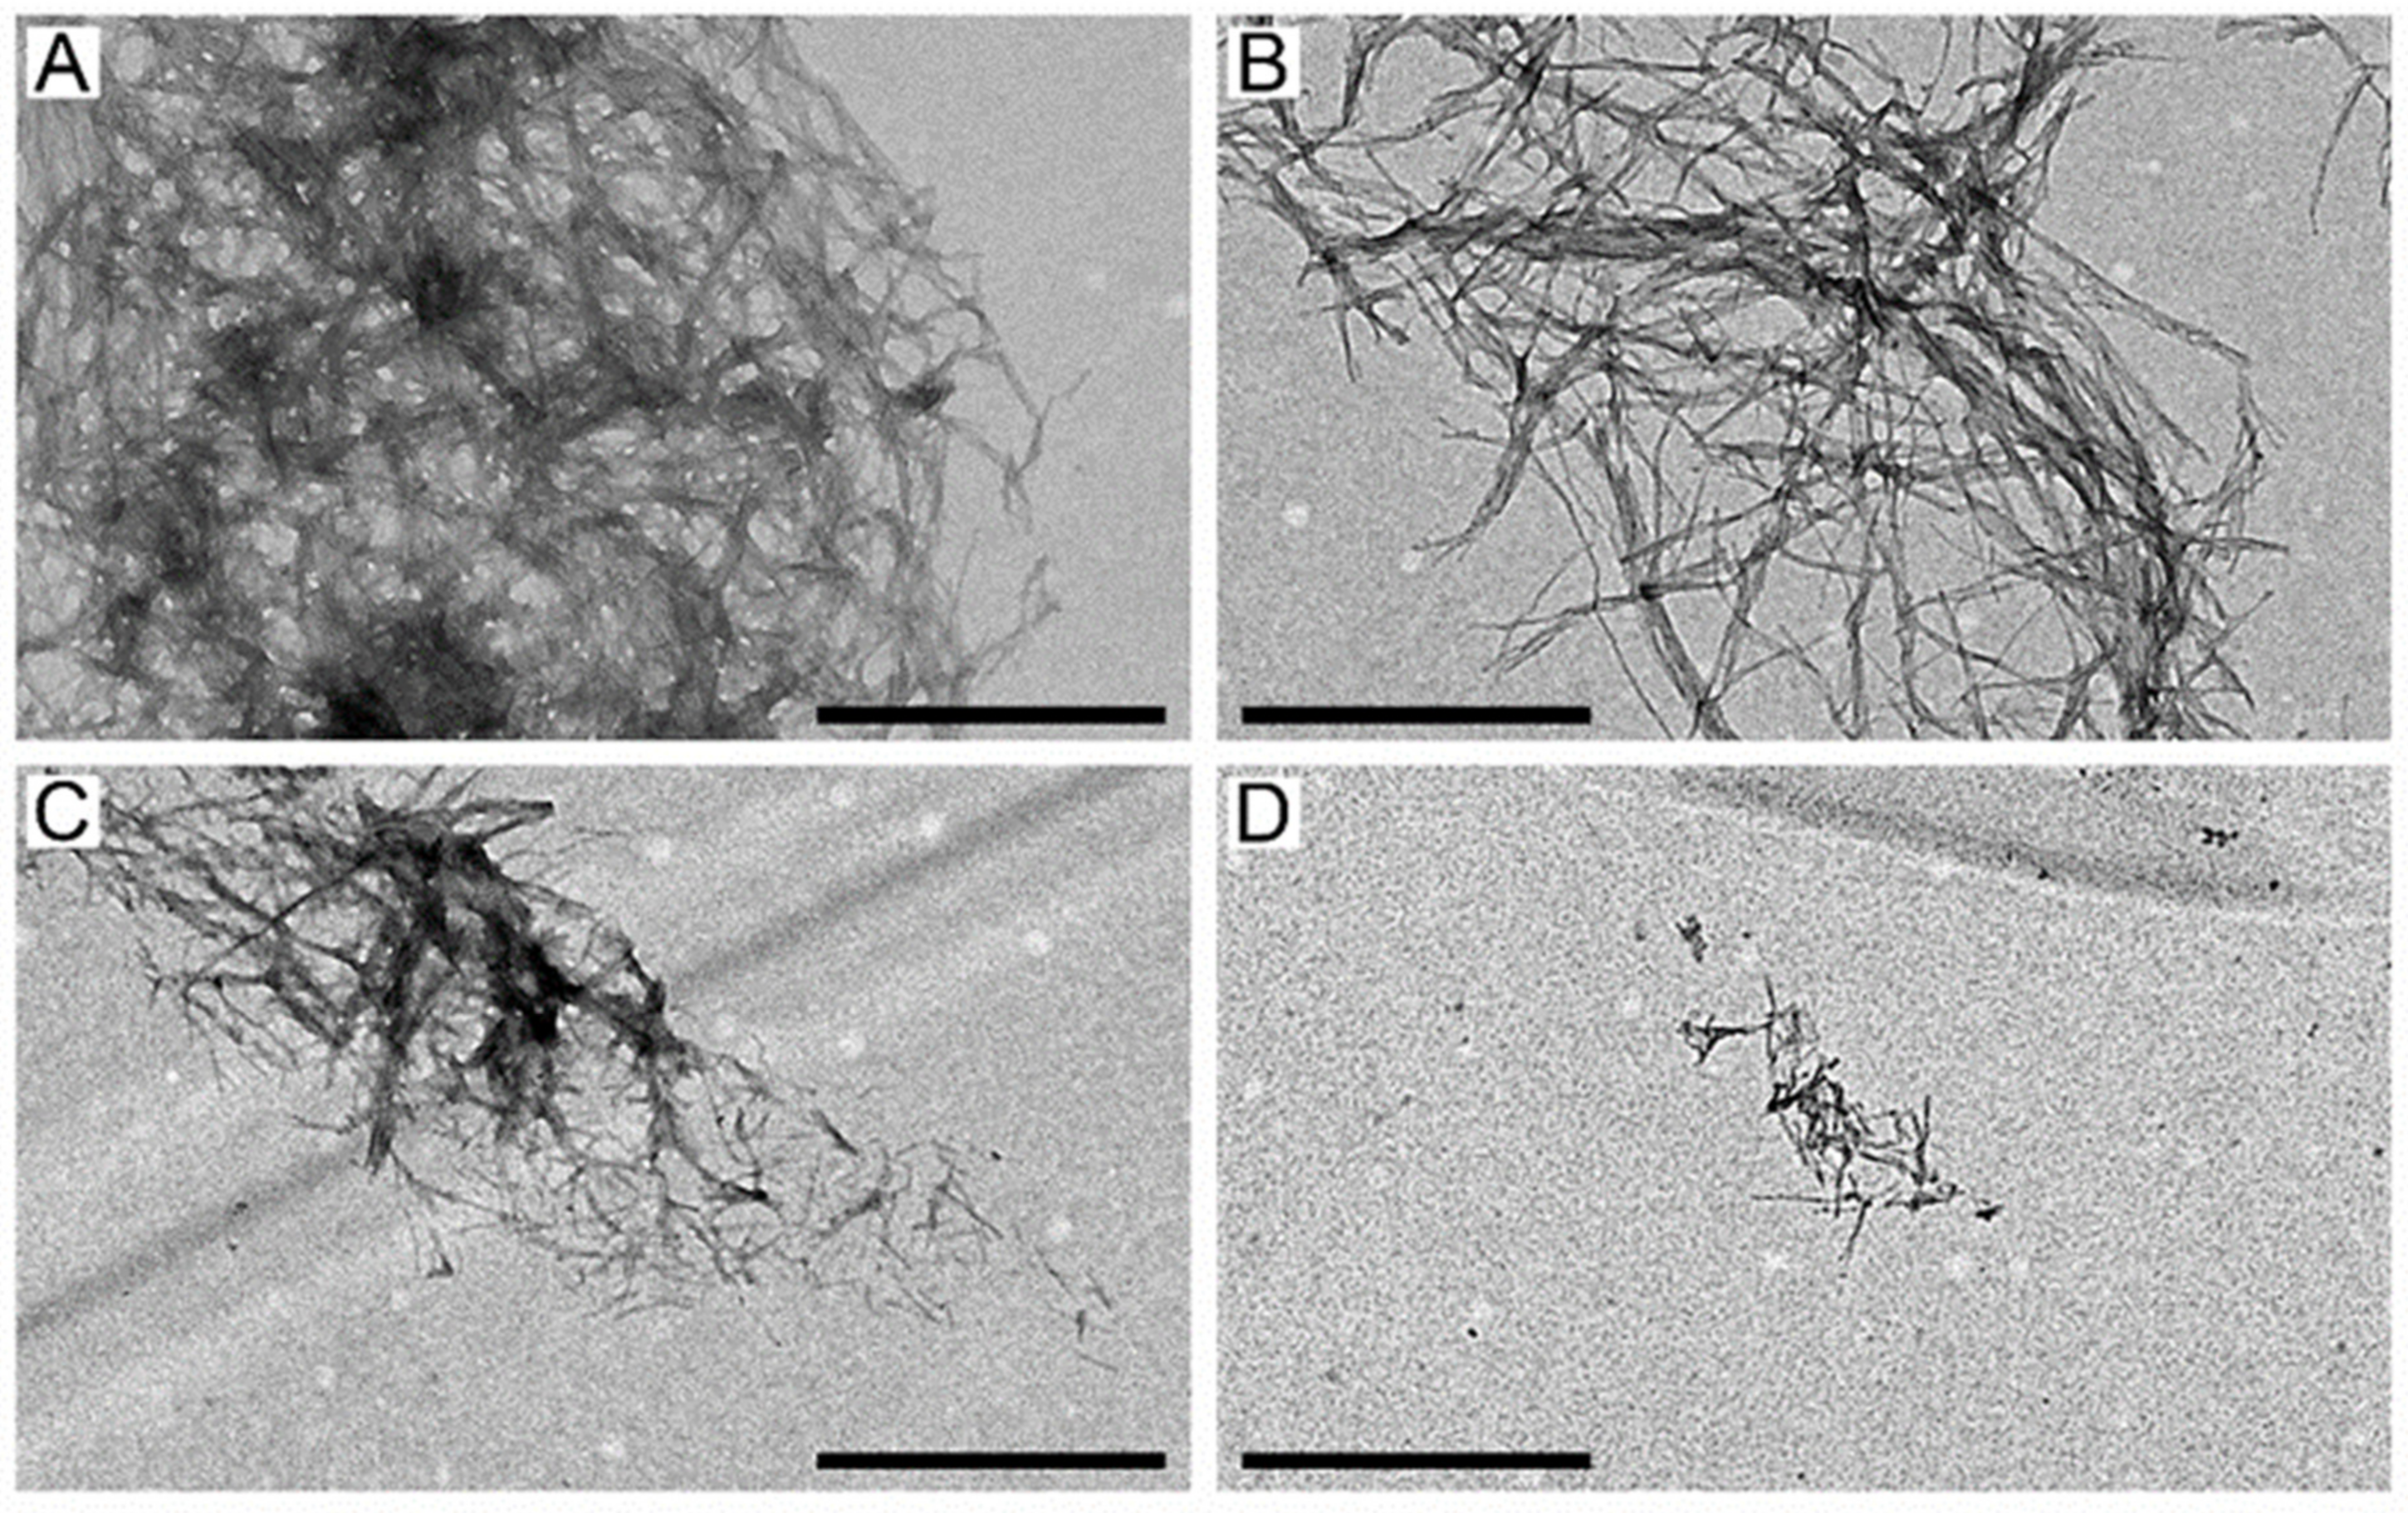
2.3. The Suppression of Aβ40 Fibrillation by HSA/IBU Studied by Transmission Electron Microscopy

To explore the structural features of the fibrils grown in the experiment shown in Figure 3A, we studied the resulting fibers using negative staining transmission electron microscopy (TEM) (Figure 5). The 20 μM Aβ40 sample reveals dense clusters of the intertwined mature fibrils up to microns long (Figure 5A). The fibrillation in the presence of 20 μM IBU gives rise to drastically less fuzzy fibrils, which indicates suppression of the fibrillation process (Figure 5B). This result correlates with the somewhat lowered ThT fluorescence intensity (Figure 2B and Figure 3A) and altered tlag value (Figure 4A) in the presence of IBU and the literature data [49]. Meanwhile, 2 μM HSA prevented the formation of long fibers, and the fibrillation process was notably suppressed (Figure 5C). Furthermore, the combined application of 2 μM HSA and 20 μM IBU in the course of Aβ40 fibrillation caused the almost complete disappearance of the mature fibers (Figure 5D). Taken together, the TEM data evidence the suppressive action of HSA and its combination with IBU on the Aβ40 fibrillation, in accord with the ThT fluorescence assay data (Figure 3A). Since the effect of IBU is opposite to that exerted by other HSA ligands, including tolbutamide [7], cholesterol, palmitic acid, and warfarin [14], one may suggest that the IBU-binding site of HSA differs from the site(s) occupied by these molecules. The latter conclusion is in line with the data on the relative location of IBU/warfarin-binding sites of HSA [26].

2.4. Structural Modeling of HSA–Aβ40/IBU Complexes

The previous experimental and molecular dynamics study [45] has shown that the HSA groove between domains I and III is the most probable binding site for the Aβ40/Aβ42 monomer. The binding process was accompanied by the conversion of Aβ structure from the random coil into α-helical structure, while HSA did not show noticeable structural changes [45]. Therefore, we predicted the location of Aβ40-binding sites of HSA using ClusPro docking service [54] (Figure 6A), based upon crystal structure of HSA (PDB code 1AO6) and the NMR structure of the partially folded α-helical Aβ40 (PDB code 2LFM, Figure 6B). In accord with the previous report [45], the primary Aβ40-binding site of HSA was predicted to be located in the groove between domains I and III (Figure 6A). Since residue A21 of Aβ40 contacts with HSA molecule in 7 of the 25 model complex structures, the A21G substitution is expected to affect the HSA-Aβ40 interaction, in line with the SPR data (Table 1). Furthermore, a secondary Aβ40-binding site located in the domain II of HSA was predicted (Figure 6A). This site is in the close vicinity to the previously reported IBU-binding sites of HSA (Figure 6A,C,D) [26]. Furthermore, one of them intersects with the secondary site of Aβ40 (residues A213 and K351 of domain II and residues L481-V482 of domain III; Figure 6D). The partial overlap between IBU/Aβ40-binding sites of HSA could interfere with the simultaneous binding of IBU and Aβ40 to HSA. Meanwhile, the IBU-induced increase in HSA affinity to Aβ40 (Table 1) rules out this possibility. Furthermore, this effect could be attributed to the direct IBU interaction with Aβ40, as reported earlier [51,52].
Curiously, Figure 7 shows that HSA residues comprising the IBU binding sites possess prominent difference in the intrinsic disorder propensity, with residues of the primary binding site being noticeably more flexible that residues of the secondary binding site. This can be illustrated by the intrinsic disorder propensity evaluated for these residues by PONDR® VSL2, which is one of the more accurate per-residue disorder predictors. In fact, the disorder propensities of the residues forming primary site were distributed more uniformly and ranged from 0.2234 to 0.5046, with the mean disorder score of this site being 0.347 ± 0.084. On the other hand, the intrinsic disorder propensities of the secondary site residues were more diversified, with their disorder scores ranging from 0.0796 to 0.5363. As a result, the mean disorder score of this site was 0.26 ± 0.17. Furthermore, residues involved in the overlapping IBU/Aβ40-binding sites were characterized by the most uniform distribution of their intrinsic disorder predispositions, with Ala213, Lys351, Leu481, and Val482 showing disorder scores of 0.4271, 0.2113, 0.2888, and 0.2712 (mean disorder score 0.300 ± 0.091). These observations suggest that the efficiency of the IBU and Aβ40 binding by HSA can be linked to the local intrinsic flexibility of this protein (i.e., flexibility encoded in the amino acid sequence and not in the 3D structure and reflected in the local peculiarities of the per-residue intrinsic disorder profile). Interestingly, stronger IBU binding to the primary site can be due to the higher overall flexibility of this site that can better adjust to the ligand at binding.

3. Materials and Methods

3.1. Materials

Fatty-acid-free has prepared under non-denaturing conditions [42] was purchased from Merck (#126654). Ubiquitin carboxyl-terminal hydrolase 2, catalytic core, (Usp2-cc) was prepared mainly as described in ref. [56]. IBU was purchased from Acros Organics. Ultra-grade Tris and 2-mercaptoethanol (2-ME) were from Amresco® LLC (Vienna, Austria). Urea, imidazole, sodium chloride, potassium chloride, sodium hydroxide, SDS, and glycerol were purchased from Panreac AppliChem (Darmstadt, Germany). Calcium chloride and magnesium chloride were from Fluka (Charlotte, NC, USA). EDTA, ThT, and polyethylene glycol sorbitan monolaurate (TWEEN®) 20 were from Sigma-Aldrich (St. Louis, MO, USA). Ethanolamine and ProfinityTM IMAC resin were bought from Bio-Rad Laboratories (Hercules, USA). Hydrochloric acid was from Sigma Tec LLC (Moscow, Russia). Dimethyl sulfoxide (DMSO) was from Helicon (Moscow, Russia). Trifluoroacetic acid (TFA) was purchased from Fisher Scientific (Madrid, Spain). Sodium azide was from Dia-M (Moscow, Russia).
Protein concentrations were measured spectrophotometrically using molar extinction coefficients at 280 nm calculated according to ref. [57]: 34,445 M−1cm−1 for HSA and 1490 M−1cm−1 for Aβ40/Aβ40(A21G)/Aβ42 at pH 7.4–8.0.
Stock solution of ThT (0.8 mg/mL) was prepared in distilled, deionized water. The ThT concentration was measured spectrophotometrically using the molar extinction coefficient at 412 nm of 36,000 M−1cm−1 [58].

3.2. Preparation of Recombinant Human Aβ Samples

Human Aβ40/Aβ42/Aβ40(A21G) were expressed in E. coli and purified as described earlier [12,13] with the following modifications. The cells were disintegrated by wet grinding using a Retsch® Mixer Mill MM 400 (glass beads with diameter of 0.5–0.75 mm, grinding time 1 min, 7 cycles). The supernatant was loaded onto a ProfinityTM IMAC resin column (5 mL) equilibrated with buffer A (50 mM Tris-HCl, 8 M urea, 5 mM 2-ME, pH 8.2). The column was shaken at 10–15 rpm for 60 min at room temperature using a rotator, followed by sequential washing of the column with 50 mL of buffer A with 5 mM imidazole, 20% glycerol, and 0.5% TWEEN® 20; 50 mL of buffer A with 5 mM imidazole and 20% glycerol; and 50 mL of buffer A with 5 mM imidazole. The 6× His–ubiquitin–Aβ fusion protein was eluted from the column with a linear gradient of 10–300 mM imidazole (60 mL). Aβ was excised from the fusion protein by the Usp2-cc treatment. To remove the His-tagged ubiquitin and Usp2-cc, the hydrolysate was loaded onto a ProfinityTM IMAC resin column equilibrated with buffer A, the column was shaken at 10–15 rpm for 60 min at room temperature. The unbound fraction containing Aβ was purified by high-performance liquid chromatography using a Phenomenex® Jupiter C18 column. Precise chain cleavage by Usp2-cc was confirmed by electrospray ionization mass spectrometry (Shimadzu LCMS-2010EV). The purified Aβ samples were freeze-dried and stored at −70 °C.

3.3. Preparation of Aβ Samples for SPR Experiments

The human Aβ40/Aβ42/Aβ40(A21G) samples were pretreated prior to SPR studies mainly as described in ref. [59]. The freeze-dried Aβ samples were dissolved in neat TFA at a concentration of 0.5–1 mg/mL, followed by sonication for 30 s and TFA evaporation using an Eppendorf Concentrator plus. The dried Aβ samples were dissolved in DMSO at a concentration of 2 mg/mL and stored at −20 °C.

3.4. Surface Plasmon Resonance Studies

SPR measurements of HSA affinity to monomeric Aβ samples at 25 °C were performed using a Bio-Rad ProteOn™ XPR36 protein interaction array system similarly to the procedure described in refs. [12,13]. The pretreated ligand (0.05 mg/mL Aβ40/Aβ40(A21G)/Aβ42 in 10 mM sodium acetate, pH 4.5 buffer) was immobilized on a ProteOn™ GLH sensor chip surface by amine coupling up to 6000–9000 RUs. The rest of the activated amine groups on the chip surface were blocked by 1 M ethanolamine solution. The non-covalently bound ligand molecules were sequentially washed from the chip surface until stabilization of the SPR signal using the following water solutions: 2% SDS, 100 mM HCl, 20 mM EDTA pH 8.0 with 1% SDS. The analyte (0.5–8 μM HSA) in the running buffer (20 mM Tris-HCl, 140 mM NaCl, 4.9 mM KCl, 1 mM MgCl2, 2.5 mM CaCl2, pH 7.4) with/without 100 µM IBU was passed over the chip at a rate of 30 μL/min for 300 s, followed by flushing the chip with the running buffer for 2400 s. The sensor chip surface was regenerated by passage of a water solution of 0.5% SDS. The double-referenced SPR sensograms were analyzed using the heterogeneous ligand model (Equation (1)), assuming presence of two populations of a ligand (L1 and L2) that bind an analyte molecule (A):
  k a 1 L 1 +   A L 1 A k d 1 K d 1           k a 2 L 2 +   A L 2 A k d 2 K d 2
where ka and kd refer to kinetic association and dissociation constants, respectively; Kd1 and Kd2 are equilibrium dissociation constants. The equilibrium and kinetic dissociation/association constants were evaluated for each analyte concentration using Bio-Rad ProteOn Manager™ v.3.1 software (Hercules, CA, USA), followed by averaging of the resulting values (n = 3–4; standard deviations are indicated).

3.5. Preparation of Aβ Samples for ThT Fluorescence Assay

The human Aβ40/Aβ40(A21G) samples were dissolved in 10 mM NaOH at pH ~12 (0.5 mg/mL) and then rocked gently for 72 h at 4 °C. Since Aβ lacks W residues and contains a single Y residue, Aβ concentrations were determined spectrophotometrically using the molar extinction coefficient of tyrosinate at 293 nm of 2330 M−1cm−1 [60].

3.6. ThT Fluorescence Assay

ThT fluorescence emission measurements were carried out using a BioTek Synergy H1 multimode microplate reader and Greiner Bio-One non-binding microplates #781906 mainly as described in ref. [11]. Briefly, 20 µM Aβ40/Aβ40(A21G) in 25 mM Tris-HCl, 140 mM NaCl, 4.9 mM KCl, 1 mM MgCl2, 2.5 mM CaCl2, pH 7.4 buffer with 0.05% NaN3 was incubated with 10 µM ThT in the absence/presence of 2–10 µM HSA and/or 20 µM IBU at 30 °C. ThT fluorescence was excited at 440 nm and emission at 485 nm was measured for 190 h every 30 min, with orbital shaking prior to each measurement. The kinetic fluorescence data for Aβ40 were described by the Boltzmann sigmoid function (Equation (2)) using OriginPro v.9.0 (OriginLab Corp.) software:
y = A 1 A 2 1 + e t t 0 × k a p p + A 2
where A1 and A2 are the initial and final fluorescence levels, t0 is the half-transition time and kapp is the apparent rate constant of the Aβ40 fibrillation. The lag time, tlag, is calculated as (t0 − 2/kapp) [61]. Each measurement was performed in 3–5 repetitions, and the mean kapp and tlag values with standard deviations are shown.

3.7. Transmission Electron Microscopy

The samples after the ThT fluorescence assay (HSA concentration of 2 µM) were diluted 2-fold using 25 mM Tris-HCl, 140 mM NaCl, 4.9 mM KCl, 1 mM MgCl2, 2.5 mM CaCl2, pH 7.4 buffer. A copper 300 mesh grid coated with a formvar film (0.2%) was put on a sample drop (10 µL). After 7 min of the sample absorption, the grid was negatively stained for 2 min with UranyLess (Electron Microscopy Sciences, Hatfield, CA, USA). The excess of the staining agent was removed with a filter paper and deionized water rinse for 2 min. The samples were studied using a Tecnai G2 Spirit Bio(TWIN) transmission electron microscope (FEI Company, Czech Republic) (120 keV), equipped with a high-resolution ORIUS SC 1000B CCD camera (Gatan, Inc., Pleasanton, CA, USA).

3.8. Structural Modeling of Aβ40/IBU–HSA Complexes

The molecular modeling was based upon the structures of human Aβ40, HSA, and its complex with IBU (PDB [62] entries 2LFM, 1AO6, and 2BXG, respectively). In all, 25 models of the Aβ40–HSA complex were generated using ClusPro docking server [54]. The balanced scoring scheme was used for calculations of the interaction energies. The contact residues in the docking models of Aβ40–HSA complex were calculated using Python 3.3 programming language (implemented in PyCharm v.3.0.2 (Saint Petersburg, Russia) development environment), Matplotlib Python plotting library, and NumPy numerical mathematics extension. Examination of the contact residues in the HSA–IBU complex was performed using the PLIP service [55]. The numbering of the contact residues is according to the PDB entries. The tertiary structure models were drawn with molecular visualization system PyMOL v.1.6.9.0 (New York, NY, USA) [63].

3.9. Per-Residue Intrinsic Disorder Predisposition of HSA

The intrinsic disorder predisposition of HSA (residues 25–609 of UniProt ID: P02768) was evaluated using the web crawler RIDAO that aggregates the results from six well-known per-residue disorder predictors: PONDR® VLXT [64], PONDR® VL3 [65], PONDR® VSL2 [66], PONDR® FIT [67], IUPred2-Short, and IUPred2_Long [68,69,70,71]. Details of the local HSA disorder propensity in the IBU binding sites 1 and 2 were further characterized by PONDR® VSL2, which belongs to the group of the most accurate disorder predictors as evidenced by the results of the recently conducted ‘Critical assessment of protein intrinsic disorder prediction’ (CAID) experiment, where PONDR® VSL2 was recognized as predictor #3 of the 43 evaluated methods [72].

4. Conclusions

Epidemiological studies have reported lower rates of AD among people who had been taking IBU for chronic treatment of inflammatory conditions [36,37,73]. The reduction in brain deposition of Aβ upon treatment with IBU has been shown in several mouse AD models [28,29,30,32,33,34,35]. This effect has been ascribed to several indirect mechanisms, including downregulation of β-secretase 1 and COX-2 [28], reduction in Aβ42 production [32], inhibition of interleukin-1β and its downstream target α1-antichymotrypsin [33,34], attenuation of NADPH oxidase activation and reactive oxygen species production [35]. The in vitro data presented here suggest an additional modality, in which IBU prevents Aβ from deleterious multimerization due to synergistic action of the following factors: the improvement of Aβ trapping by HSA, enhancement of inhibitory action of HSA toward Aβ fibrillation, as well as direct prevention of Aβ fibrillation/aggregation by IBU [49,50]. One may expect both an allosteric regulation of HSA affinity to monomeric Aβ by IBU and the more complicated mechanism, in which IBU binding to Aβ monomer [51,52] alters Aβ affinity to HSA. For instance, IBU was shown to allosterically affect HSA affinity to heme [74,75] and lorazepam [76]. In the latter case, IBU binding to HSA enhanced its affinity to lorazepam.
We have previously shown that serotonin and some major plasma unsaturated fatty acids (arachidonic/linoleic acid) enhance HSA affinity toward monomeric Aβ [12,13]. The effect observed in the case of IBU (Table 1) exceeds that for the unsaturated fatty acids [12] but is lower than the effect for serotonin [13]. The HSA sites occupied by IBU (Figure 6) do not intersect with the previously predicted serotonin-binding site [13], indicating that the increase in HSA affinity to monomeric Aβ can be achieved via ligand binding to different sites. Meanwhile, other HSA ligands, such as tolbutamide [7], cholesterol, palmitic acid, and warfarin [14], exert the opposite effect, thereby demonstrating that a search of the substances favoring HSA interaction with Aβ represents a non-trivial task. This conclusion is further supported by the fact that tryptophan despite minor structural differences from serotonin and the same predicted binding pocket does not affect the HSA–Aβ40/Aβ42 equilibrium [13].
The findings presented here expand our knowledge of the potential for the directed reduction of free Aβ concentration and the suppression of its fibrillation by HSA using endogenous and exogenous HSA ligands.

Author Contributions

Conceptualization, E.A.L. and S.E.P.; methodology, A.S.K., E.I.D., A.V.M. and E.A.L.; validation, E.A.L., A.S.K., E.I.D., E.L.N., A.V.M., V.N.U. and S.E.P.; formal analysis, E.A.L., A.S.K., E.I.D., E.L.N., M.P.S., A.V.M., A.A.N., M.E.P., V.N.U. and S.E.P.; investigation, E.A.L., A.S.K., E.I.D., E.L.N., M.P.S., A.V.M., A.A.N., M.E.P., V.N.U. and S.E.P.; resources, E.A.L. and S.E.P.; data curation, E.A.L., V.N.U. and S.E.P.; writing—original draft preparation, E.A.L., A.S.K., E.I.D., E.L.N., M.P.S., A.V.M., V.N.U. and S.E.P.; writing—review and editing, E.A.L., V.N.U. and S.E.P.; visualization, E.A.L., A.S.K., E.I.D., E.L.N., A.V.M., V.N.U. and S.E.P.; supervision, E.A.L. and S.E.P.; project administration, E.A.L. and S.E.P.; funding acquisition, E.A.L. All authors have read and agreed to the published version of the manuscript.

Funding

This work was supported by a grant to E.A.L. from the Russian Science Foundation (No. 20-74-10072).

Institutional Review Board Statement

Not applicable.

Informed Consent Statement

Not applicable.

Data Availability Statement

Not applicable.

Acknowledgments

The authors are grateful to Gerasimov V.N., Kotov S.A., and Grinenko D.V. (State Research Center for Applied Biotechnology and Microbiology, Obolensk, Moscow region, Russia) for their kind support and assistance in the TEM studies.

Conflicts of Interest

The authors declare no conflict of interest.

Abbreviations

2-ME2-mercaptoethanol
amyloid-β peptide
40/Aβ42amyloid-β peptide, residues 1-40/42
40(A21G)A21G mutant of amyloid-β peptide 1-40, Flemish variant of Aβ40 [41]
ADAlzheimer’s disease
a.u.arbitrary units
COXcyclooxygenase
CSFcerebrospinal fluid
DMSOdimethyl sulfoxide
EDTAethylenediaminetetraacetic acid
HSAhuman serum albumin
IBUibuprofen, 2-[4-(2-methylpropyl)phenyl]propanoic acid (CAS #15687-27-1)
PDBProtein Data Bank
RUresonance unit
SDSsodium dodecyl sulfate
SPRsurface plasmon resonance
TEMtransmission electron microscopy
TFAtrifluoroacetic acid
ThTthioflavin T
Tristris(hydroxymethyl)aminomethane
TWEEN®polyethylene glycol sorbitan monolaurate
Usp2-ccubiquitin carboxyl-terminal hydrolase 2, catalytic core
WHOWorld Health Organization

References

  1. Weller, J.; Budson, A. Current understanding of Alzheimer’s disease diagnosis and treatment. F1000Research 2018, 7. [Google Scholar] [CrossRef] [PubMed] [Green Version]
  2. Tatulian, S.A. Challenges and hopes for Alzheimer’s disease. Drug Discov. Today 2022. [Google Scholar] [CrossRef] [PubMed]
  3. Roda, A.R.; Serra-Mir, G.; Montoliu-Gaya, L.; Tiessler, L.; Villegas, S. Amyloid-beta peptide and tau protein crosstalk in Alzheimer’s disease. Neural Regen. Res. 2022, 17, 1666–1674. [Google Scholar]
  4. Reiss, A.B.; Arain, H.A.; Stecker, M.M.; Siegart, N.M.; Kasselman, L.J. Amyloid toxicity in Alzheimer’s disease. Rev. Neurosci. 2018, 29, 613–627. [Google Scholar] [CrossRef]
  5. Lalli, G.; Schott, J.M.; Hardy, J.; De Strooper, B. Aducanumab: A new phase in therapeutic development for Alzheimer’s disease? EMBO Mol. Med. 2021, 13, e14781. [Google Scholar] [CrossRef] [PubMed]
  6. Chen, G.F.; Xu, T.H.; Yan, Y.; Zhou, Y.R.; Jiang, Y.; Melcher, K.; Xu, H.E. Amyloid beta: Structure, biology and structure-based therapeutic development. Acta Pharmacol. Sin. 2017, 38, 1205–1235. [Google Scholar] [CrossRef] [PubMed]
  7. Bohrmann, B.; Tjernberg, L.; Kuner, P.; Poli, S.; Levet-Trafit, B.; Naslund, J.; Richards, G.; Huber, W.; Dobeli, H.; Nordstedt, C. Endogenous proteins controlling amyloid beta-peptide polymerization. Possible implications for beta-amyloid formation in the central nervous system and in peripheral tissues. J. Biol. Chem. 1999, 274, 15990–15995. [Google Scholar] [CrossRef] [Green Version]
  8. Ezra, A.; Rabinovich-Nikitin, I.; Rabinovich-Toidman, P.; Solomon, B. Chapter 11—Multifunctional Effects of Human Serum Albumin Toward Neuroprotection in Alzheimer Disease. In Neuroprotection in Alzheimer’s Disease; Gozes, I., Ed.; Academic Press: Cambridge, MA, USA, 2017; pp. 217–238. [Google Scholar]
  9. Biere, A.L.; Ostaszewski, B.; Stimson, E.R.; Hyman, B.T.; Maggio, J.E.; Selkoe, D.J. Amyloid beta-peptide is transported on lipoproteins and albumin in human plasma. J. Biol. Chem. 1996, 271, 32916–32922. [Google Scholar] [CrossRef] [PubMed] [Green Version]
  10. Seyfert, S.; Faulstich, A.; Marx, P. What determines the CSF concentrations of albumin and plasma-derived IgG? J. Neurol. Sci. 2004, 219, 31–33. [Google Scholar] [CrossRef]
  11. Stanyon, H.; Viles, J. Human serum albumin can regulate amyloid-β peptide fiber growth in the brain interstitium: Implications for Alzheimer disease. J. Biol. Chem. 2012, 287, 28163–28168. [Google Scholar] [CrossRef] [Green Version]
  12. Litus, E.A.; Kazakov, A.S.; Sokolov, A.S.; Nemashkalova, E.L.; Galushko, E.I.; Dzhus, U.F.; Marchenkov, V.V.; Galzitskaya, O.V.; Permyakov, E.A.; Permyakov, S.E. The binding of monomeric amyloid beta peptide to serum albumin is affected by major plasma unsaturated fatty acids. Biochem. Biophys. Res. Commun. 2019, 510, 248–253. [Google Scholar] [CrossRef] [PubMed]
  13. Litus, E.A.; Kazakov, A.S.; Deryusheva, E.I.; Nemashkalova, E.L.; Shevelyova, M.P.; Nazipova, A.A.; Permyakova, M.E.; Raznikova, E.V.; Uversky, V.N.; Permyakov, S.E. Serotonin promotes serum albumin interaction with the monomeric amyloid β peptide. Int. J. Mol. Sci. 2021, 22, 5896. [Google Scholar] [CrossRef]
  14. Bode, D.C.; Stanyon, H.F.; Hirani, T.; Baker, M.D.; Nield, J.; Viles, J.H. Serum albumin’s protective inhibition of amyloid-β fiber formation is suppressed by cholesterol, fatty acids and warfarin. J. Mol. Biol. 2018, 430, 919–934. [Google Scholar] [CrossRef]
  15. Boada, M.; Ortiz, P.; Anaya, F.; Hernandez, I.; Munoz, J.; Nunez, L.; Olazaran, J.; Roca, I.; Cuberas, G.; Tarraga, L.; et al. Amyloid-targeted therapeutics in alzheimer’s disease: Use of human albumin in plasma exchange as a novel approach for a beta mobilization. Drug News Perspect. 2009, 22, 325–339. [Google Scholar] [CrossRef]
  16. Boada, M.; Lopez, O.L.; Olazaran, J.; Nunez, L.; Pfeffer, M.; Paricio, M.; Lorites, J.; Pinol-Ripoll, G.; Gamez, J.E.; Anaya, F.; et al. A randomized, controlled clinical trial of plasma exchange with albumin replacement for Alzheimer’s disease: Primary results of the AMBAR Study. Alzheimers Dement. 2020, 16, 1412–1425. [Google Scholar] [CrossRef] [PubMed]
  17. Boada, M.; Lopez, O.; Nunez, L.; Szczepiorkowski, Z.M.; Torres, M.; Grifols, C.; Paez, A. Plasma exchange for Alzheimer’s disease Management by Albumin Replacement (AMBAR) trial: Study design and progress. Alzheimers Dement. 2019, 5, 61–69. [Google Scholar] [CrossRef]
  18. Boada, M.; Ramos-Fernandez, E.; Guivernau, B.; Munoz, F.J.; Costa, M.; Ortiz, A.M.; Jorquera, J.I.; Nunez, L.; Torres, M.; Paez, A. Treatment of Alzheimer disease using combination therapy with plasma exchange and haemapheresis with albumin and intravenous immunoglobulin: Rationale and treatment approach of the AMBAR (Alzheimer Management By Albumin Replacement) study. Neurologia 2016, 31, 473–481. [Google Scholar] [CrossRef] [PubMed]
  19. Ezra, A.; Rabinovich-Nikitin, I.; Rabinovich-Toidman, P.; Solomon, B. Multifunctional effect of human serum albumin reduces Alzheimer’s disease related pathologies in the 3xTg mouse model. J. Alzheimers Dis. 2016, 50, 175–188. [Google Scholar] [CrossRef] [PubMed]
  20. Rainsford, K.D. Ibuprofen: Pharmacology, efficacy and safety. Inflammopharmacology 2009, 17, 275–342. [Google Scholar] [CrossRef]
  21. Bushra, R.; Aslam, N. An overview of clinical pharmacology of Ibuprofen. Oman Med. J. 2010, 25, 155–1661. [Google Scholar] [CrossRef]
  22. Herzfeldt, C.D.; Kummel, R. Dissociation-constants, solubilities and dissolution rates of some selected non-steroidal antiinflammatories. Drug Dev. Ind. Pharm. 1983, 9, 767–793. [Google Scholar] [CrossRef]
  23. Avdeef, A.; Berger, C.M.; Brownell, C. pH-Metric Solubility. 2: Correlation Between the acid-base titration and the saturation shake-flask solubility-pH methods. Pharm. Res. 2000, 17, 85–89. [Google Scholar] [CrossRef] [PubMed]
  24. Mills, R.F.; Adams, S.S.; Cliffe, E.E.; Dickinson, W.; Nicholson, J.S. The metabolism of ibuprofen. Xenobiotica 1973, 3, 589–598. [Google Scholar] [CrossRef]
  25. Whitlam, J.B.; Crooks, M.J.; Brown, K.F.; Pedersen, P.V. Binding of nonsteroidal anti-inflammatory agents to proteins—I. Ibuprofen-serum albumin interaction. Biochem. Pharmacol. 1979, 28, 675–678. [Google Scholar] [CrossRef]
  26. Ghuman, J.; Zunszain, P.A.; Petitpas, I.; Bhattacharya, A.A.; Otagiri, M.; Curry, S. Structural basis of the drug-binding specificity of human serum albumin. J. Mol. Biol. 2005, 353, 38–52. [Google Scholar] [CrossRef]
  27. Guglielmelli, A.; Rizzuti, B.; Guzzi, R. Stereoselective and domain-specific effects of ibuprofen on the thermal stability of human serum albumin. Eur. J. Pharm. Sci. 2018, 112, 122–131. [Google Scholar] [CrossRef]
  28. Heneka, M.T.; Sastre, M.; Dumitrescu-Ozimek, L.; Hanke, A.; Dewachter, I.; Kuiperi, C.; O’Banion, K.; Klockgether, T.; Van Leuven, F.; Landreth, G.E. Acute treatment with the PPARgamma agonist pioglitazone and ibuprofen reduces glial inflammation and Abeta1-42 levels in APPV717I transgenic mice. Brain 2005, 128, 1442–1453. [Google Scholar] [CrossRef] [Green Version]
  29. McKee, A.C.; Carreras, I.; Hossain, L.; Ryu, H.; Klein, W.L.; Oddo, S.; LaFerla, F.M.; Jenkins, B.G.; Kowall, N.W.; Dedeoglu, A. Ibuprofen reduces Abeta, hyperphosphorylated tau and memory deficits in Alzheimer mice. Brain Res. 2008, 1207, 225–236. [Google Scholar] [CrossRef] [Green Version]
  30. Choi, J.K.; Jenkins, B.G.; Carreras, I.; Kaymakcalan, S.; Cormier, K.; Kowall, N.W.; Dedeoglu, A. Anti-inflammatory treatment in AD mice protects against neuronal pathology. Exp. Neurol. 2010, 223, 377–384. [Google Scholar] [CrossRef] [Green Version]
  31. Woodling, N.S.; Colas, D.; Wang, Q.; Minhas, P.; Panchal, M.; Liang, X.; Mhatre, S.D.; Brown, H.; Ko, N.; Zagol-Ikapitte, I.; et al. Cyclooxygenase inhibition targets neurons to prevent early behavioural decline in Alzheimer’s disease model mice. Brain 2016, 139, 2063–2081. [Google Scholar] [CrossRef] [Green Version]
  32. Yan, Q.; Zhang, J.; Liu, H.; Babu-Khan, S.; Vassar, R.; Biere, A.L.; Citron, M.; Landreth, G. Anti-inflammatory drug therapy alters beta-amyloid processing and deposition in an animal model of Alzheimer’s disease. J. Neurosci. 2003, 23, 7504–7509. [Google Scholar] [CrossRef] [PubMed] [Green Version]
  33. Lim, G.P.; Yang, F.; Chu, T.; Chen, P.; Beech, W.; Teter, B.; Tran, T.; Ubeda, O.; Ashe, K.H.; Frautschy, S.A.; et al. Ibuprofen suppresses plaque pathology and inflammation in a mouse model for Alzheimer’s disease. J. Neurosci. 2000, 20, 5709–5714. [Google Scholar] [CrossRef] [PubMed]
  34. Morihara, T.; Teter, B.; Yang, F.; Lim, G.P.; Boudinot, S.; Boudinot, F.D.; Frautschy, S.A.; Cole, G.M. Ibuprofen suppresses interleukin-1beta induction of pro-amyloidogenic alpha1-antichymotrypsin to ameliorate beta-amyloid (Abeta) pathology in Alzheimer’s models. Neuropsychopharmacology 2005, 30, 1111–1120. [Google Scholar] [CrossRef] [PubMed]
  35. Wilkinson, B.L.; Cramer, P.E.; Varvel, N.H.; Reed-Geaghan, E.; Jiang, Q.; Szabo, A.; Herrup, K.; Lamb, B.T.; Landreth, G.E. Ibuprofen attenuates oxidative damage through NOX2 inhibition in Alzheimer’s disease. Neurobiol. Aging 2012, 33, 197.e21–197.e32. [Google Scholar] [CrossRef] [Green Version]
  36. In’T Veld, B.A.; Ruitenberg, A.; Hofman, A.; Launer, L.J.; Van Duijn, C.M.; Stijnen, T.; Breteler, M.M.; Stricker, B.H. Nonsteroidal antiinflammatory drugs and the risk of Alzheimer’s disease. N. Engl. J. Med. 2001, 345, 1515–1521. [Google Scholar] [CrossRef] [PubMed] [Green Version]
  37. Vlad, S.C.; Miller, D.R.; Kowall, N.W.; Felson, D.T. Protective effects of NSAIDs on the development of Alzheimer disease. Neurology 2008, 70, 1672–1677. [Google Scholar] [CrossRef] [Green Version]
  38. Wang, J.; Tan, L.; Wang, H.F.; Tan, C.C.; Meng, X.F.; Wang, C.; Tang, S.W.; Yu, J.T. Anti-inflammatory drugs and risk of Alzheimer’s disease: An updated systematic review and meta-analysis. J. Alzheimers Dis. 2015, 44, 385–396. [Google Scholar] [CrossRef] [PubMed]
  39. Hamburger, S.A.; McCay, P.B. Spin trapping of ibuprofen radicals: Evidence that ibuprofen is a hydroxyl radical scavenger. Free Radic. Res. Commun. 1990, 9, 337–442. [Google Scholar] [CrossRef]
  40. Czirr, E.; Weggen, S. γ-Secretase modulation with Aβ42-lowering nonsteroidal anti-inflammatory drugs and derived compounds. Neurodegener. Dis. 2006, 3, 298–304. [Google Scholar] [CrossRef]
  41. Hendriks, L.; Vanduijn, C.M.; Cras, P.; Cruts, M.; Vanhul, W.; Vanharskamp, F.; Warren, A.; Mcinnis, M.G.; Antonarakis, S.E.; Martin, J.J.; et al. Presenile-dementia and cerebral-hemorrhage linked to a mutation at codon-692 of the beta-amyloid precursor protein gene. Nat. Genet. 1992, 1, 218–221. [Google Scholar] [CrossRef]
  42. Travis, J.; Pannell, R. Selective removal of albumin from plasma by affinity chromatography. Clin. Chim. Acta 1973, 49, 49–52. [Google Scholar] [CrossRef]
  43. Mehlisch, D.R.; Sykes, J. Ibuprofen blood plasma levels and onset of analgesia. Int. J. Clin. Pract. Suppl. 2013, 67, 3–8. [Google Scholar] [CrossRef] [PubMed]
  44. Mazaleuskaya, L.L.; Theken, K.N.; Gong, L.; Thorn, C.F.; FitzGerald, G.A.; Altman, R.B.; Klein, T.E. PharmGKB summary: Ibuprofen pathways. Pharm. Genom. 2015, 25, 96–106. [Google Scholar] [CrossRef] [PubMed] [Green Version]
  45. Choi, T.S.; Lee, H.J.; Han, J.Y.; Lim, M.H.; Kim, H.I. Molecular insights into human serum albumin as a receptor of amyloid-beta in the extracellular region. J. Am. Chem. Soc. 2017, 139, 15437–15445. [Google Scholar] [CrossRef]
  46. Wang, C.; Cheng, F.; Xu, L.; Jia, L. HSA targets multiple Aβ42 species and inhibits the seeding-mediated aggregation and cytotoxicity of Aβ42 aggregates. RSC Adv. 2016, 6, 71165–71175. [Google Scholar] [CrossRef]
  47. Naiki, H.; Higuchi, K.; Hosokawa, M.; Takeda, T. Fluorometric determination of amyloid fibrils in vitro using the fluorescent dye, thioflavin T1. Anal. Biochem. 1989, 177, 244–249. [Google Scholar] [CrossRef]
  48. Xue, C.; Lin, T.Y.; Chang, D.; Guo, Z. Thioflavin T as an amyloid dye: Fibril quantification, optimal concentration and effect on aggregation. R. Soc. Open Sci. 2017, 4, 160696. [Google Scholar] [CrossRef] [Green Version]
  49. Hirohata, M.; Ono, K.; Naiki, H.; Yamada, M. Non-steroidal anti-inflammatory drugs have anti-amyloidogenic effects for Alzheimer’s β-amyloid fibrils in vitro. Neuropharmacology 2005, 49, 1088–1099. [Google Scholar] [CrossRef] [Green Version]
  50. Agdeppa, E.D.; Kepe, V.; Petri, A.; Satyamurthy, N.; Liu, J.; Huang, S.C.; Small, G.W.; Cole, G.M.; Barrio, J.R. In vitro detection of (S)-naproxen and ibuprofen binding to plaques in the Alzheimer’s brain using the positron emission tomography molecular imaging probe 2-(1-{6-[(2-[18F]fluoroethyl)(methyl)amino]-2-naphthyl}ethylidene)malononitrile. Neuroscience 2003, 117, 723–730. [Google Scholar] [CrossRef]
  51. Lockhart, C.; Kim, S.; Klimov, D.K. Explicit solvent molecular dynamics simulations of Aβ peptide interacting with ibuprofen ligands. J. Phys. Chem. B 2012, 116, 12922–12932. [Google Scholar] [CrossRef]
  52. Raman, E.P.; Takeda, T.; Klimov, D.K. Molecular dynamics simulations of ibuprofen binding to Abeta peptides. Biophys. J. 2009, 97, 2070–2079. [Google Scholar] [CrossRef] [PubMed] [Green Version]
  53. Finder, V.H.; Vodopivec, I.; Nitsch, R.M.; Glockshuber, R. The recombinant amyloid-β peptide Aβ1–42 aggregates faster and is more neurotoxic than synthetic Aβ1–42. J. Mol. Biol. 2010, 396, 9–18. [Google Scholar] [CrossRef] [PubMed]
  54. Desta, I.T.; Porter, K.A.; Xia, B.; Kozakov, D.; Vajda, S. Performance and its limits in rigid body protein-protein docking. Structure 2020, 28, 1071–1081.e3. [Google Scholar] [CrossRef]
  55. Salentin, S.; Schreiber, S.; Haupt, V.J.; Adasme, M.F.; Schroeder, M. PLIP: Fully automated protein-ligand interaction profiler. Nucleic Acids Res. 2015, 43, W443–W447. [Google Scholar] [CrossRef]
  56. Catanzariti, A.-M.; Soboleva, T.A.; Jans, D.A.; Board, P.G.; Baker, R.T. An efficient system for high-level expression and easy purification of authentic recombinant proteins. Protein Sci. 2004, 13, 1331–1339. [Google Scholar] [CrossRef] [PubMed]
  57. Pace, C.N.; Vajdos, F.; Fee, L.; Grimsley, G.; Gray, T. How to measure and predict the molar absorption coefficient of a protein. Protein Sci. 1995, 4, 2411–2423. [Google Scholar] [CrossRef] [PubMed] [Green Version]
  58. De Ferrari, G.V.; Mallender, W.D.; Inestrosa, N.C.; Rosenberry, T.L. Thioflavin T is a fluorescent probe of the acetylcholinesterase peripheral site that reveals conformational interactions between the peripheral and acylation sites. J. Biol. Chem. 2001, 276, 23282–23287. [Google Scholar] [CrossRef] [PubMed] [Green Version]
  59. Zagorski, M.G.; Yang, J.; Shao, H.; Ma, K.; Zeng, H.; Hong, A. Methodological and chemical factors affecting amyloid β peptide amyloidogenicity. Methods Enzymol. 1999, 309, 189–204. [Google Scholar]
  60. Dawson, R.M.C.; Elliott, D.C.; Elliott, W.H.; Jones, K.M. Data for Biochemical Research, 3rd ed.; Oxford Science Publications: Oxford, UK, 1986; 496p. [Google Scholar]
  61. Tiiman, A.; Krishtal, J.; Palumaa, P.; Tõugu, V. In vitro fibrillization of Alzheimer’s amyloid-β peptide (1–42). AIP Adv. 2015, 5, 092401. [Google Scholar] [CrossRef] [Green Version]
  62. Berman, H.M.; Westbrook, J.; Feng, Z.; Gilliland, G.; Bhat, T.N.; Weissig, H.; Shindyalov, I.N.; Bourne, P.E. The Protein Data Bank. Nucleic Acids Res. 2000, 28, 235–242. [Google Scholar] [CrossRef] [Green Version]
  63. Schrödinger, L.L.C. The PyMOL Molecular Graphics System, Version 1.8; Schrödinger, LLC: New York, NY, USA, 2015. [Google Scholar]
  64. Romero, P.; Obradovic, Z.; Li, X.; Garner, E.C.; Brown, C.J.; Dunker, A.K. Sequence complexity of disordered protein. Proteins 2001, 42, 38–48. [Google Scholar] [CrossRef]
  65. Peng, K.; Radivojac, P.; Vucetic, S.; Dunker, A.K.; Obradovic, Z. Length-dependent prediction of protein intrinsic disorder. BMC Bioinform. 2006, 7, 208. [Google Scholar] [CrossRef] [PubMed] [Green Version]
  66. Obradovic, Z.; Peng, K.; Vucetic, S.; Radivojac, P.; Dunker, A.K. Exploiting heterogeneous sequence properties improves prediction of protein disorder. Proteins 2005, 61, 176–182. [Google Scholar] [CrossRef] [PubMed]
  67. Xue, B.; Dunbrack, R.L.; Williams, R.W.; Dunker, A.K.; Uversky, V.N. PONDR-FIT: A meta-predictor of intrinsically disordered amino acids. Biochim. Biophys. Acta 2010, 1804, 996–1010. [Google Scholar] [CrossRef] [Green Version]
  68. Dosztanyi, Z.; Csizmok, V.; Tompa, P.; Simon, I. IUPred: Web server for the prediction of intrinsically unstructured regions of proteins based on estimated energy content. Bioinformatics 2005, 21, 3433–3434. [Google Scholar] [CrossRef] [Green Version]
  69. Dosztanyi, Z.; Csizmok, V.; Tompa, P.; Simon, I. The pairwise energy content estimated from amino acid composition discriminates between folded and intrinsically unstructured proteins. J. Mol. Biol. 2005, 347, 827–839. [Google Scholar] [CrossRef]
  70. Erdos, G.; Dosztanyi, Z. Analyzing Protein Disorder with IUPred2A. Curr. Protoc. Bioinform. 2020, 70, e99. [Google Scholar] [CrossRef] [Green Version]
  71. Meszaros, B.; Erdos, G.; Dosztanyi, Z. IUPred2A: Context-dependent prediction of protein disorder as a function of redox state and protein binding. Nucleic Acids Res. 2018, 46, W329–W337. [Google Scholar] [CrossRef]
  72. Necci, M.; Piovesan, D.; CAID Predictors; DisProt Curators; Tosatto, S.C.E. Critical assessment of protein intrinsic disorder prediction. Nat. Methods 2021, 18, 472–481. [Google Scholar] [CrossRef]
  73. Rivers-Auty, J.; Mather, A.E.; Peters, R.; Lawrence, C.B.; Brough, D. Anti-inflammatories in Alzheimer’s disease—potential therapy or spurious correlate? Brain Commun. 2020, 2, fcaa109. [Google Scholar] [CrossRef]
  74. Baroni, S.; Mattu, M.; Vannini, A.; Cipollone, R.; Aime, S.; Ascenzi, P.; Fasano, M. Effect of ibuprofen and warfarin on the allosteric properties of haem-human serum albumin. A spectroscopic study. Eur. J. Biochem. 2001, 268, 6214–6220. [Google Scholar] [CrossRef] [Green Version]
  75. Nicoletti, F.P.; Howes, B.D.; Fittipaldi, M.; Fanali, G.; Fasano, M.; Ascenzi, P.; Smulevich, G. Ibuprofen induces an allosteric conformational transition in the heme complex of human serum albumin with significant effects on heme ligation. J. Am. Chem. Soc. 2008, 130, 11677–11688. [Google Scholar] [CrossRef] [PubMed]
  76. Fitos, I.; Visy, J.; Simonyi, M.; Hermansson, J. Stereoselective allosteric binding interaction on human serum albumin between ibuprofen and lorazepam acetate. Chirality 1999, 11, 115–120. [Google Scholar] [CrossRef]
Figure 1. Influence of IBU on HSA’s interaction with monomeric Aβ40/Aβ40(A21G)/Aβ42 at 25 °C studied by SPR spectroscopy (20 mM Tris-HCl, 140 mM NaCl, 4.9 mM KCl, 1 mM MgCl2, 2.5 mM CaCl2, pH 7.4). The Aβ was immobilized on the sensor chip’s surface by amine coupling, followed by removal of the non-covalently bound Aβ molecules. HSA concentrations are indicated near the sensograms for its interaction with Aβ40 (A,B), Aβ40(A21G) (C,D), or Aβ42 (E,F) in the absence (A,C,E) or presence of 100 µM IBU (B,D,F). The gray curves are experimental, while the black curves are theoretical, calculated using the heterogeneous ligand model (1) (see Table 1 for the fitting parameters).
Ijms 23 06168 g001
Figure 2. Kinetics of 20 µM Aβ40/Aβ40(A21G) fibrillation at 30 °C depending on the presence of 2–10 µM HSA (A,C) or 20 µM IBU (B,D), monitored using ThT fluorescence assay (25 mM Tris-HCl, 140 mM NaCl, 4.9 mM KCl, 1 mM MgCl2, 2.5 mM CaCl2, pH 7.4 with 0.05% NaN3). The standard deviations of the fluorescence signals are indicated. Excitation at 440 nm; emission at 485 nm.
Ijms 23 06168 g002
Figure 3. Kinetics of 20 µM Aβ40 (A)/Aβ40 (A21G) (B) fibrillation at 30 °C depending on the presence of 2 µM HSA and 20 µM IBU, monitored using ThT fluorescence assay (25 mM Tris-HCl, 140 mM NaCl, 4.9 mM KCl, 1 mM MgCl2, 2.5 mM CaCl2, pH 7.4 with 0.05% NaN3). The standard deviations of the fluorescence signals are indicated. Excitation at 440 nm; emission at 485 nm.
Ijms 23 06168 g003
Figure 4. The lag time tlag (A) and rate constant kapp (B) of Aβ40 fibrillation at 30 °C, estimated from the ThT fluorescence assay data (Figure 3A; 2 µM HSA, 20 µM IBU) using Boltzmann sigmoid function (Equation (2)). The standard deviations are shown (n = 3–5). The statistically significant differences from the experiments in the absence of HSA and IBU are indicated by * (Student’s t-test, p = 0.05).
Ijms 23 06168 g004
Figure 5. Negative staining TEM images of the 20 μM Aβ40 fibers grown in the course of the ThT fluorescence assay shown in Figure 3A in the absence (A) or in the presence of 20 μM IBU (B), 2 μM HSA (C), and 2 μM HSA and 20 μM IBU (D). The scale bars represent 1 μm.
Ijms 23 06168 g005
Figure 6. (A) Overlay of the representative models of the HSA–Aβ40 complex calculated using ClusPro docking server [54] and structure of the HSA–IBU complex (PDB entry 2BXG; HSA chain is hidden due to negligible structural changes upon IBU binding to HSA). HSA, Aβ40, and IBU molecules are shown in gray, blue, and red, respectively. (B) Tertiary structure of the folded state of Aβ40 (PDB entry 2LFM). (C,D) Representation of the HSA residues interacting with IBU (PDB entry 2BXG) according to the PLIP service [55]. The residues also involved in the Aβ40 binding (see A) are highlighted in blue.
Ijms 23 06168 g006
Figure 7. Multiparametric evaluation of the per-residue intrinsic disorder predisposition of the mature HSA (residues 25–609 of UniProt ID: P02768) evaluated by six commonly used disorder predictors: PONDR® VLXT (black line), PONDR® VSL2 (red line), PONDR® VL3 (green line), PONDR® FIT (pink line), IUPred2-Short (yellow line), and IUPred2_Long (blue line). The mean disorder calculated by averaging the outputs of the individual predictors is shown by the bold dashed dark-pink line. Light-pink shadow shows distribution of errors of mean. The disorder threshold of 0.5 (thin black line) separates residues to ordered or intrinsically disordered with the corresponding predicted disorder scores <0.5 and ≥0.5, respectively. Flexible residues are characterized by the disorder scores ranging from 0.15 (shown by thin dashed line) and 0.5. Positions of residues involved in the IBU biding sites 1 (primary) and 2 (secondary) are shown by vertical dark-yellow and dark-green bars.
Ijms 23 06168 g007
Table 1. Parameters of the heterogeneous ligand model (1) describing the SPR data on kinetics of the HSA–Aβ interaction in the absence or presence of IBU (see Figure 1).
[IBU], µMka1 × 10−3,
M−1s−1
kd1 × 106,
s−1
Kd1 × 1010,
M
ka2 × 10−3,
M−1s−1
kd2 × 106,
s−1
Kd2 × 1010,
M
40
065 ± 153.4 ± 0.60.52 ± 0.098.0 ± 0.87.9 ± 0.69.9 ± 0.9
10035 ± 50.43 ± 0.050.16 ± 0.025.7 ± 0.62.2 ± 0.23.9 ± 0.4
40(A21G)
030 ± 30.43 ± 0.060.14 ± 0.022.7 ± 0.31.8 ± 0.26.7 ± 0.6
10025 ± 40.20 ± 0.030.082 ± 0.0122.4 ± 0.31.03 ± 0.104.2 ± 0.6
42
050 ± 53.0 ± 0.50.60 ± 0.067.2 ± 1.14.9 ± 0.66.9 ± 0.7
10040 ± 40.46 ± 0.060.11 ± 0.028.6 ± 0.81.4 ± 0.21.7 ± 0.2
Publisher’s Note: MDPI stays neutral with regard to jurisdictional claims in published maps and institutional affiliations.

