
Distinct Gene Set Enrichment Profiles in Eosinophilic and Non-Eosinophilic Chronic Rhinosinusitis with Nasal Polyps by Bulk RNA Barcoding and Sequencing

 ,
,  , and
, and
Abstract
:1. Introduction
2. Results
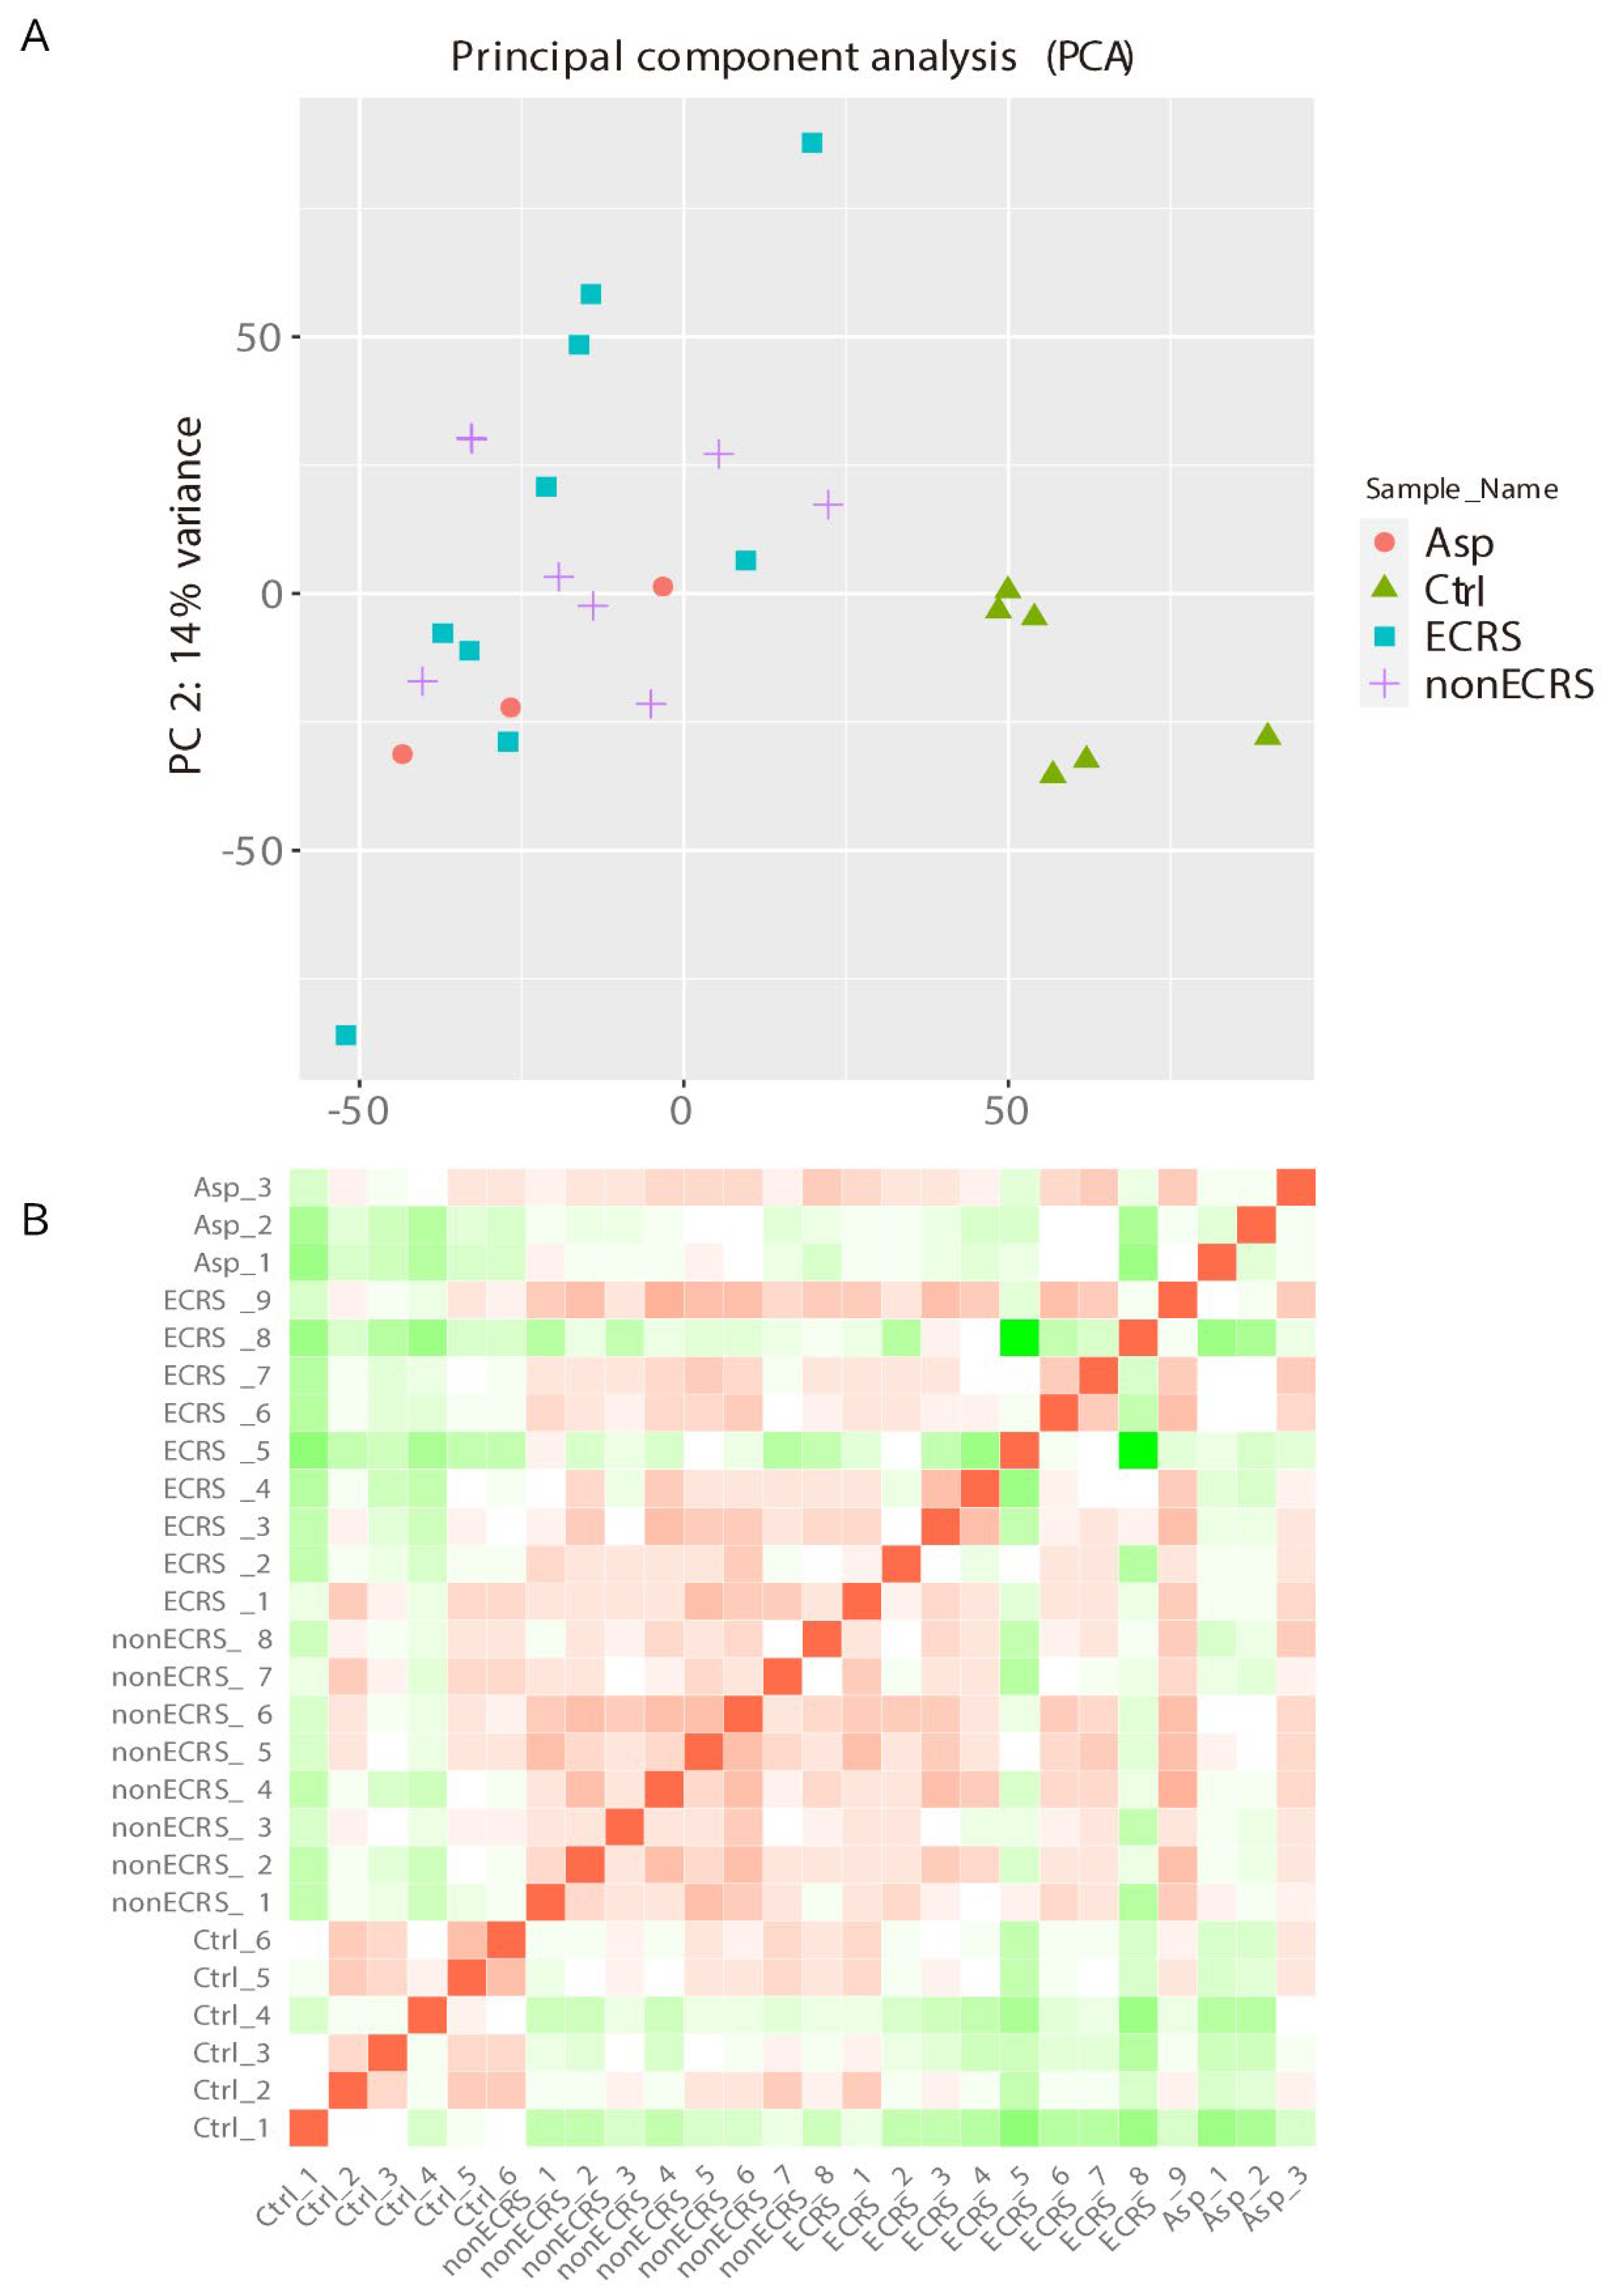
2.1. Gene Expression Profiles of NPs between ECRS, NonECRS, and Asp
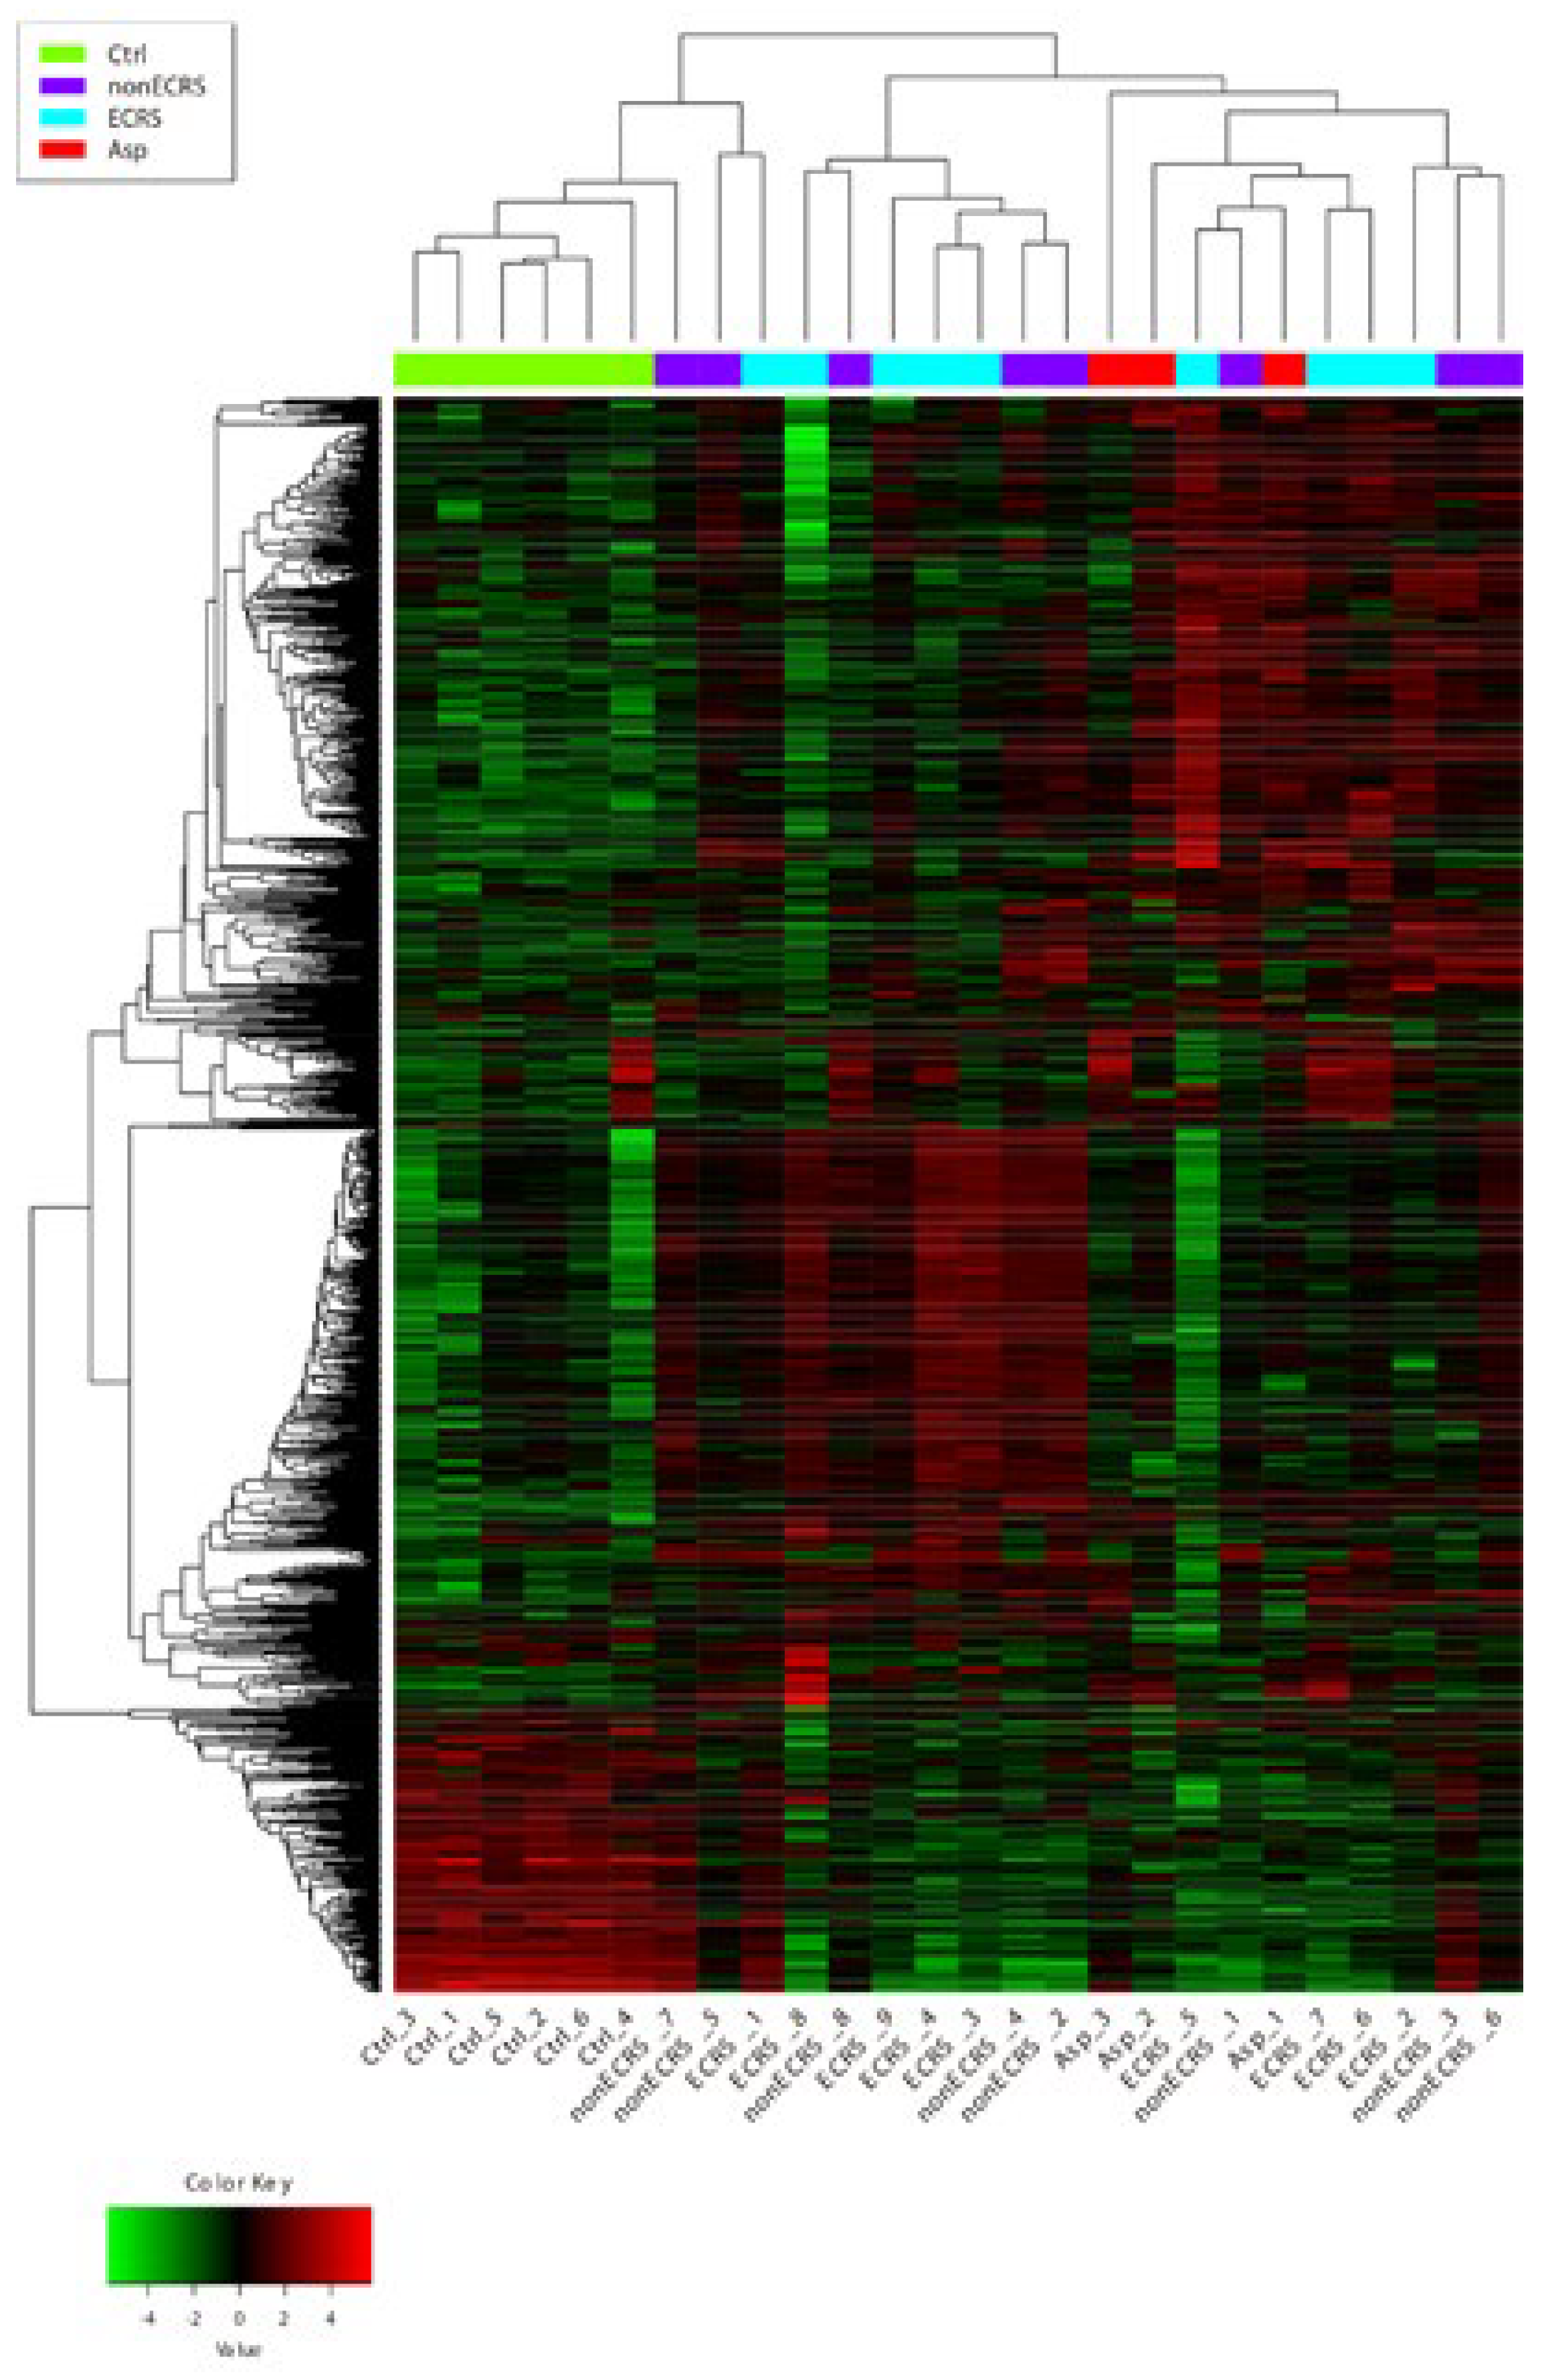
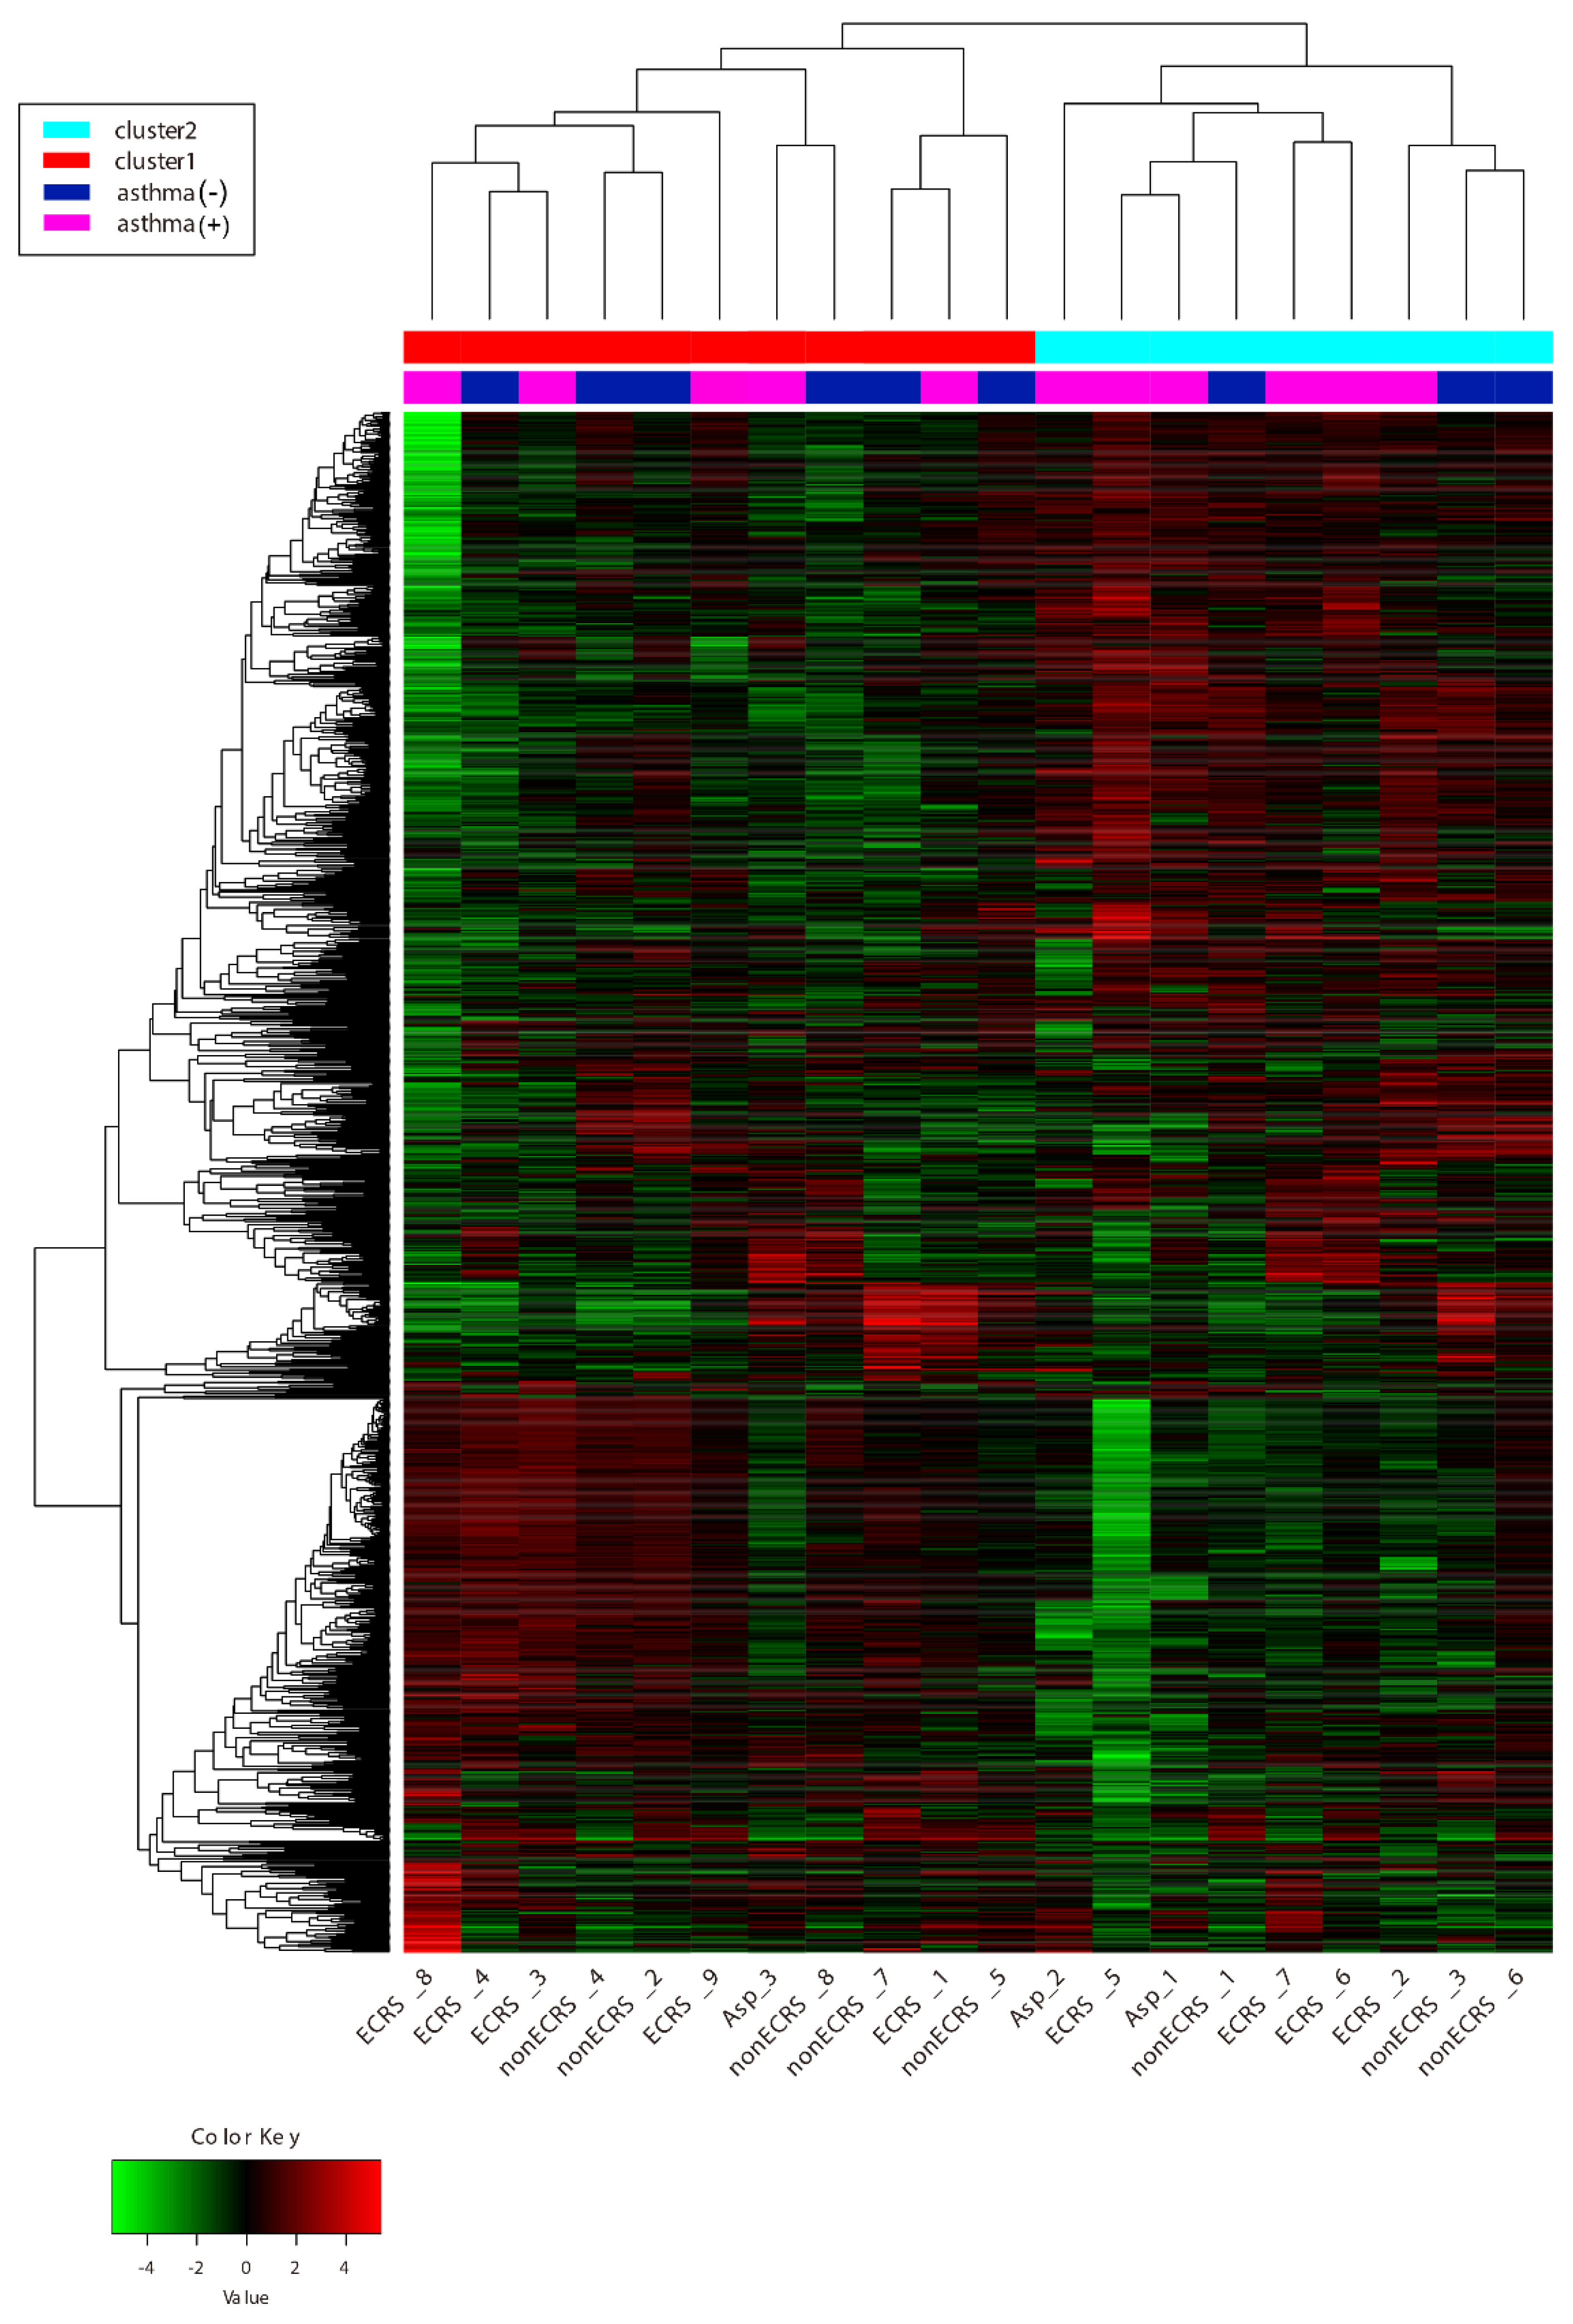
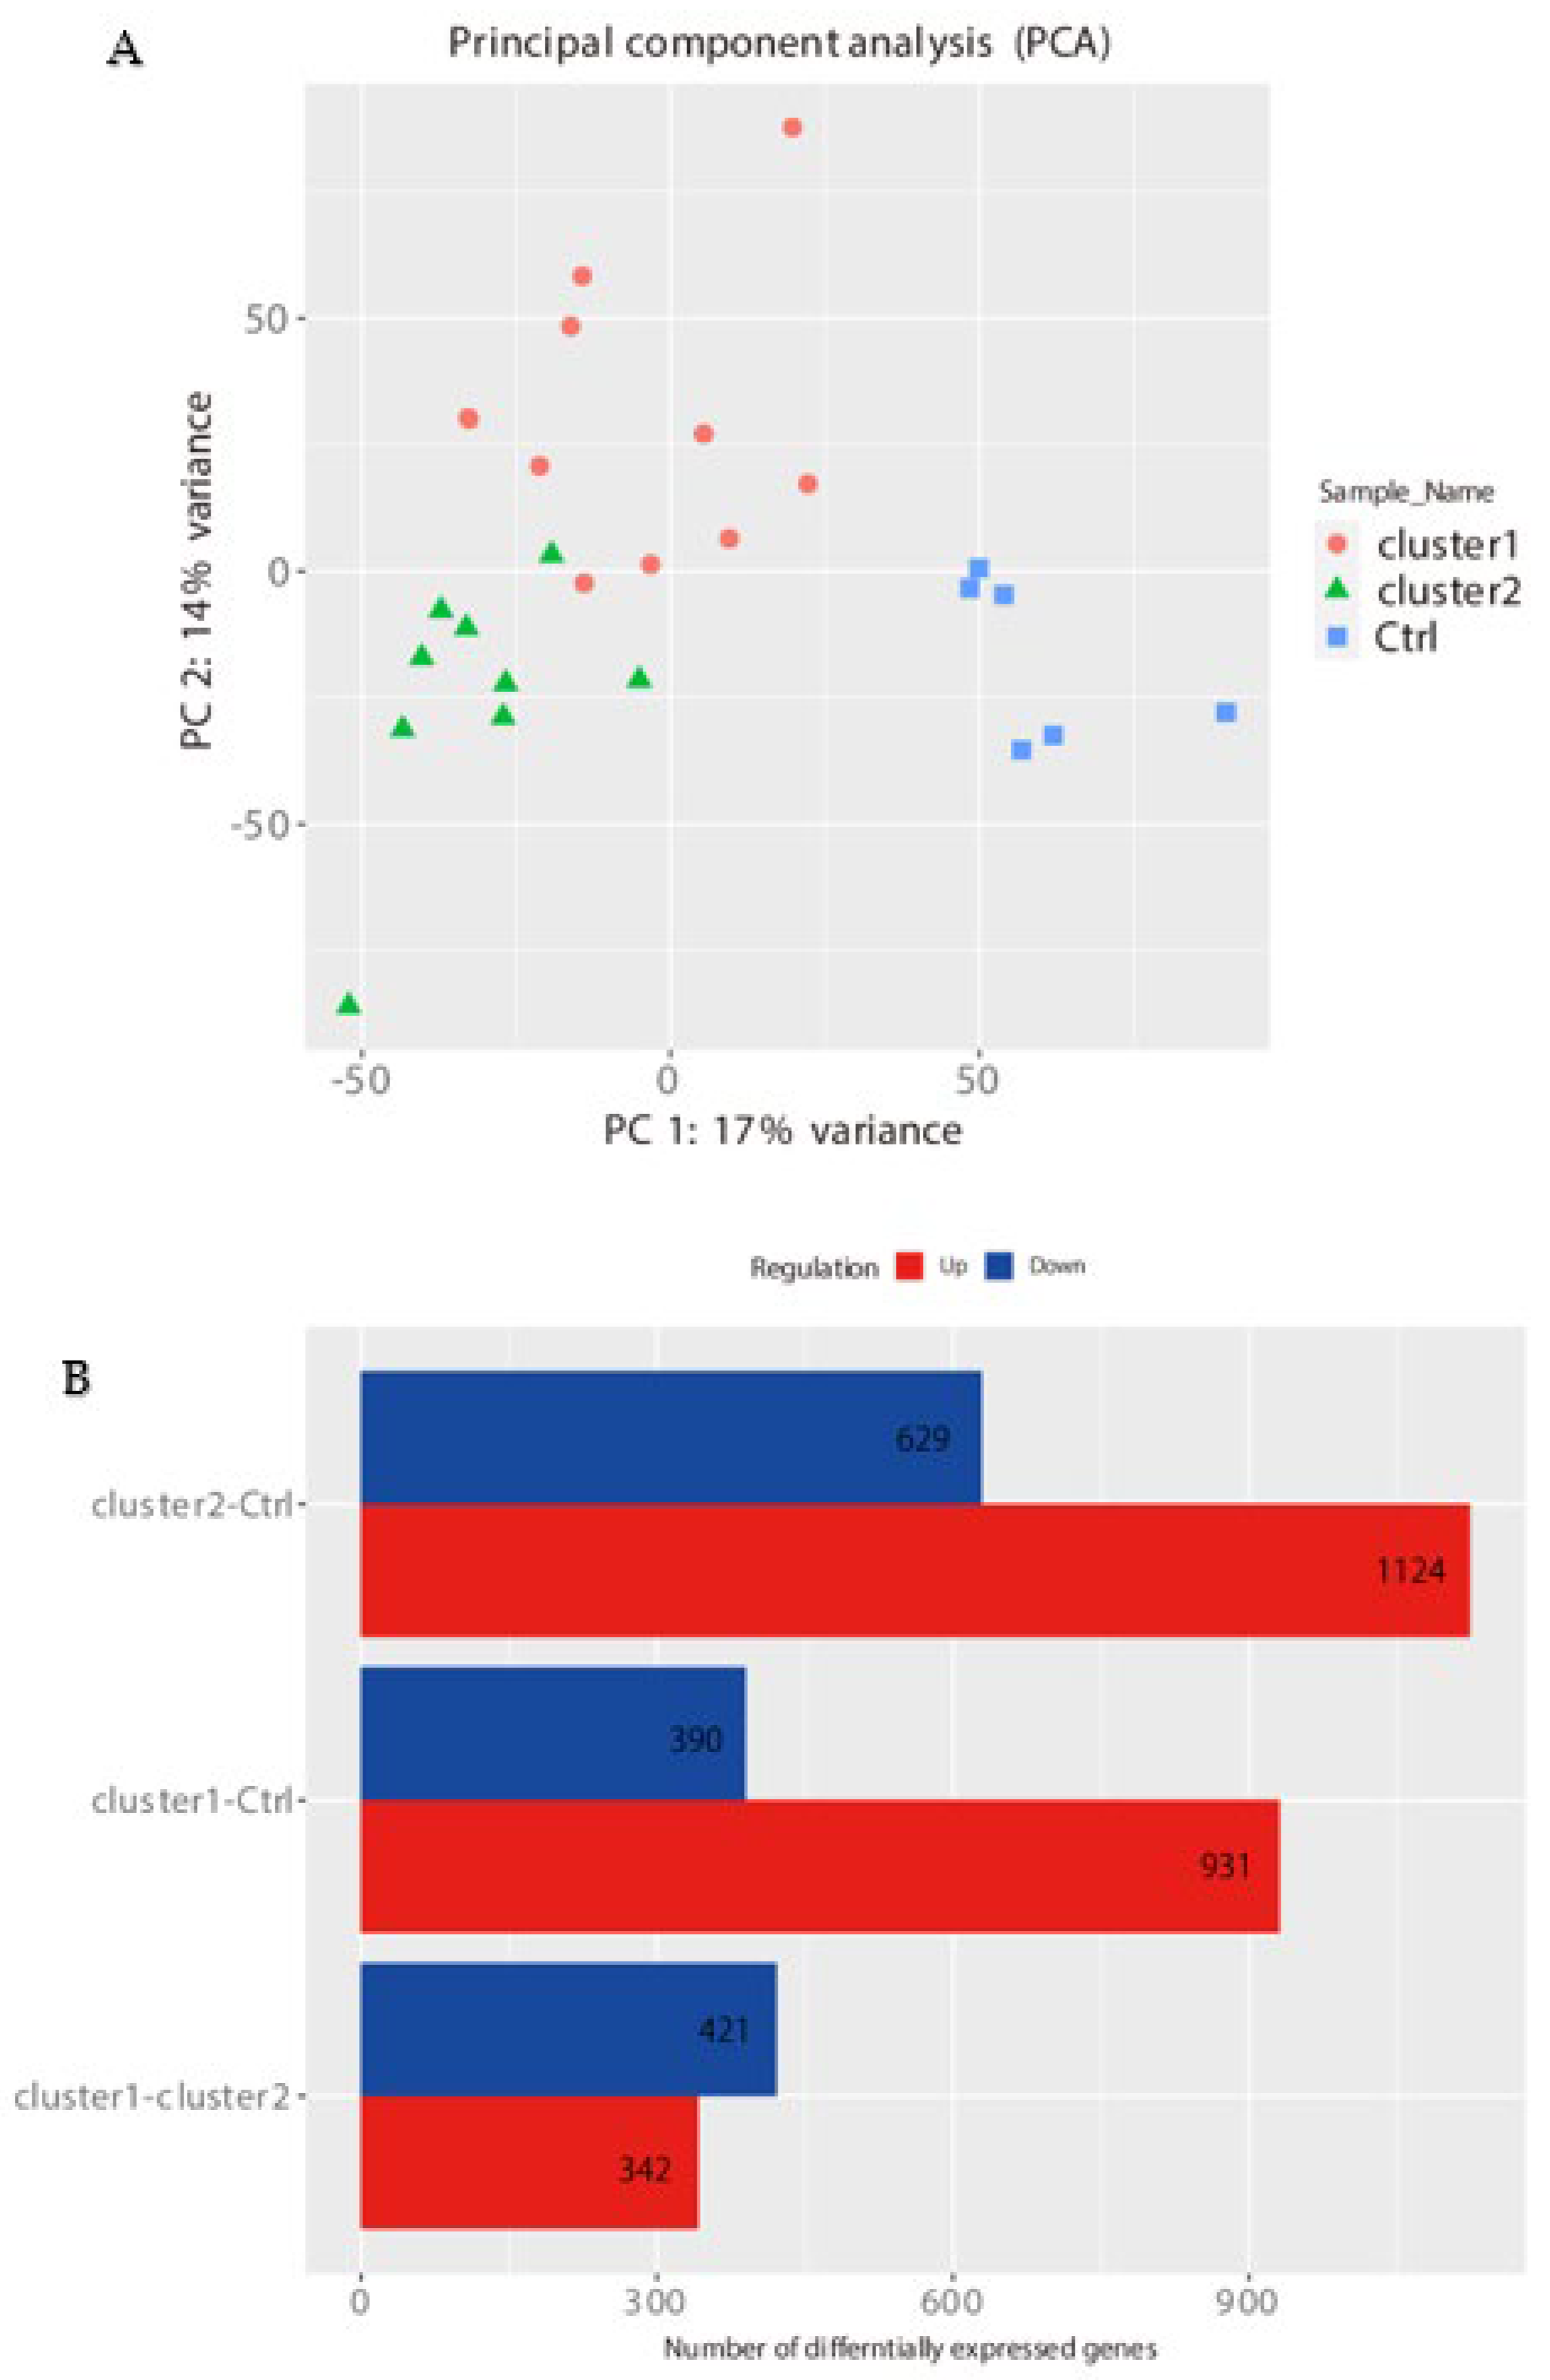
PCA, Heatmap of the Correlation Matrix, and Hierarchical Cluster Analysis
2.2. Segregation All CRSwNPs into Two Types of Clusters by Hierarchic Cluster Analysis
3. Discussion
4. Materials and Methods
4.1. Patient Recruitment
4.2. RNA-Seq Using BRB-Seq
4.3. Data Processing of BRB-Seq
5. Conclusions
Supplementary Materials
Author Contributions
Funding
Institutional Review Board Statement
Informed Consent Statement
Data Availability Statement
Acknowledgments
Conflicts of Interest
References
- Fokkens, W.J.; Lund, V.J.; Hopkins, C.; Hellings, P.W.; Kern, R.; Reitsma, S.; Toppila-Salmi, S.; Bernal-Sprekelsen, M.; Mullol, J.; Alobid, I.; et al. European position paper on rhinosinusitis and nasal polyps 2020. Rhinology 2020, 58, 1–464. [Google Scholar] [CrossRef] [PubMed]
- Orlandi, R.R.; Kingdom, T.T.; Smith, T.L.; Bleier, B.; DeConde, A.; Luong, A.U.; Poetker, D.M.; Soler, Z.; Welch, K.C.; Wise, S.K.; et al. International consensus statement on allergy and rhinology: Rhinosinusitis 2021. Int. Forum Allergy Rhinol. 2021, 11, 213–739. [Google Scholar] [CrossRef] [PubMed]
- Grayson, J.W.; Hopkins, C.; Mori, E.; Senior, B.; Harvey, R.J. Contemporary Classification of Chronic Rhinosinusitis Beyond Polyps vs. No Polyps: A Review. JAMA Otolaryngol. Head Neck Surg. 2020, 146, 831–838. [Google Scholar] [CrossRef] [PubMed]
- Tokunaga, T.; Sakashita, M.; Haruna, T.; Asaka, D.; Takeno, S.; Ikeda, H.; Nakayama, T.; Seki, N.; Ito, S.; Murata, J.; et al. Novel scoring system and algorithm for classifying chronic rhinosinusitis: The JESREC Study. Allergy 2015, 70, 995–1003. [Google Scholar] [CrossRef] [Green Version]
- Matsuwaki, Y.; Ookushi, T.; Asaka, D.; Mori, E.; Nakajima, T.; Yoshida, T.; Kojima, J.; Chiba, S.; Ootori, N.; Moriyama, H. Chronic rhinosinusitis: Risk factors for the recurrence of chronic rhinosinusitis based on 5-year follow-up after endoscopic sinus surgery. Int. Arch. Allergy Immunol. 2008, 146, 77–81. [Google Scholar] [CrossRef]
- Batra, P.S.; Tong, L.; Citardi, M.J. Analysis of comorbidities and objective parameters in refractory chronic rhinosinusitis. Laryngoscope 2013, 123, S1–S11. [Google Scholar] [CrossRef]
- Nakayama, T.; Lee, I.T.; Le, W.; Tsunemi, Y.; Borchard, N.A.; Zarabanda, D.; Dholakia, S.S.; Gall, P.A.; Yang, A.; Kim, D.; et al. Inflammatory molecular endotypes of nasal polyps derived from White and Japanese populations. J. Allergy Clin. Immunol. 2022, 149, 1296–1308. [Google Scholar] [CrossRef]
- Wang, W.; Gao, Z.; Wang, H.; Li, T.; He, W.; Lv, W.; Zhang, J. Transcriptome Analysis Reveals Distinct Gene Expression Profiles in Eosinophilic and Noneosinophilic Chronic Rhinosinusitis with Nasal Polyps. Sci. Rep. 2016, 6, 26604. [Google Scholar] [CrossRef] [PubMed] [Green Version]
- Alpern, D.; Gardeux, V.; Russeil, J.; Mangeat, B.; Meireles-Filho, A.C.A.; Breysse, R.; Hacker, D.; Deplancke, B. BRB-seq: Ultra-affordable high-throughput transcriptomics enabled by bulk RNA barcoding and sequencing. Genome Biol. 2019, 20, 71. [Google Scholar] [CrossRef] [Green Version]
- Yamada, T.; Fujieda, S.; Mori, S.; Yamamoto, H.; Saito, H. Macrolide treatment decreased the size of nasal polyps and IL-8 levels in nasal lavage. Am. J. Rhinol. 2000, 14, 143–148. [Google Scholar] [CrossRef]
- Kim, D.H.; Kim, S.W.; Basurrah, M.A.; Hwang, S.H. Clinical and laboratory features for various criteria of eosinophilic chronic rhinosinusitis: A systematic review and meta-analysis. Clin. Exp. Otorhinolaryngol. 2022. [Google Scholar] [CrossRef] [PubMed]
- Matsumoto-Sasaki, M.; Simizu, K.; Suzuki, M.; Suzuki, M.; Kimura, H.; Nakamaru, Y.; Ito, Y.M.; Honma, A.; Konno, S. Clinical Characteristics of Patients and Factors Associated with Switching Biologics in Asthma. J. Asthma Allergy 2022, 15, 187–195. [Google Scholar] [CrossRef] [PubMed]
- Ahn, S.H.; Lee, E.J.; Ha, J.G.; Hwang, C.S.; Yoon, J.H.; Kim, C.H.; Cho, H.J. Comparison of olfactory and taste functions between eosinophilic and non-eosinophilic chronic rhinosinusitis. Auris Nasus Larynx 2020, 47, 820–827. [Google Scholar] [CrossRef] [PubMed]
- Morokata, T.; Suzuki, K.; Masunaga, Y.; Taguchi, K.; Morihira, K.; Sato, I.; Fujii, M.; Takizawa, S.; Torii, Y.; Yamamoto, N.; et al. A novel, selective, and orally available antagonist for CC chemokine receptor 3. J. Pharmacol. Exp. Ther. 2006, 317, 244–250. [Google Scholar] [CrossRef]
- Peterson, S.; Poposki, J.A.; Nagarkar, D.R.; Chustz, R.T.; Peters, A.T.; Suh, L.A.; Carter, R.; Norton, J.; Harris, K.E.; Grammer, L.C.; et al. Increased expression of CC chemokine ligand 18 in patients with chronic rhinosinusitis with nasal polyps. J. Allergy Clin. Immunol. 2012, 129, 119–127. [Google Scholar] [CrossRef] [Green Version]
- Yuan, Q.; Campanella, G.S.; Colvin, R.A.; Hamilos, D.L.; Jones, K.J.; Mathew, A.; Means, T.K.; Luster, A.D. Membrane-bound eotaxin-3 mediates eosinophil transepithelial migration in IL-4-stimulated epithelial cells. Eur. J. Immunol. 2006, 36, 2700–2714. [Google Scholar] [CrossRef]
- El-Shazly, A.E.; Doloriert, H.C.; Bisig, B.; Lefebvre, P.P.; Delvenne, P.; Jacobs, N. Novel cooperation between CX3CL1 and CCL26 inducing NK cell chemotaxis via CX3CR1: A possible mechanism for NK cell infiltration of the allergic nasal tissue. Clin. Exp. Allergy 2013, 43, 322–331. [Google Scholar] [CrossRef]
- Zhu, Z.; Wang, W.; Zha, Y.; Wang, X.; Wang, L.; Han, J.; Zhang, J.; Lv, W. Transcriptomic and Lipidomic Profiles in Nasal Polyps of Glucocorticoid Responders and Non-Responders: Before and After Treatment. Front. Pharmacol. 2022, 12, 814953. [Google Scholar] [CrossRef]
- Baba, S.; Kondo, K.; Kanaya, K.; Suzukawa, K.; Ushio, M.; Urata, S.; Asakage, T.; Kakigi, A.; Suzukawa, M.; Ohta, K.; et al. Expression of IL-33 and its receptor ST2 in chronic rhinosinusitis with nasal polyps. Laryngoscope 2014, 124, E115–E122. [Google Scholar] [CrossRef]
- Robertson, N.M.; Zangrilli, J.G.; Steplewski, A.; Hastie, A.; Lindemeyer, R.G.; Planeta, M.A.; Smith, M.K.; Innocent, N.; Musani, A.; Pascual, R.; et al. Differential expression of TRAIL and TRAIL receptors in allergic asthmatics following segmental antigen challenge: Evidence for a role of TRAIL in eosinophil survival. J. Immunol. 2002, 169, 5986–5996. [Google Scholar] [CrossRef] [Green Version]
- Zheng, T.; Zhu, Z.; Wang, J.; Homer, R.J.; Elias, J.A. IL-11: Insights in asthma from overexpression transgenic modeling. J. Allergy Clin. Immunol. 2001, 108, 489–496. [Google Scholar] [CrossRef] [PubMed]
- Shah, S.A.; Ishinaga, H.; Hou, B.; Okano, M.; Takeuchi, K. Effects of interleukin-31 on MUC5AC gene expression in nasal allergic inflammation. Phamacology 2013, 91, 158–164. [Google Scholar] [CrossRef]
- Jarjour, N.N.; Bradstreet, T.R.; Schwarzkopf, E.A.; Cook, M.E.; Lai, C.W.; Huang, S.C.; Taneja, R.; Stappenbeck, T.S.; Dyken, S.J.; Urban, J.F., Jr.; et al. BHLHE40 Promotes TH2 Cell-Mediated Antihelminth Immunity and Reveals Cooperative CSF2RB Family Cytokines. J. Immunol. 2020, 204, 923–932. [Google Scholar] [CrossRef] [PubMed]
- Sunadome, H.; Matsumoto, H.; Petrova, G.; Kanemitsu, Y.; Tohda, Y.; Horiguchi, T.; Kita, H.; Kuwabara, K.; Tomii, K.; Otsuka, K.; et al. IL4Rα and ADAM33 as genetic markers in asthma exacerbations and type-2 inflammatory endotype. Clin. Exp. Allergy 2017, 47, 998–1006. [Google Scholar] [CrossRef] [PubMed]
- Fujieda, S.; Matsune, S.; Takeno, S.; Ohta, N.; Asako, M.; Bachert, C.; Inoue, T.; Takahashi, Y.; Fujita, H.; Deniz, Y.; et al. Dupilumab efficacy in chronic rhinosinusitis with nasal polyps from SINUS-52 is unaffected by eosinophilic status. Allergy 2022, 77, 186–196. [Google Scholar] [CrossRef] [PubMed]
- Workman, A.D.; Nocera, A.L.; Mueller, S.K.; Otu, H.H.; Libermann, T.A.; Bleier, B.S. Translating transcription: Proteomics in chronic rhinosinusitis with nasal polyps reveals significant discordance with messenger RNA expression. Int. Forum Allergy Rhinol. 2019, 9, 776–786. [Google Scholar] [CrossRef]
- Picelli, S. Full-Length Single-Cell RNA Sequencing with Smart-seq2. Methods Mol. Biol. 2019, 1979, 25–44. [Google Scholar] [CrossRef]
- Sato, S.; Arimura, Y.; Kujirai, T.; Harada, A.; Maehara, K.; Nogami, J.; Ohkawa, Y.; Kurumizaka, H. Biochemical analysis of nucleosome targeting by Tn5 transposase. Open Biol. 2019, 9, 190116. [Google Scholar] [CrossRef] [Green Version]


| Comparison | Term | Count | % | p-Value | Benjamini |
|---|---|---|---|---|---|
| ECRS- Ctrl UP | hsa05200:Pathways in cancer | 35 | 5.2 | 6.7 × 10⁻⁴ | 2.6 × 10⁻² |
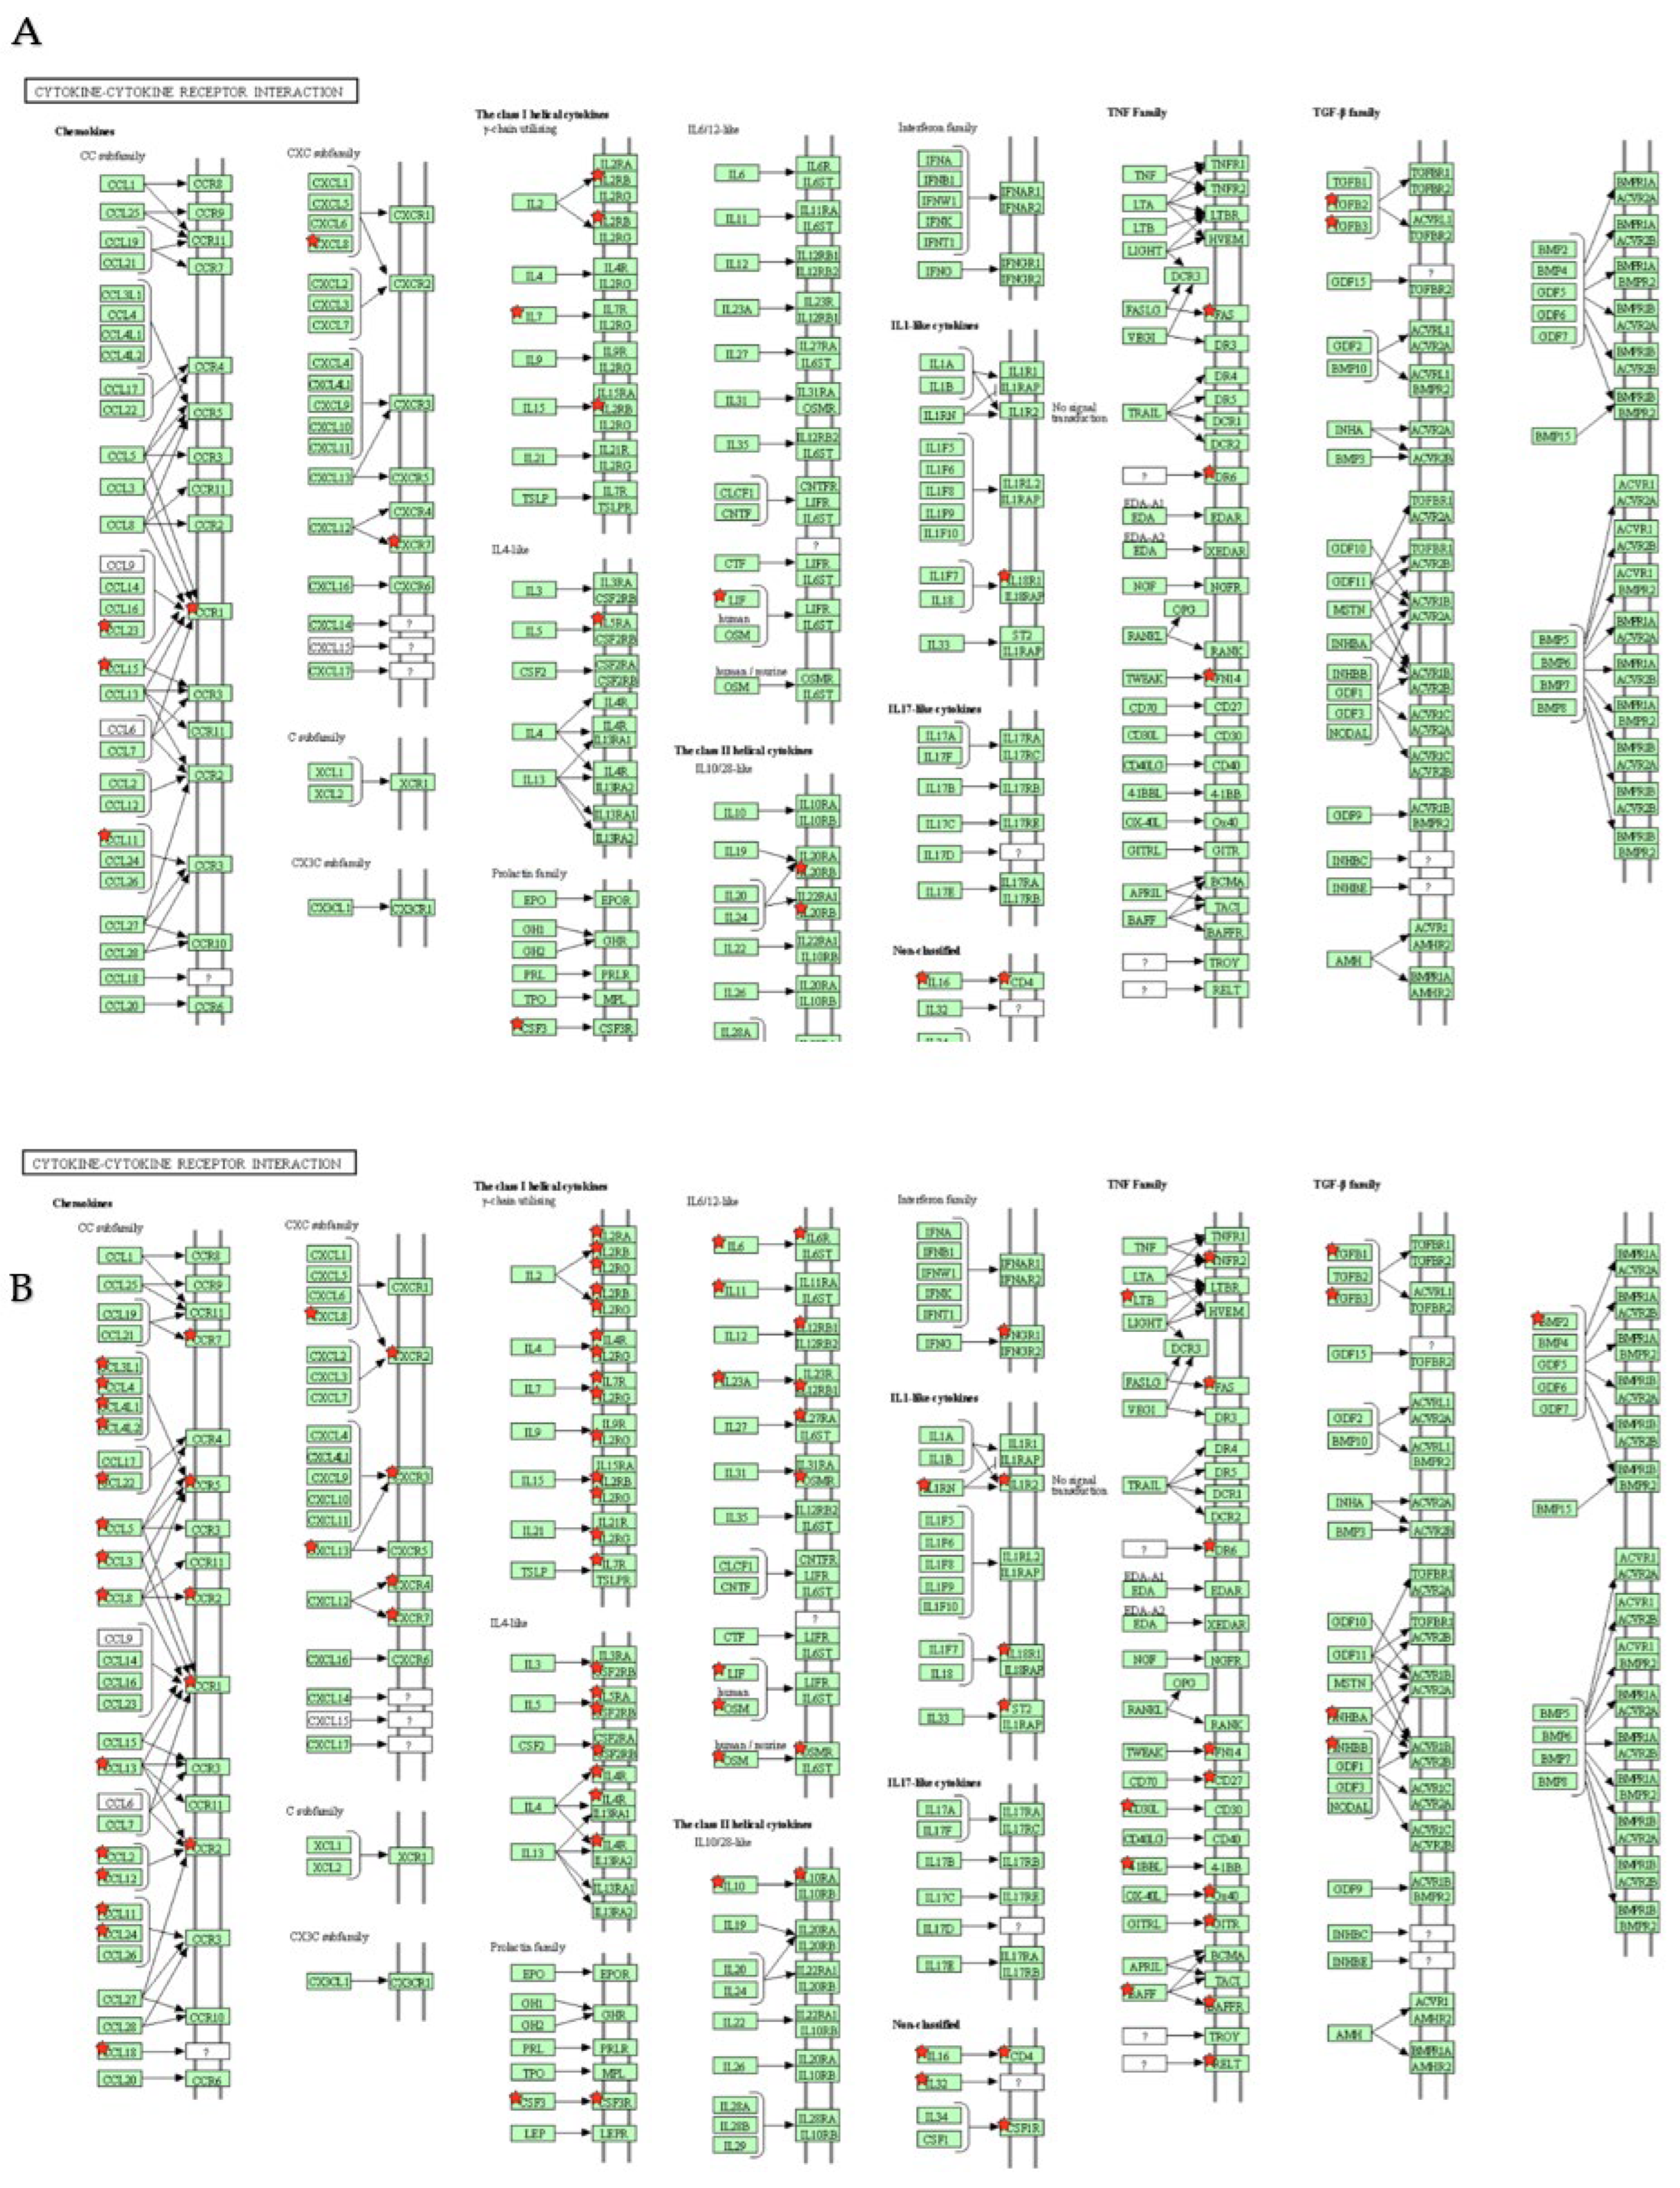
| hsa04060:Cytokine–cytokine receptor interaction | 25 | 3.7 | 1.4 × 10⁻⁴ | 1.0 × 10⁻² | |
| hsa04080:Neuroactive ligand–receptor interaction | 22 | 3.2 | 1.5 × 10⁻² | 2.5 × 10⁻¹ | |
| hsa04151:PI3K-Akt signaling pathway | 19 | 2.8 | 8.5 × 10⁻² | 7.3 × 10⁻¹ | |
| hsa05166:Human T-cell leukemia virus 1 infection | 18 | 2.7 | 2.6 × 10⁻³ | 7.0 × 10⁻² | |
| hsa04020:Calcium signaling pathway | 18 | 2.7 | 5.6 × 10⁻³ | 1.0 × 10⁻¹ | |
| hsa04640:Hematopoietic cell lineage | 17 | 2.5 | 3.8 × 10⁻⁷ | 1.0 × 10⁻⁴ | |
| hsa04145:Phagosome | 16 | 2.4 | 3.5 × 10⁻⁴ | 1.9 × 10⁻² | |
| hsa04062:Chemokine signaling pathway | 16 | 2.4 | 3.7 × 10⁻³ | 7.8 × 10⁻² | |
| hsa04610:Complement and coagulation cascades | 15 | 2.2 | 1.6 × 10⁻⁶ | 2.2 × 10⁻⁴ | |
| hsa04380:Osteoclast differentiation | 14 | 2.1 | 6.5 × 10⁻⁴ | 2.6 × 10⁻² | |
| hsa05202:Transcriptional misregulation in cancer | 14 | 2.1 | 2.1 × 10⁻² | 2.8 × 10⁻¹ | |
| hsa05150:Staphylococcus aureus infection | 13 | 1.9 | 1.5 × 10⁻⁴ | 1.0 × 10⁻² | |
| hsa05152:Tuberculosis | 13 | 1.9 | 2.8 × 10⁻² | 3.4 × 10⁻¹ | |
| hsa04061:Viral protein interaction with cytokine and cytokine receptor | 12 | 1.8 | 8.7 × 10⁻⁴ | 3.0 × 10⁻² | |
| hsa05142:Chagas disease | 11 | 1.6 | 3.5 × 10⁻³ | 7.8 × 10⁻² | |
| hsa05146:Amoebiasis | 11 | 1.6 | 3.5 × 10⁻³ | 7.8 × 10⁻² | |
| hsa04514:Cell adhesion molecules | 11 | 1.6 | 4.2 × 10⁻² | 4.2 × 10⁻¹ | |
| hsa05140:Leishmaniasis | 10 | 1.5 | 1.6 × 10⁻³ | 5.0 × 10⁻² | |
| hsa04659:Th17 cell differentiation | 10 | 1.5 | 1.5 × 10⁻² | 2.5 × 10⁻¹ | |
| hsa04658:Th1 and Th2 cell differentiation | 9 | 1.3 | 1.7 × 10⁻² | 2.6 × 10⁻¹ | |
| hsa04611:Platelet activation | 9 | 1.3 | 7.7 × 10⁻² | 6.8 × 10⁻¹ | |
| hsa04512:ECM-receptor interaction | 8 | 1.2 | 3.8 × 10⁻² | 4.0 × 10⁻¹ | |
| hsa04750:Inflammatory mediator regulation of TRP channels | 8 | 1.2 | 6.2 × 10⁻² | 5.6 × 10⁻¹ | |
| hsa04066:HIF-1 signaling pathway | 8 | 1.2 | 9.6 × 10⁻² | 8.0 × 10⁻¹ | |
| hsa04978:Mineral absorption | 7 | 1.0 | 2.0 × 10⁻² | 2.8 × 10⁻¹ | |
| hsa00590:Arachidonic acid metabolism | 7 | 1.0 | 2.2 × 10⁻² | 2.8 × 10⁻¹ | |
| hsa05321:Inflammatory bowel disease | 7 | 1.0 | 2.8 × 10⁻² | 3.4 × 10⁻¹ | |
| hsa04664:Fc epsilon RI signaling pathway | 7 | 1.0 | 3.5 × 10⁻² | 3.8 × 10⁻¹ | |
| hsa05133:Pertussis | 7 | 1.0 | 5.5 × 10⁻² | 5.3 × 10⁻¹ | |
| hsa05310:Asthma | 6 | 0.9 | 4.5 × 10⁻³ | 8.8 × 10⁻² | |
| hsa05219:Bladder cancer | 5 | 0.7 | 5.8 × 10⁻² | 5.5 × 10⁻¹ | |
| hsa00532:Glycosaminoglycan biosynthesis—chondroitin sulfate/dermatan sulfate | 4 | 0.6 | 3.3 × 10⁻² | 3.8 × 10⁻¹ | |
| nonECRS-Ctrl UP | hsa04060:Cytokine–cytokine receptor interaction | 33 | 4.7 | 1.5 × 10⁻⁸ | 2.0 × 10⁻⁶ |
| hsa05200:Pathways in cancer | 33 | 4.7 | 2.4 × 10⁻³ | 2.7 × 10⁻² | |
| hsa04080:Neuroactive ligand–receptor interaction | 23 | 3.3 | 7.8 × 10⁻³ | 7.6 × 10⁻² | |
| hsa04062:Chemokine signaling pathway | 22 | 3.1 | 4.5 × 10⁻⁶ | 1.7 × 10⁻⁴ | |
| hsa05166:Human T-cell leukemia virus 1 infection | 21 | 3.0 | 1.3 × 10⁻⁴ | 2.2 × 10⁻³ | |
| hsa04061:Viral protein interaction with cytokine and cytokine receptor | 19 | 2.7 | 1.2 × 10⁻⁸ | 2.0 × 10⁻⁶ | |
| hsa05150:Staphylococcus aureus infection | 18 | 2.6 | 3.9 × 10⁻⁸ | 3.4 × 10⁻⁶ | |
| hsa05152:Tuberculosis | 18 | 2.6 | 2.3 × 10⁻⁴ | 3.6 × 10⁻³ | |
| hsa04640:Hematopoietic cell lineage | 17 | 2.4 | 3.7 × 10⁻⁷ | 2.4 × 10⁻⁵ | |
| hsa05417:Lipid and atherosclerosis | 17 | 2.4 | 4.3 × 10⁻³ | 4.5 × 10⁻² | |
| hsa05323:Rheumatoid arthritis | 16 | 2.3 | 8.8 × 10⁻⁷ | 4.6 × 10⁻⁵ | |
| hsa04145:Phagosome | 16 | 2.3 | 3.4 × 10⁻⁴ | 4.7 × 10⁻³ | |
| hsa05171:Coronavirus disease—COVID-19 | 16 | 2.3 | 1.9 × 10⁻² | 1.3 × 10⁻¹ | |
| hsa04659:Th17 cell differentiation | 15 | 2.1 | 2.8 × 10⁻⁵ | 7.3 × 10⁻⁴ | |
| hsa04380:Osteoclast differentiation | 15 | 2.1 | 1.8 × 10⁻⁴ | 3.0 × 10⁻³ | |
| hsa05167:Kaposi sarcoma-associated herpesvirus infection | 15 | 2.1 | 9.6 × 10⁻³ | 8.5 × 10⁻² | |
| hsa05169:Epstein–Barr virus infection | 15 | 2.1 | 1.3 × 10⁻² | 1.1 × 10⁻¹ | |
| hsa05163:Human cytomegalovirus infection | 15 | 2.1 | 3.1 × 10⁻² | 1.9 × 10⁻¹ | |
| hsa05321:Inflammatory bowel disease | 13 | 1.9 | 2.6 × 10⁻⁶ | 1.1 × 10⁻⁴ | |
| hsa05140:Leishmaniasis | 13 | 1.9 | 1.6 × 10⁻⁵ | 4.7 × 10⁻⁴ | |
| hsa04658:Th1 and Th2 cell differentiation | 13 | 1.9 | 9.7 × 10⁻⁵ | 2.0 × 10⁻³ | |
| hsa04630:JAK-STAT signaling pathway | 13 | 1.9 | 1.3 × 10⁻² | 1.1 × 10⁻¹ | |
| hsa05164:Influenza A | 13 | 1.9 | 1.9 × 10⁻² | 1.3 × 10⁻¹ | |
| hsa05142:Chagas disease | 12 | 1.7 | 9.9 × 10⁻⁴ | 1.2 × 10⁻² | |
| hsa04668:TNF signaling pathway | 12 | 1.7 | 2.1 × 10⁻³ | 2.5 × 10⁻² | |
| hsa05322:Systemic lupus erythematosus | 12 | 1.7 | 9.3 × 10⁻³ | 8.5 × 10⁻² | |
| hsa04936:Alcoholic liver disease | 12 | 1.7 | 1.3 × 10⁻² | 1.1 × 10⁻¹ | |
| hsa04514:Cell adhesion molecules | 12 | 1.7 | 1.8 × 10⁻² | 1.3 × 10⁻¹ | |
| hsa05202:Transcriptional misregulation in cancer | 12 | 1.7 | 8.3 × 10⁻² | 4.7 × 10⁻¹ | |
| hsa04610:Complement and coagulation cascades | 11 | 1.6 | 8.5 × 10⁻⁴ | 1.1 × 10⁻² | |
| hsa04650:Natural killer cell mediated cytotoxicity | 11 | 1.6 | 1.5 × 10⁻² | 1.1 × 10⁻¹ | |
| hsa05161:Hepatitis B | 11 | 1.6 | 6.5 × 10⁻² | 3.9 × 10⁻¹ | |
| hsa04657:IL-17 signaling pathway | 10 | 1.4 | 6.3 × 10⁻³ | 6.4 × 10⁻² | |
| hsa05145:Toxoplasmosis | 10 | 1.4 | 1.9 × 10⁻² | 1.3 × 10⁻¹ | |
| hsa05310:Asthma | 9 | 1.3 | 9.3 × 10⁻⁶ | 3.1 × 10⁻⁴ | |
| hsa05330:Allograft rejection | 9 | 1.3 | 4.6 × 10⁻⁵ | 1.1 × 10⁻³ | |
| hsa05332:Graft-versus-host disease | 9 | 1.3 | 9.9 × 10⁻⁵ | 2.0 × 10⁻³ | |
| hsa04940:Type I diabetes mellitus | 9 | 1.3 | 1.2 × 10⁻⁴ | 2.2 × 10⁻³ | |
| hsa04672:Intestinal immune network for IgA production | 9 | 1.3 | 3.0 × 10⁻⁴ | 4.5 × 10⁻³ | |
| hsa05320:Autoimmune thyroid disease | 9 | 1.3 | 5.3 × 10⁻⁴ | 7.0 × 10⁻³ | |
| hsa04662:B cell receptor signaling pathway | 9 | 1.3 | 8.7 × 10⁻³ | 8.2 × 10⁻² | |
| hsa04612:Antigen processing and presentation | 8 | 1.1 | 2.1 × 10⁻² | 1.4 × 10⁻¹ | |
| hsa05146:Amoebiasis | 8 | 1.1 | 7.2 × 10⁻² | 4.2 × 10⁻¹ | |
| hsa04625:C-type lectin receptor signaling pathway | 8 | 1.1 | 7.8 × 10⁻² | 4.5 × 10⁻¹ | |
| hsa05416:Viral myocarditis | 7 | 1.0 | 2.0 × 10⁻² | 1.3 × 10⁻¹ | |
| hsa05133:Pertussis | 7 | 1.0 | 5.4 × 10⁻² | 3.3 × 10⁻¹ | |
| hsa05219:Bladder cancer | 6 | 0.9 | 1.5 × 10⁻² | 1.1 × 10⁻¹ | |
| hsa04664:Fc epsilon RI signaling pathway | 6 | 0.9 | 9.5 × 10⁻² | 5.2 × 10⁻¹ | |
| Asp-Ctrl UP | hsa05200:Pathways in cancer | 24 | 6.3 | 6.4 × 10⁻³ | 1.3 × 10⁻¹ |
| hsa04151:PI3K-Akt signaling pathway | 20 | 5.2 | 1.3 × 10⁻³ | 4.5 × 10⁻² | |
| hsa04060:Cytokine–cytokine receptor interaction | 19 | 5.0 | 3.9 × 10⁻⁴ | 1.9 × 10⁻² | |
| hsa04062:Chemokine signaling pathway | 16 | 4.2 | 8.4 × 10⁻⁵ | 1.0 × 10⁻² | |
| hsa05202:Transcriptional misregulation in cancer | 15 | 3.9 | 3.0 × 10⁻⁴ | 1.8 × 10⁻² | |
| hsa04630:JAK-STAT signaling pathway | 14 | 3.7 | 1.9 × 10⁻⁴ | 1.6 × 10⁻² | |
| hsa05206:MicroRNAs in cancer | 14 | 3.7 | 4.6 × 10⁻² | 4.1 × 10⁻¹ | |
| hsa05205:Proteoglycans in cancer | 13 | 3.4 | 5.1 × 10⁻³ | 1.3 × 10⁻¹ | |
| hsa04610:Complement and coagulation cascades | 12 | 3.1 | 7.4 × 10⁻⁶ | 1.8 × 10⁻³ | |
| hsa05166:Human T-cell leukemia virus 1 infection | 12 | 3.1 | 2.3 × 10⁻² | 3.0 × 10⁻¹ | |
| hsa04020:Calcium signaling pathway | 12 | 3.1 | 3.7 × 10⁻² | 3.5 × 10⁻¹ | |
| hsa05167:Kaposi sarcoma-associated herpesvirus infection | 11 | 2.9 | 2.3 × 10⁻² | 3.0 × 10⁻¹ | |
| hsa05132:Salmonella infection | 11 | 2.9 | 9.3 × 10⁻² | 6.2 × 10⁻¹ | |
| hsa04144:Endocytosis | 11 | 2.9 | 9.4 × 10⁻² | 6.2 × 10⁻¹ | |
| hsa04380:Osteoclast differentiation | 10 | 2.6 | 4.6 × 10⁻³ | 1.2 × 10⁻¹ | |
| hsa04015:Rap1 signaling pathway | 10 | 2.6 | 7.9 × 10⁻² | 6.0 × 10⁻¹ | |
| hsa04625:C-type lectin receptor signaling pathway | 9 | 2.3 | 4.3 × 10⁻³ | 1.2 × 10⁻¹ | |
| hsa04066:HIF−1 signaling pathway | 9 | 2.3 | 5.7 × 10⁻³ | 1.3 × 10⁻¹ | |
| hsa04061:Viral protein interaction with cytokine and cytokine receptor | 8 | 2.1 | 1.2 × 10⁻² | 2.3 × 10⁻¹ | |
| hsa05142:Chagas disease | 8 | 2.1 | 1.3 × 10⁻² | 2.4 × 10⁻¹ | |
| hsa04064:NF-kappa B signaling pathway | 8 | 2.1 | 1.5 × 10⁻² | 2.4 × 10⁻¹ | |
| hsa04668:TNF signaling pathway | 8 | 2.1 | 2.2 × 10⁻² | 3.0 × 10⁻¹ | |
| hsa04650:Natural killer cell mediated cytotoxicity | 8 | 2.1 | 3.8 × 10⁻² | 3.5 × 10⁻¹ | |
| hsa05135:Yersinia infection | 8 | 2.1 | 5.5 × 10⁻² | 4.8 × 10⁻¹ | |
| hsa04072:Phospholipase D signaling pathway | 8 | 2.1 | 7.6 × 10⁻² | 6.0 × 10⁻¹ | |
| hsa04218:Cellular senescence | 8 | 2.1 | 9.4 × 10⁻² | 6.2 × 10⁻¹ | |
| hsa05219:Bladder cancer | 7 | 1.8 | 4.8 × 10⁻⁴ | 2.0 × 10⁻² | |
| hsa04657:IL-17 signaling pathway | 7 | 1.8 | 2.9 × 10⁻² | 3.5 × 10⁻¹ | |
| hsa05150:Staphylococcus aureus infection | 7 | 1.8 | 3.2 × 10⁻² | 3.5 × 10⁻¹ | |
| hsa04666:Fc gamma R-mediated phagocytosis | 7 | 1.8 | 3.4 × 10⁻² | 3.5 × 10⁻¹ | |
| hsa04640:Hematopoietic cell lineage | 7 | 1.8 | 3.7 × 10⁻² | 3.5 × 10⁻¹ | |
| hsa04115:p53 signaling pathway | 6 | 1.6 | 3.5 × 10⁻² | 3.5 × 10⁻¹ | |
| hsa04012:ErbB signaling pathway | 6 | 1.6 | 6.0 × 10⁻² | 5.1 × 10⁻¹ | |
| hsa05210:Colorectal cancer | 6 | 1.6 | 6.3 × 10⁻² | 5.1 × 10⁻¹ | |
| hsa04216:Ferroptosis | 5 | 1.3 | 1.8 × 10⁻² | 2.8 × 10⁻¹ | |
| hsa05211:Renal cell carcinoma | 5 | 1.3 | 9.3 × 10⁻² | 6.2 × 10⁻¹ | |
| hsa05230:Central carbon metabolism in cancer | 5 | 1.3 | 9.6 × 10⁻² | 6.2 × 10⁻¹ | |
| hsa05120:Epithelial cell signaling in Helicobacter pylori infection | 5 | 1.3 | 9.6 × 10⁻² | 6.2 × 10⁻¹ |
| Genes | ECRS-Ctrl | NonECRS-Ctrl | Asp-Ctrl | |
|---|---|---|---|---|
| Upregulated DEGs | CCL2 | 〇 | ||
| CCL8 | 〇 | |||
| CCL11 | 〇 | 〇 | ||
| CCL13 | 〇 | 〇 | ||
| CCL15 | 〇 | 〇 | ||
| CCL18 | 〇 | |||
| CCL20 | 〇 | |||
| CCL26 | 〇 | 〇 | ||
| CCR1 | 〇 | 〇 | 〇 | |
| CCR5 | 〇 | |||
| CXCL1 | 〇 | |||
| CXCL6 | 〇 | |||
| CXCL8 | 〇 | 〇 | 〇 | |
| CXCR2 | 〇 | |||
| CD4 | 〇 | 〇 | ||
| FAS | 〇 | |||
| LIF | 〇 | 〇 | 〇 | |
| TNFRSF1B | 〇 | |||
| TNFRSF10D | 〇 | |||
| TNFRSF12A | 〇 | 〇 | 〇 | |
| TNFRSF18 | 〇 | 〇 | ||
| TNFRSF21 | 〇 | 〇 | 〇 | |
| TNFSF13B | 〇 | |||
| ACKR3 | 〇 | 〇 | ||
| CSF1R | 〇 | 〇 | ||
| CSF2RB | 〇 | 〇 | ||
| CSF3 | 〇 | 〇 | ||
| INHBB | 〇 | |||
| IL1RL1 | 〇 | 〇 | ||
| IL2RA | 〇 | 〇 | ||
| IL2RB | 〇 | 〇 | ||
| IL2RG | 〇 | |||
| IL4R | 〇 | 〇 | ||
| IL5RA | 〇 | 〇 | 〇 | |
| IL6 | 〇 | |||
| IL6R | 〇 | |||
| IL11 | 〇 | |||
| IL16 | 〇 | 〇 | ||
| IL18R1 | 〇 | 〇 | 〇 | |
| IL20RB | 〇 | |||
| IL23A | 〇 | 〇 | ||
| IL31RA | 〇 | |||
| OSMR | 〇 | 〇 | 〇 | |
| TGFB3 | 〇 | 〇 |
| Comparison | Term | Count | % | p-Value | Benjamini |
|---|---|---|---|---|---|
| ECRS-Ctrl down | hsa01100:Metabolic pathways | 55 | 11.5 | 5.6 × 10⁻³ | 2.4 × 10⁻¹ |
| hsa04970:Salivary secretion | 15 | 3.1 | 7.6 × 10⁻⁸ | 1.9 × 10⁻⁵ | |
| hsa04024:cAMP signaling pathway | 12 | 2.5 | 2.5 × 10⁻² | 8.1 × 10⁻¹ | |
| hsa04972:Pancreatic secretion | 11 | 2.3 | 2.5 × 10⁻⁴ | 3.2 × 10⁻² | |
| hsa04550:Signaling pathways regulating pluripotency of stem cells | 11 | 2.3 | 3.4 × 10⁻³ | 1.8 × 10⁻¹ | |
| hsa04020:Calcium signaling pathway | 11 | 2.3 | 8.5 × 10⁻² | 1.0 | |
| hsa05215:Prostate cancer | 9 | 1.9 | 3.2 × 10⁻³ | 1.8 × 10⁻¹ | |
| hsa00260:Glycine, serine and threonine metabolism | 6 | 1.3 | 3.2 × 10⁻³ | 1.8 × 10⁻¹ | |
| hsa05412:Arrhythmogenic right ventricular cardiomyopathy | 6 | 1.3 | 4.6 × 10⁻² | 1.0 | |
| hsa04911:Insulin secretion | 6 | 1.3 | 6.7 × 10⁻² | 1.0 | |
| hsa04350:TGF-beta signaling pathway | 6 | 1.3 | 9.0 × 10⁻² | 1.0 | |
| hsa00512:Mucin type O-glycan biosynthesis | 5 | 1.0 | 1.3 × 10⁻² | 4.6 × 10⁻¹ | |
| hsa00514:Other types of O-glycan biosynthesis | 5 | 1.0 | 3.1 × 10⁻² | 8.8 × 10⁻¹ | |
| hsa05031:Amphetamine addiction | 5 | 1.0 | 9.8 × 10⁻² | 1.0 | |
| hsa00100:Steroid biosynthesis | 3 | 0.6 | 9.0 × 10⁻² | 1.0 | |
| nonECRS-Ctrl down | hsa01100:Metabolic pathways | 36 | 11.6 | 7.1 × 10⁻³ | 3.9 × 10⁻¹ |
| hsa04970:Salivary secretion | 13 | 4.2 | 1.4 × 10⁻⁸ | 3.1 × 10⁻⁶ | |
| hsa04972:Pancreatic secretion | 10 | 3.2 | 2.4 × 10⁻⁵ | 2.6 × 10⁻³ | |
| hsa04024:cAMP signaling pathway | 10 | 3.2 | 6.6 × 10⁻³ | 3.9 × 10⁻¹ | |
| hsa04911:Insulin secretion | 6 | 1.9 | 1.0 × 10⁻² | 4.4 × 10⁻¹ | |
| hsa05231:Choline metabolism in cancer | 5 | 1.6 | 6.3 × 10⁻² | 1.0 | |
| hsa00512:Mucin type O-glycan biosynthesis | 4 | 1.3 | 1.7 × 10⁻² | 5.9 × 10⁻¹ | |
| hsa05143:African trypanosomiasis | 4 | 1.3 | 1.9 × 10⁻² | 5.9 × 10⁻¹ | |
| hsa00260:Glycine, serine and threonine metabolism | 4 | 1.3 | 2.3 × 10⁻² | 6.3 × 10⁻¹ | |
| hsa00280:Valine, leucine and isoleucine degradation | 4 | 1.3 | 3.7 × 10⁻² | 9.0 × 10⁻¹ | |
| hsa05031:Amphetamine addiction | 4 | 1.3 | 8.8 × 10⁻² | 1.0 | |
| Asp-Ctrl down | hsa01100:Metabolic pathways | 65 | 14.0 | 2.4 × 10⁻⁶ | 5.9 × 10⁻⁴ |
| hsa04970:Salivary secretion | 12 | 2.6 | 1.3 × 10⁻⁵ | 1.7 × 10⁻³ | |
| hsa01200:Carbon metabolism | 8 | 1.7 | 2.1 × 10⁻² | 7.5 × 10⁻¹ | |
| hsa00280:Valine, leucine and isoleucine degradation | 7 | 1.5 | 9.7 × 10⁻⁴ | 8.0 × 10⁻² | |
| hsa04972:Pancreatic secretion | 7 | 1.5 | 3.7 × 10⁻² | 9.1 × 10⁻¹ | |
| hsa00514:Other types of O-glycan biosynthesis | 6 | 1.3 | 5.3 × 10⁻³ | 3.1 × 10⁻¹ | |
| hsa00520:Amino sugar and nucleotide sugar metabolism | 6 | 1.3 | 6.3 × 10⁻³ | 3.1 × 10⁻¹ | |
| hsa04976:Bile secretion | 6 | 1.3 | 6.4 × 10⁻² | 1.0 | |
| hsa00564:Glycerophospholipid metabolism | 6 | 1.3 | 8.8 × 10⁻² | 1.0 | |
| hsa01250:Biosynthesis of nucleotide sugars | 5 | 1.1 | 1.2 × 10⁻² | 4.8 × 10⁻¹ | |
| hsa00620:Pyruvate metabolism | 5 | 1.1 | 2.6 × 10⁻² | 8.0 × 10⁻¹ | |
| hsa00650:Butanoate metabolism | 4 | 0.9 | 2.9 × 10⁻² | 8.0 × 10⁻¹ | |
| hsa00640:Propanoate metabolism | 4 | 0.9 | 4.1 × 10⁻² | 9.3 × 10⁻¹ | |
| hsa00512:Mucin type O-glycan biosynthesis | 4 | 0.9 | 5.5 × 10⁻² | 1.0 | |
| hsa00260:Glycine, serine and threonine metabolism | 4 | 0.9 | 7.2 × 10⁻² | 1.0 | |
| hsa02010:ABC transporters | 4 | 0.9 | 9.4 × 10⁻² | 1.0 | |
| hsa00100:Steroid biosynthesis | 3 | 0.6 | 8.3 × 10⁻² | 1.0 | |
| hsa00900:Terpenoid backbone biosynthesis | 3 | 0.6 | 9.8 × 10⁻² | 1.0 |
Publisher’s Note: MDPI stays neutral with regard to jurisdictional claims in published maps and institutional affiliations. |
© 2022 by the authors. Licensee MDPI, Basel, Switzerland. This article is an open access article distributed under the terms and conditions of the Creative Commons Attribution (CC BY) license (https://creativecommons.org/licenses/by/4.0/).
Share and Cite
Ishino, T.; Takeno, S.; Takemoto, K.; Yamato, K.; Oda, T.; Nishida, M.; Horibe, Y.; Chikuie, N.; Kono, T.; Taruya, T.; et al. Distinct Gene Set Enrichment Profiles in Eosinophilic and Non-Eosinophilic Chronic Rhinosinusitis with Nasal Polyps by Bulk RNA Barcoding and Sequencing. Int. J. Mol. Sci. 2022, 23, 5653. https://doi.org/10.3390/ijms23105653
Ishino T, Takeno S, Takemoto K, Yamato K, Oda T, Nishida M, Horibe Y, Chikuie N, Kono T, Taruya T, et al. Distinct Gene Set Enrichment Profiles in Eosinophilic and Non-Eosinophilic Chronic Rhinosinusitis with Nasal Polyps by Bulk RNA Barcoding and Sequencing. International Journal of Molecular Sciences. 2022; 23(10):5653. https://doi.org/10.3390/ijms23105653
Chicago/Turabian StyleIshino, Takashi, Sachio Takeno, Kota Takemoto, Kensuke Yamato, Takashi Oda, Manabu Nishida, Yuichiro Horibe, Nobuyuki Chikuie, Takashi Kono, Takayuki Taruya, and et al. 2022. "Distinct Gene Set Enrichment Profiles in Eosinophilic and Non-Eosinophilic Chronic Rhinosinusitis with Nasal Polyps by Bulk RNA Barcoding and Sequencing" International Journal of Molecular Sciences 23, no. 10: 5653. https://doi.org/10.3390/ijms23105653
APA StyleIshino, T., Takeno, S., Takemoto, K., Yamato, K., Oda, T., Nishida, M., Horibe, Y., Chikuie, N., Kono, T., Taruya, T., Hamamoto, T., & Ueda, T. (2022). Distinct Gene Set Enrichment Profiles in Eosinophilic and Non-Eosinophilic Chronic Rhinosinusitis with Nasal Polyps by Bulk RNA Barcoding and Sequencing. International Journal of Molecular Sciences, 23(10), 5653. https://doi.org/10.3390/ijms23105653