CD26 Deficiency Controls Macrophage Polarization Markers and Signal Transducers during Colitis Development and Resolution
Abstract
1. Introduction
2. Results
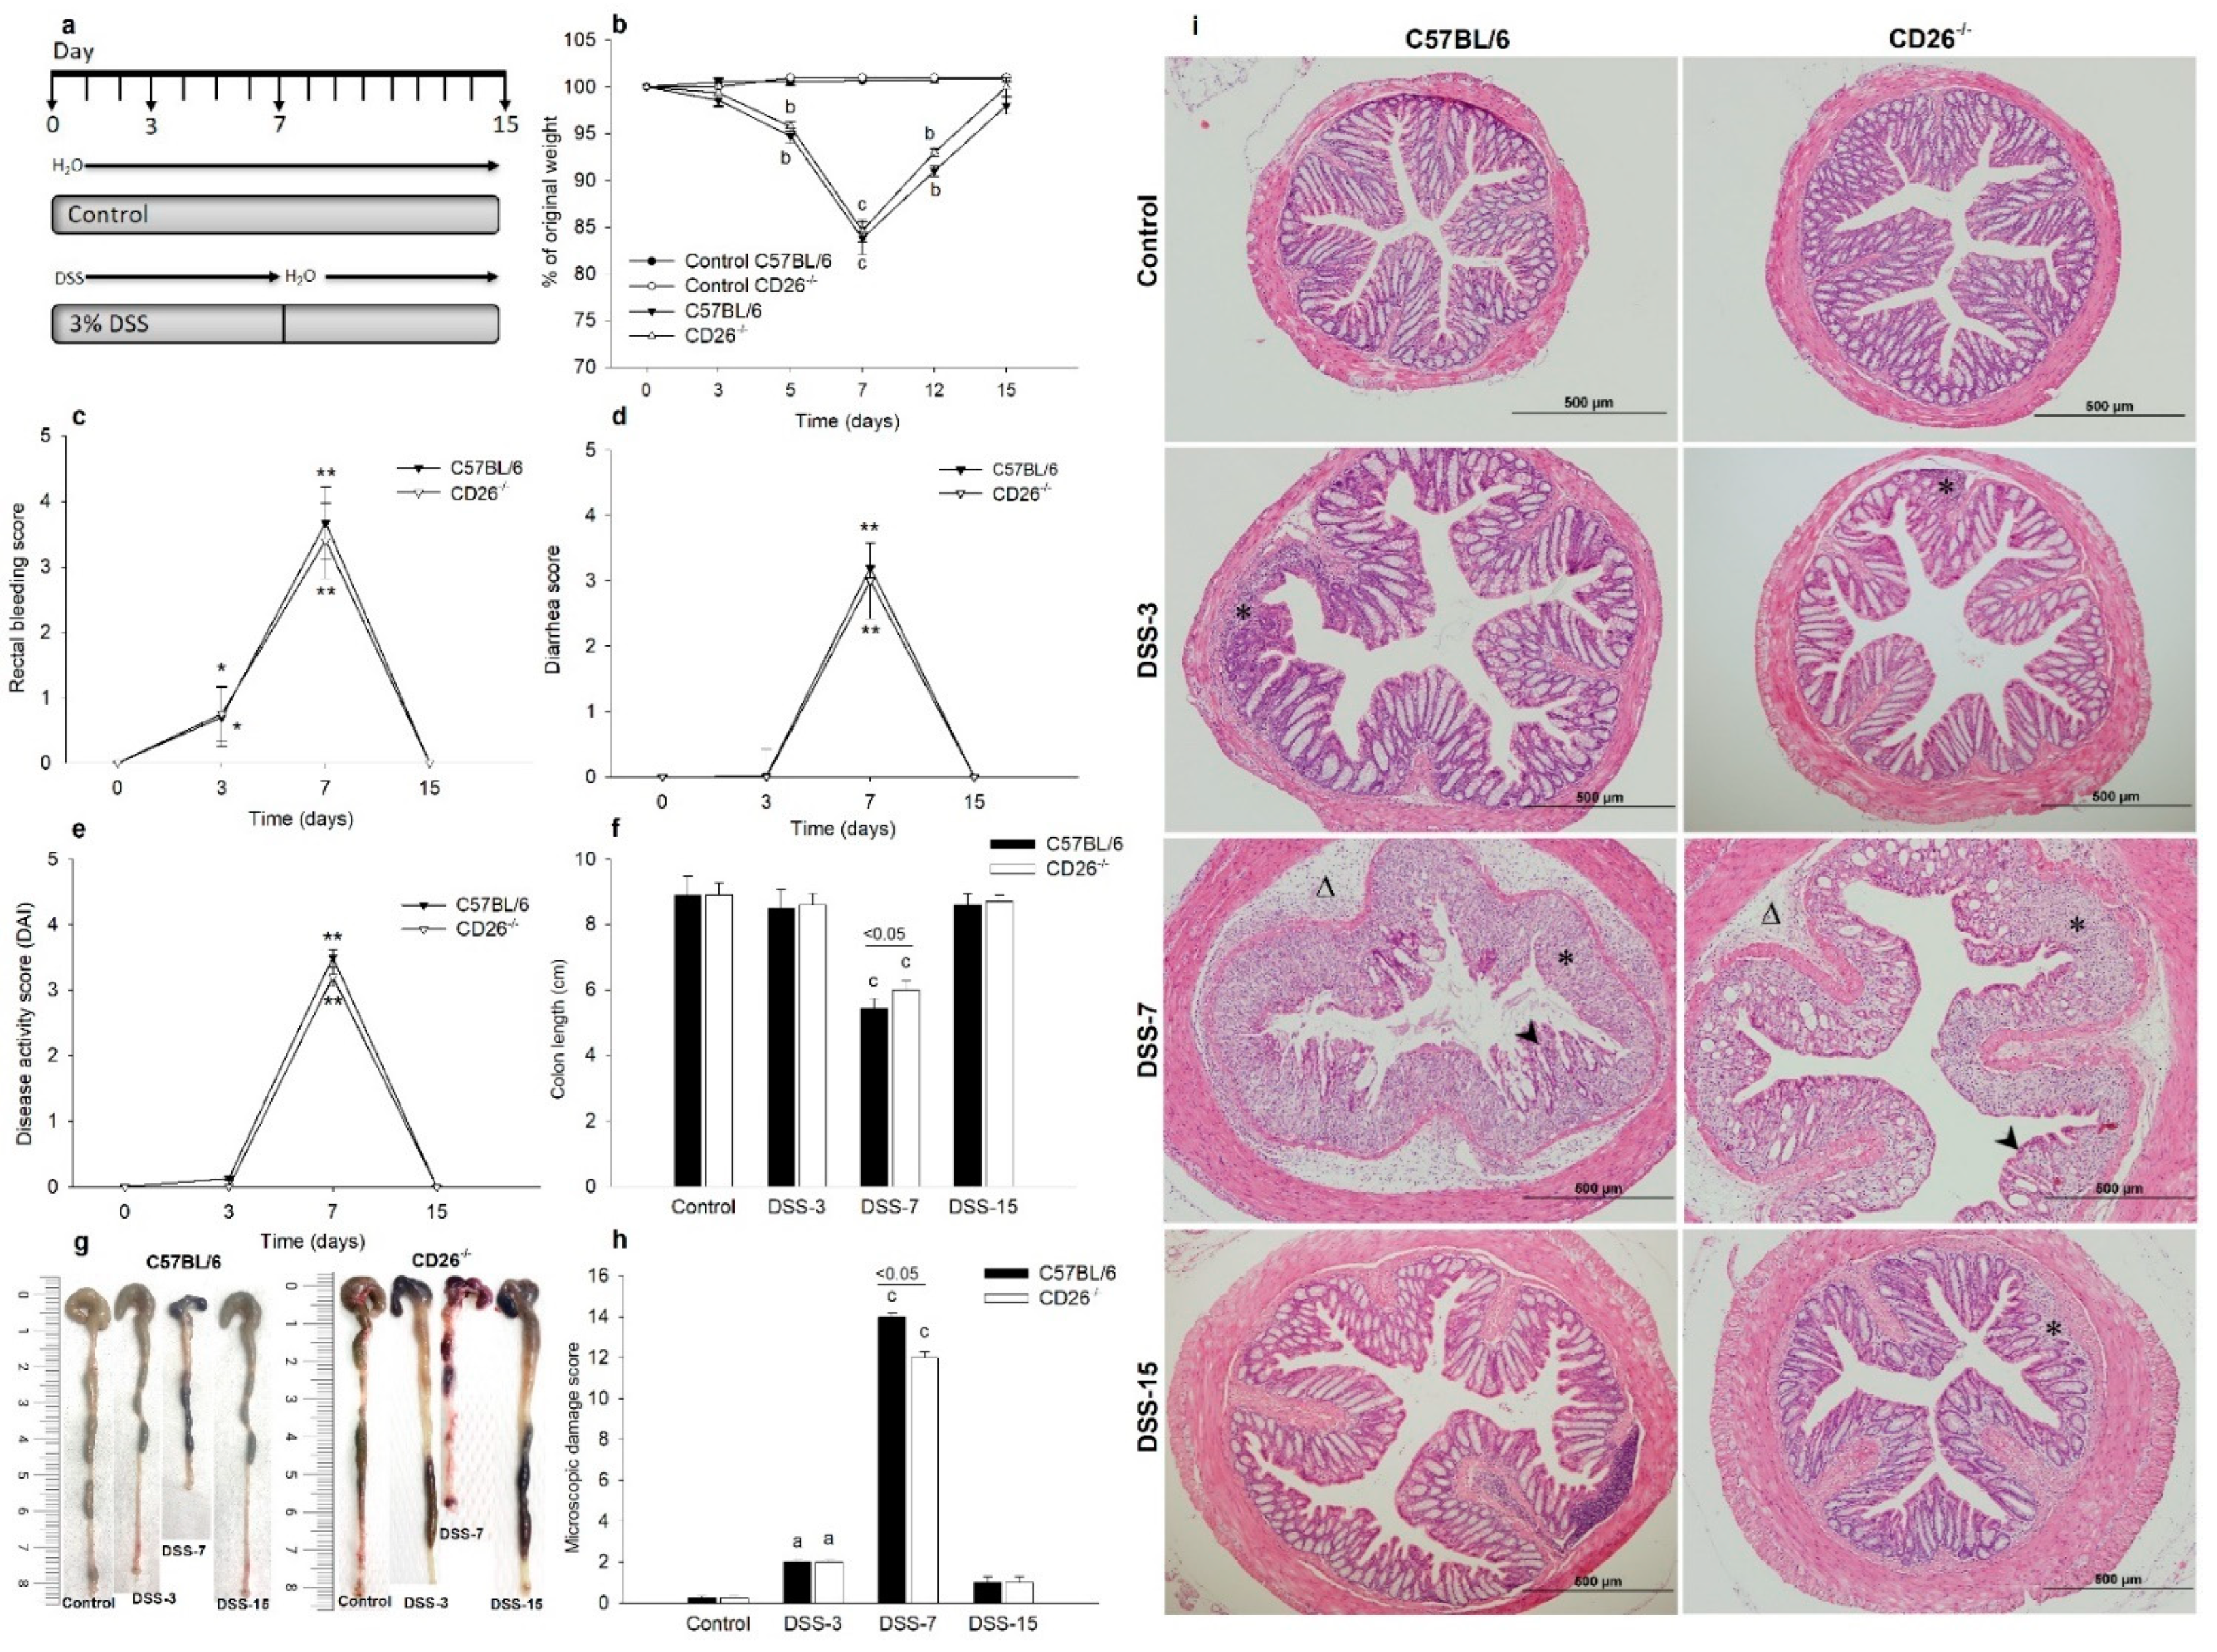
2.1. CD26 Deficiency Attenuates Clinical Symptoms of Colitis and Improves Histological Damage of Colonic Tissue
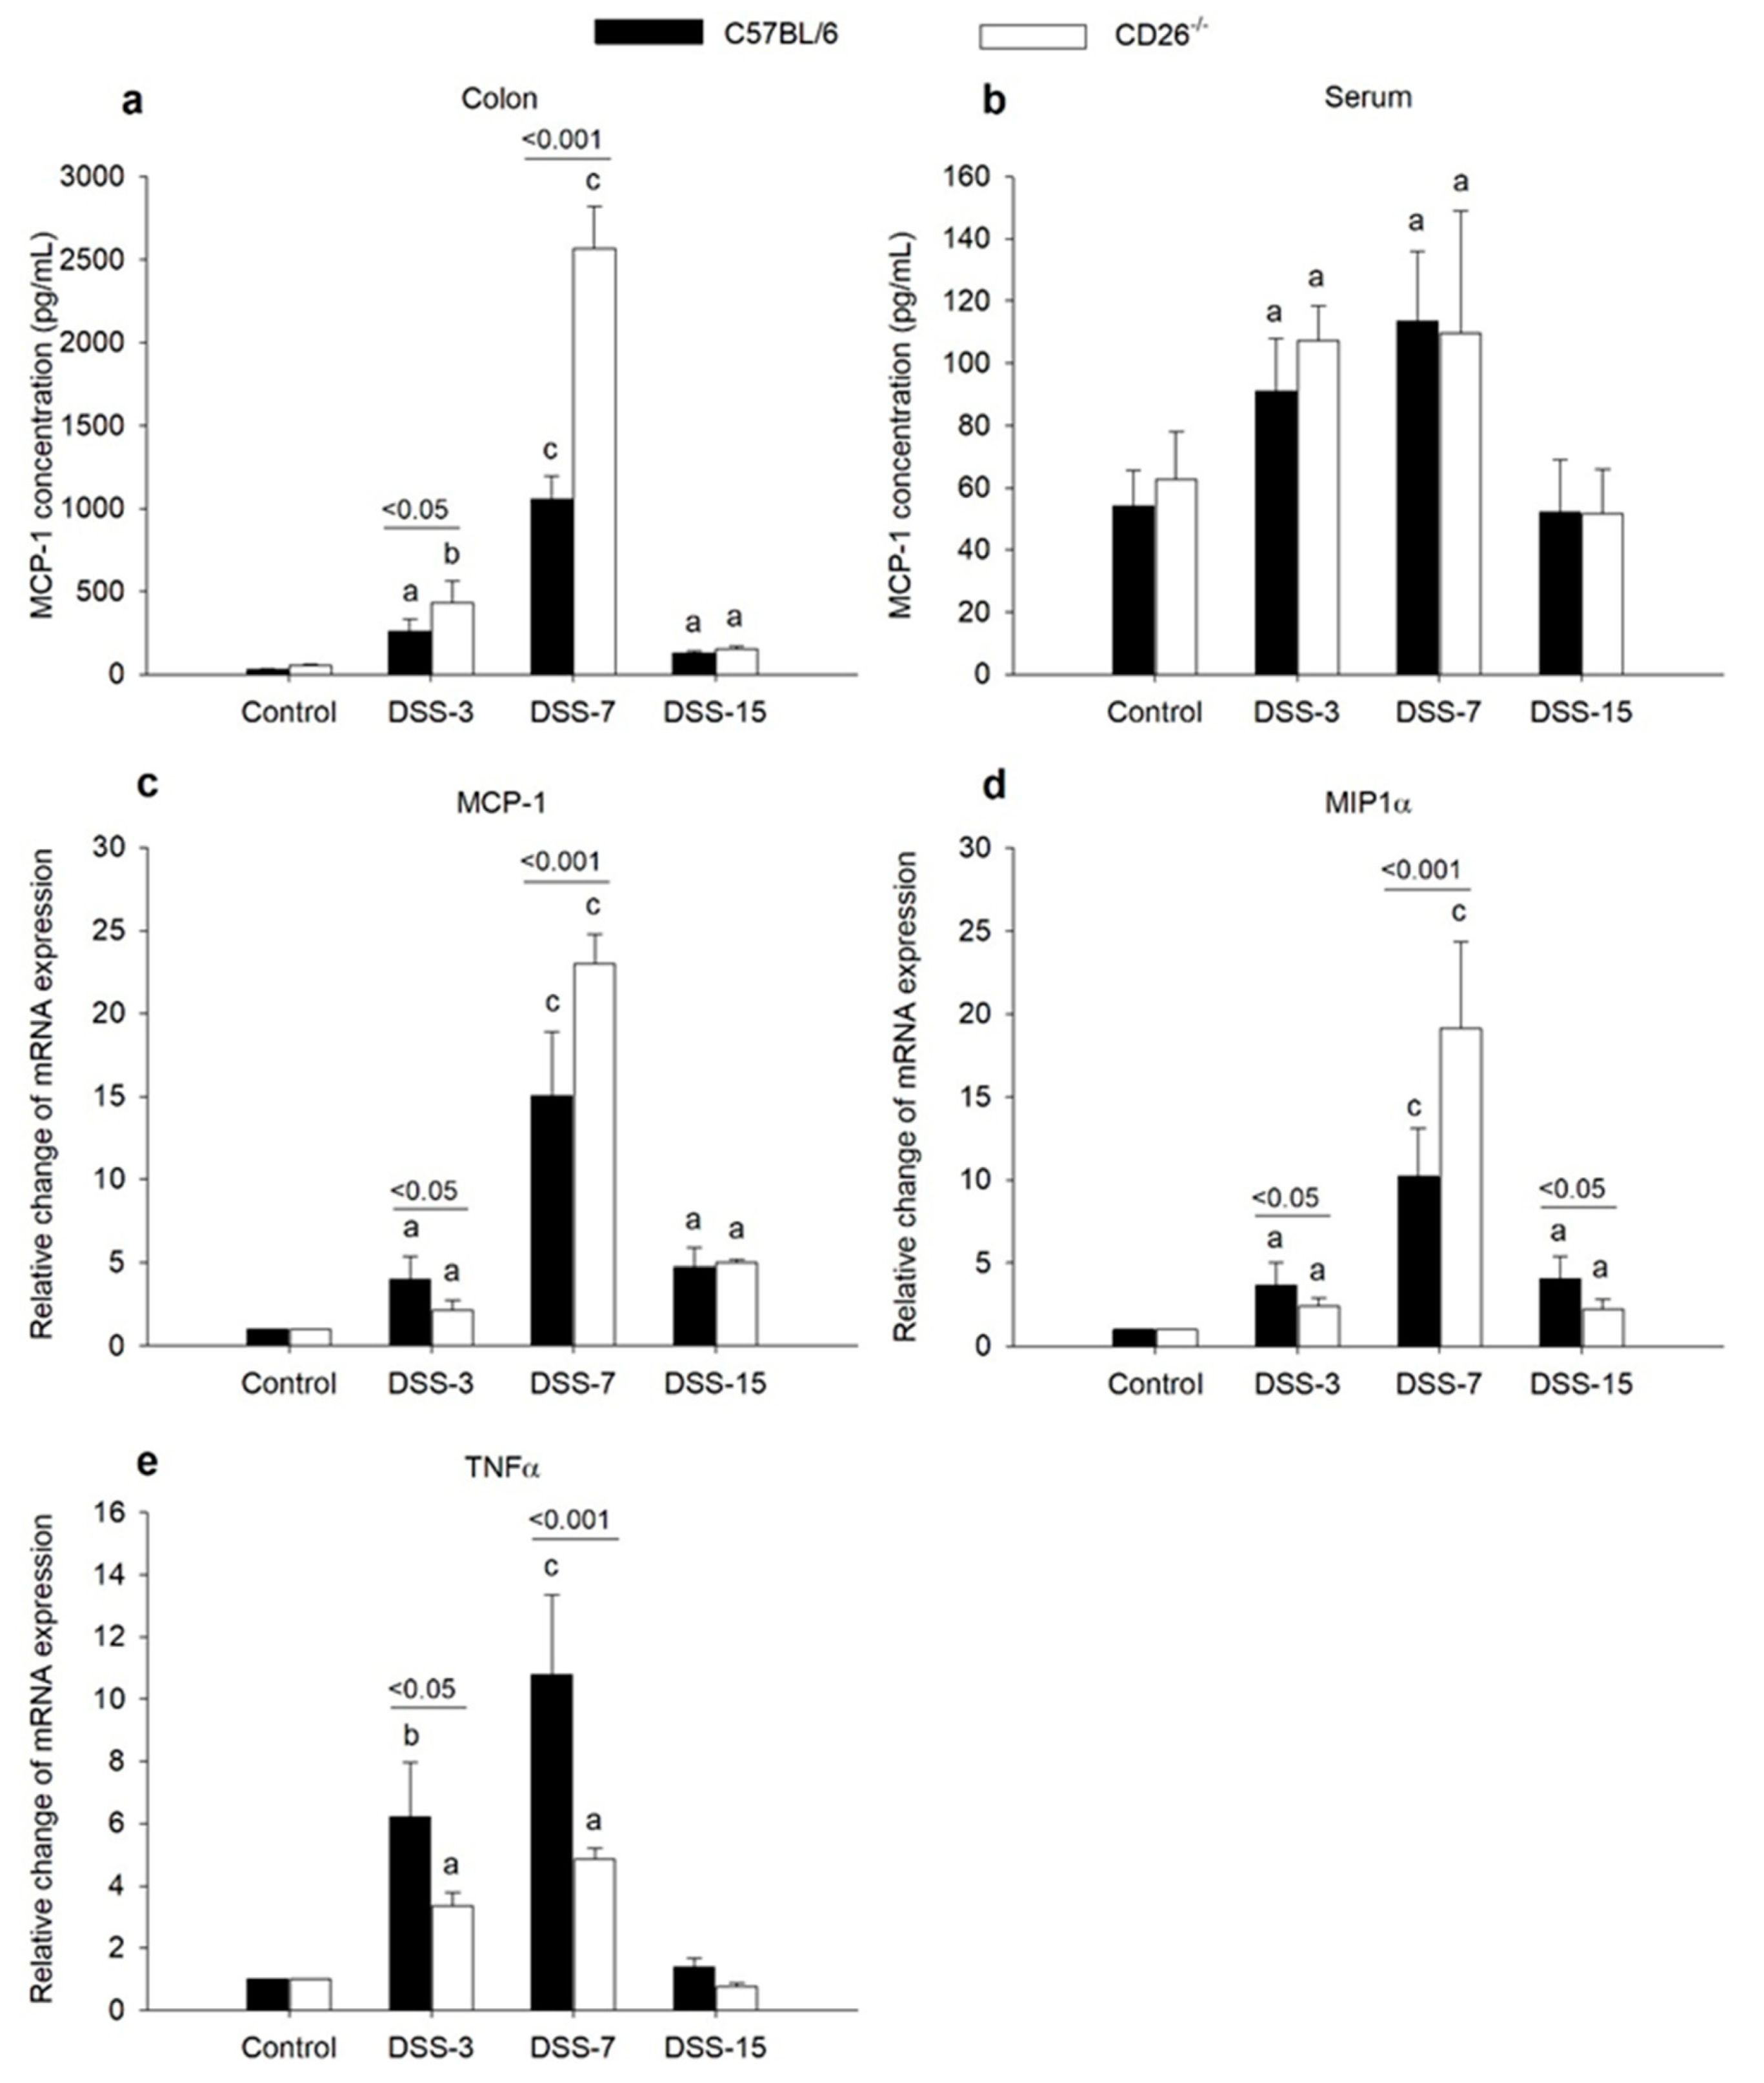
2.2. CD26 Deficiency Has Diverse Effects on the Expression of Macrophage Chemoattractants MCP-1 and MIP1α and Proinflammatory TNFα Cytokine
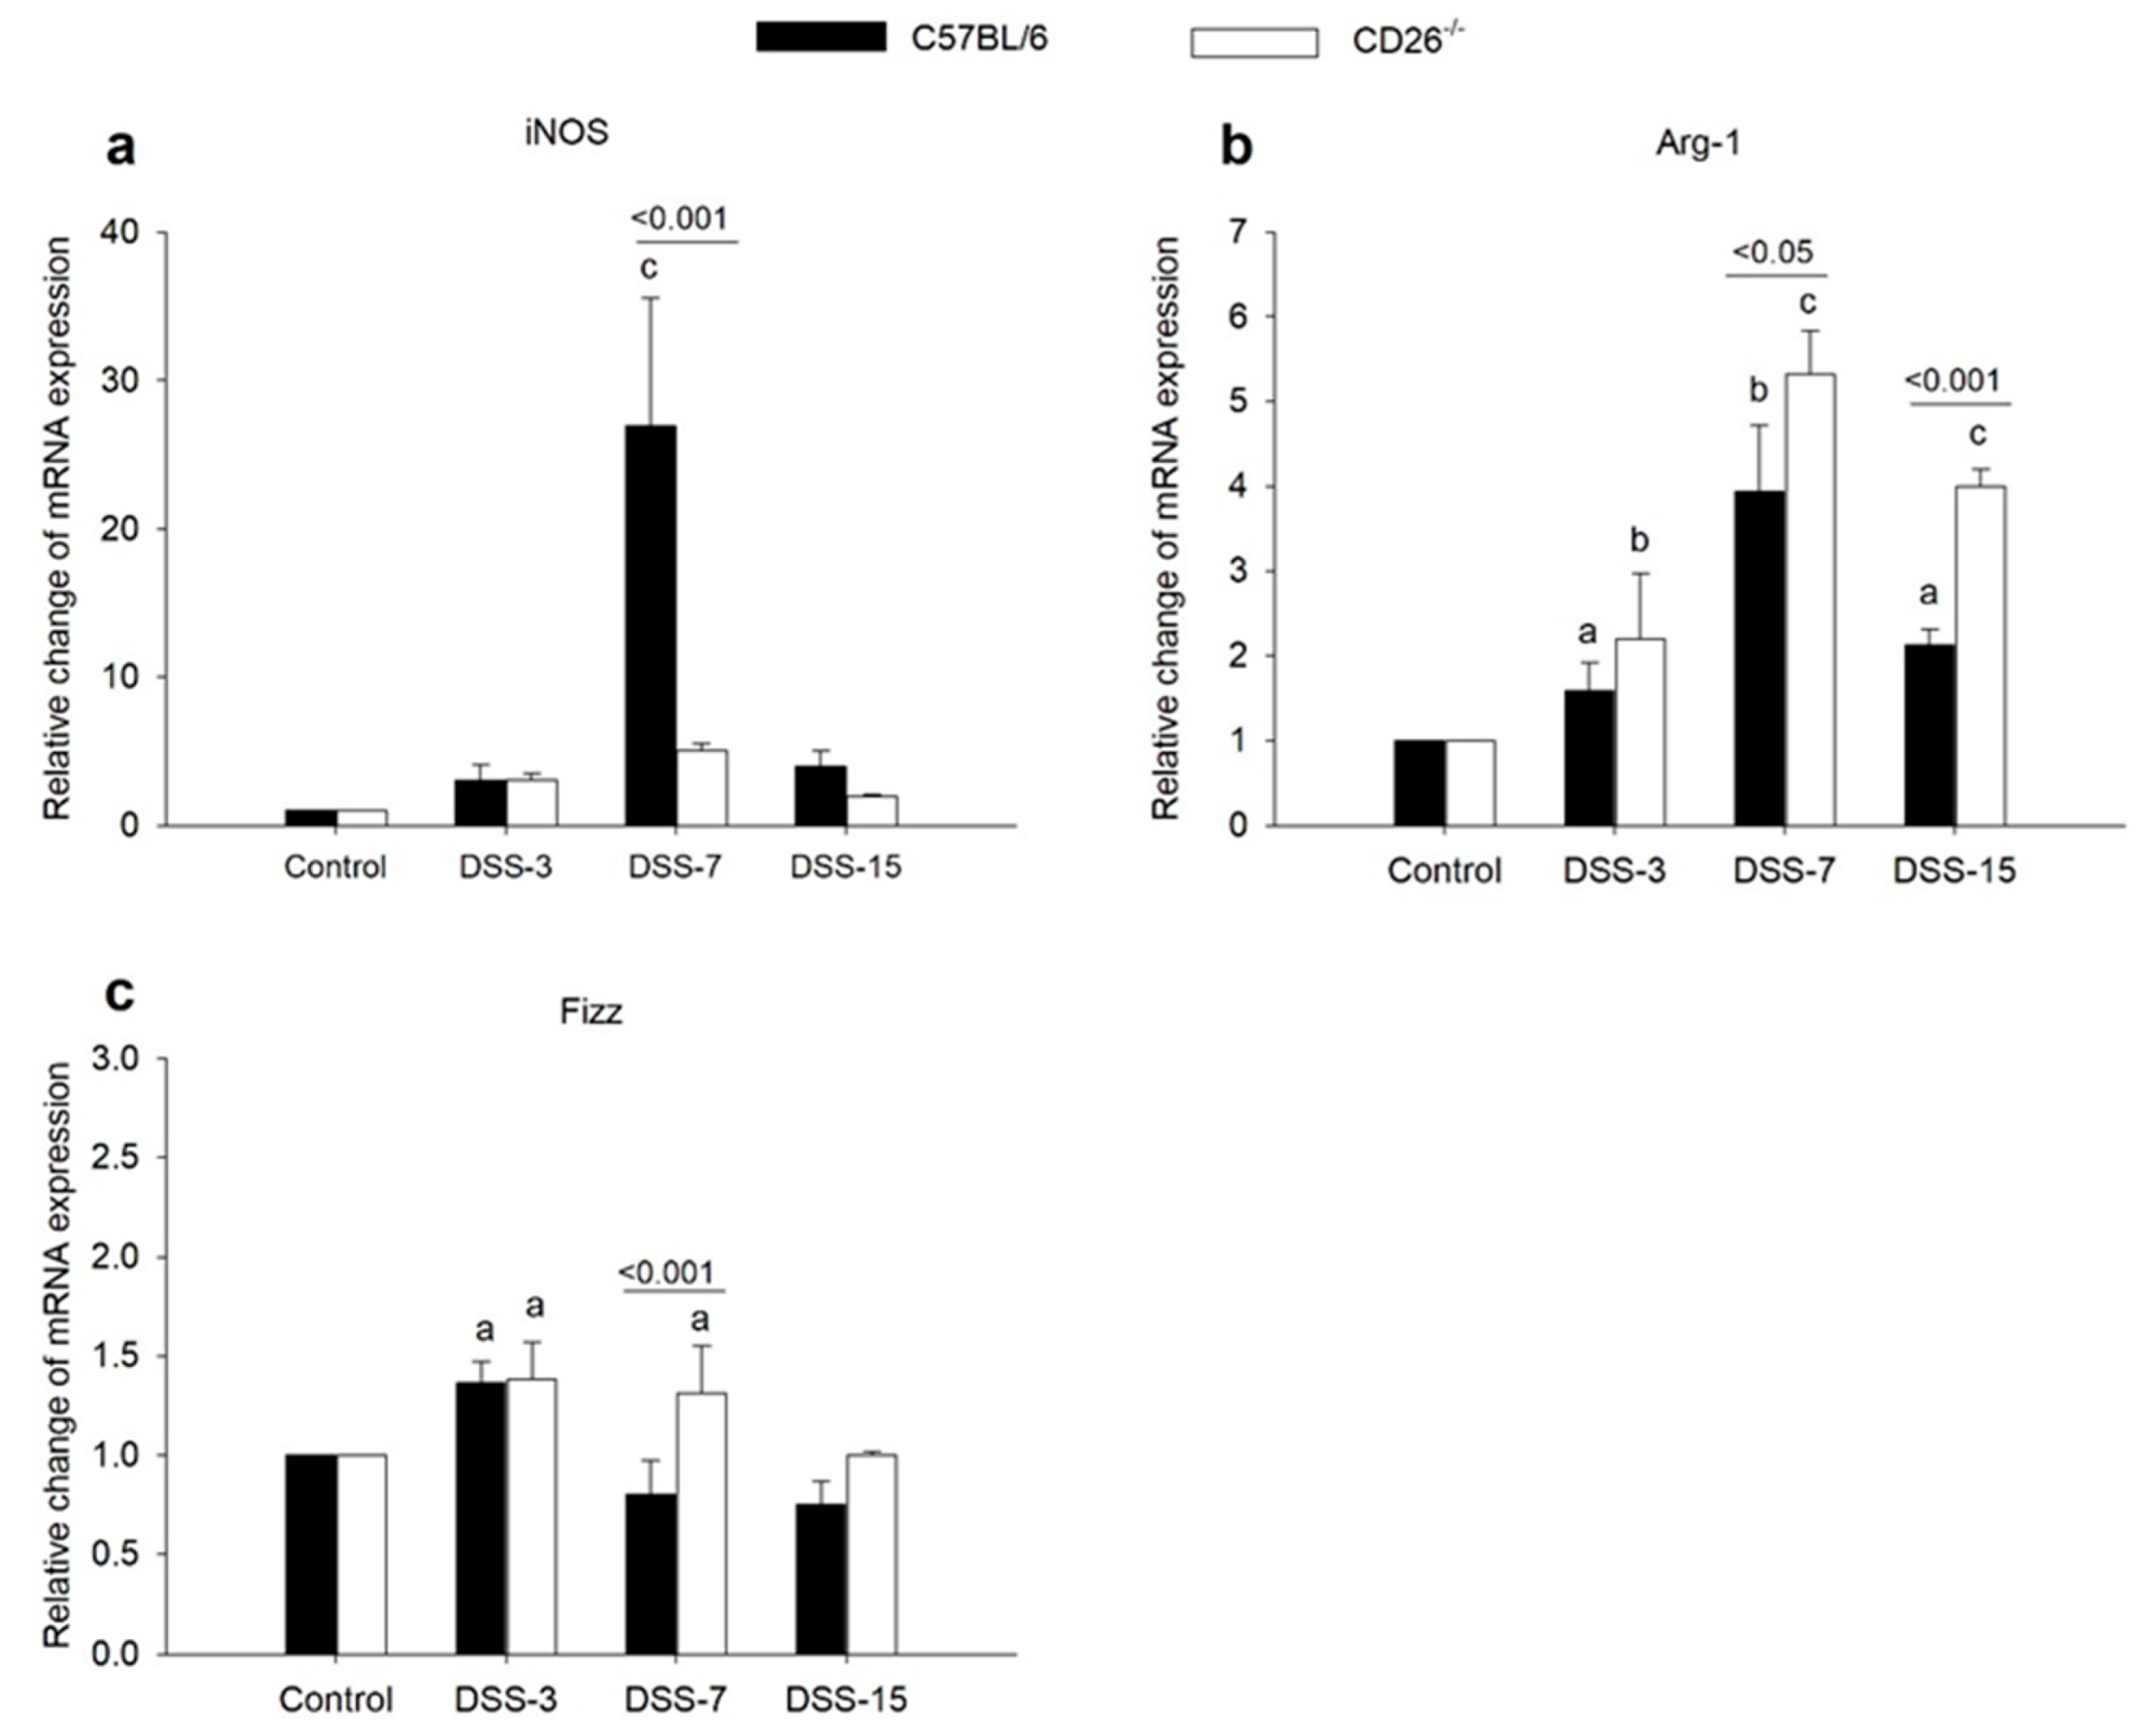
2.3. CD26 Deficiency Negatively Regulates iNOS Expression but Increases the Expression of M2 Macrophage Markers Arg-1 and Fizz
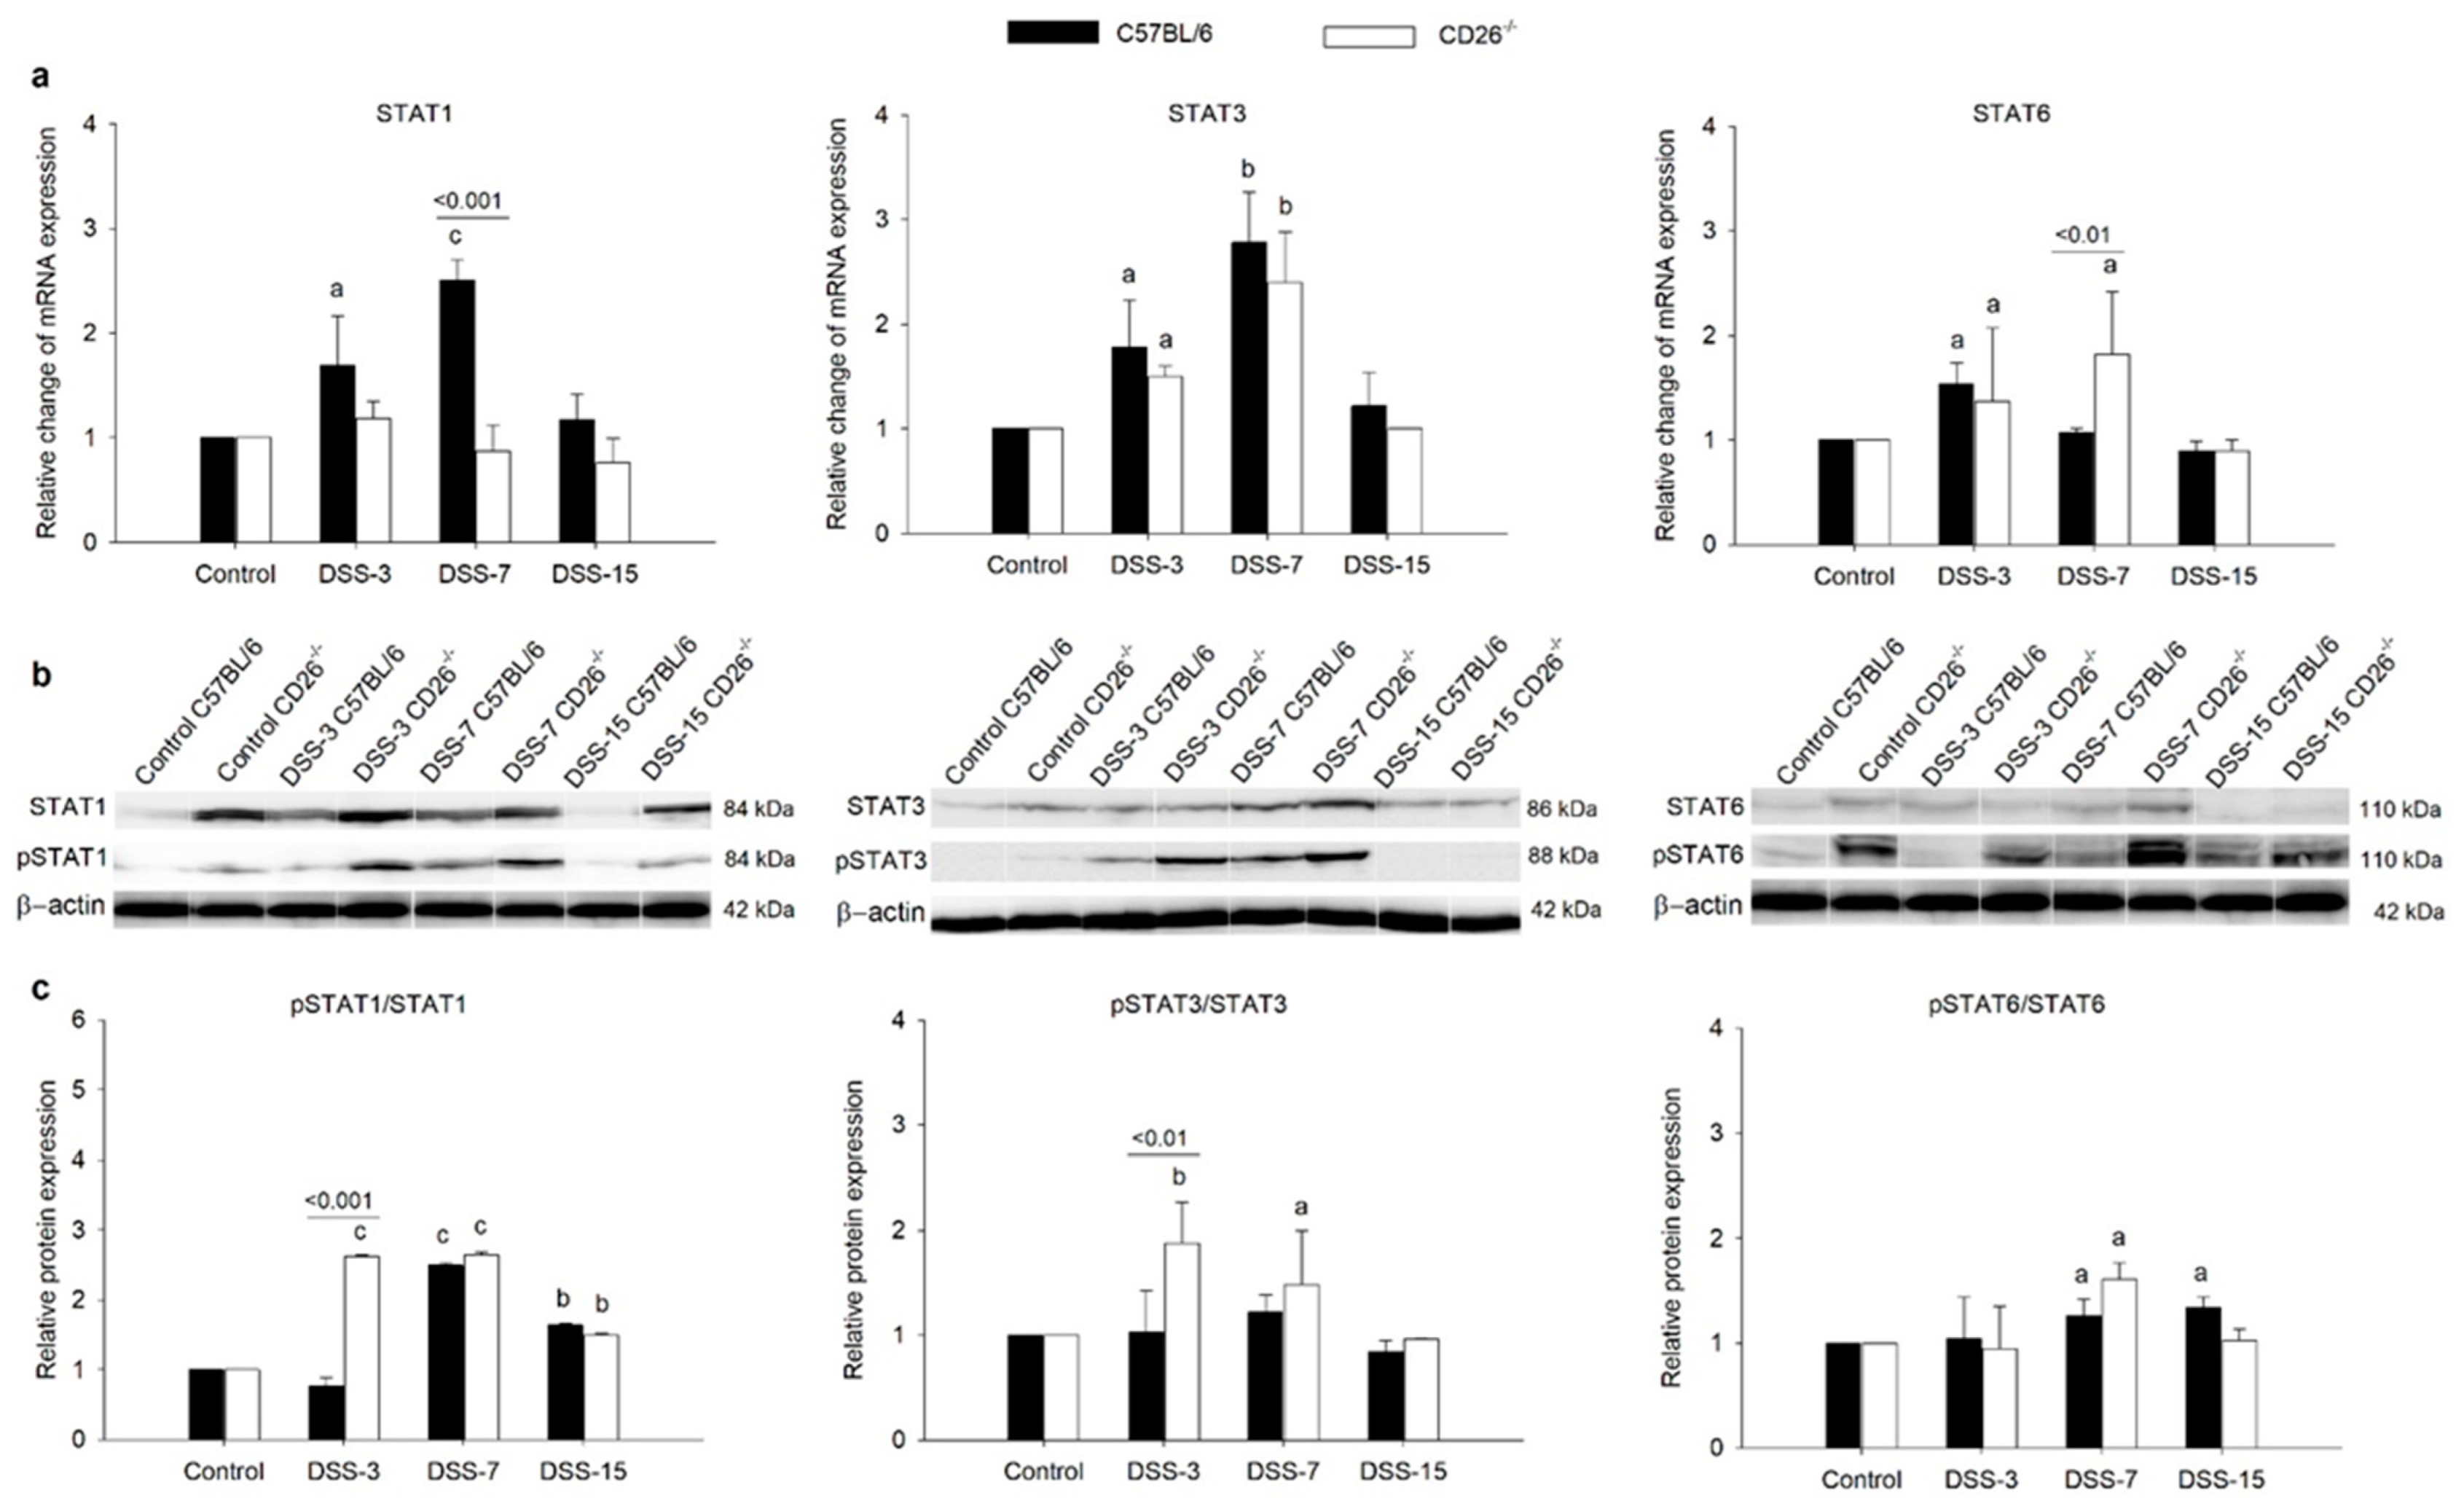
2.4. CD26 Deficiency Modulates STA6, STAT3, and STAT1 Gene and Protein Expression in Colitis
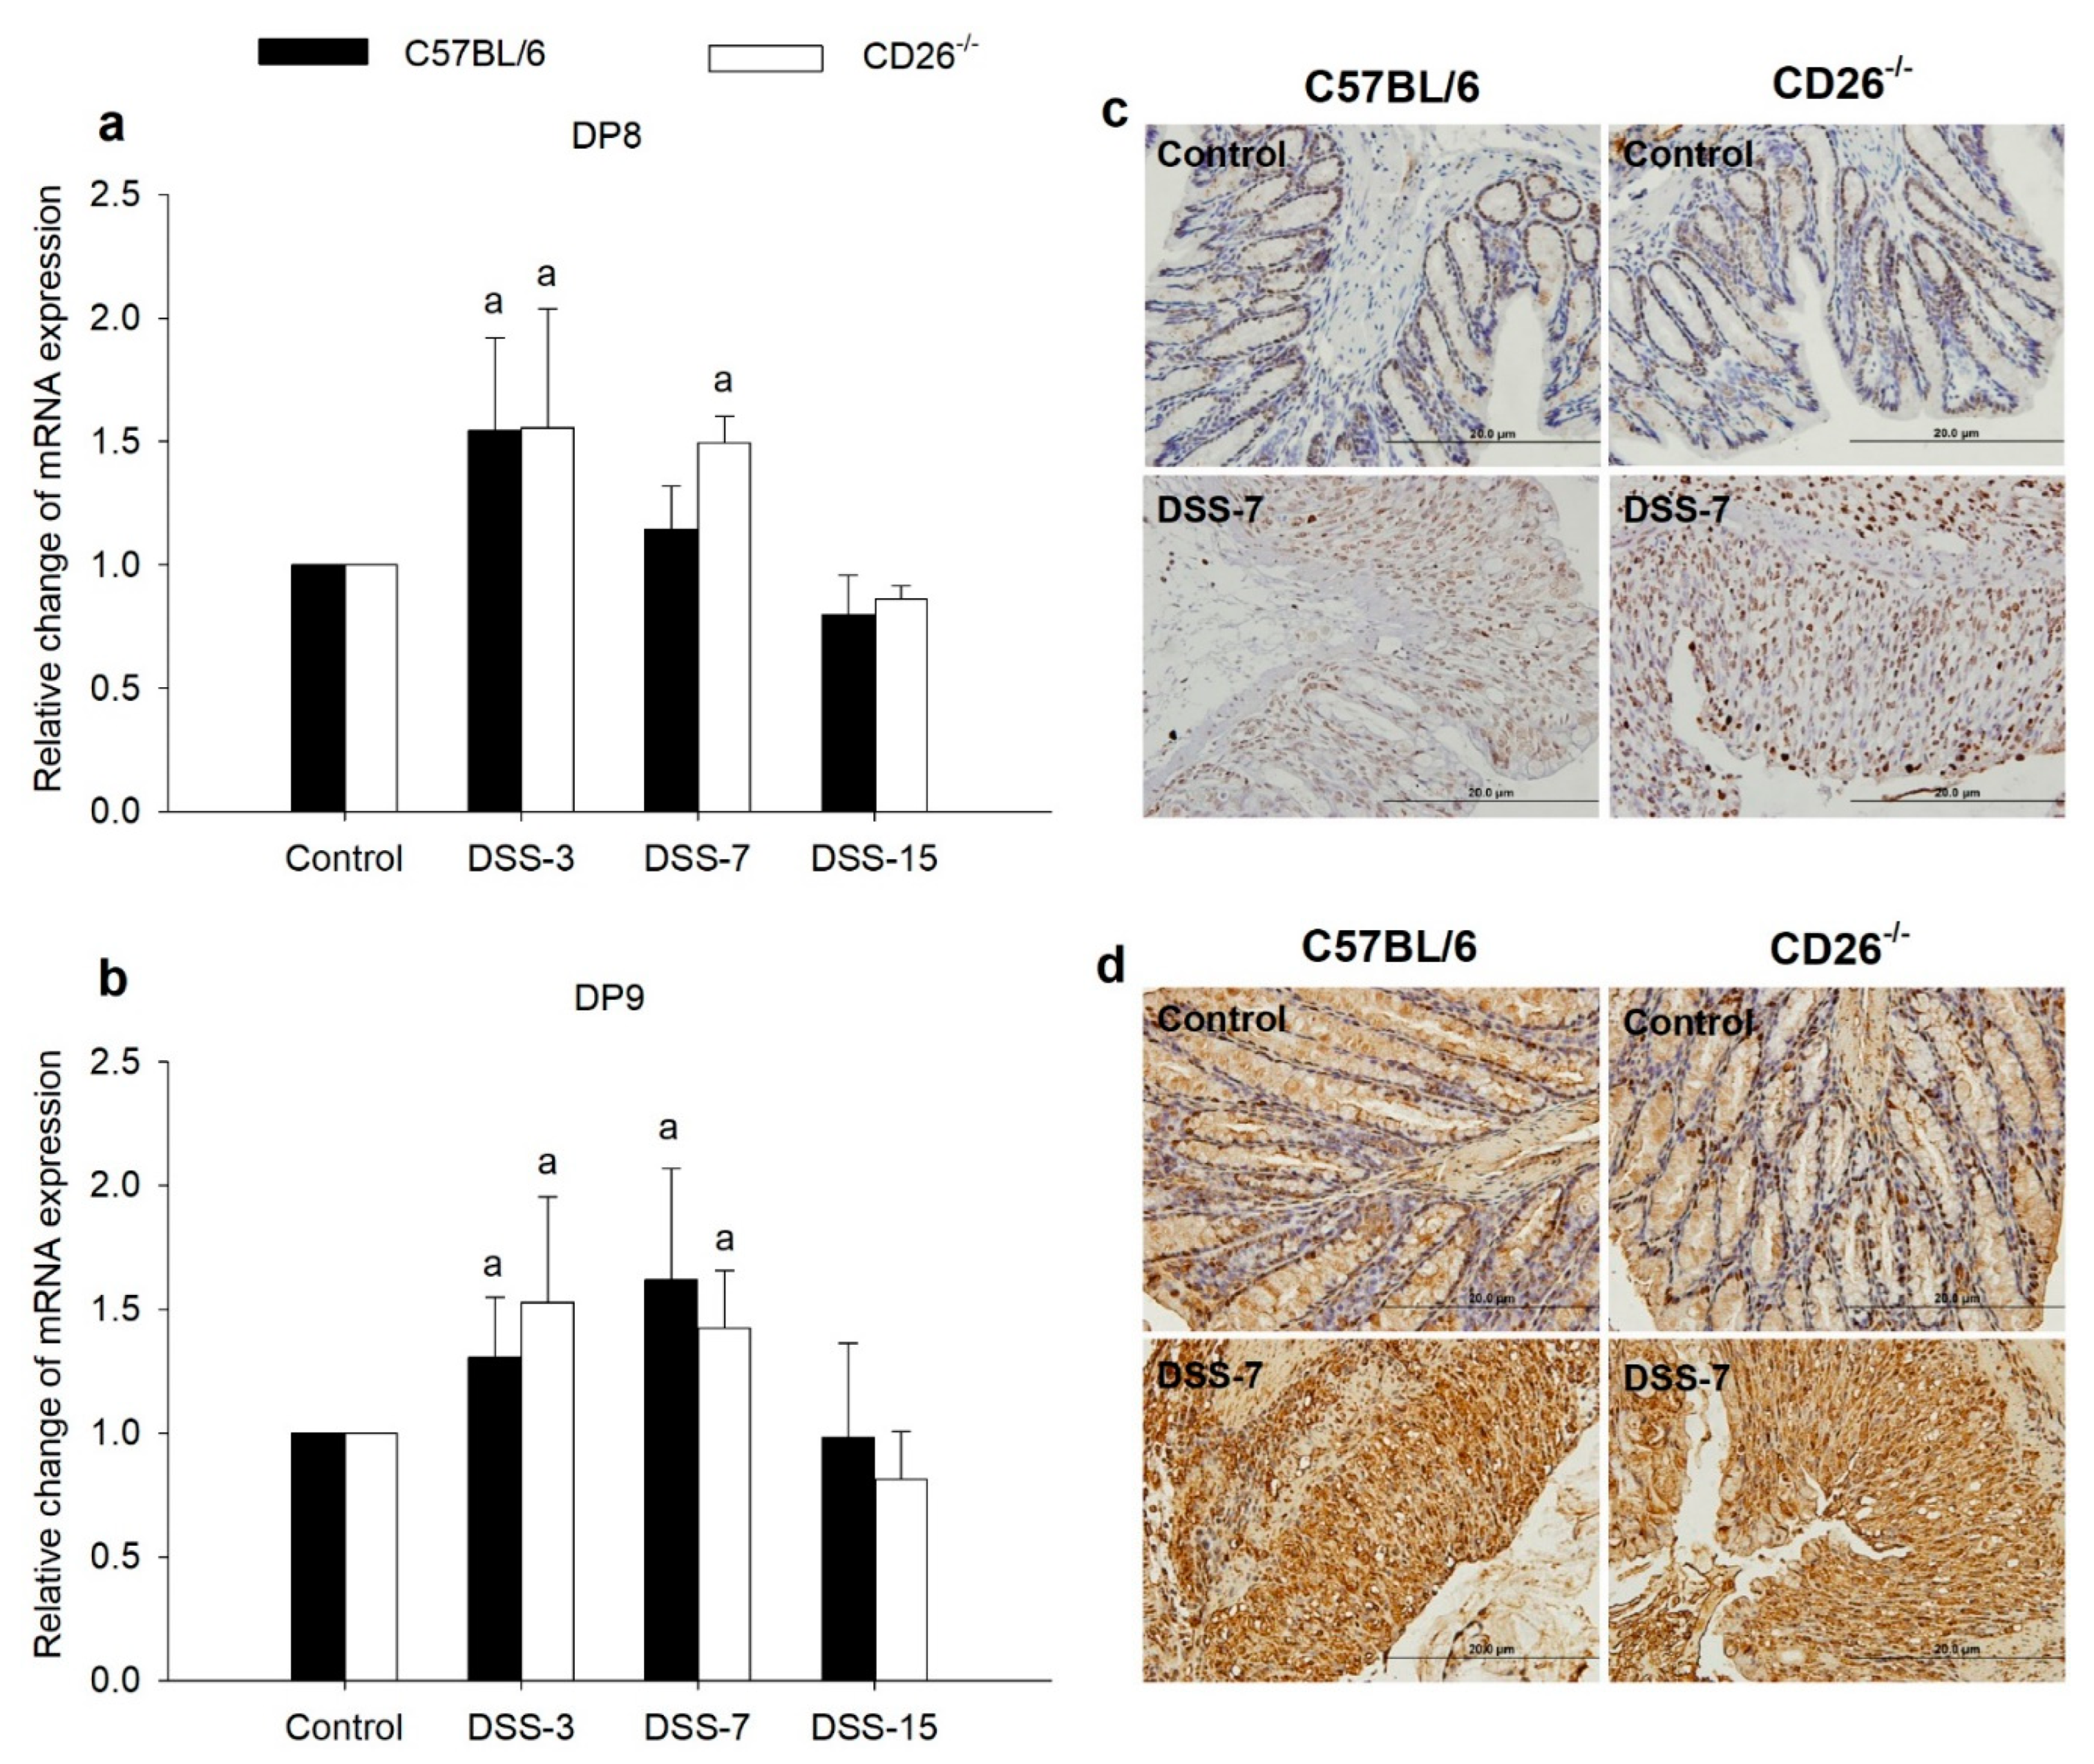
2.5. DP8 and DP9 Are Upregulated in DSS-Induced Colitis Yet Unaffected by CD26 Deficiency
3. Discussion
4. Materials and Methods
4.1. Animals
4.2. Colitis Induction and Evaluation of Colitis Severity
4.3. Histological Evaluation and Immunohistochemical Staining
4.4. RNA Extraction and Quantitative Real-Time (RT)-PCR Analysis
4.5. Determination of MCP-1 Concentration
4.6. Isolation of Total Proteins and Western Blot Analysis
4.7. Statistical Analysis
Author Contributions
Funding
Institutional Review Board Statement
Informed Consent Statement
Data Availability Statement
Conflicts of Interest
References
- Tatiya-aphiradee, N.; Chatuphonprasert, W.; Jarukamjorn, K. Immune Response and Inflammatory Pathway of Ulcerative Colitis. J. Basic Clin. Physiol. Pharmacol. 2018, 30, 1–10. [Google Scholar] [CrossRef] [PubMed]
- Steinbach, E.C.; Plevy, S.E. The Role of Macrophages and Dendritic Cells in the Initiation of Inflammation in IBD. Inflamm. Bowel Dis. 2014, 20, 166–175. [Google Scholar] [CrossRef] [PubMed]
- Wang, N.; Liang, H.; Zen, K. Molecular Mechanisms That Influence the Macrophage M1–M2 Polarization Balance. Front. Immunol. 2014, 5, 614. [Google Scholar] [CrossRef] [PubMed]
- Long, J.; Liu, X.-K.; Kang, Z.-P.; Wang, M.-X.; Zhao, H.-M.; Huang, J.-Q.; Xiao, Q.-P.; Liu, D.-Y.; Zhong, Y.-B. Ginsenoside Rg1 Ameliorated Experimental Colitis by Regulating the Balance of M1/M2 Macrophage Polarization and the Homeostasis of Intestinal Flora. Eur. J. Pharmacol. 2022, 917, 174742. [Google Scholar] [CrossRef] [PubMed]
- Xue, Q.; Yan, Y.; Zhang, R.; Xiong, H. Regulation of INOS on Immune Cells and Its Role in Diseases. IJMS 2018, 19, 3805. [Google Scholar] [CrossRef] [PubMed]
- Viola, A.; Munari, F.; Sánchez-Rodríguez, R.; Scolaro, T.; Castegna, A. The Metabolic Signature of Macrophage Responses. Front. Immunol. 2019, 10, 1462. [Google Scholar] [CrossRef]
- Kaushal, N.; Kudva, A.K.; Patterson, A.D.; Chiaro, C.; Kennett, M.J.; Desai, D.; Amin, S.; Carlson, B.A.; Cantorna, M.T.; Prabhu, K.S. Crucial Role of Macrophage Selenoproteins in Experimental Colitis. J. Immunol. 2014, 193, 3683–3692. [Google Scholar] [CrossRef]
- Ruder, B.; Becker, C. At the Forefront of the Mucosal Barrier: The Role of Macrophages in the Intestine. Cells 2020, 9, 2162. [Google Scholar] [CrossRef]
- Singh, U.P.; Singh, N.P.; Murphy, E.A.; Price, R.L.; Fayad, R.; Nagarkatti, M.; Nagarkatti, P.S. Chemokine and Cytokine Levels in Inflammatory Bowel Disease Patients. Cytokine 2016, 77, 44–49. [Google Scholar] [CrossRef]
- Bhavsar, I.; Miller, C.S.; Al-Sabbagh, M. Macrophage Inflammatory Protein-1 Alpha (MIP-1 Alpha)/CCL3: As a Biomarker. In General Methods in Biomarker Research and Their Applications; Preedy, V.R., Patel, V.B., Eds.; Biomarkers in Disease: Methods, Discoveries and Applications; Springer: Dordrecht, The Netherlands, 2015; pp. 223–249. ISBN 978-94-007-7695-1. [Google Scholar]
- Zundler, S.; Neurath, M. Integrating Immunologic Signaling Networks: The JAK/STAT Pathway in Colitis and Colitis-Associated Cancer. Vaccines 2016, 4, 5. [Google Scholar] [CrossRef]
- Verbanac, D.; Čeri, A.; Hlapčić, I.; Shakibaei, M.; Brockmueller, A.; Krušlin, B.; Ljubičić, N.; Baršić, N.; Detel, D.; Batičić, L.; et al. Profiling Colorectal Cancer in the Landscape Personalized Testing—Advantages of Liquid Biopsy. IJMS 2021, 22, 4327. [Google Scholar] [CrossRef] [PubMed]
- Klemann, C.; Wagner, L.; Stephan, M.; von Hörsten, S. Cut to the Chase: A Review of CD26/Dipeptidyl Peptidase-4’s (DPP4) Entanglement in the Immune System: CD26/DPP4 in the Immune System. Clin. Exp. Immunol. 2016, 185, 1–21. [Google Scholar] [CrossRef] [PubMed]
- Bank, U.; Heimburg, A.; Wohlfarth, A.; Koch, G.; Nordhoff, K.; Julius, H.; Helmuth, M.; Breyer, D.; Reinhold, D.; Täger, M.; et al. Outside or inside: Role of the Subcellular Localization of DP4-like Enzymes for Substrate Conversion and Inhibitor Effects. Biol. Chem. 2011, 392, 169–187. [Google Scholar] [CrossRef] [PubMed]
- Shao, S.; Xu, Q.; Yu, X.; Pan, R.; Chen, Y. Dipeptidyl Peptidase 4 Inhibitors and Their Potential Immune Modulatory Functions. Pharmacol. Ther. 2020, 209, 107503. [Google Scholar] [CrossRef]
- Schade, J.; Stephan, M.; Schmiedl, A.; Wagner, L.; Niestroj, A.J.; Demuth, H.-U.; Frerker, N.; Klemann, C.; Raber, K.A.; Pabst, R.; et al. Regulation of Expression and Function of Dipeptidyl Peptidase 4 (DP4), DP8/9, and DP10 in Allergic Responses of the Lung in Rats. J. Histochem. Cytochem. 2008, 56, 147–155. [Google Scholar] [CrossRef]
- Yazbeck, R.; Sulda, M.L.; Howarth, G.S.; Bleich, A.; Raber, K.; von Hörsten, S.; Holst, J.J.; Abbott, C.A. Dipeptidyl Peptidase Expression during Experimental Colitis in Mice. Inflamm. Bowel Dis. 2010, 16, 1340–1351. [Google Scholar] [CrossRef]
- Matheeussen, V.; Waumans, Y.; Martinet, W.; Goethem, S.; Veken, P.; Scharpé, S.; Augustyns, K.; Meyer, G.R.Y.; Meester, I. Dipeptidyl Peptidases in Atherosclerosis: Expression and Role in Macrophage Differentiation, Activation and Apoptosis. Basic Res. Cardiol. 2013, 108, 350. [Google Scholar] [CrossRef]
- Waumans, Y.; Vliegen, G.; Maes, L.; Rombouts, M.; Declerck, K.; Van Der Veken, P.; Vanden Berghe, W.; De Meyer, G.R.Y.; Schrijvers, D.; De Meester, I. The Dipeptidyl Peptidases 4, 8, and 9 in Mouse Monocytes and Macrophages: DPP8/9 Inhibition Attenuates M1 Macrophage Activation in Mice. Inflammation 2016, 39, 413–424. [Google Scholar] [CrossRef]
- Buljevic, S.; Detel, D.; Pugel, E.P.; Varljen, J. The Effect of CD26-Deficiency on Dipeptidyl Peptidase 8 and 9 Expression Profiles in a Mouse Model of Crohn’s Disease. J. Cell Biochem. 2018, 119, 6743–6755. [Google Scholar] [CrossRef]
- Detel, D.; Pugel, E.P.; Pucar, L.B.; Buljevic, S.; Varljen, J. Development and Resolution of Colitis in Mice with Target Deletion of Dipeptidyl Peptidase IV: Colitis in CD26-Deficient Mice. Exp. Physiol. 2012, 97, 486–496. [Google Scholar] [CrossRef]
- Sedo, A.; Duke-Cohan, J.S.; Balaziova, E.; Sedova, L.R. Dipeptidyl Peptidase IV Activity and/or Structure Homologs: Contributing Factors in the Pathogenesis of Rheumatoid Arthritis? Arthritis Res. Ther. 2005, 7, 253–269. [Google Scholar] [CrossRef] [PubMed][Green Version]
- Pinheiro, M.M.; Stoppa, C.L.; Valduga, C.J.; Okuyama, C.E.; Gorjão, R.; Pereira, R.M.S.; Diniz, S.N. Sitagliptin Inhibit Human Lymphocytes Proliferation and Th1/Th17 Differentiation in Vitro. Eur. J. Pharm. Sci. 2017, 100, 17–24. [Google Scholar] [CrossRef] [PubMed]
- Ning, M.; Yang, W.; Guan, W.; Gu, Y.; Feng, Y.; Leng, Y. Dipeptidyl Peptidase 4 Inhibitor Sitagliptin Protected against Dextran Sulfate Sodium-Induced Experimental Colitis by Potentiating the Action of GLP-2. Acta Pharm. Sin. 2020, 41, 1446–1456. [Google Scholar] [CrossRef] [PubMed]
- Yu, D.M.T.; Ajami, K.; Gall, M.G.; Park, J.; Lee, C.S.; Evans, K.A.; McLaughlin, E.A.; Pitman, M.R.; Abbott, C.A.; McCaughan, G.W.; et al. The In Vivo Expression of Dipeptidyl Peptidases 8 and 9. J. Histochem. Cytochem. 2009, 57, 1025–1040. [Google Scholar] [CrossRef]
- Zhang, H.; Chen, Y.; Keane, F.M.; Gorrell, M.D. Advances in Understanding the Expression and Function of Dipeptidyl Peptidase 8 and 9. Mol. Cancer Res. 2013, 11, 1487–1496. [Google Scholar] [CrossRef]
- Khan, W.I.; Motomura, Y.; Wang, H.; El-Sharkawy, R.T.; Verdu, E.F.; Verma-Gandhu, M.; Rollins, B.J.; Collins, S.M. Critical Role of MCP-1 in the Pathogenesis of Experimental Colitis in the Context of Immune and Enterochromaffin Cells. Am. J. Physiol.-Gastrointest. Liver Physiol. 2006, 291, G803–G811. [Google Scholar] [CrossRef]
- Pender, S.L.-F. Systemic Administration of the Chemokine Macrophage Inflammatory Protein 1 Exacerbates Inflammatory Bowel Disease in a Mouse Model. Gut 2005, 54, 1114–1120. [Google Scholar] [CrossRef]
- Ikeda, T.; Kumagai, E.; Iwata, S.; Yamakawa, A. Soluble CD26/Dipeptidyl Peptidase IV Enhances the Transcription of IL-6 and TNF-α in THP-1 Cells and Monocytes. PLoS ONE 2013, 8, e66520. [Google Scholar] [CrossRef]
- Sands, B.E.; Kaplan, G.G. The Role of TNFα in Ulcerative Colitis. J. Clin. Pharmacol. 2007, 47, 930–941. [Google Scholar] [CrossRef]
- Zhou, Y.; Liu, H.; Song, J.; Cao, L.; Tang, L.; Qi, C. Sinomenine Alleviates Dextran Sulfate Sodium-induced Colitis via the Nrf2/NQO-1 Signaling Pathway. Mol. Med. Rep. 2018, 18, 3691–3698. [Google Scholar] [CrossRef]
- El-Ashmawy, N.E.; Khedr, N.F.; El-Bahrawy, H.A.; El-Adawy, S.A. Downregulation of INOS and Elevation of CAMP Mediate the Anti-Inflammatory Effect of Glabridin in Rats with Ulcerative Colitis. Inflammopharmacology 2018, 26, 551–559. [Google Scholar] [CrossRef] [PubMed]
- Yang, Z.; Ming, X.-F. Functions of Arginase Isoforms in Macrophage Inflammatory Responses: Impact on Cardiovascular Diseases and Metabolic Disorders. Front. Immunol. 2014, 5, 533. [Google Scholar] [CrossRef] [PubMed]
- Yu, T.; Gan, S.; Zhu, Q.; Dai, D.; Li, N.; Wang, H.; Chen, X.; Hou, D.; Wang, Y.; Pan, Q.; et al. Modulation of M2 Macrophage Polarization by the Crosstalk between Stat6 and Trim24. Nat. Commun. 2019, 10, 4353. [Google Scholar] [CrossRef] [PubMed]
- Glass, C.K.; Natoli, G. Molecular Control of Activation and Priming in Macrophages. Nat. Immunol. 2016, 17, 26–33. [Google Scholar] [CrossRef]
- Goenka, S.; Kaplan, M.H. Transcriptional Regulation by STAT6. Immunol. Res. 2011, 50, 87–96. [Google Scholar] [CrossRef]
- Karmele, E.P.; Pasricha, T.S.; Ramalingam, T.R.; Thompson, R.W.; Gieseck, R.L.; Knilans, K.J.; Hegen, M.; Farmer, M.; Jin, F.; Kleinman, A.; et al. Anti-IL-13Rα2 Therapy Promotes Recovery in a Murine Model of Inflammatory Bowel Disease. Mucosal Immunol. 2019, 12, 1174–1186. [Google Scholar] [CrossRef]
- Marguet, D.; Baggio, L.; Kobayashi, T.; Bernard, A.-M.; Pierres, M.; Nielsen, P.F.; Ribel, U.; Watanabe, T.; Drucker, D.J.; Wagtmann, N. Enhanced Insulin Secretion and Improved Glucose Tolerance in Mice Lacking CD26. Proc. Natl. Acad. Sci. USA 2000, 97, 6874–6879. [Google Scholar] [CrossRef]
- Wirtz, S.; Popp, V.; Kindermann, M.; Gerlach, K.; Weigmann, B.; Fichtner-Feigl, S.; Neurath, M.F. Chemically Induced Mouse Models of Acute and Chronic Intestinal Inflammation. Nat. Protoc. 2017, 12, 1295–1309. [Google Scholar] [CrossRef]
- Shin, H.S.; Satsu, H.; Bae, M.-J.; Zhao, Z.; Ogiwara, H.; Totsuka, M.; Shimizu, M. Anti-Inflammatory Effect of Chlorogenic Acid on the IL-8 Production in Caco-2 Cells and the Dextran Sulphate Sodium-Induced Colitis Symptoms in C57BL/6 Mice. Food Chem. 2015, 168, 167–175. [Google Scholar] [CrossRef]
- Viennois, E.; Chen, F.; Laroui, H.; Baker, M.T.; Merlin, D. Dextran Sodium Sulfate Inhibits the Activities of Both Polymerase and Reverse Transcriptase: Lithium Chloride Purification, a Rapid and Efficient Technique to Purify RNA. BMC Res. Notes 2013, 6, 360. [Google Scholar] [CrossRef]

| Gene | Forward Primer | Reverse Primer |
|---|---|---|
| MCP1 | 5′TTAAAAACCTGGATCGGAACCAA3′ | 5′GCATTAGCTTCAGATTTACGGGT3′ |
| MIP-1α | 5′CATATGGAGCTGACACCCCG3′ | 5′GTCAGGAAAATGACACCTGGC3′ |
| TNF-α | 5′CCTGTAGCCCACGTCGTAG3′ | 5′GGGAGTAGACAAGGTACAACCC3′ |
| iNOS | 5′AGTCAACTGCAAGAGAACGGA3′ | 5′GGCTGAGAACAGCACAAGGG3′ |
| Arg | 5′TGGCTTGCGAGACGTAGAC3′ | 5′GCTCAGGTGAATCGGCCTTTT3′ |
| Fizz | 5′TCCCTCCACTGTAACGAAGAC3′ | 5′CTCCCAAGATCCACAGGCAA3′ |
| STAT1 | 5′TCACAGTGGTTCGACCTTCAG3′ | 5′GCAAACGAGACATCATAGGCA3′ |
| STAT3 | 5′AGAACCTCCAGGACGACTTTG3′ | 5′TCACAATGCTTCTCCGCACTCT3′ |
| STAT6 | 5′GACCTGTCCATTCGCTCACT3′ | 5′GGATGACGTGTGCAATGGTG3′ |
| DP8 | 5′CCCAAGCGGAAAGAACTCCT3′ | 5′CCAACATGGGGGACGTAACA3′ |
| DP9 | 5′CTGGATCAACGTCCACGACA3′ | 5′AGGGGTTCCGTCCAGTCATA3′ |
| β-actin | 5′GGCTGTATTCCCCTCCATCG3′ | 5′CCAGTTGGTAACAATGCCATGT3′ |
| Rplp0 | 5′AGATTCGGGATATGCTGTTGGC3′ | 5′TCGGGTCCTAGACCAGTGTTC3′ |
Publisher’s Note: MDPI stays neutral with regard to jurisdictional claims in published maps and institutional affiliations. |
© 2022 by the authors. Licensee MDPI, Basel, Switzerland. This article is an open access article distributed under the terms and conditions of the Creative Commons Attribution (CC BY) license (https://creativecommons.org/licenses/by/4.0/).
Share and Cite
Vukelic, I.; Buljevic, S.; Baticic, L.; Barisic, K.; Franovic, B.; Detel, D. CD26 Deficiency Controls Macrophage Polarization Markers and Signal Transducers during Colitis Development and Resolution. Int. J. Mol. Sci. 2022, 23, 5506. https://doi.org/10.3390/ijms23105506
Vukelic I, Buljevic S, Baticic L, Barisic K, Franovic B, Detel D. CD26 Deficiency Controls Macrophage Polarization Markers and Signal Transducers during Colitis Development and Resolution. International Journal of Molecular Sciences. 2022; 23(10):5506. https://doi.org/10.3390/ijms23105506
Chicago/Turabian StyleVukelic, Iva, Suncica Buljevic, Lara Baticic, Karmela Barisic, Barbara Franovic, and Dijana Detel. 2022. "CD26 Deficiency Controls Macrophage Polarization Markers and Signal Transducers during Colitis Development and Resolution" International Journal of Molecular Sciences 23, no. 10: 5506. https://doi.org/10.3390/ijms23105506
APA StyleVukelic, I., Buljevic, S., Baticic, L., Barisic, K., Franovic, B., & Detel, D. (2022). CD26 Deficiency Controls Macrophage Polarization Markers and Signal Transducers during Colitis Development and Resolution. International Journal of Molecular Sciences, 23(10), 5506. https://doi.org/10.3390/ijms23105506


