
Characterization of Extracellular Vesicle Cargo in Sjögren’s Syndrome through a SWATH-MS Proteomics Approach

 ,
,  , and
, and 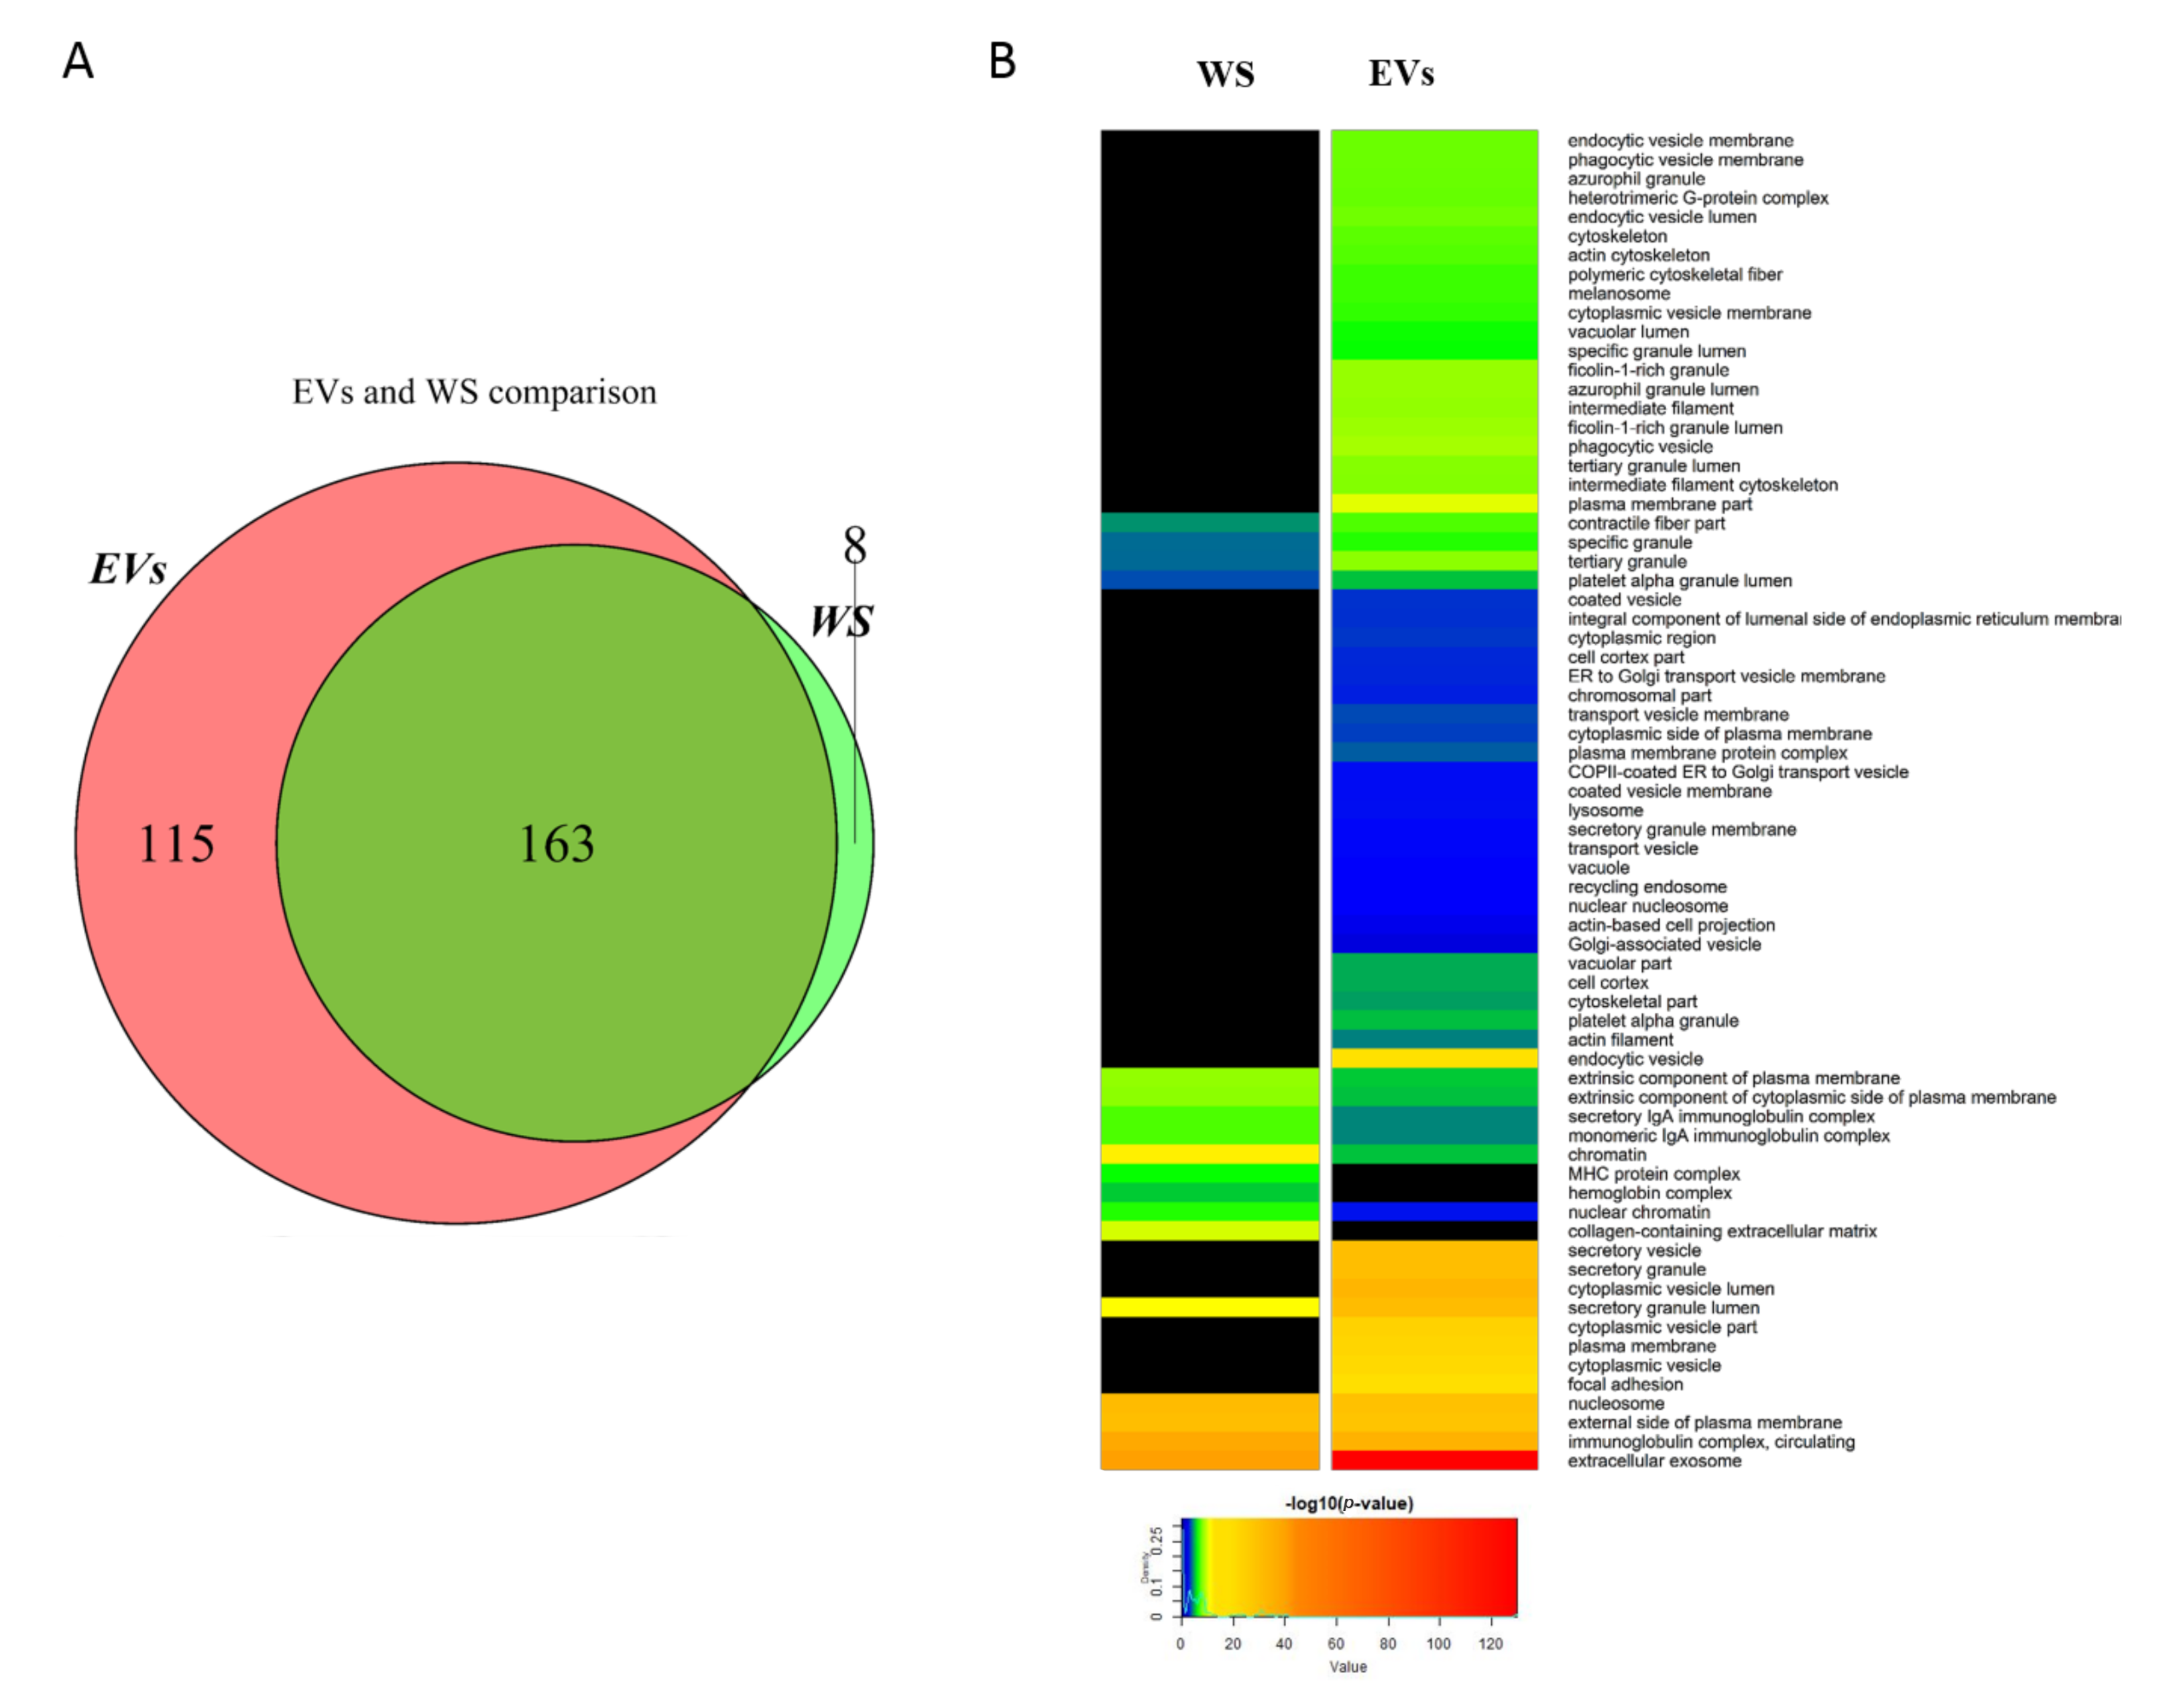
Abstract
1. Introduction
2. Results
2.1. Comparison between Whole Saliva and Salivary EVs Protein Profiles
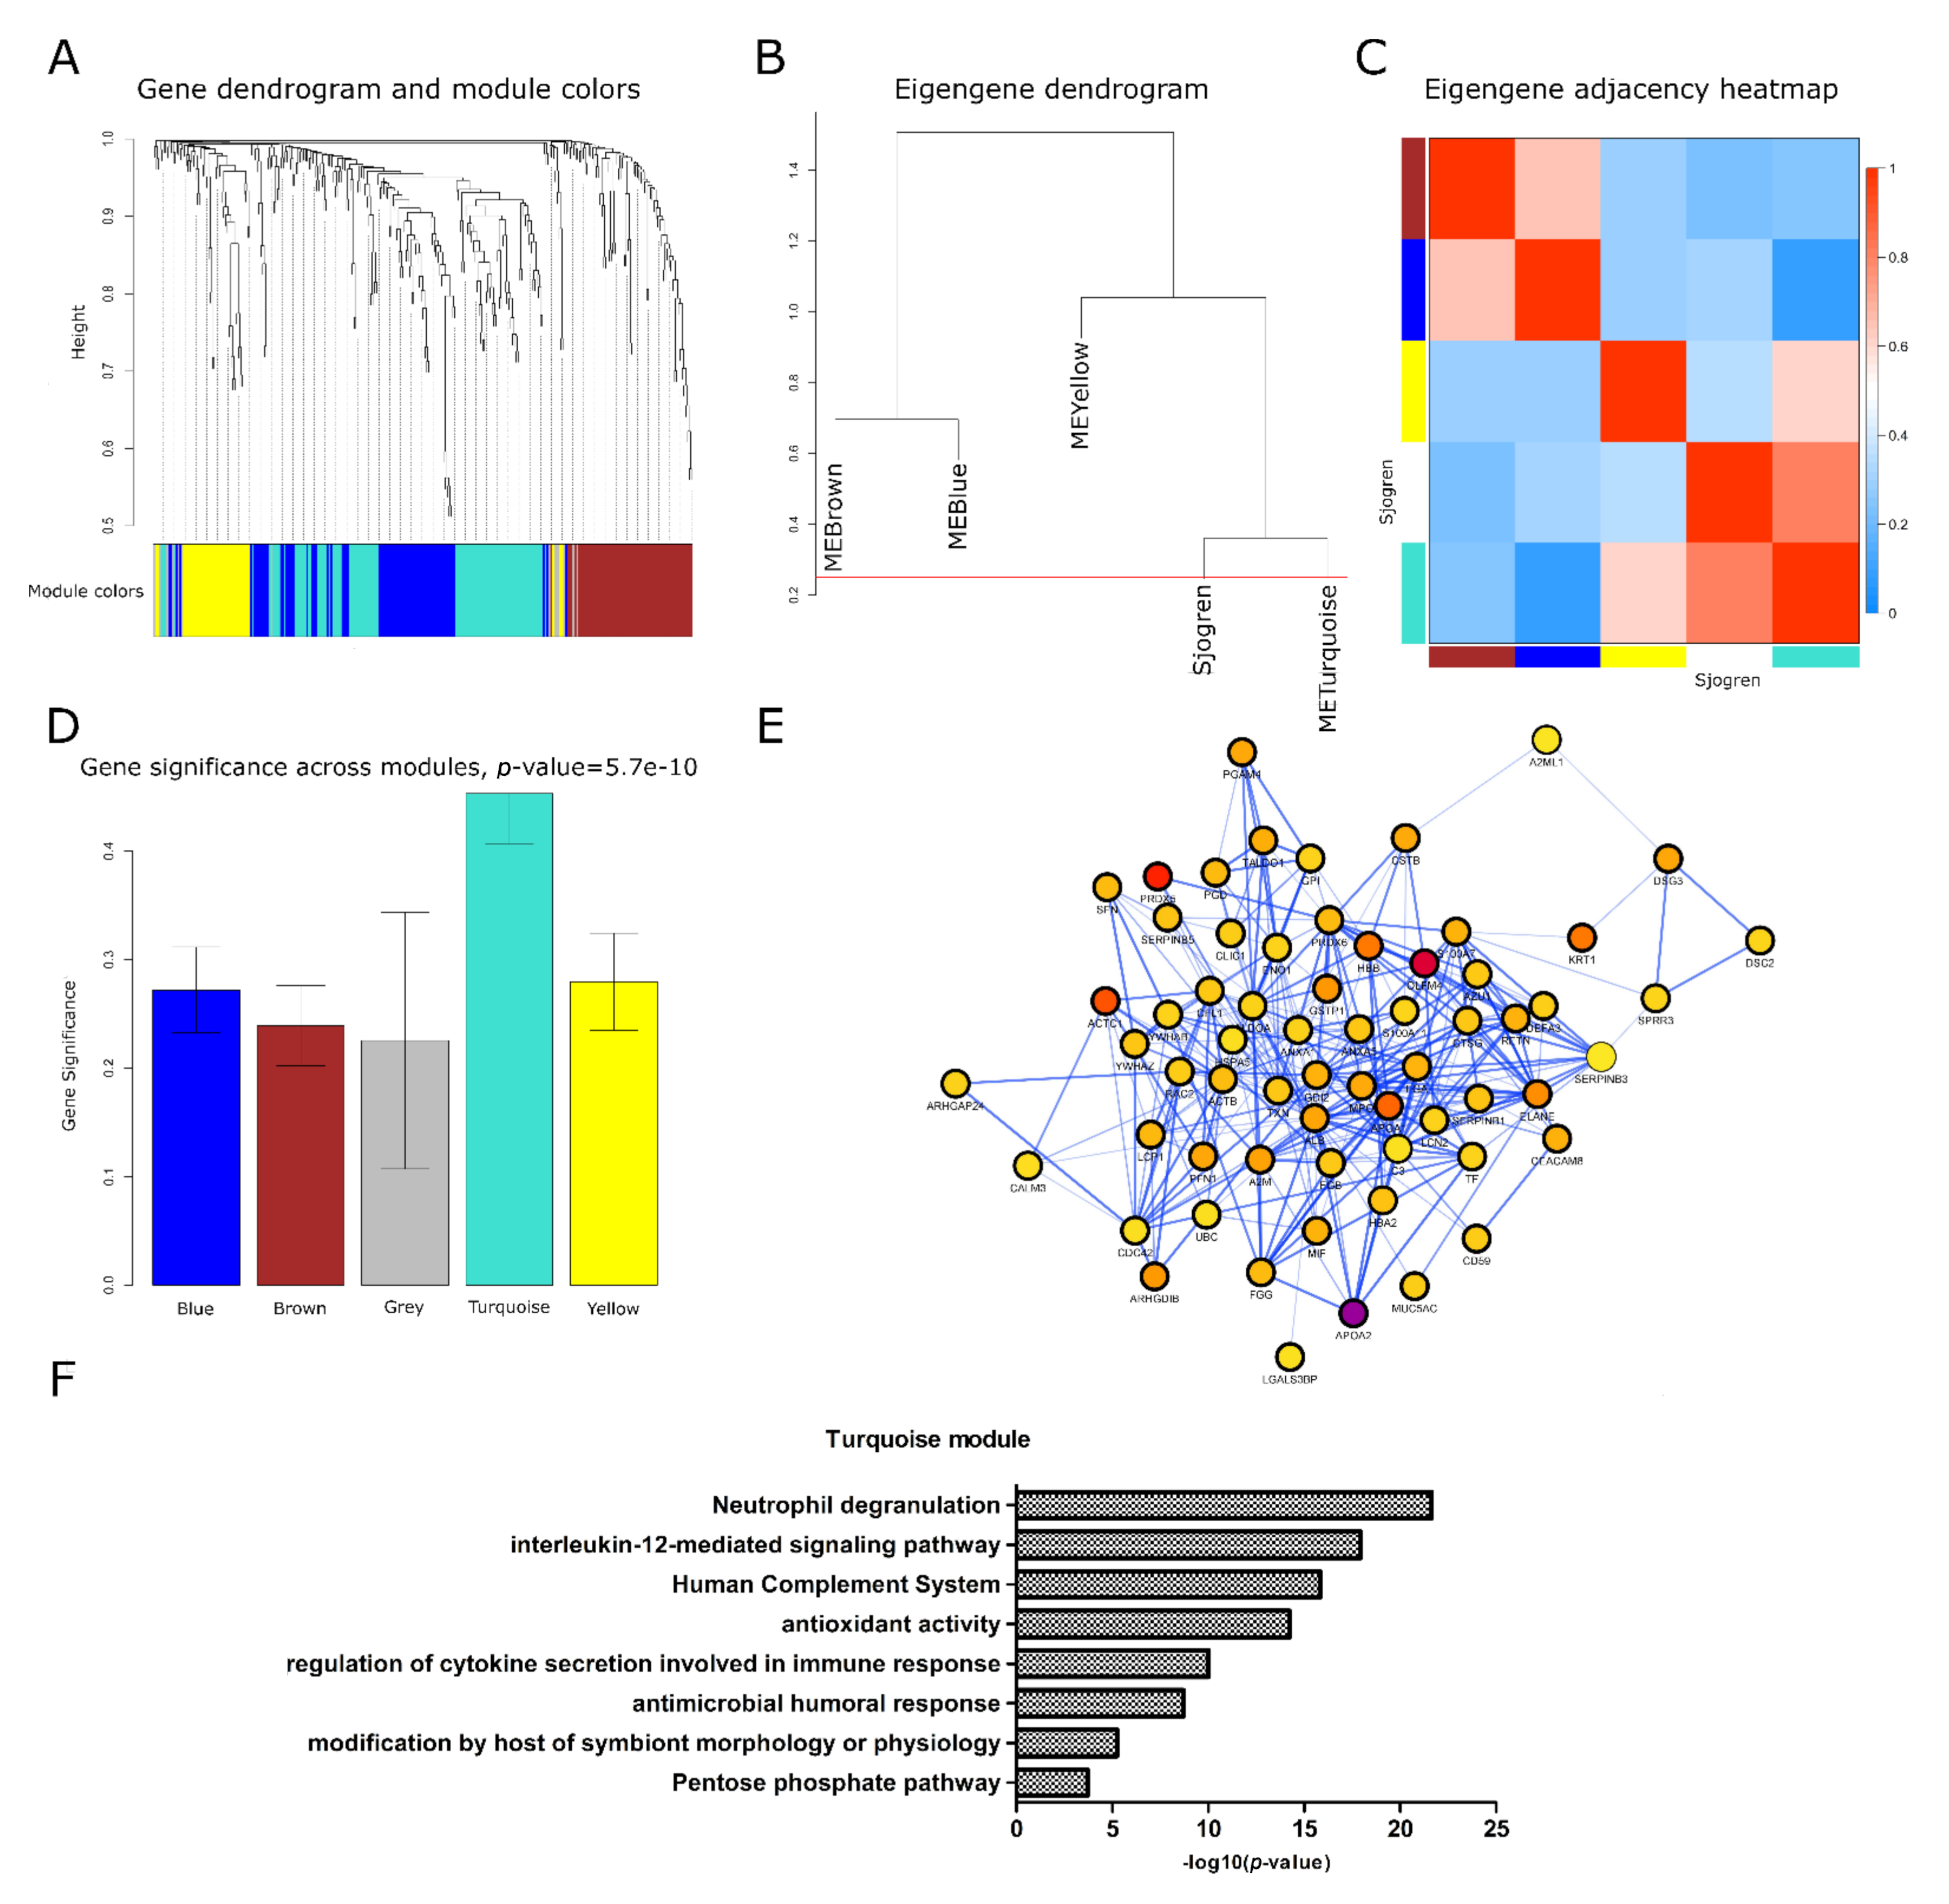
2.2. Identification of a Meta-Module of Co-Expressed Proteins Related to an Inflammatory Phenotype of Sjögren’s Syndrome
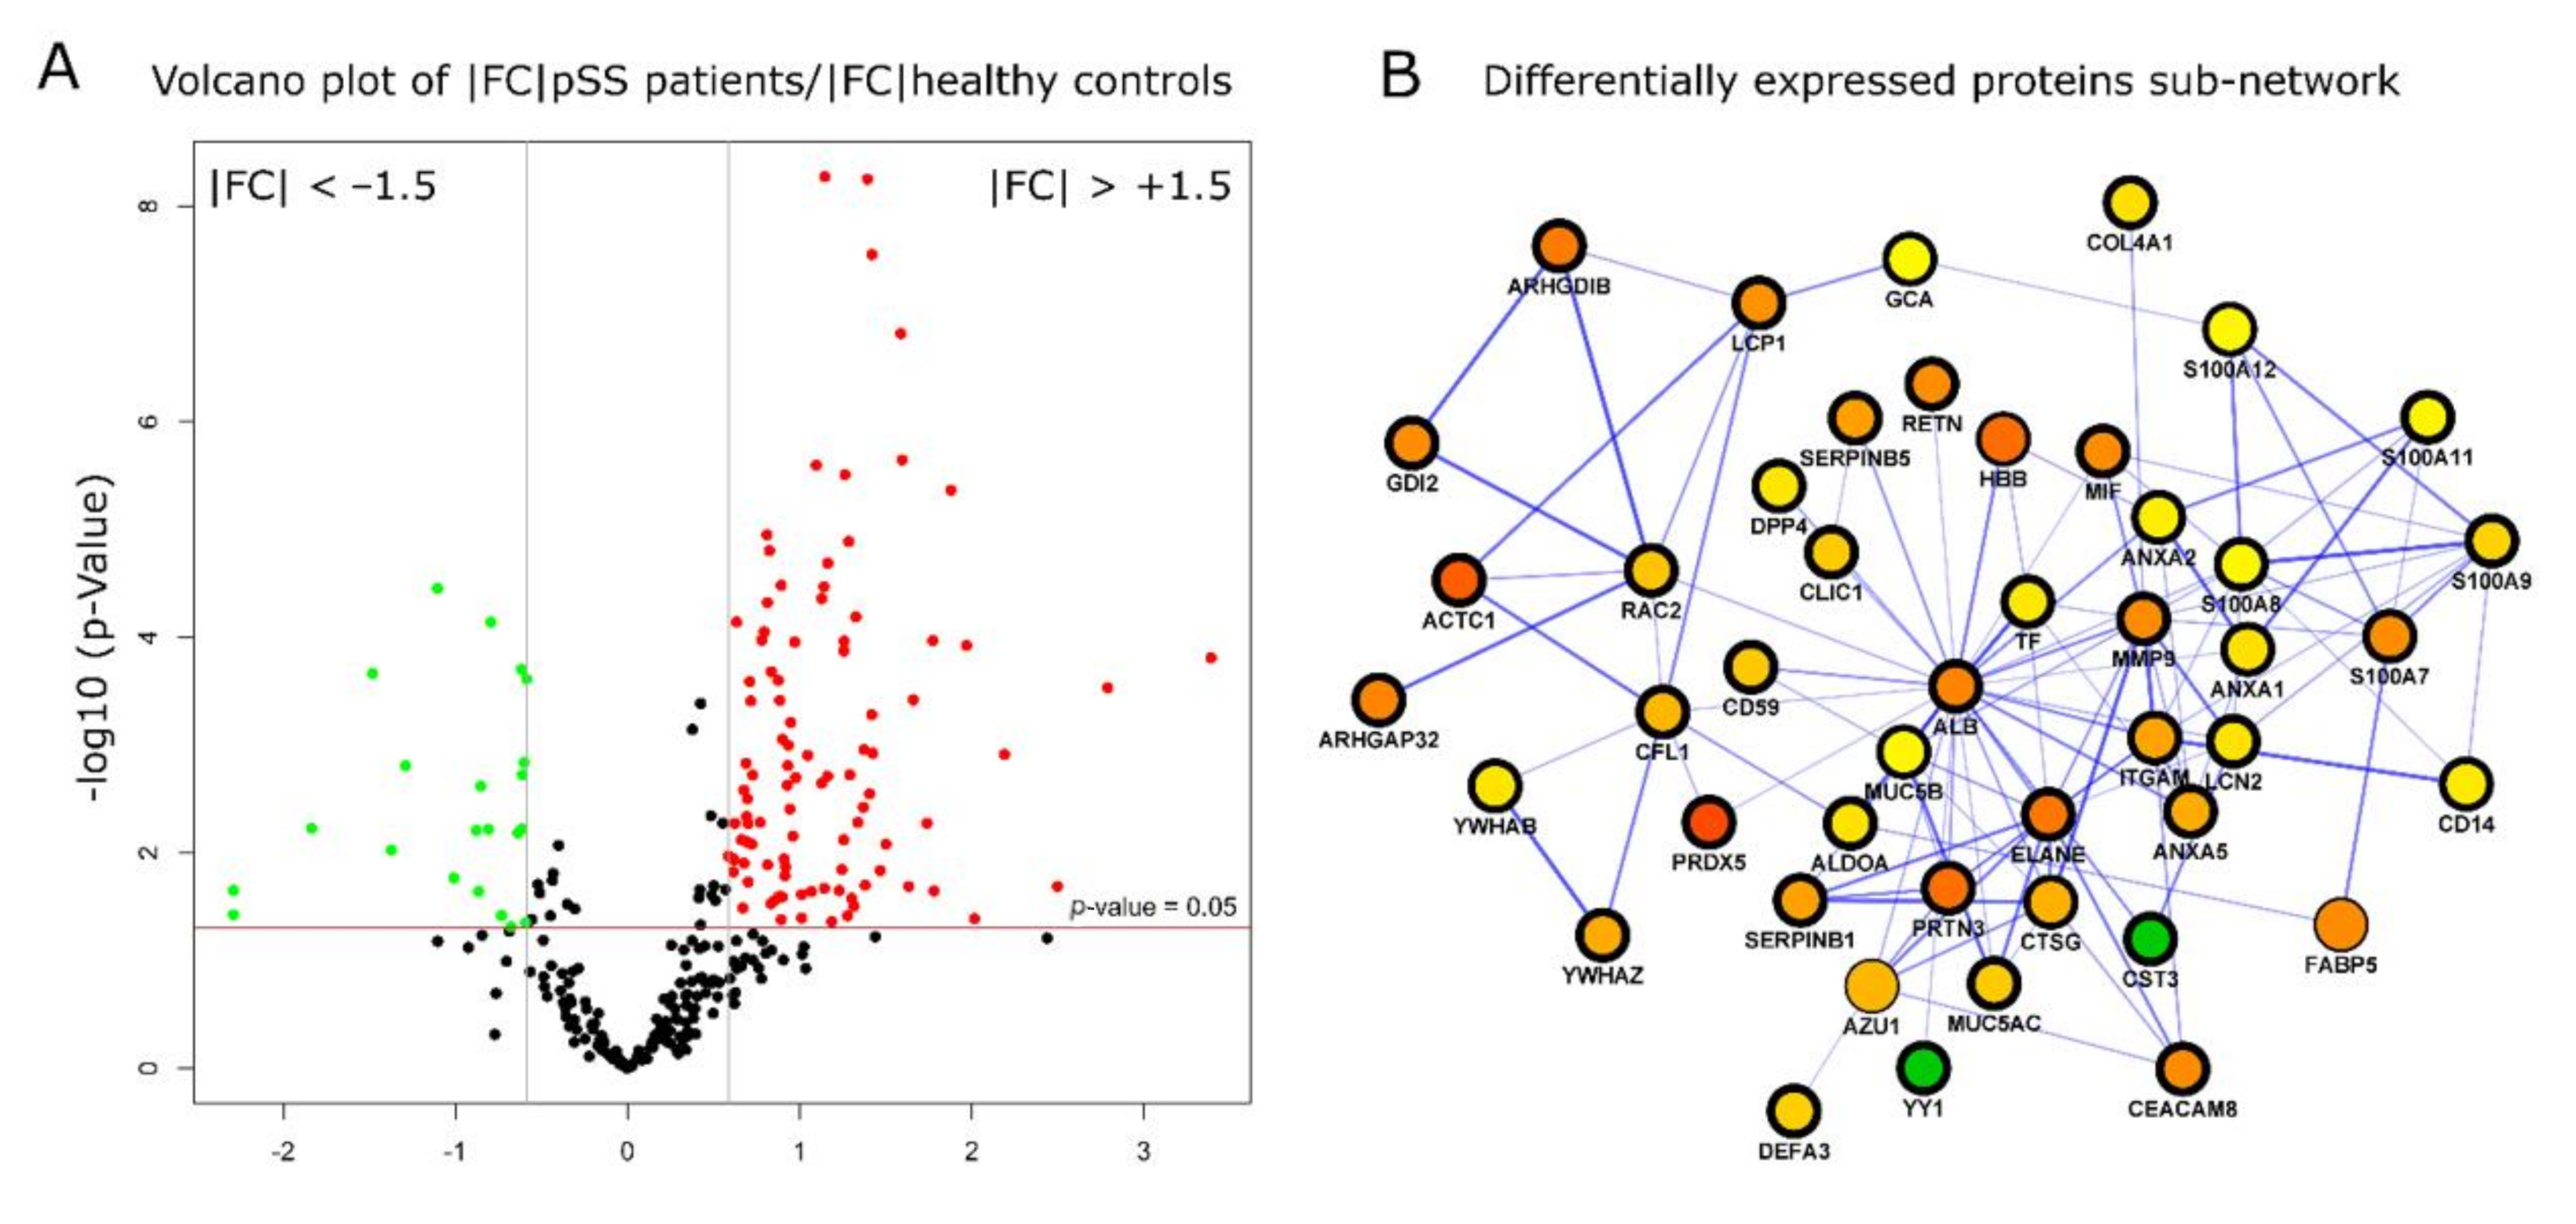
2.3. Differential Expression Protein Analysis Reveals the Relationship between Sjogren’s Syndrome and Innate Immune Response
2.4. Immunometric Assessment of Specific Inflammatory Proteins in Sjogren’s Syndrome
3. Discussion
4. Material and Methods
4.1. Patients
4.2. Saliva Collection
4.3. Salivary EVs Purification and Sample Preparation for Mass Spectrometry-Based Proteomics
4.4. Dynamic Light Scattering Analysis
4.5. MS Acquisitions: IDA and SWATH-MS
4.6. Spectral Library Generation and Statistical Analysis
4.7. Protein Co-Expression Network Analysis and Protein–Protein Interaction Network Construction
4.8. Functional Network Generation and Gene Ontology (GO) Terms Enrichment
4.9. Data Availability
4.10. Western Blot Analysis
Supplementary Materials
Author Contributions
Funding
Institutional Review Board Statement
Informed Consent Statement
Data Availability Statement
Conflicts of Interest
References
- Cafaro, G.; Croia, C.; Argyropoulou, O.D.; Leone, M.C.; Orlandi, M.; Finamore, F.; Cecchettini, A.; Ferro, F.; Baldini, C.; Bartoloni, E. One year in review 2019: Sjögren’s syndrome. Clin. Exp. Rheumatol. 2019, 37 (Suppl. 118), 3–15. [Google Scholar] [PubMed]
- Manfrè, V.; Cafaro, G.; Riccucci, I.; Zabotti, A.; Perricone, C.; Bootsma, H.; De Vita, S.; Bartoloni, E. One year in review 2020: Comorbidities, diagnosis and treatment of primary Sjögren’s syndrome. Clin. Exp. Rheumatol. 2020, 38 (Suppl. 126), 10–22. [Google Scholar] [PubMed]
- Brito-Zerón, P.; Acar-Denizli, N.; Ng, W.F.; Zeher, M.; Rasmussen, A.; Mandl, T.; Seror, R.; Li, X.; Baldini, C.; Gottenberg, J.E.; et al. How immunological profile drives clinical phenotype of primary Sjögren’s syndrome at diagnosis: Analysis of 10,500 patients (Sjögren Big Data Project). Clin. Exp. Rheumatol. 2018, 36 (Suppl. 112), 102–112. [Google Scholar] [PubMed]
- Goules, A.V.; Tzioufas, A.G. Lymphomagenesis in Sjögren’s syndrome: Predictive biomarkers towards precision medicine. Autoimmun. Rev. 2019, 18, 137–143. [Google Scholar] [CrossRef]
- Bombardieri, M.; Argyropoulou, O.D.; Ferro, F.; Coleby, R.; Pontarini, E.; Governato, G.; Lucchesi, D.; Fulvio, G.; Tzioufas, A.G.; Baldini, C. One year in review 2020: Pathogenesis of primary Sjögren’s syndrome. Clin. Exp. Rheumatol. 2020, 126, 3–9. [Google Scholar]
- Giacomelli, R.; Afeltra, A.; Bartoloni, E.; Berardicurti, O.; Bombardieri, M.; Bortoluzzi, A.; Carubbi, F.; Caso, F.; Cervera, R.; Ciccia, F.; et al. The growing role of preci-sion medicine for the treatment of autoimmune diseases; results of a systematic review of literature and Experts’ Consensus. Autoimmun. Rev. 2021, 20, 102738. [Google Scholar] [CrossRef]
- Onuora, S. First EULAR recommendations for Sjögren syndrome published. Nat. Rev. Rheumatol. 2019, 16, 2. [Google Scholar] [CrossRef]
- Baldini, C.; Cecchettini, A.; Gallo, A.; Bombardieri, S. Updates on Sjögren’s syndrome: From proteomics to protein bi-omarkers. Expert Rev. Proteomics 2017, 14, 491–498. [Google Scholar] [CrossRef]
- Cecchettini, A.; Finamore, F.; Ucciferri, N.; Donati, V.; Mattii, L.; Polizzi, E.; Ferro, F.; Sernissi, F.; Mosca, M.; Bombardieri, S.; et al. Phenotyping multiple subsets in Sjögren’s syndrome: A salivary proteomic SWATH-MS ap-proach towards precision medicine. Clin. Proteomics 2019, 16, 26. [Google Scholar]
- Aqrawi, L.A.; Galtung, H.K.; Vestad, B.; Øvstebø, R.; Thiede, B.; Rusthen, S.; Young, A.; Guerreiro, E.M.; Utheim, T.P.; Chen, X.; et al. Identification of potential saliva and tear biomarkers in primary Sjögren’s syn-drome, utilising the extraction of extracellular vesicles and proteomics analysis. Arthritis Res. Ther. 2017, 19, 14. [Google Scholar] [CrossRef]
- Ohlsson, M.; Hellmark, T.; Bengtsson, A.A.; Theander, E.; Turesson, C.; Klint, C.; Wingren, C.; Ekstrand, A.I. Proteomic data analysis for differential profiling of the autoimmune diseases SLE, RA, SS, and ANCA-associated vasculitis. J. Proteome Res. 2021, 20, 1252–1260. [Google Scholar] [CrossRef]
- Sembler-Møller, M.L.; Belstrøm, D.; Locht, H.; Pedersen, A.M.L. Proteomics of saliva, plasma, and salivary gland tissue in Sjögren’s syndrome and non-Sjögren patients identify novel biomarker candidates. J. Proteom. 2020, 225, 103877. [Google Scholar] [CrossRef]
- Blokland, S.L.M.; Hillen, M.R.; Van Vliet-Moret, F.M.; Bikker, A.; De Jager, W.; Pandit, A.; Kruize, A.; Radstake, T.R.D.J.; Roon, J.A.G.V. Salivary gland secretome: A novel tool towards molecular stratification of patients with primary Sjögren’s syndrome and non-autoimmune sicca. RMD Open 2019, 5, e000772. [Google Scholar] [CrossRef]
- Aqrawi, L.A.; Galtung, H.K.; Guerreiro, E.M.; Øvstebø, R.; Thiede, B.; Utheim, T.P.; Chen, X.; Utheim, Ø.; Palm, Ø.; Skarstein, K.; et al. Proteomic and histopathological characterisation of sicca subjects and primary Sjögren’s syn-drome patients reveals promising tear, saliva and extracellular vesicle disease biomarkers. Arthritis Res. Ther. 2019, 21, 181. [Google Scholar] [CrossRef]
- Delaleu, N.; Mydel, P.; Brun, J.G.; Jonsson, M.V.; Alimonti, A.; Jonsson, R. Sjögren’s syndrome patients with ectopic germinal centers present with a distinct salivary proteome. Rheumatology (Oxford) 2016, 55, 1127–1137. [Google Scholar] [CrossRef]
- Gallo, A.; Tandon, M.; Alevizos, I.; Illei, G.G. The majority of MicroRNAs detectable in serum and saliva is concentrated in exosomes. PLoS ONE 2012, 7, e30679. [Google Scholar] [CrossRef]
- Cecchettini, A.; Finamore, F.; Puxeddu, I.; Ferro, F.; Baldini, C. Salivary extracellular vesicles versus whole saliva: New perspectives for the identification of proteomic biomarkers in Sjögren’s syndrome. Clin. Exp. Rheumatol. 2019, 118, 240–248. [Google Scholar]
- Shi, B.; Qi, J.; Yao, G.; Feng, R.; Zhang, Z.; Wang, D.; Chen, C.; Tang, X.; Lu, L.; Chen, W.; et al. Mesenchymal stem cell transplantation ameliorates Sjögren’s syndrome via suppressing IL-12 production by dendritic cells. Stem Cell Res. Ther. 2018, 9, 1–10. [Google Scholar] [CrossRef]
- Liaskou, E.; Patel, S.R.; Webb, G.; Dimakou, D.B.; Akiror, S.; Krishna, M.; Mells, G.; Jones, D.E.; Bowman, S.J.; Barone, F.; et al. Increased sensitivity of Treg cells from patients with PBC to low dose IL-12 drives their differentiation into IFN-γ secreting cells. J. Autoimmun. 2018, 94, 143–155. [Google Scholar] [CrossRef]
- Han, Y.; Jia, L.; Zheng, Y.; Li, W. Salivary exosomes: Emerging roles in systemic disease. Int. J. Biol. Sci. 2018, 14, 633–643. [Google Scholar] [CrossRef]
- Choi, Y.J.; Heo, S.H.; Lee, J.M.; Cho, J.Y. Identification of azurocidin as a potential periodontitis biomarker by a proteomic analysis of gingival crevicular fluid. Proteome Sci. 2011, 9, 42. [Google Scholar] [PubMed]
- Tseng, M.Y.; Liu, S.Y.; Chen, H.R.; Wu, Y.J.; Chiu, C.C.; Chan, P.T.; Chiang, W.F.; Liu, Y.C.; Lu, C.Y.; Jou, Y.S.; et al. Serine protease inhibitor (SERPIN) B1 promotes oral cancer cell motility and is over-expressed in invasive oral squamous cell carcinoma. Oral Oncol. 2009, 45, 771–776. [Google Scholar] [PubMed]
- Behm, C.; Blufstein, A.; Gahn, J.; Noroozkhan, N.; Moritz, A.; Rausch-Fan, X.; Andrukhov, O. Soluble CD14 enhances the response of periodontal ligament stem cells to toll-like receptor 2 agonists. Mediat. Inflamm. 2019, 2019, 8127301–8127313. [Google Scholar] [CrossRef]
- Chan, H.H.; Rahim, Z.H.; Jessie, K.; Hashim, O.H.; Taiyeb-Ali, T.B. Salivary proteins associated with periodontitis in patients with Type 2 diabetes mellitus. Int. J. Mol. Sci. 2012, 13, 4642–4654. [Google Scholar]
- Ortiz-García, Y.M.; García-Iglesias, T.; Morales-Velazquez, G.; Lazalde-Ramos, B.P.; Zúñiga-González, G.M.; Ortiz-García, R.G.; Zamora-Perez, A.L. Macrophage migration inhibitory factor levels in gingival crevicular fluid, saliva, and serum of chronic periodontitis patients. BioMed Res. Int. 2019, 2019, 1–7. [Google Scholar] [CrossRef]
- Kozlyuk, N.; Monteith, A.J.; Garcia, V.; Damo, S.M.; Skaar, E.P.; Chazin, W.J. S100 proteins in the innate immune response to pathogens. Methods Mol. Biol. 2019, 1929, 275–290. [Google Scholar]
- Kiripolsky, J.; McCabe, L.G.; Kramer, J.M. Innate immunity in Sjögren’s syndrome. Clin. Immunol. 2017, 182, 4–13. [Google Scholar]
- Liu, Y.; Yin, H.; Zhao, M.; Lu, Q. TLR2 and TLR4 in autoimmune diseases: A comprehensive review. Clin. Rev. Allergy Immunol. 2014, 47, 136–147. [Google Scholar] [CrossRef]
- Nordal, H.H.; Brun, J.G.; Halse, A.K.; Madland, T.M.; Fagerhol, M.K.; Jonsson, R. Calprotectin (S100A8/A9), S100A12, and EDTA-resistant S100A12 complexes (ERAC) in primary Sjögren’s syndrome. Scand. J. Rheumatol. 2014, 43, 76–78. [Google Scholar]
- Zhou, L.; Wei, R.; Zhao, P.; Koh, S.K.; Beuerman, R.W.; Ding, C. Proteomic analysis revealed the altered tear protein profile in a rabbit model of Sjögren’s syndrome-associated dry eye. Proteomics 2013, 13, 2469–2481. [Google Scholar] [CrossRef]
- Żelechowska, P.; Brzezińska-Błaszczyk, E.; Kusowska, A.; Kozłowska, E. The role of adipokines in the modulation of lymphoid lineage cell development and activity: An overview. Obes. Rev. 2020, 21, e13055. [Google Scholar] [CrossRef]
- Boström, E.A.; d’Elia, H.F.; Dahlgren, U.; Simark-Mattsson, C.; Hasséus, B.; Carlsten, H.; Tarkowski, A.; Bokarewa, M. Salivary resistin reflects local inflammation in Sjögren’s syndrome. J. Rheumatol. 2008, 35, 2005–2011. [Google Scholar]
- Cui, L.; Elzakra, N.; Xu, S.; Xiao, G.G.; Yang, Y.; Hu, S. Investigation of three potential autoantibodies in Sjogren’s syndrome and associated MALT lymphoma. Oncotarget 2017, 8, 30039–30049. [Google Scholar] [CrossRef]
- Shiboski, C.H.; Shiboski, S.C.; Seror, R.; Criswell, L.A.; Labetoulle, M.; Lietman, T.M.; Rasmussen, A.; Scofield, H.; Vitali, C.; Bowman, S.J.; et al. 2016 American college of rheumatology/European league against rheumatism classification criteria for primary Sjögren’s syndrome: A consensus and data-driven methodology involving three international patient cohorts. Arthritis Rheumatol. 2017, 69, 35–45. [Google Scholar] [CrossRef] [PubMed]
- Giusti, L.; Baldini, C.; Bazzichi, L.; Ciregia, F.; Tonazzini, I.; Mascia, G.; Giannaccini, G.; Bombardieri, S.; Lucacchini, A. Pro-teome analysis of whole saliva: A new tool for rheumatic diseases—The example of Sjögren’s syndrome. Proteomics 2007, 7, 1634–1643. [Google Scholar] [CrossRef]
- Comelli, L.; Rocchiccioli, S.; Smirni, S.; Salvetti, A.; Signore, G.; Citti, L.; Trivella, M.G.; Cecchettini, A. Characterization of secreted vesicles from vascular smooth muscle cells. Mol. BioSyst. 2014, 10, 1146. [Google Scholar] [CrossRef]
- Chambers, M.C.; MacLean, B.; Burke, R.D.; Amodei, D.; Ruderman, D.L.; Neumann, S.; Gatto, L.; Fischer, B.; Pratt, B.; Egertson, J.D.; et al. A cross-platform toolkit for mass spectrometry and proteomics. Nat. Biotechnol. 2012, 30, 918–920. [Google Scholar] [CrossRef]
- Deutsch, E.W.; Mendoza, L.; Shteynberg, D.; Slagel, J.; Sun, Z.; Moritz, R.L. Trans-proteomic pipeline, a standardized data processing pipeline for large-scale reproducible proteomics informatics. Proteom. Clin. Appl. 2015, 9, 745–754. [Google Scholar] [CrossRef]
- Keller, A.; Eng, J.; Zhang, N.; Li, X.; Aebersold, R. A uniform proteomics MS/MS analysis platform utilizing open XML file formats. Mol. Syst. Biol. 2005, 1, 2005.0017. [Google Scholar] [CrossRef] [PubMed]
- Zhang, B.; Horvath, S. A general framework for weighted gene co-expression network analysis. Stat. Appl. Genet. Mol. Biol. 2005, 4, Article17. [Google Scholar] [CrossRef] [PubMed]
- Langfelder, P.; Zhang, B.; Horvath, S. Defining clusters from a hierarchical cluster tree: The dynamic tree cut package for R. Bioinformatics 2007, 24, 719–720. [Google Scholar] [CrossRef]
- Bindea, G.; Mlecnik, B.; Hackl, H.; Charoentong, P.; Tosolini, M.; Kirilovsky, A.; Fridman, W.-H.; Pagès, F.; Trajanoski, Z.; Galon, J.; et al. ClueGO: A Cytoscape plug-in to decipher functionally grouped gene ontology and pathway annotation networks. Bioinformatics 2009, 25, 1091–1093. [Google Scholar] [CrossRef]
- Vizcaíno, J.A.; Deutsch, E.W.; Wang, R.; Csordas, A.; Reisinger, F.; Ríos, D.; Dianes, J.A.; Sun, Z.; Farrah, T.; Bandeira, N.; et al. Proteome Xchange provides globally coordinated proteomics data submission and dissemination. Nat. Biotechnol. 2014, 32, 223–226. [Google Scholar] [CrossRef]


Publisher’s Note: MDPI stays neutral with regard to jurisdictional claims in published maps and institutional affiliations. |
© 2021 by the authors. Licensee MDPI, Basel, Switzerland. This article is an open access article distributed under the terms and conditions of the Creative Commons Attribution (CC BY) license (https://creativecommons.org/licenses/by/4.0/).
Share and Cite
Finamore, F.; Cecchettini, A.; Ceccherini, E.; Signore, G.; Ferro, F.; Rocchiccioli, S.; Baldini, C. Characterization of Extracellular Vesicle Cargo in Sjögren’s Syndrome through a SWATH-MS Proteomics Approach. Int. J. Mol. Sci. 2021, 22, 4864. https://doi.org/10.3390/ijms22094864
Finamore F, Cecchettini A, Ceccherini E, Signore G, Ferro F, Rocchiccioli S, Baldini C. Characterization of Extracellular Vesicle Cargo in Sjögren’s Syndrome through a SWATH-MS Proteomics Approach. International Journal of Molecular Sciences. 2021; 22(9):4864. https://doi.org/10.3390/ijms22094864
Chicago/Turabian StyleFinamore, Francesco, Antonella Cecchettini, Elisa Ceccherini, Giovanni Signore, Francesco Ferro, Silvia Rocchiccioli, and Chiara Baldini. 2021. "Characterization of Extracellular Vesicle Cargo in Sjögren’s Syndrome through a SWATH-MS Proteomics Approach" International Journal of Molecular Sciences 22, no. 9: 4864. https://doi.org/10.3390/ijms22094864
APA StyleFinamore, F., Cecchettini, A., Ceccherini, E., Signore, G., Ferro, F., Rocchiccioli, S., & Baldini, C. (2021). Characterization of Extracellular Vesicle Cargo in Sjögren’s Syndrome through a SWATH-MS Proteomics Approach. International Journal of Molecular Sciences, 22(9), 4864. https://doi.org/10.3390/ijms22094864