Case Report

Strongyloides stercoralis Infestation in a Child: How a Nematode Can Affect Gut Microbiota

1
Department of Diagnostic and Laboratory Medicine, Unit of Parasitology, Bambino Gesù Children’s Hospital, IRCCS, 00165 Rome, Italy
2
Department of Diagnostic and Laboratory Medicine, Unit of Parasitology and Multimodal Laboratory Medicine Research Area, Unit of Human Microbiome, Bambino Gesù Children’s Hospital, IRCCS, 00165 Rome, Italy
3
Immunology and Infectious Diseases Unit, University Department of Pediatrics, Bambino Gesù Children’s Hospital, IRCCS, 00165 Rome, Italy
*
Author to whom correspondence should be addressed.
Int. J. Mol. Sci. 2021, 22(4), 2131; https://doi.org/10.3390/ijms22042131
Submission received: 5 February 2021 / Revised: 17 February 2021 / Accepted: 19 February 2021 / Published: 21 February 2021
(This article belongs to the Special Issue Gut Microbioma in Childhood Health and Disease)

Abstract

:
Background: Strongyloidiasis is a neglected tropical disease caused by the intestinal nematode Strongyloides stercoralis and characterized by gastrointestinal and pulmonary involvement. We report a pediatric case of strongyloidiasis to underline the response of the host microbiota to the perturbation induced by the nematode. Methods: We performed a 16S rRNA-metagenomic analysis of the gut microbiota of a 7-year-old female during and after S. stercolaris infection, investigating three time-point of stool samples’ ecology: T0- during parasite infection, T1- a month after parasite infection, and T2- two months after parasite infection. Targeted-metagenomics were used to investigate ecology and to predict the functional pathways of the gut microbiota. Results: an increase in the alpha-diversity indices in T0-T1 samples was observed compared to T2 and healthy controls (CTRLs). Beta-diversity analysis showed a shift in the relative abundance of specific gut bacterial species from T0 to T2 samples. Moreover, the functional prediction of the targeted-metagenomics profiles suggested an enrichment of microbial glycan and carbohydrate metabolisms in the T0 sample compared with CTRLs. Conclusions: The herein report reinforces the literature suggestion of a putative direct or immune-mediated ability of S. stercolaris to promote the increase in bacterial diversity.

1. Introduction

Strongyloidiasis is considered a neglected tropical disease caused by the intestinal nematode Strongyloides stercoralis and characterized by gastrointestinal (GI) and/or pulmonary involvement, with an estimated global prevalence of about 350 million cases [1]. It is endemic in the tropical and subtropical regions of the world where human wastes contaminate the environment, but it is widespread in Europe and in hypo-endemic areas in Italy [2,3]. Once the larvae penetrate the skin, they reach the bloodstream and invade the lungs’ alveoli and this pulmonary migration may cause pneumonia, but usually in an asymptomatic way. The larvae are then expectorated, traveling through the trachea and then swallowed. The larvae mature and become adult parthenogenetic females, which release eggs into the GI tract. The eggs hatch while still in the GI tract and give rise to rhabditoid larvae, which are excreted. However, some of these larvae become infectious (filarioid) and penetrate the anal mucosa and perianal skin, re-entering the circulatory system and restarting the cycle. Because of this auto-infection cycle, a person can be infected with S. stercoralis for decades [4].
In immunocompetent subjects, the infection is usually asymptomatic, with low minimal and intermittent larval excretion and may bring a combination of uncertain clinical symptoms such as severe epigastric pain, chronic diarrhea, constipation, indigestion, anorexia, anal pruritus, abdominal distension, weight loss, nausea, vomiting, peripheral eosinophilia, asthenia, adynamia, fever, hemorrhage, anemia, and, rarely, obstruction of the small intestine [5,6].
However, in some predisposing conditions, such as initiation of immunosuppressive therapy and kidney transplant recipients, the disease may change to any form of hyper-infection or disseminated types of strongyloidosis [7].
Herein, we report a pediatric case of S. stercoralis hyper-infection, for which larval forms were characterized in stool samples of an asymptomatic patient with a nephrotic syndrome. The parasitological diagnosis was based on light microscopy, molecular PCR-based investigation, and serology. Coupled with parasitological exams, a stool time-point sampling underwent to assess microbiota modulation in terms of ecology and global composition, comparing the patient’s gut microbiota during the infection, post-infection, and using reference, age-matched healthy subjects as controls (CTRLs). This study was conducted to describe the response of the host microbiota to the perturbations induced by the nematode pathogen.

2. Results

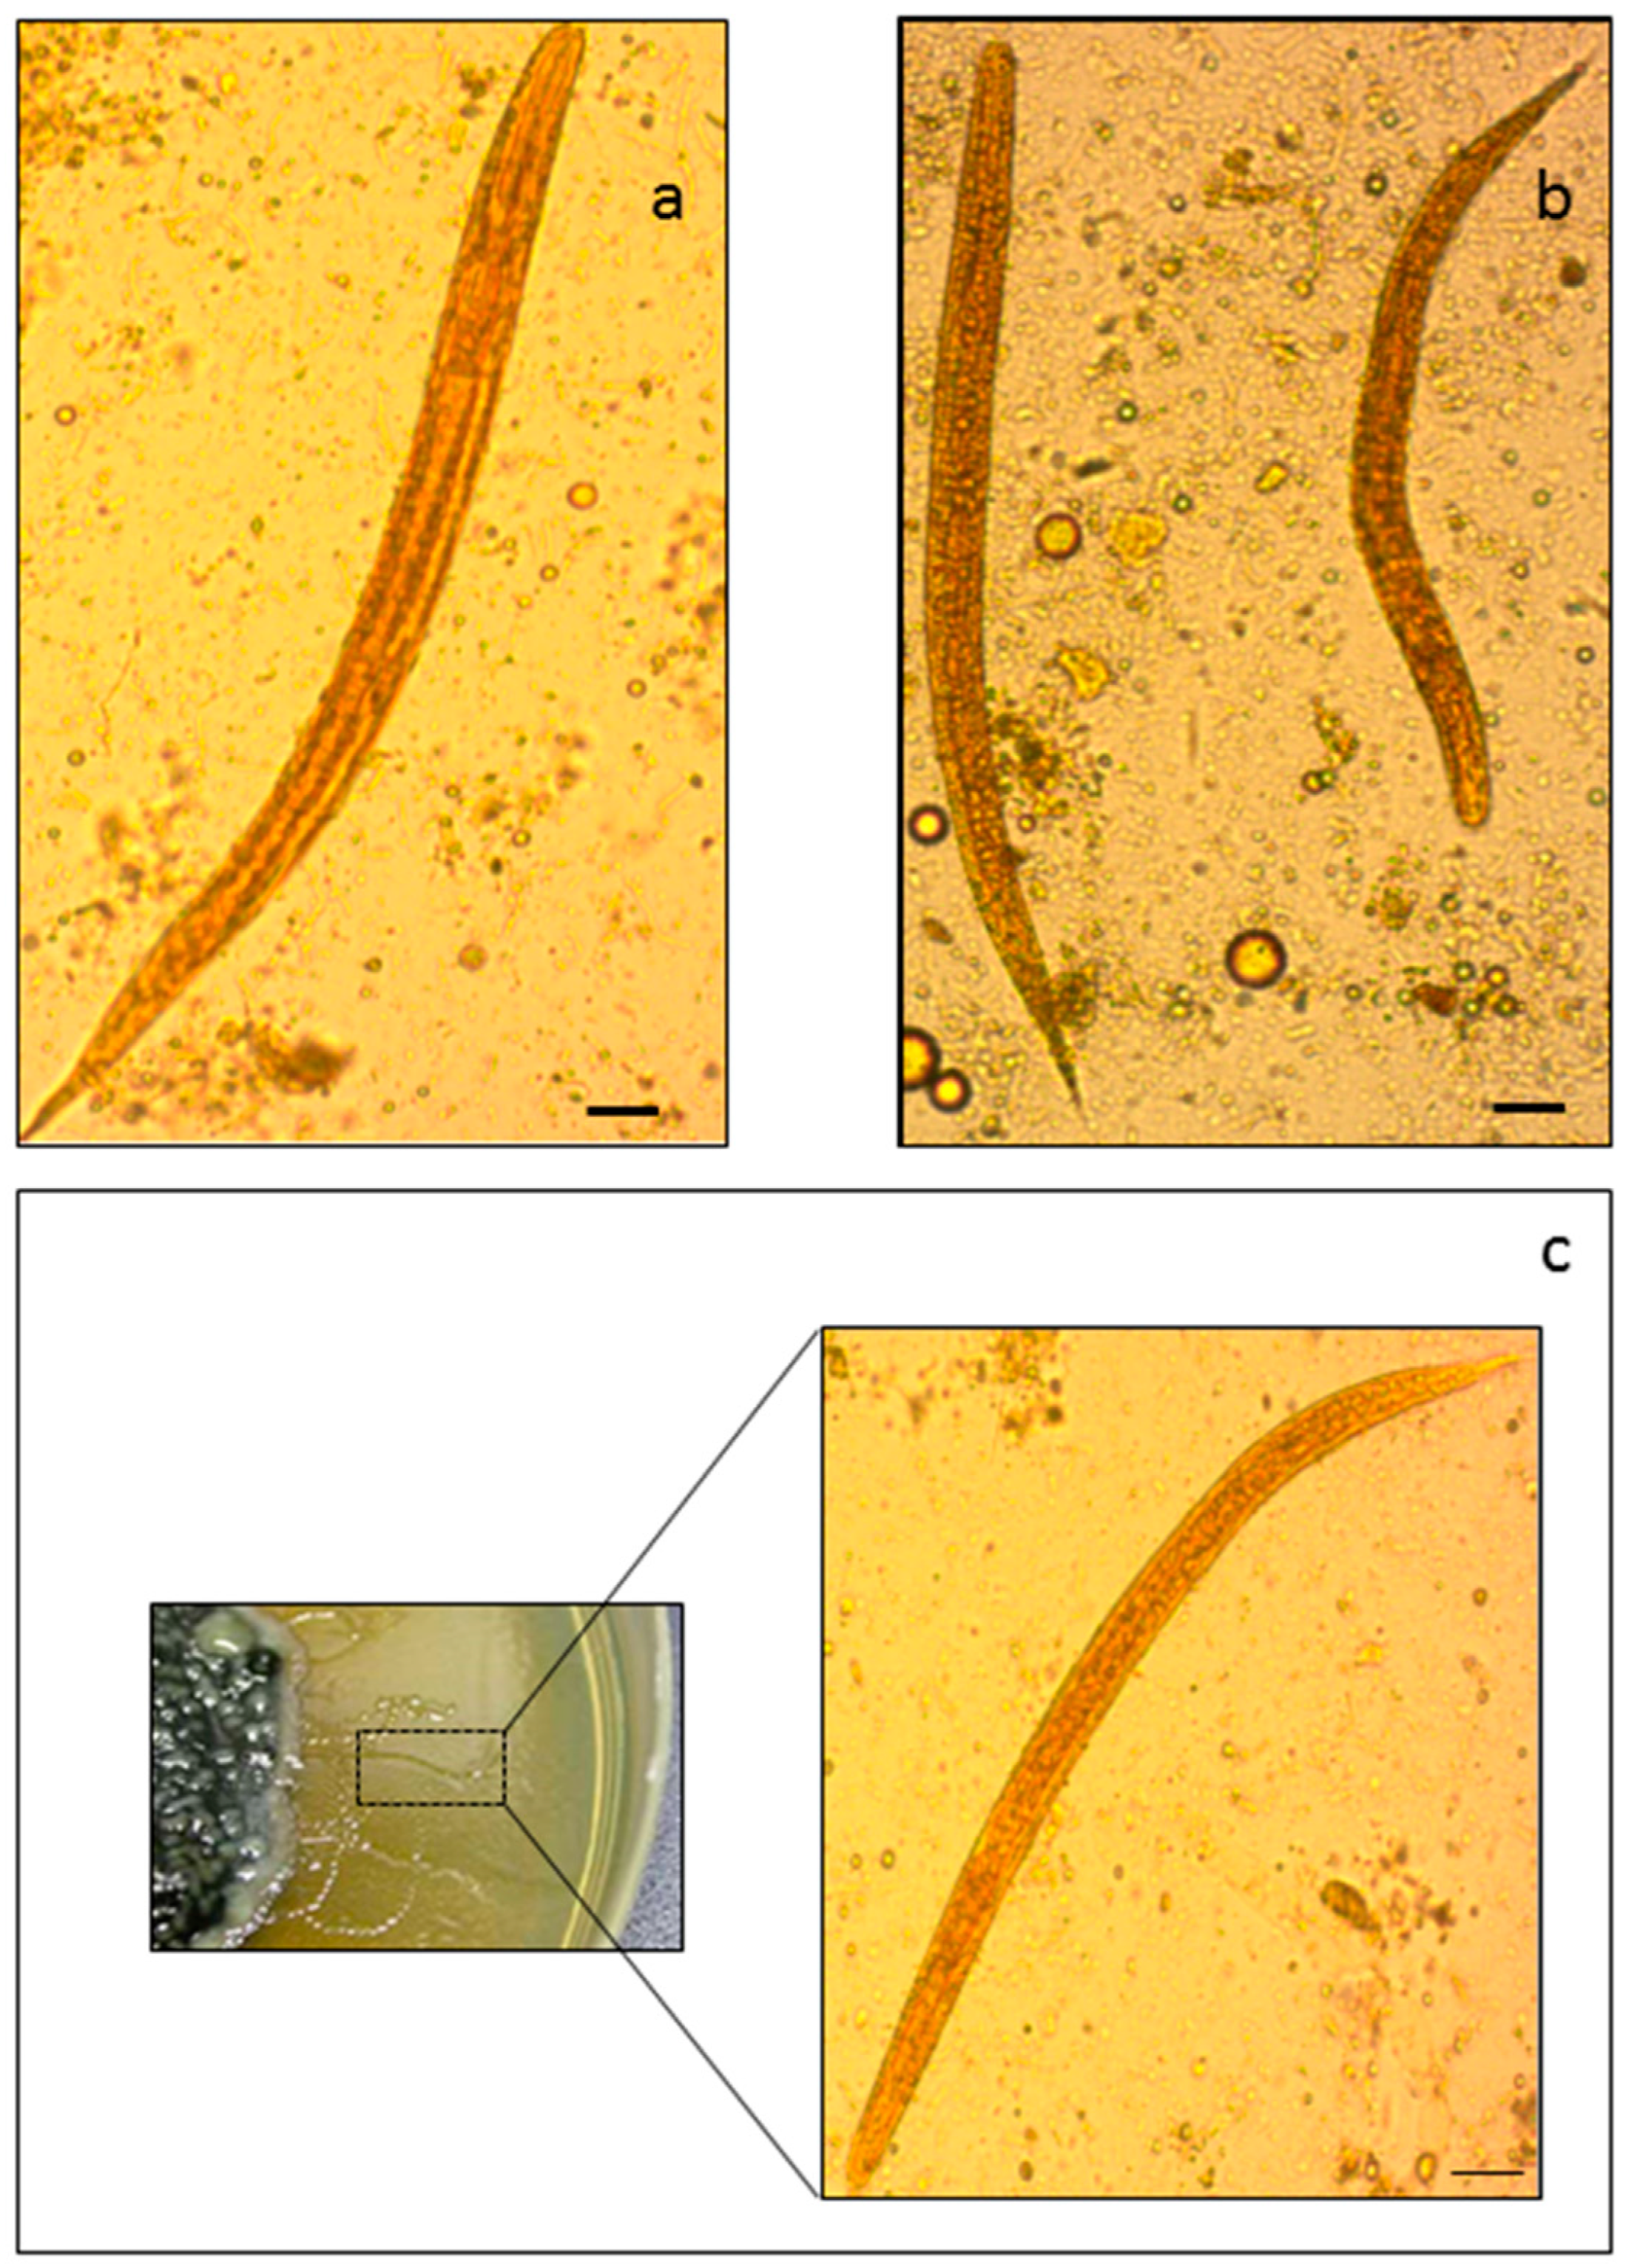
2.1. Morphology-Based and PCR-Based Methods for the Identification of S. stercoralis

By examining stools under light microscopy, a large number of rhabditiform larvae of S. stercoralis were identified. The identification of larvae (L3) of S. stercoralis was based on nematode morphological features: (i) long esophagus, with a visible bowel junction, (ii) pointed tail, and (iii) mouthparts. Rhabditiform larvae were 250–280 mm in length, with a relatively short, but pointed tail, and a buccal cavity (Figure 1, panels A and B).
The agar plate culture technique was conducted on positive stool specimens and, after seven days, the sealed plates were examined under the 20× microscope objective and motile larvae actively moving were observed under a 40× objective (Figure 1, panel C).
Moreover, DNA amplification of S. stercoralis was successfully obtained in this positive stool sample using species-specific primers, thus, confirming the microscopic examination (data not shown).
According to the microscopic and molecular PCR-based investigation, patient serology also resulted in a positive. Instead, microscopic examination of the multiple bronchial washings and CSF samples appeared negative.

2.2. Gut Microbiota Profiling Associated with S. stercoralis Infection

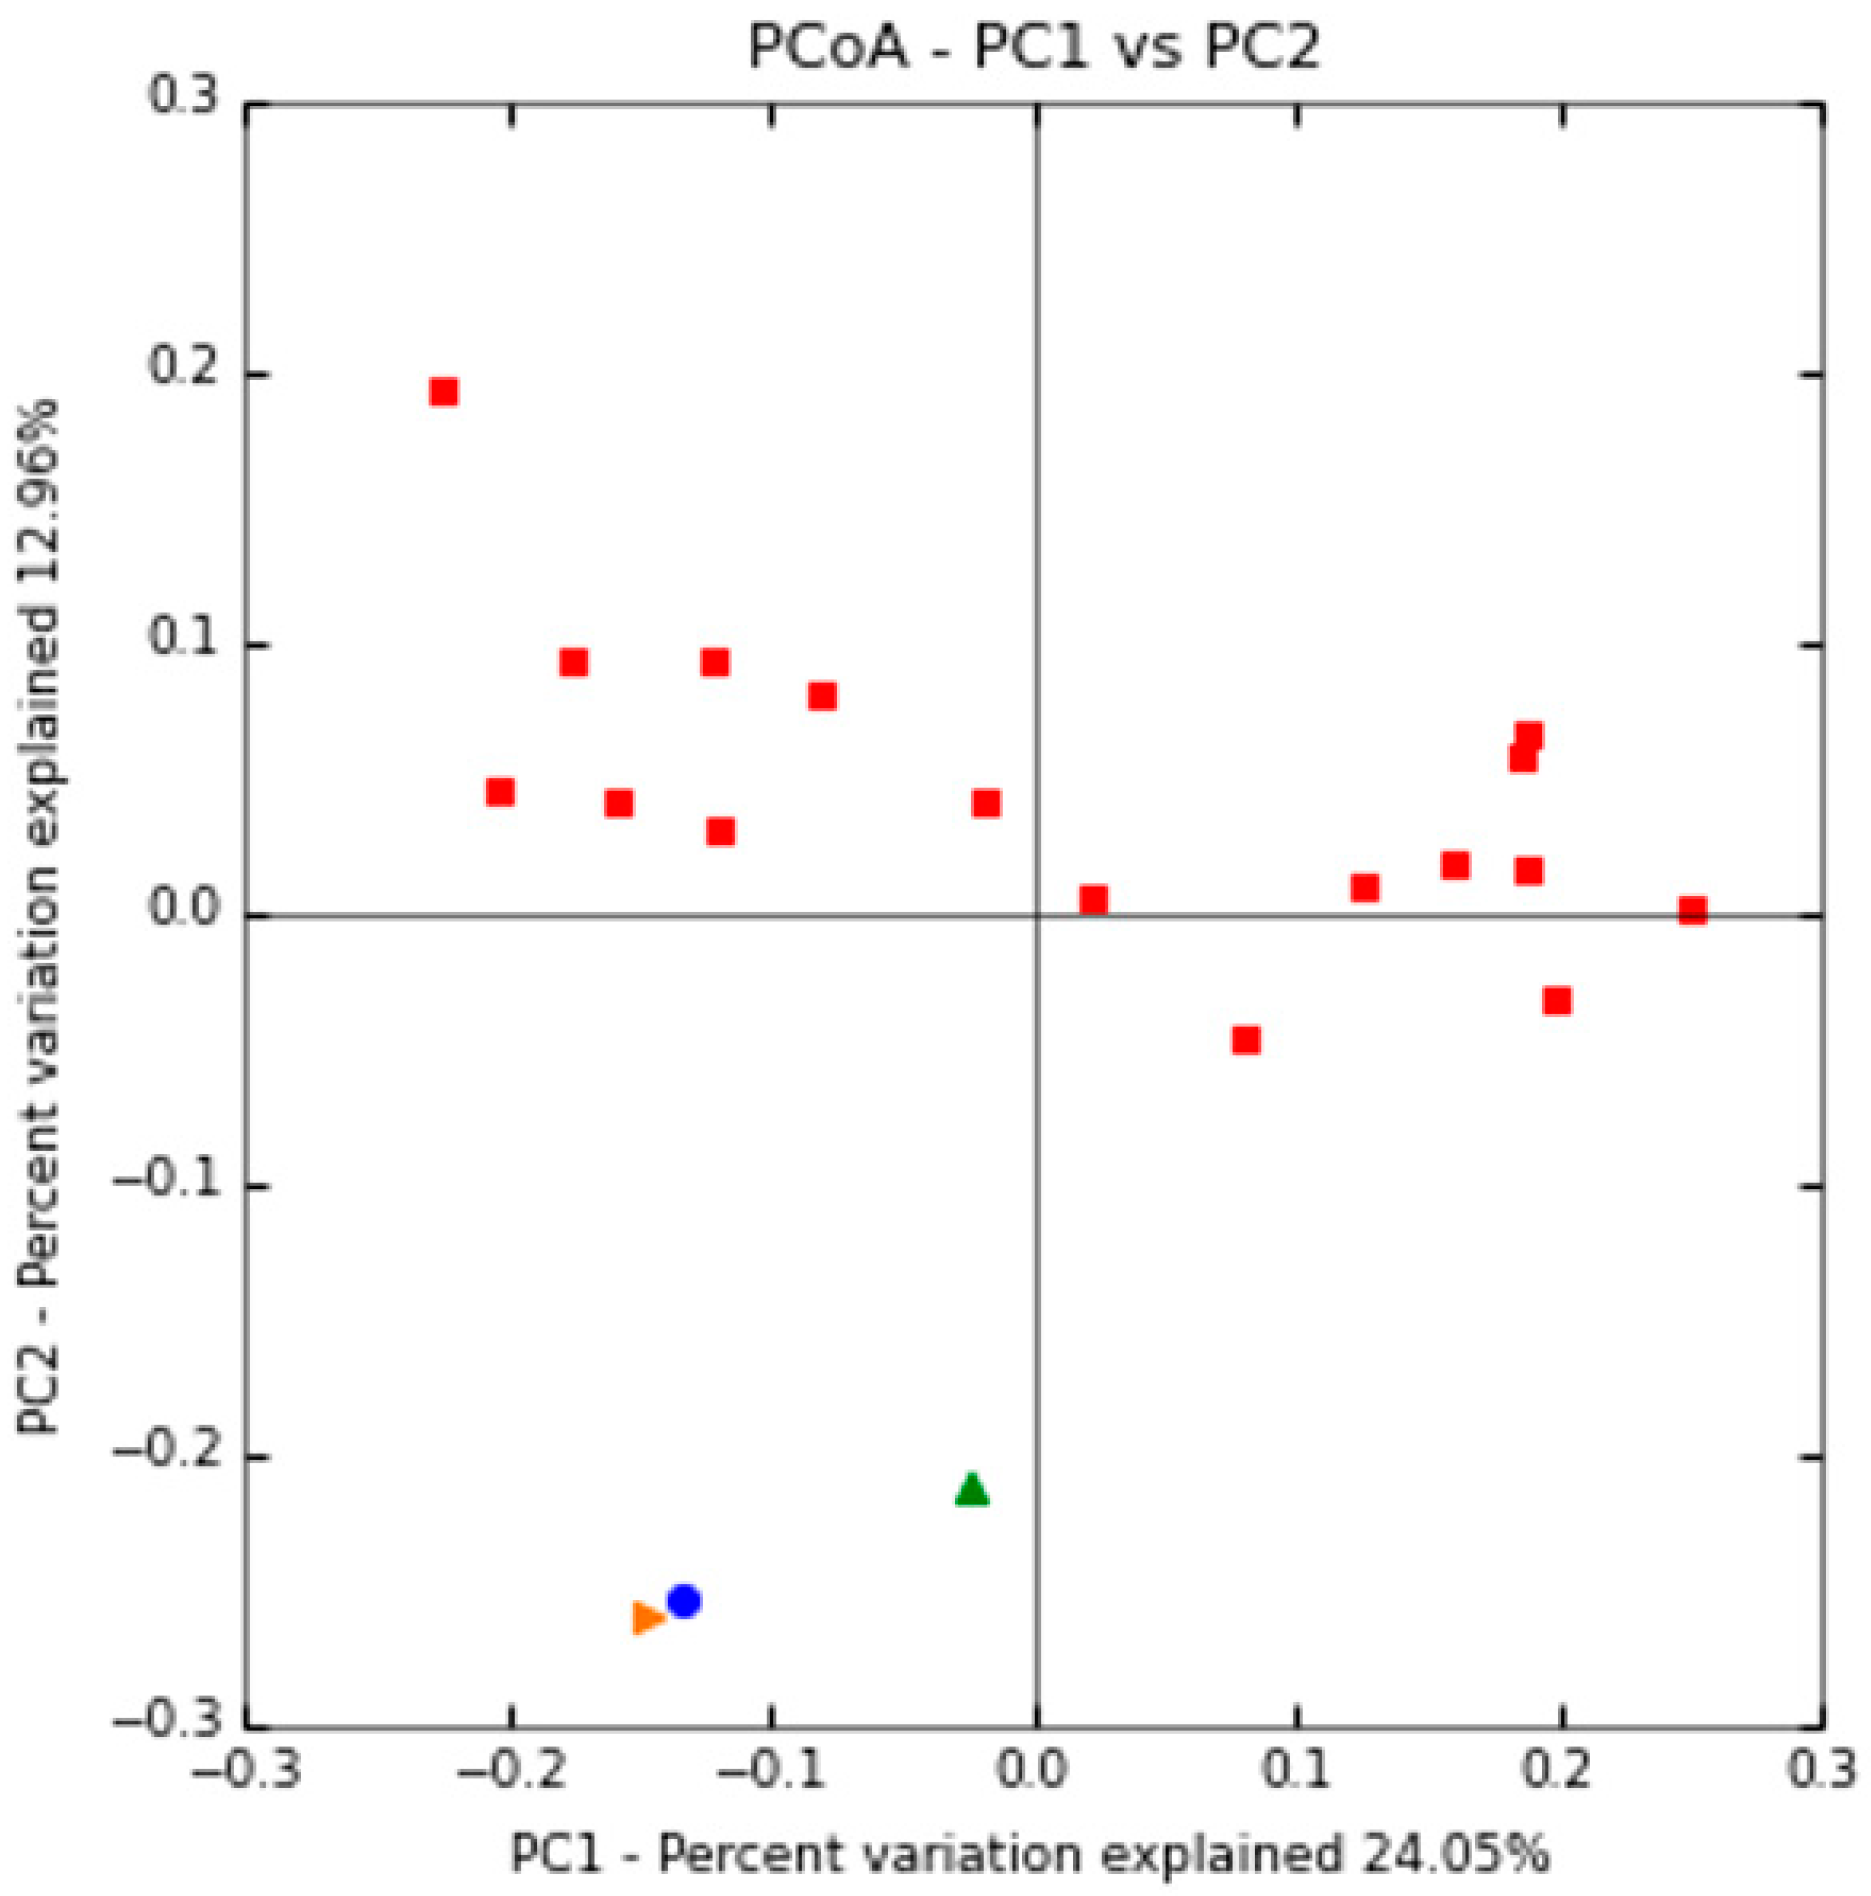
2.2.1. Shaping of Patient’s Gut Microbiota Ecology

We monitored the patient’s gut microbiota shaping since the nematode infection to the second month of negative stool samples, relying on three time-points of stool sampling (T0: during parasite infection, T1: a month after parasite infection, and T2: two months after parasite infection). A total of 1,718,328 high-quality reads were obtained from the T0, T1, and T2 samples, and 16 stool samples from healthy, age-matched individuals, with a mean of 85,916 high-quality reads per sample, were used as a gut microbiota reference for comparisons.
The number of OTUs detected at each time-point sample ranged from 1365 to 790, highlighting a decrease of the gut microbiota diversity from parasite infection (T0) to post-infection (T2) time points (Table 1).
This decrease of the gut microbiota diversity from T0 to T2 was also confirmed by the calculation of the alpha-biodiversity indices. As shown in Figure 2, the T0, T1, and T2 alpha-diversity indices are included in the variability range of the healthy controls. However, T0 and T1 samples showed higher alpha-diversity values than the T2 sample and the average of control groups.
A diverse range of bacterial phyla (L2) were identified in stool samples from the patient and healthy controls, including Bacteroidetes, Firmicutes, Proteobacteria, Verrucomicrobia, and Actinobacteria. In the gut microbiota from controls, Firmicutes were mostly prevalent (57.00%), followed by Bacteroidetes (15.90%), Actinobacteria (7.49%), Proteobacteria (3.86%), Verrucomicrobia (3.66%), and others (12.09%). Compared to CTRLs, the relative proportions of these phyla were mostly maintained in the T2 sample. Instead, a clear shift in phyla proportions was observed in the T0 and T1 samples. Particularly, the T0 and T1 samples were depleted in Actinobacteria and enriched in Firmicutes with respect to the T2 sample and CTRLs, as reported in the heatmap with hierarchical clustering of Figure 3.
At family (L5) and genus (L6) levels, the proportion of several bacterial families and genera were mostly similar between the T1 and T2 samples by clustering with the CTRLs, while the T0 sample showed a different and specific gut microbiota pattern (Figure 4 and Figure 5). In particular, at family level (L5), Bifidobacteriaceae, Coriobacteriaceae, Rikenellaceae, Clostridiaceae, Erysipelotrichaceae, and Ruminococcaceae, showed a gradual enrichment from the T0 to the T2 time-points. Meanwhile, Veillonellaceae, Staphylococcaceae, Lactobacillaceae, and Lachnospiraceae displayed a gradual depletion from the T0 to the T2 samples (Figure 4).
At genus level (L6), Bifidobacterium, Blautia, Ruminococcus, Bacteroides, Corynebacterium, Colinsella, Streptococcus, Coprococcus, and Oscillospora showed a gradual enrichment from the T0 to T2 time-points. Instead, Staphylococcus, Lactobacillus, and Pediococcus displayed a gradual depletion from the T0 to T2 samples (Figure 5).
The gut microbiota biodiversity between the three patient’s time-point samples and CTRLs was also analyzed via beta-diversity. According to the previous results highlighted by hierarchical clustering, this analysis revealed a shaping of the patient’s gut microbiota during (T0) and after (T1 and T2) nematode infection, with the T1 sample close to the T0 and the T2 sample shifted to the controls (Figure 6).

2.2.2. Metabolic Prediction of the Patient’s Gut Microbiota during S. stercoralis Infection

To correlate the fecal microbiota composition data and inferred changes in bacterial metabolism with the response to the parasitic helminth infection, we conducted a predictive metagenomics analysis using PICRUSt. Functional prediction suggested that there were differences in the bacterial functional content of the T0 gut microbiota with respect to the healthy controls.
At KEGG level I (Figure 7), “Genetic Information Processing” pathway was depleted in the T0 sample with respect to the controls and, for this reason, the prediction analysis of this pathway was further deepened by KEGG level II and III. At KEGG level II (Figure 8), “Cellular processes and Signaling,” “Glycan Biosynthesis and Metabolism,” “Carbohydrate Metabolism,” “Signal Transduction,” and “Cell Motility” pathways were enriched in the T0 sample with respect to the controls. “Nucleotide Metabolism,” “Amino Acid Metabolism,” “Translation,” “Transcription,” and “Replication and Repair” were depleted in the T0 sample when compared with the controls. At KEGG level III (Figure 9), “Transcription factors” and “Chaperons and folding catalysts” pathways were enriched in the T0 sample with respect to the controls. Meanwhile, “Ribosome and Aminoacyl tRNA biosynthesis” and “Homologous recombination” pathways were depleted in the T0 sample with respect to the controls.

3. Discussion

In this report, we performed a targeted-metagenomic analysis of the gut microbiota of a seven-year-old female during and after S. stercolaris infection to improve our understanding of how the parasitic infection may influence the host’s gut microbiota.
The patient was admitted to the Academic Department of Nephrology of the Bambino Gesù Children’s Hospital for a nephrotic syndrome with several symptoms, including visual hallucinations, abdominal pain, respiratory stress, and widespread skin rash. After negative radiological exams, clinicians suspected a parasitic infection on the basis of the patient’s origin and her systemic and respiratory involvements.
Several microscopic, serological, and molecular approaches were used to discern, characterize, and identify larvae in the patient’s stool samples and to confirm the diagnosis. The laboratory diagnosis of strongyloidiasis was made by reporting rhabditiform larvae in the stool samples of the pediatric patient, even if in the absence of eosinophilia. However, several reports highlight that eosinophilia can be considered as a nonspecific marker for the screening of chronic strongyloidiasis, especially for individuals without severe gastrointestinal symptoms [8]. After diagnosis of strongyloidiasis, the patient received albendazole treatment for about three weeks (one day after the T0 sampling point). The anti-helmintic treatment (albendazole) resulted in the resolution of the infection and in an improvement of the overall patient’s health.
Regardless of the overall similarities in the composition of the patient’s gut microbiota during and after parasitic infection with respect to the healthy controls at a phylum level (L2), our analysis revealed differences in the bacterial profiles of the three time-point samples (T0, T1, and T2), thus, indicating that S. stercoralis infection was associated with shifts in the relative abundance of specific gut bacterial species. The alpha-diversity indices were higher in the T0 and T1 samples when compared to the T2 sample and the average of the healthy controls. According to previous investigations, increased levels of the bacterial alpha-diversity have been reported for the gut microbiota of individuals infected by several GI helminths (i.e., Necator americanus, Trichuris trichiura, and Ascaris spp.) [9]. Since alpha-diversity indices are used as a proxy of the microbiota “health” (high alpha-diversity is generally associated with a stable and healthy gut bacterial environment [10]), several authors proposed that the direct or immune-mediated ability of GI helminths to promote the increase in bacterial richness and evenness may represent a therapeutic strategy in patients with chronic inflammatory disorders [11].
The differences between the patient’s three time-point samples and healthy controls were displayed by dissimilarities in the relative abundance of particular bacterial taxa in the gut microbiota profiles. As shown by the beta-diversity analysis, the T1 sample is very close to the T0 sample, while T2 was shifted to the healthy controls. These findings suggest that anti-helminthic treatment with albendazole between T0 and T1 sampling points does not affect the gut microbiota composition. Accordingly, a study on Indonesian treated and untreated subjects with albendazole for helminthes infections showed that this anti-helminthic drug does not influence the composition of the gut microbiome [12].
Our results showed an enrichment of Bifidobacterium, Blautia, Ruminococcus, Bacteroides, Corynebacterium, Colinsella, Streptococcus, Coprococcus, and Oscillospora genera from the T0 to T2 time-points. Instead, Staphylococcus, Lactobacillus, and Pediococcus displayed a gradual depletion from the T0 to T2 samples.
Regarding the depletion of Bacteroides during S. stercolaris infection, one study showed that helminths infection protects mice deficient in the Crohn’s disease susceptibility Nod2 gene from intestinal abnormalities by inhibiting colonization of inflammatory Bacteroides species [13]. Resistance to Bacteroides colonization was dependent on type 2 immunity, which promoted the establishment of a protective microbiota. Bacteroidetes exhibit a crucial role in the metabolism of a wide range of carbohydrates [14]. In anaerobic environments, the products of fermentation of these substrates are short-chain fatty acids (SCFAs) that can act as a source of ATP by the host cells [15]. Additionally, SCFAs interact with the host immune system by targeting G protein coupled receptors on intestinal epithelial cells and leukocytes and modulating their development, survival, and function [16]. However, a recent study on the intestinal nematode Trichinella spiralis showed that Bacteroides genus displayed increased abundances in the T. spiralis positive stool samples when compared with the negative samples [17]. Therefore, these conflicting results highlight the need for further investigations in this area and that Bacteroides abundance during infection might depend on the parasitic species and/or on the type of host immune response.
According to our results, species belonging to the family Lactobacillaceae, which are capable of triggering host regulatory responses [18], have been widely reported to increase in abundance during helminth infection, irrespective of helminth or host species [19,20]. Moreover, several studies have demonstrated that the high abundance of Lactobacillus can enhance the persistence of helminth infection, providing evidence for a mutualistic relationship between helminths and Lactobacillus species [21,22].
We also highlighted the depletion of Ruminococcus genus during S. stercoraris infection. Accordingly, a study conducted by a shotgun metagenomics approach showed that the intestinal helminth Trichuris suis has an effect on the gut microbiota of pigs with a significant decrease in Ruminococcus [23].
Functional prediction of the bacterial metagenomic profile suggested that there was an enrichment of the “Glycan Biosynthesis” and “Carbohydrate Metabolisms” pathways during S. stercoralis infection (T0 sample) when compared to the healthy controls. In particular, anaerobic metabolism of non-digestible carbohydrates by the gut bacteria produces short chain fatty acids (SCFAs). SCFAs, such as acetate, propionate, and butyrate, mainly in the lumen, are assumed to interact in terms of antioxidant activity, avoiding anti-inflammatory effects on the intestinal mucosa. Moreover, butyrate and propionate can regulate intestinal physiology and immune function, whereas acetate acts as a substrate for lipogenesis and gluconeogenesis [24]. Bacteroidetes and Firmicutes are the most abundant phyla in the human gut, with Bacteroidetes mainly producing acetate and propionate, while Firmicutes mostly produces butyrate [25]. Therefore, the observed enrichment of the “Carbohydrate Metabolism” pathway during parasitic infection, albeit with a low abundance of Bacteroides, may be explained by the high abundance of Firmicutes at the T0 sampling point. Therefore, upregulation of this pathway in the gut microbiota may represent a response to oxidative stress in the host intestinal environment during S. stercoralis infection.
In summary, this study provides a view of changes in the gut microbiota during the course of a parasitic nematode infection. Our observational time-series experiments explored the pediatric patient’s gut microbiota to elucidate the influence of parasite-related modifications and host metabolic responses to microbiota dynamics in the host intestine.
Although our findings add valuable knowledge to this emerging area of the host-parasite-microbiota interactions, agnostic multiomics-based investigations in experimental models of infection and diseases are mandatory to shed light on the contribution of the parasite-associated modifications in the gut microbiome and on the therapeutic properties of parasitic helminthes.

4. Case Presentation and Laboratory Diagnosis

4.1. Patient’s Characteristics

A seven-year-old female child was admitted to the Academic Department of Nephrology of the Bambino Gesù Children’s Hospital for nephrotic syndrome. The patient was born in Bolivia but adopted and transferred to Italy since May 2018. Upon admission, blood laboratory results showed haemoglobin 12.9 g/dL (11.1–14.8 g/dL), white blood cells, and full blood count within normal ranges (in particular, eosinophil count was 0.04 103/μL), while C-reactive protein was 4 mg/L (<0.50 mg/L). Her medical history included febrile episode, visual hallucinations, abdominal pain, respiratory stress, and widespread skin rash. Epidemiological and clinical data, including the systemic and respiratory involvements, suggested a parasitic infection. Hence, a collection of multiple stool samples for parasitological and gut microbiota profiling investigations was performed at three different time-points: T0- during parasite infection, T1- a month after parasite infection, and T2- two months after parasite infection. Moreover, multiple bronchial washings and cerebrospinal fluid (CSF) samples were collected to verify the presence of parasites in other body districts.
One day after the T0 sampling point, the patient received the anti-elminthic albendazole for two weeks. Therefore, at the T1 point, the treatment was already ended two weeks earlier and, at T2, it was ended a month and a half earlier.
This study was carried out in accordance with the recommendations of the OPBG Ethics Committee (Protocol No. 1113_OPBG_2016) and was approved on 21 April, 2016. Written informed consent was obtained from the patient and from healthy age-matched individuals, whose faecal samples were available at the BBMRI Biobank of Human Microbiome of the Bambino Gesù Children’s Hospital.

4.2. Laboratory Diagnosis of Strongyloidiasis

4.2.1. Optical Microscopy

The laboratory diagnosis of strongyloidiasis was made by optical microscopy characterization of larvae in a fecal specimen. With this purpose, fecal samples were concentrated by an ethyl acetate-based technique and examined under light microscopy at 20× and 40× magnification. The assessment of the morphological characteristics of the larvae was made on a smear of feces stained by Lugol independently by two parasitologists.

4.2.2. Stool Agar Culture

Stool samples were also tested for direct parasite searching through the culture onto S. stercoralis Agar (Biolife Italiana s.r.l., Milano). The agar plate culture was performed using approximately 3–5 g of feces and the plates were sealed with adhesive tape to prevent larvae from crawling out of the plate and were incubated at 30 °C for at least 7 days [26].

4.2.3. Immunological Methods

Qualitative detection of IgG to S. stercoralis was performed using an enzyme-linked immunosorbent assay based on micro-wells coated with Strongyloides antigen (ELISA, S. ratti Bordier Products, Effegiemme).

4.2.4. DNA Extraction and PCR Amplification for S. stercoralis Detection

Genomic DNA was extracted from stool by using a QIAamp Fast DNA Stool Mini Kit (Qiagen, Germany) with a slight method modification based on the addition of 1 mL of Inhibit EX buffer (Qiagen, Germany) to the sample heated at 70 °C for 5 min in order to increase the quality of extracted DNA. The DNA was finally eluted with 200 μL ATE buffer. The PCR reactions were performed using the following reaction mixture: 22 µL master mix, (Faststart HIFI PCR SYST.DNTP 500U SIGMA-ALDRICH S.r.L.) 1 µL of each primer (forward: 5′ ATC GTG TCG GTG GAT CAT TC 3′, reverse: 5′ CTA TTA GCG CCA TTT GCA TTC 3′), 3 µL of DNA template, and ultra-pure bi-distilled H2O up to a final volume of 30 µL under the following conditions: 1 cycle at 95 °C for 5 min (time-delay), 30 cycle at 94 °C for 30s (denaturation), 58 °C for 45 s (annealing), and 72 °C for 45 s (extension), which is followed by a final extension for 5 min [27]. DNA extracted from stool samples of pediatric patients infected with filariform larvae was used as positive controls, while DNA extracted from microscopically negative samples and ultra-pure bi-distilled H2O was used as a negative control of the PCR reaction.

4.3. Gut Microbiota Profiling by 16S rRNA Targeted-Metagenomics Sequencing

4.3.1. Bacterial DNA Extraction from Stool Samples

Stool samples were pre-treated by a bead-beating process using 0.1-mm glass beads. This step is crucial because it enables the mechanical disruption of bacteria otherwise difficult to lyse using chemical/enzymatic buffers.
Subsequently, DNA from stool samples was extracted using QIAmp Fast DNA Stool mini kit (Qiagen, Hilden, Germany), according to the manufacturer’s instructions. Sixteen stool samples from healthy, age-matched individuals were used as a gut microbiota reference for comparisons. We checked the purity of extracted DNA by Nanodrop measurements (Thermo Fisher Scientific, Waltham, MA, USA). Samples that failed quality control (DNA yield and purity not adequate for libraries preparation) were re-extracted. Amplification of the variable V3–V4 regions from the 16S rRNA bacterial gene (∼460 bp) was carried out using the primer pairs 16S_F 5′-(TCG TCG GCA GCG TCA GAT GTG TAT AAG AGA CAG CCT ACG GGN GGC WGC AG)-3′ and 16S_R 5′-(GTC TCG TGG GCT CGG AGA TGT GTA TAA GAG ACA GGA CTA CHV GGG TAT CTA ATC C)-3′ as described in the MiSeq rRNA Amplicon Sequencing protocol (Illumina, San Diego, CA, USA). The polymerase chain reaction (PCR) was set up by using the 2× KAPA Hifi HotStart ready Mix kit (KAPA Biosystems Inc., Wilmington, MA, USA). DNA amplicons were cleaned-up by the CleanNGS kit beads (CleanNA, Coenecoop 75, 2741 PH, Waddinxveen, The Netherlands). A second amplification step was performed to obtain a unique combination of dual Illumina Nextera XT indices and adaptor primers. The final library was cleaned-up using CleanNGS kit beads, quantified using Quant-iT PicoGreen dsDNA Assay Kit (Thermo Fisher Scientific, Waltham, MA, USA), normalized and diluted to equimolar concentrations (4 nmol/L). The size of the libraries (600–630 bp) was checked using 2100 Bioanalyzer Desktop System (Agilent Technologies Inc., Santa Clara, CA, USA). Pooled and denatured libraries were sequenced by a MiSeq Reagent Kit v2 (300 cycles) (Illumina Inc., San Diego, CA, USA) on the MiSeqDX Instrument (Illumina Inc., San Diego, CA, USA).

4.3.2. Bioinformatics Analysis

The Illumina sequence raw data were processed using QIIME version 1.9.1 [28]. The workflow started with joined paired-end reads, quality filtering, and library splitting, followed by the detection of the chimeric sequences with the UCHIME algorithm, included in the free version of USEARCH61, and the subsequent removal prior to further analysis.
Cleaned reads were clustered and assigned to operational taxonomic units (OTUs) against the Greengenes 13.8 database [29] with a 97% identity threshold using an open-reference OTU-picking protocol with “usearch”. OTUs were then further normalized using metagenome Seq’s CSS (cumulative sum scaling) transformation and, finally, taxa below a minimum fractional count of 0.01% were filtered from the OTU table.
To highlight differences between the patient’s three time-points’ samples and the controls in term of bacteria abundances, we performed several heatmaps with hierarchical clustering (clustering metric: “correlation” and method: “complete”) in R v.4.0.2 environment using Pheatmap package (https://cran.r-project.org/web/packages/pheatmap/pheatmap.pdf (accessed on 20 February 2021)).
Alpha-diversity was estimated by calculating the Shannon and Observed species indices. Beta-diversity was assessed by calculating the Bray-Curtis dissimilarity index. Differences in community composition were visualized by performing principle coordinate analysis (PCoAs). The molecular functions of the bacterial communities were predicted using the Phylogenetic Investigation of Communities by Reconstruction of Unobserved States (PICRUSt) [30] based on 16S rRNA metadata with the Kyoto encyclopedia of genes and genomes (KEGG) database and Greengenes 13.8 reference taxonomy [31].

Author Contributions

Conception and design: S.P., A.S., A.I., and L.P. Analysis and validation: A.S. and A.I. Clinical evaluation of the patient: S.P. and L.R. Manuscript writing: S.P., A.I., and L.P. All authors have read and agreed to the published version of the manuscript.

Funding

This work was supported by the Italian Ministry of Health Ricerca Corrente 201905_Genetica_Putignani and 202005_ Genetica_Putignani to L.P.

Institutional Review Board Statement

The study was conducted according to the guidelines of the Declaration of Helsinki and all methods were performed in accordance with the relevant guidelines and regulations. This study was carried out in accordance with the recommendations of the OPBG Ethics Committee (Protocol No. 1113_OPBG_2016) and was approved on 21 April 2016.

Informed Consent Statement

Written informed consent was obtained from the patient and from healthy age-matched individuals, whose faecal samples were available at the BBMRI Biobank of Human Microbiome of the Bambino Gesù Children’s Hospital.

Data Availability Statement

The data that support the findings of this study are available on request from the corresponding author.

Acknowledgments

We thank the patient and her family for their collaboration. We also thank Simone Gardini, GENOMEUP S.R.L., via Nemorense, 91, 00199, Rome, Italy, for support in data analysis.

Conflicts of Interest

The authors declare no conflict of interest.

References

  1. Bisoffi, Z.; Buonfrate, D.; Montresor, A.; Requena-Mendez, A.; Munoz, J.; Krolewiecki, A.J.; Gotuzzo, E.; Mena, M.A.; Chiodini, P.L.; Anselmi, M.; et al. Strongyloides stercoralis: A plea for action. PLoS Neglect. Trop. D 2013, 7, e2214. [Google Scholar] [CrossRef] [Green Version]
  2. Nutman, T.B. Human infection with Strongyloides stercoralis and other related Strongyloides species. Parasitology 2017, 144, 263–273. [Google Scholar] [CrossRef] [PubMed] [Green Version]
  3. Buonfrate, D.; Baldissera, M.; Abrescia, F.; Bassetti, M.; Caramaschi, G.; Giobbia, M.; Mascarello, M.; Rodari, P.; Scattolo, N.; Napoletano, G.; et al. Epidemiology of Strongyloides stercoralis in northern Italy: Results of a multicentre case-control study, February 2013 to July 2014. Eurosurveillance 2016, 21, 30310. [Google Scholar] [CrossRef] [PubMed] [Green Version]
  4. Albarqi, M.M.Y.; Stoltzfus, J.D.; Pilgrim, A.A.; Nolan, T.J.; Wang, Z.; Kliewer, S.A.; Mangelsdorf, D.J.; Lok, J.B. Regulation of Life Cycle Checkpoints and Developmental Activation of Infective Larvae in Strongyloides stercoralis by Dafachronic Acid. PLoS Pathog 2016, 12, e1005358. [Google Scholar] [CrossRef] [Green Version]
  5. Csermely, L.; Jaafar, H.; Kristensen, J.; Castella, A.; Gorka, W.; Chebli, A.A.; Trab, F.; Alizadeh, H.; Hunyady, B. Strongyloides hyper-infection causing life-threatening gastrointestinal bleeding. World J. Gastroenterol. 2006, 12, 6401–6404. [Google Scholar] [CrossRef] [PubMed]
  6. Kuo, C.-E.; Chuah, S.-K.; Tai, W.-C.; Lee, C.-H. Upper gastrointestinal bleeding caused by Strongyloides stercoralis: Highlighting a neglected parasitic infection. Kaohsiung J. Med. Sci. 2017, 33, 269–270. [Google Scholar] [CrossRef] [PubMed]
  7. Marcos, L.A.; Terashima, A.; Dupont, H.L.; Gotuzzo, E. Strongyloides hyperinfection syndrome: An emerging global infectious disease. Trans. R. Soc. Trop Med. Hyg. 2008, 102, 314–318. [Google Scholar] [CrossRef] [PubMed]
  8. Teixeira, M.C.A.; Pacheco, F.T.F.; Souza, J.N.; Silva, M.L.S.; Ines, E.J.; Soares, N.M. Strongyloides stercoralis Infection in Alcoholic Patients. Biomed. Res. Int. 2016, 2016, 4872473. [Google Scholar] [CrossRef] [Green Version]
  9. Jenkins, T.P.; Formenti, F.; Castro, C.; Piubelli, C.; Perandin, F.; Buonfrate, D.; Otranto, D.; Griffin, J.L.; Krause, L.; Bisoffi, Z.; et al. A comprehensive analysis of the faecal microbiome and metabolome of Strongyloides stercoralis infected volunteers from a non-endemic area. Sci. Rep.-UK 2018, 8, 15651. [Google Scholar] [CrossRef] [PubMed] [Green Version]
  10. Menni, C.; Jackson, M.A.; Pallister, T.; Steves, C.J.; Spector, T.D.; Valdes, A.M. Gut microbiome diversity and high-fibre intake are related to lower long-term weight gain. Int. J. Obes. 2017, 41, 1099–1105. [Google Scholar] [CrossRef] [Green Version]
  11. Zaiss, M.M.; Rapin, A.; Lebon, L.; Dubey, L.K.; Mosconi, I.; Sarter, K.; Piersigilli, A.; Menin, L.; Walker, A.W.; Rougemont, J.; et al. The Intestinal Microbiota Contributes to the Ability of Helminths to Modulate Allergic Inflammation. Immunity 2015, 43, 998–1010. [Google Scholar] [CrossRef] [PubMed] [Green Version]
  12. Martin, I.; Djuardi, Y.; Sartono, E.; Rosa, B.A.; Supali, T.; Mitreva, M.; Houwing-Duistermaat, J.J.; Yazdanbakhsh, M. Dynamic changes in human-gut microbiome in relation to a placebo-controlled anthelminthic trial in Indonesia. PLoS Neglect. Trop. D 2018, 12, e0006620. [Google Scholar] [CrossRef]
  13. Ramanan, D.; Bowcutt, R.; Lee, S.C.; Tang, M.S.; Kurtz, Z.D.; Ding, Y.; Honda, K.; Gause, W.C.; Blaser, M.J.; Bonneau, R.A.; et al. Helminth infection promotes colonization resistance via type 2 immunity. Science 2016, 352, 608–612. [Google Scholar] [CrossRef] [PubMed] [Green Version]
  14. Thomas, F.; Hehemann, J.-H.; Rebuffet, E.; Czjzek, M.; Michel, G. Environmental and gut bacteroidetes: The food connection. Front. Microbiol. 2011, 2, 93. [Google Scholar] [CrossRef] [Green Version]
  15. den Besten, G.; van Eunen, K.; Groen, A.K.; Venema, K.; Reijngoud, D.-J.; Bakker, B.M. The role of short-chain fatty acids in the interplay between diet, gut microbiota, and host energy metabolism. J. Lipid Res. 2013, 54, 2325–2340. [Google Scholar] [CrossRef] [Green Version]
  16. Correa-Oliveira, R.; Fachi, J.L.; Vieira, A.; Sato, F.T.; Vinolo, M.A.R. Regulation of immune cell function by short-chain fatty acids. Clin. Transl. Immunology 2016, 5, e73. [Google Scholar] [CrossRef]
  17. Liu, S.; Pan, J.; Meng, X.; Zhu, J.; Zhou, J.; Zhu, X. Trichinella spiralis infection decreases the diversity of the intestinal flora in the infected mouse. J. Microbiol. Immunol. Infect. 2019. [Google Scholar] [CrossRef] [PubMed]
  18. Brosschot, T.P.; Reynolds, L.A. The impact of a helminth-modified microbiome on host immunity. Mucosal. Immunol. 2018, 11, 1039–1046. [Google Scholar] [CrossRef] [PubMed] [Green Version]
  19. Holm, J.B.; Sorobetea, D.; Kiilerich, P.; Ramayo-Caldas, Y.; Estelle, J.; Ma, T.; Madsen, L.; Kristiansen, K.; Svensson-Frej, M. Chronic Trichuris muris Infection Decreases Diversity of the Intestinal Microbiota and Concomitantly Increases the Abundance of Lactobacilli. PLoS ONE 2015, 10, e0125495. [Google Scholar] [CrossRef]
  20. Kreisinger, J.; Bastien, G.; Hauffe, H.C.; Marchesi, J.; Perkins, S.E. Interactions between multiple helminths and the gut microbiota in wild rodents. Philos Trans. R. Soc. Lond. B Biol. Sci. 2015, 370, 20140295. [Google Scholar] [CrossRef] [Green Version]
  21. Reynolds, L.A.; Smith, K.A.; Filbey, K.J.; Harcus, Y.; Hewitson, J.P.; Redpath, S.A.; Valdez, Y.; Yebra, M.J.; Finlay, B.B.; Maizels, R.M. Commensal-pathogen interactions in the intestinal tract: Lactobacilli promote infection with, and are promoted by, helminth parasites. Gut. Microbes 2014, 5, 522–532. [Google Scholar] [CrossRef] [Green Version]
  22. Walk, S.T.; Blum, A.M.; Ewing, S.A.-S.; Weinstock, J.V.; Young, V.B. Alteration of the murine gut microbiota during infection with the parasitic helminth Heligmosomoides polygyrus. Inflamm. Bowel. Dis. 2010, 16, 1841–1849. [Google Scholar] [CrossRef]
  23. Lee, S.C.; Tang, M.S.; Lim, Y.A.L.; Choy, S.H.; Kurtz, Z.D.; Cox, L.M.; Gundra, U.M.; Cho, I.; Bonneau, R.; Blaser, M.J.; et al. Helminth colonization is associated with increased diversity of the gut microbiota. PLoS Neglect. Trop. D 2014, 8, e2880. [Google Scholar] [CrossRef] [PubMed]
  24. Vernocchi, P.; Del Chierico, F.; Putignani, L. Gut Microbiota Metabolism and Interaction with Food Components. Int. J. Mol. Sci. 2020, 21, 3688. [Google Scholar] [CrossRef] [PubMed]
  25. Parada Venegas, D.; De la Fuente, M.K.; Landskron, G.; Gonzalez, M.J.; Quera, R.; Dijkstra, G.; Harmsen, H.J.M.; Faber, K.N.; Hermoso, M.A. Short Chain Fatty Acids (SCFAs)-Mediated Gut Epithelial and Immune Regulation and Its Relevance for Inflammatory Bowel Diseases. Front. Immunol. 2019, 10, 277. [Google Scholar] [CrossRef] [Green Version]
  26. Koga, K.; Kasuya, S.; Ohtomo, H. How effective is the agar plate method for Strongyloides stercoralis? J. Parasitol. 1992, 78, 155–156. [Google Scholar] [CrossRef] [PubMed]
  27. Moghaddassani, H.; Mirhendi, H.; Hosseini, M.; Rokni, M.; Mowlavi, G.; Kia, E. Molecular Diagnosis of Strongyloides stercoralis Infection by PCR Detection of Specific DNA in Human Stool Samples. Iran. J. Parasitol. 2011, 6, 23–30. [Google Scholar]
  28. Caporaso, J.G.; Kuczynski, J.; Stombaugh, J.; Bittinger, K.; Bushman, F.D.; Costello, E.K.; Fierer, N.; Pena, A.G.; Goodrich, J.K.; Gordon, J.I.; et al. QIIME allows analysis of high-throughput community sequencing data. Nat. Methods 2010, 7, 335–336. [Google Scholar] [CrossRef] [Green Version]
  29. Yokono, M.; Satoh, S.; Tanaka, A. Comparative analyses of whole-genome protein sequences from multiple organisms. Sci. Rep.-UK 2018, 8, 6800. [Google Scholar] [CrossRef] [PubMed]
  30. Langille, M.G.I.; Zaneveld, J.; Caporaso, J.G.; McDonald, D.; Knights, D.; Reyes, J.A.; Clemente, J.C.; Burkepile, D.E.; Vega Thurber, R.L.; Knight, R.; et al. Predictive functional profiling of microbial communities using 16S rRNA marker gene sequences. Nat. Biotechnol. 2013, 31, 814–821. [Google Scholar] [CrossRef]
  31. DeSantis, T.Z.; Hugenholtz, P.; Larsen, N.; Rojas, M.; Brodie, E.L.; Keller, K.; Huber, T.; Dalevi, D.; Hu, P.; Andersen, G.L. Greengenes, a chimera-checked 16S rRNA gene database and workbench compatible with ARB. Appl. Environ. Microbiol. 2006, 72, 5069–5072. [Google Scholar] [CrossRef] [PubMed] [Green Version]
Figure 1. Light microscope-based characterization of Strongyloides stercoralis. Rhabditiform larvae of S. stercoralis are reported in panels (ac) at 40× magnification. The inset refers to a larva onto an agar plate.
Ijms 22 02131 g001
Figure 2. Alpha-diversity metrics of patient’s gut microbiota at T0, T1, T2, and healthy CTRL group (CTRL_mean). Left and right panels show Shannon and Observed_Species diversity indexes, respectively. Center lines show median values and box limits indicate the 25th and 75th percentiles.
Ijms 22 02131 g002
Figure 3. Heatmap with hierarchical clustering based on phyla (L2) abundances. The colors in the heatmap refer to the phylum’s abundance, according to the color scale on the right.
Ijms 22 02131 g003
Figure 4. Heatmap with hierarchical clustering based on families’ (L5) abundances. The colors in the heatmap refer to the family’s abundance, according to the color scale on the right.
Ijms 22 02131 g004
Figure 5. Heatmap with hierarchical clustering based on genera (L6) abundances. The colors in the heatmap refer to the genus abundance, according to the color scale on the right.
Ijms 22 02131 g005
Figure 6. PCoA of beta-diversity values based on Bray Curtis distances. Patient gut microbiota at T0: blue circle, T1: orange triangle, T2: green triangle, and healthy controls: red squares.
Ijms 22 02131 g006
Figure 7. Predicted functional pathways (KEGG Level I) of the gut microbiota during infection (T0) with S. stercolaris.
Ijms 22 02131 g007
Figure 8. Predicted functional pathways (KEGG Level II) of the gut microbiota during infection (T0) with S. stercolaris.
Ijms 22 02131 g008
Figure 9. Predicted functional pathways (KEGG Level III) of the gut microbiota during infection (T0) with S. stercolaris.
Ijms 22 02131 g009
Table 1. Summary of the analyzed samples for the gut microbiota profiling and sequencing output.
SAMPLE_IDSTATUSAgeTotal Reads Count (N)Assigned Reads (N)OTUs (N)
T0During parasite infection753,47636,6431365
T11 month after parasite infection716,83014,598917
T22 months after parasite infection744,87642,857790
N-05-1healthy control7–858,77557,5781062
N-05-2healthy control7–868,14461,5981475
N-05-3healthy control7–854,79652,930799
N-05-4healthy control7–8164,725159,7721044
N-05-5healthy control7–884,61680,331645
N-05-6healthy control7–8293,539285,209978
N-05-7healthy control7–829,69629,454377
N-05-8healthy control7–840,40037,790875
N-05-9healthy control7–876,14075,780463
N-06-1healthy control7–860,59160,217397
N-06-2healthy control7–846,30446,014455
N-06-3healthy control7–8400,539393,1981647
N-06-4healthy control7–869,98969,092385
N-06-5healthy control7–875,86472,235781
N-06-6healthy control7–840,31239,751932
N-06-7healthy control7–893799302320
N-06-8healthy control7–829,33726,571494
Publisher’s Note: MDPI stays neutral with regard to jurisdictional claims in published maps and institutional affiliations.

