Article

PIAS Factors from Rainbow Trout Control NF-κB- and STAT-Dependent Gene Expression

1
Research Institute for Farm Animal Biology (FBN), Institute of Genome Biology, 18196 Dummerstorf, Germany
2
Friedrich-Loeffler-Institut (FLI), Federal Research Institute for Animal Health, Institute of Immunology, 17493 Greifswald, Germany
3
Department of Cell Biology, Rostock University Medical Center, 18057 Rostock, Germany
4
Faculty of Agriculture and Environmental Sciences, University of Rostock, 18057 Rostock, Germany
5
Laboratoire Virologie et Immunologie Moléculaires, Institut National de Recherche Pour L’agriculture, L’alimentation et L’environnement (INRAE), Université Paris-Saclay, 78350 Paris, France
*
Authors to whom correspondence should be addressed.
Int. J. Mol. Sci. 2021, 22(23), 12815; https://doi.org/10.3390/ijms222312815
Submission received: 3 November 2021 / Revised: 24 November 2021 / Accepted: 24 November 2021 / Published: 26 November 2021
(This article belongs to the Special Issue NF-κB and Disease 2.0)

Abstract

:
Four ‘protein inhibitors of activated STAT’ (PIAS) control STAT-dependent and NF-κB-dependent immune signalling in humans. The genome of rainbow trout (Oncorhynchus mykiss) contains eight pias genes, which encode at least 14 different pias transcripts that are differentially expressed in a tissue- and cell-specific manner. Pias1a2 was the most strongly expressed variant among the analysed pias genes in most tissues, while pias4a2 was commonly low or absent. Since the knock-out of Pias factors in salmonid CHSE cells using CRISPR/Cas9 technology failed, three structurally different Pias protein variants were selected for overexpression studies in CHSE-214 cells. All three factors quenched the basal activity of an NF-κB promoter in a dose-dependent fashion, while the activity of an Mx promoter remained unaffected. Nevertheless, all three overexpressed Pias variants from trout strongly reduced the transcript level of the antiviral Stat-dependent mx gene in ifnγ-expressing CHSE-214 cells. Unlike mx, the overexpressed Pias factors modulated the transcript levels of NF-κB-dependent immune genes (mainly il6, il10, ifna3, and stat4) in ifnγ-expressing CHSE-214 cells in different ways. This dissimilar modulation of expression may result from the physical cooperation of the Pias proteins from trout with differential sets of interacting factors bound to distinct nuclear structures, as reflected by the differential nuclear localisation of trout Pias factors. In conclusion, this study provides evidence for the multiplication of pias genes and their sub-functionalisation during salmonid evolution.

1. Introduction

The signalling through Janus kinases (JAK) and signal transducers and activators of transcription (STAT) [1,2] transfer a wide range of information from the membrane to the nucleus of eukaryotic cells [3,4]. Upon the stimulus-dependent activation of specific cytokine receptors, the four mammalian JAK proteins (JAK1, JAK2, JAK3, and TYK2) become activated and phosphorylate several other associated proteins, including themselves, other receptor chains, and STAT factors [5] (Table S1). The seven mammalian STAT proteins (STAT1, STAT2, STAT3, STAT4, STAT5a, STAT5b, and STAT6) dimerise after phosphorylation and translocate into the nucleus, where they bind to cognate DNA elements. These binding sites are often in close proximity to the response elements of nuclear factor-κB (NF-κB).
The NF-κB/Rel family of transcription factors comprises five members (p65/RelA, RelB, c-Rel, and p50/NF-κB1, p52/NF-κB2) in most vertebrates [6]. Together, STATs and NF-κB/Rel factors co-regulate a variety of inflammatory genes [7], including cytokines and, in particular, interferons (IFN) [8]. During evolution, several regulatory mechanisms have evolved to fine-tune both the intensity and the duration of cytokine signalling [9,10,11,12], including the ‘protein inhibitors of activated STATs’ (PIAS; Figure 1) [13,14]. The human PIAS family is comprised of four members: PIAS1, PIAS2/PIASx, PIAS3, and PIAS4/PIASy. By contrast, only one PIAS protein is present in the lancelet (Branchiostoma sp.) [15].
In fish, three orthologues of human PIAS1, PIAS2, and PIAS4 have been identified [16]. Pias1 and Pias4 are present as a pair of paralogue genes (a and b) in most fish species, but (pseudo-/allo-)tetraploid families, such as Salmonidae or Cyprinidae, are expected to encode additional Pias ohnologues.
The vertebrate PIAS proteins constitute a subfamily of E3 SUMO (small ubiquitin-related modifier) ligases. SUMO ligases tag their substrates post-transcriptionally with small ubiquitin-related modifiers to control the activity of transcription factors, affect the localisation of certain proteins, and inhibit or activate enzymes [17]. The characteristic functional motifs and domains are largely conserved across the vertebrate PIAS members. The N-terminal SAP (scaffold attachment factor A/B/acinus/PIAS) domain recognises and binds to A/T-rich DNA regions [18]. The PINIT motif [19] and two adjacent nuclear localisation signals (NLSs) allow for the retention of PIAS in the nucleus. A RING-finger-like zinc-binding domain (Siz/PIAS RING finger, SP-RING) [20] is followed by a SUMO-interacting motif (SIM) [21], and both are required for SUMO-protein ligase activity and interaction with other proteins. At the C-terminus, PIAS proteins contain a serine- and threonine-rich (S/T) region of unknown function [22].
PIAS factors employ the SUMOylation mechanism to negatively regulate the transcription of target genes by (i) blocking the DNA-binding activity of transcription factors [23,24,25]; (ii) recruiting histone deacetylases and other regulators, which modulate chromatin compaction [26]; and (iii) isolating transcription factors in specific subnuclear structures that are enriched with corepressor complexes [27,28]. Most studies have focused on the interaction of mammalian PIAS and STAT factors, but PIAS proteins can also block the activity of the NF-κB/Rel factors [15]. PIAS1 prevents the binding of RelA/p65 to the RELA response element of a distinct panel of mainly pro-inflammatory NF-κB-dependent genes [23,29], whereas PIAS3 suppresses the interaction of RelA/p65 and its coactivator CREB-binding protein (CBP) [30,31]. In addition to their inhibitory activities, PIAS proteins can also positively regulate the activity of certain transcription factors [32] (Table S2). Mammalian PIAS4, for instance, may activate NF-κB by SUMOylating the inhibitor of NF-κB kinase subunit gamma (IKBKG) [33].
The only study on the three PIAS4 orthologues of zebrafish (Danio rerio) revealed that Pias4a regulates the Ticam1 (TIR domain-containing adaptor molecule 1)/Trif-dependent Ifn and NF-κB pathways [34]. Comparatively more studies have revealed the involvement of Stat proteins in controlling teleostean Ifn pathways [35,36,37]. The present study comparatively studied the structure, expression, and function of the three PIAS orthologues in salmonid fish and detected indications for their sub-functionalisation.

2. Results

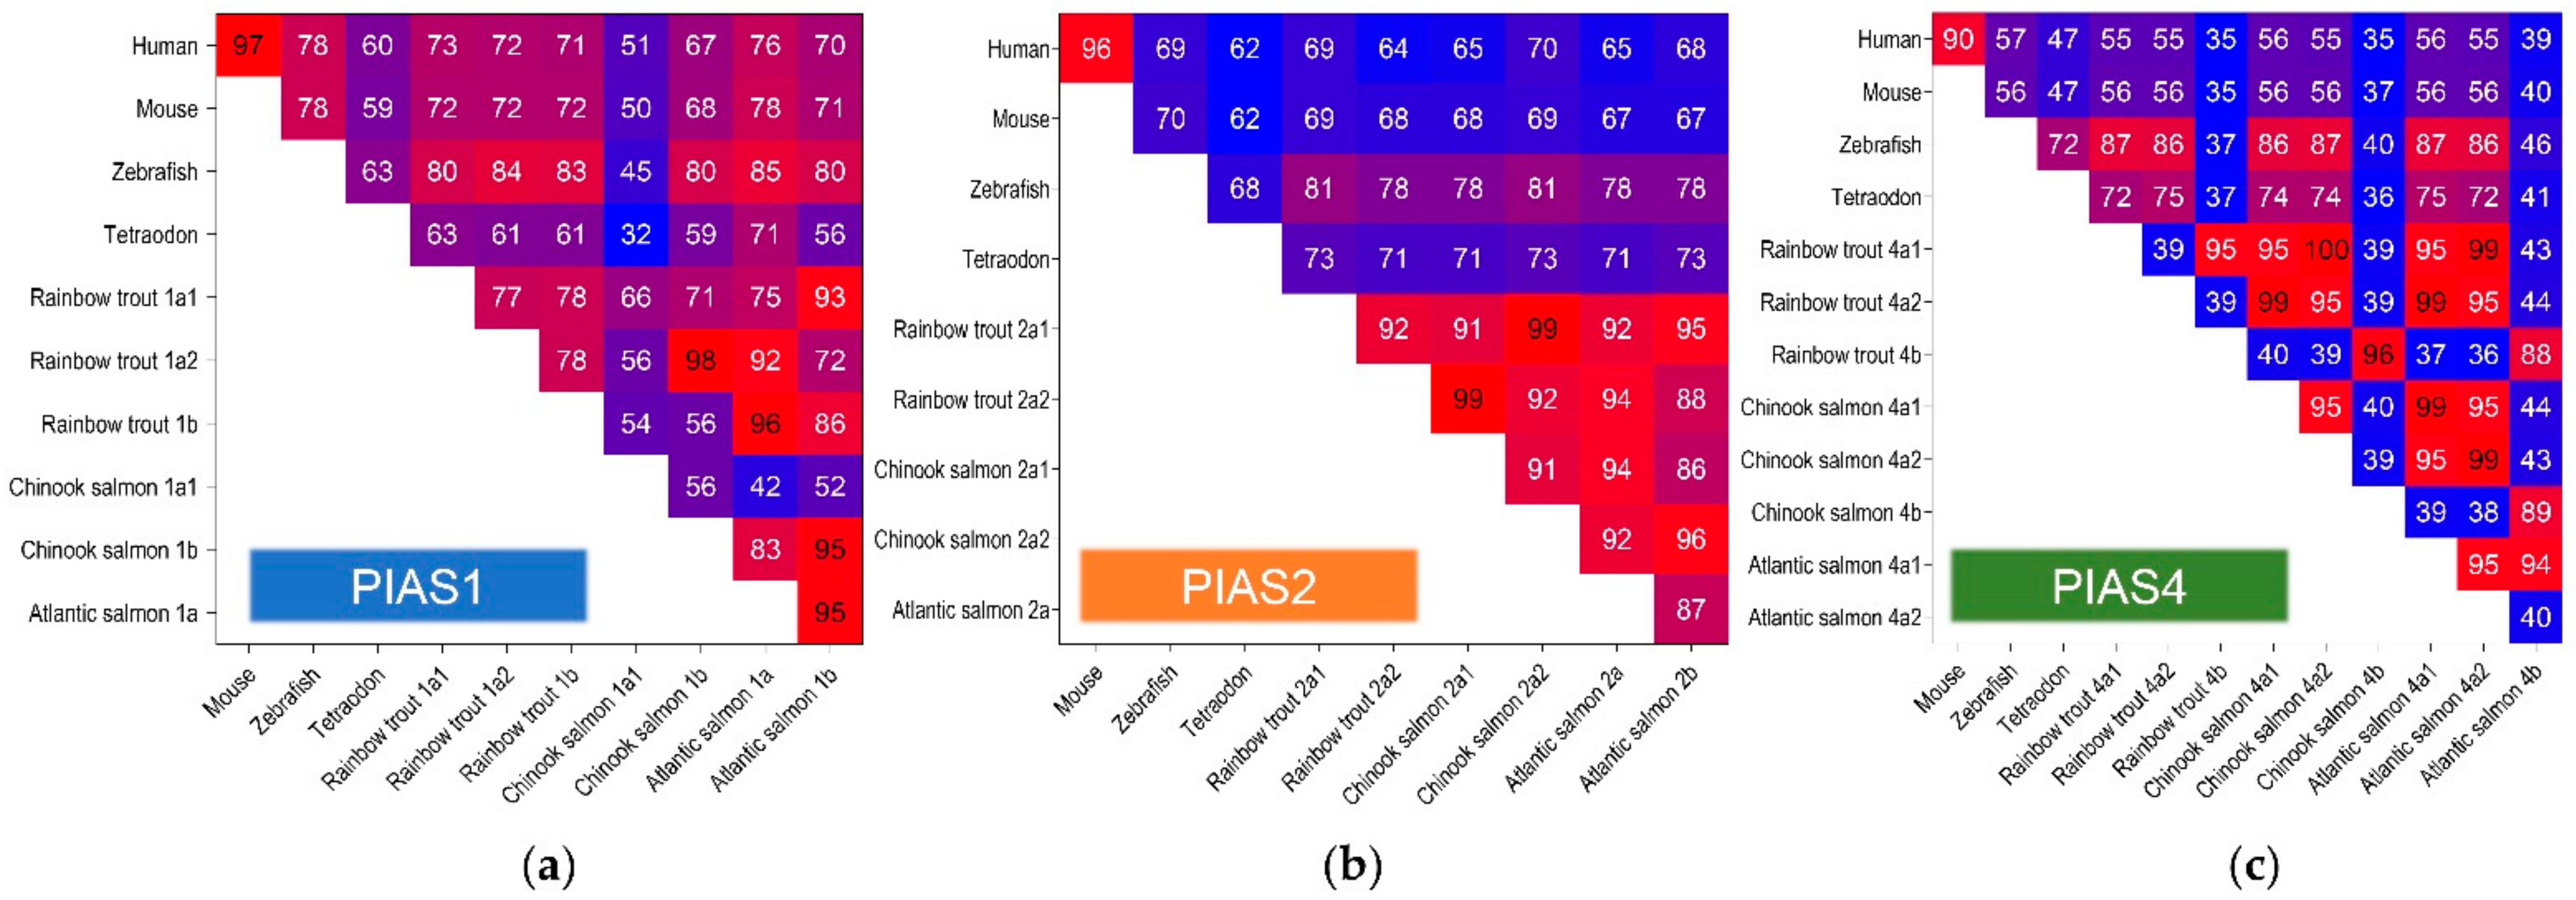
2.1. PIAS Genes Are Present as Multiple Gene Copies in Rainbow Trout and Chinook Salmon

We searched the NCBI gene database for orthologues encoding ‘protein inhibitors of activated STAT’ in two Oncorhynchus species: rainbow trout (O. mykiss) and Chinook salmon (O. tshawytscha). The PIAS-encoding genes pias1, pias2, and pias4 were available, whereas a pias3 orthologue was absent not only in the Oncorhynchus spp., but in all teleostean species. Notably, all three PIAS orthologues in the Oncorhynchus spp. were present as multiple gene copies on eight chromosomes in rainbow trout (Table 1), similar to Chinook salmon. A synteny analysis allowed us to deduce the ancestry of the pias genes (Figure 2). Pias1 genes are characteristically located adjacent to skor1 across the analysed vertebrate species, except for Chinook salmon (Figure 2a). The common adjacency to morf4l1 and uaca indicates that the two pias1 genes on chromosomes 26 and 30 of rainbow trout are ohnologues, pias1a1 and pias1a2. Pias1 on chromosome 2 is flanked by a different set of genes, suggesting that this is a paralogue of pias1a1 and pias1a2 and should be termed pias1b. The pias2 genes on chromosomes 6 and 11 of rainbow trout are both in close proximity to npr3, arid3a, and bmp3, indicating a common origin (Figure 2b). The two ohnologous genes should be referred to as pias2a1 and pias2a2. We note, in this context, that none of the genes flanking the mammalian PIAS2 are located near their teleostean orthologues. All pias4 genes are flanked by map2k2 and onecut across the analysed teleost species (Figure 2c). The two pias4 genes on chromosomes 4 and 5 of rainbow trout are both adjacent to zbtb7a and eef2 and should be termed pias4a1 and pias4a2.
Pias4 on chromosome 8 is flanked by a different set of genes, including lingo3, and should thus be termed pias4b. The annotation of the pias genes from Chinook salmon was less obvious, as some genes have not yet been localised.
The lengths of the sequences coding for the three pias paralogues ranged from 1422 bp (pias4b) to 2130 bp (pias1a1, LOC110527003) in rainbow trout (Table 1).
Although the pias-encoding sequences in Chinook salmon are in part shorter, the orthologous sequences from rainbow trout and Chinook salmon share a high level of identity of up to 96% (Figure 3). The identity between salmonid pias genes and their human orthologues ranges between 35% and 76% (Figure 3a–c). PIAS1 shares the highest degree of identity across vertebrate species (Figure 3a), while PIAS4 is less well conserved across vertebrates (Figure 3c).
The overall architecture of PIAS proteins is well conserved across vertebrates (Figure 4).
All Pias variants identified in rainbow trout contain the PINIT motif, followed by the SP-RING and SIM domain. A KxKELYRRR motif (amino acid (aa) residues 56–64, Pias1a) and the nucleoplasmin nuclear targeting signal (KK(x)9KK) are signatures of nuclear proteins (aa 373–384, Pias1a; aa 358–369, Pias1b) and characterize the Pias orthologues from Oncorhynchus sp. (Figure S1). Some of the analysed variants diverge significantly from the canonical Pias structure. The N-terminal SAP domain is present in all Pias1 aa sequences (Figure 4a, Figure S1), but is absent in Pias2a1 (Figure 4b, Figure S2) and the two Pias4b ohnologues (Figure 4c, Figure S3) from rainbow trout. While a centrally located NLS is included in the SP-RING domain of all Pias proteins of rainbow trout, the N-terminal located NLS is absent in Pias2a1 and all Pias4 paralogs of rainbow trout. In addition, all Pias4 protein variants of rainbow trout lack the S/T-rich region (Figure 4c, Figure S3), which is present in Pias1 and Pias2.
Notably, the Oncorhynchus Pias1b sequences are elongated at the N-terminus by a stretch of six amino acid residues, but this is absent in the mammalian counterpart (Figure S1). Conversely, more than 30 amino acid residues at the N-terminus extend the human Pias2 sequence (Figure S2). No signal peptide has been predicted for any Pias sequence from Oncorhynchus sp., but several disorder regions are present and are mostly located at positions conserved across vertebrate species (Figure S4).
The three-dimensional reconstructions of the three Pias factors from rainbow trout (Figure 4d–f) illustrate the well-conserved tertiary structure of the particular domains. The characteristics of the domains that are critical for nuclear localisation, SUMOylation, and zinc finger activity are located in a similar configuration to those observed in their human counterparts [38].

2.2. The Expression of Pias Genes Is Tissue and Cell-Type Specific

We used qRT-PCR to quantify the transcript levels of ten pias gene and transcript variants in all the selected tissues (brain, gills, head kidney, liver, muscle, spleen, and trunk kidney) of adult rainbow trout (Figure 5a–g). The pias gene variants did not show a uniform expression pattern; instead, they were regulated in a tissue-specific manner. Pias1a2 was the dominantly expressed pias transcript variant (0.9 to 2.9 × 10³ transcripts/µg RNA) in gills, liver, spleen, head kidney, and trunk kidney, while its paralogue pias1b was the dominant pias transcript in the brain (2.7 × 10³ transcripts/µg RNA) (Figure 5a). In muscle, the overall pias transcript levels were low, with pias4b.2 as the major pias transcript (1.4 × 10³ transcripts/µg RNA) (Figure 5e).
As a complement to our qPCR measurements in the whole tissues, we also analysed the levels of the various pias transcript variants in four cell models: (i) the secondary cell line CHSE-214, a model for functional studies of our pias constructs; (ii) freshly isolated head-kidney cells from rainbow trout; (iii) a non-myeloid (mAb21N) fraction enriched with T- and B-lymphocytes, natural killer-like cells, and thrombocytes; and (iv) a myeloid (mAb21P) fraction enriched with dendritic cells, granulocytes, and monocytes/macrophages from the head kidney of rainbow trout (Figure 5h–k). Strikingly, the model cells revealed considerable transcript levels of pias4a2 (>1 × 10³ transcripts/µg RNA), which was more or less absent in the whole tissues previously analysed. By contrast, pias4a1.2 was constitutively expressed in all the selected tissues but was almost absent in the cell models. The pias4a1.1 transcript variant was absent or present at an undetectable level (<20 transcripts/µg RNA in the liver) across all analysed tissues and cell models. The expression of pias4b was also not detected in the CHSE-214 cells (Figure 5h). Despite this observation, the expression of the pias1 and pias2 transcript variants in CHSE-214 was roughly comparable to that of the head kidney, with pias1a2 as the most strongly expressed variant (3.3 × 10³ transcripts/µg RNA). The primary head-kidney cells had over 50% higher expression of various pias genes (pias1a1, -1b, -2a1, -2a2) compared with CHSE-214 cells. The expression of pias genes was even stronger in the non-myeloid cell fraction (up to 1.2 × 10⁵ pias transcripts/µg RNA).
In the head-kidney cells and the non-myeloid cells, pias2a2 was the most strongly expressed pias gene (>6.0 × 10³ transcripts/µg RNA), while the pias4a2 gene was most strongly expressed in the myeloid cell fraction (5.6 × 10⁴ transcripts/µg RNA).
We also quantified the expression of three stat1 genes (Figure 6a–k), which are targeted by activated Pias factors. Overall, the qPCR expression data provided no obvious evidence for co-expression of stat and pias genes, as the transcript levels of stat1a1 and stat1a2 uniformly dominated over the stat1b1 levels across all the tissues and cell models investigated.
In general, the expression levels of the three stat1 genes were highest in the leukocytes enriched with myeloid cells (1.1 × 10⁵ stat1a1 transcripts/µg RNA), as observed for pias expression. Remarkably, the transcript level of the three stat genes exceeded the pias levels, in general, by approximately 10-fold. Moreover, the expression levels of the three stat1 genes were roughly 10 times lower in CHSE-214 cells than in the primary head-kidney leukocytes.

2.3. Pias1 and Pias2 Are Located in the Nucleus of Model Cells and Interact with NF-κB to Alter Transcriptional Responses

The prominent expression of pias1 and pias2 in CHSE-214 cells (Figure 5h) suggested that a CRISPR/Cas9 strategy might knock out both genes in the CHSE-214-derived cell line CHSE-EC [39]. The specific short guide (sg) RNA targets were located 20 bp upstream of the neighbouring ‘protospacer adjacent motif’ in exon 2 on pias1, in the first exon on pias2, and in the mEGFP (monomeric enhanced green fluorescence protein) gene. Cell sorting selected 48 GFP-negative single cells (Figure 7a), but only about 30 single cells generated a clonal cell line for each experiment. We sequenced the first 300 nt of the mEGFP gene and the sgRNA target exon of both pias genes. All sequenced clones had a deletion of one nucleotide in the ORF of the mEGFP gene, resulting in a frameshift and gene disruption (Figure 7b). Despite this observation, none of the mEGFP-negative clonal cell lines were mutated for the pias1 or pias2 genes. This suggests that the CRISPR/Cas9 system basically worked in CHSE-EC cells, and we can only speculate that a knock-out of the genes of interest might have been lethal for the cell [8]. In-silico analysis at DepMap Portal (https://depmap.org/; accessed on 1 October 2021) supports this assumption, since human PIAS2 and PIAS4 genes were designated as strongly selective.
Since the knock-out of both pias1 and pias2 genes failed, we selected three pias sequences for overexpression in the CHSE-214 cell model based on their explicit structural differences (cf. Figure 4a,b). Pias1 (709 aa) largely corresponds to the human orthologue, and Pias2 (508 aa) lacks the SAP domain and one of the two NLS, while the truncated Pias1 variant (233 aa) contains only the SAP domain and the respective NLS. Confocal microscopy revealed that full-length Pias1 and Pias2 from rainbow trout (both flagged with green fluorescent protein, GFP) apparently shared the same subcellular localisation in the nucleus of unchallenged or stimulated cells (Figure 8a,b) as the human orthologue [23,40]. Remarkably, Pias1 was more homogeneously distributed across the nucleus, while Pias2 was located at distinct nuclear spots.
The functions of the three Pias variants were explored by transient overexpression in CHSE-214 cells in separate approaches, together with a luciferase-reporter construct under the control of either (i) a rainbow trout mx promoter with an interferon-stimulating response element [41,42] or (ii) a human NF-κB-responsive ELAM (endothelial cell-leukocyte adhesion molecule) promoter [43]. Co-transfection with a construct expressing the ifnγ (encoded by the ifng gene, LOC100136413; NCBI acc. #AY795563) from Atlantic salmon, Salmo salar, simulated antiviral immune responses involving the production and secretion of ifnγ and the subsequent activation of the jak-stat pathway. The endogenous ifnγ synthesis induced a significant four-fold increase in the NF-κB promoter activity and approximately a two-fold increase in the mx promoter activity (both set as 1.0 in Figure 8c,d) over cells not transfected with the ifnγ-expression construct.
In cells that co-expressed one of the three Pias factors and the mx-reporter construct, we observed that neither different concentrations of transfected Pias-expressing vectors nor the additional endogenous expression of ifnγ affected the reporter-gene activity (Figure 8c). By contrast, we detected a significantly reduced reporter-gene activity in cells co-expressing one of the three Pias factors and the ELAM-reporter construct (Figure 8d). The use of 50 ng and more of Pias1-expression vector, 500 ng and 2000 ng of Pias2-expression vector, and 2000 ng of truncated Pias1-expression vector reduced the reporter-gene effectivity down to at least 0.6 (with p < 0.01). In other words, 50 ng of vectors expressing either Pias2 or truncated Pias1 were ineffective. The cells producing endogenous ifnγ underwent a similar Pias-induced effect, but this effect was not significantly different from that observed in unstimulated cells that did not produce ifnγ.
Having established that the three analysed Pias factors affected NF-κB activity, we used qPCR to test whether the overexpression of Pias1, truncated Pias1 or Pias2 modulates the transcription of a panel of early immune genes, which are regulated by the crosstalk of NF-κB and stat factors (cf. Figure 1b).
Ifnγ expression resulted in a ~two-fold increase in mx transcript levels and a slight, but significant, reduction in the ifna1 transcript levels (Figure 9a). The use of 500 and 2000 ng of Pias1 and Pias2 both caused a 2.1- to 4.2-fold decrease in il6 transcripts. The highest concentration of Pias2 also caused a significant decrease in il10, ifna3, and stat4 copies by 1.6- to 2.0-fold. Of note, tgfb was the only gene that was significantly (two-fold) upregulated in concentration after the addition of 2000 ng of Pias1 (Figure 9a). The addition of 50 ng or 500 ng of Pias1 or truncated Pias1 from rainbow trout only slightly modulated the concentration of mx transcripts, but the addition of 2000 ng of one of the three Pias factors caused a strong decrease of more than ten-fold. The use of 500 ng of Pias2 also significantly (7.4-fold) lowered the number of mx transcripts. Altogether, 2000 ng of Pias2 downregulated the transcript levels of eight studied genes (cxcl8, tgfb, il10, il6, ifna1, ifna3, stat4, and mx) to a greater or lesser extent; therefore, we determined the mRNA concentration of four additional genes (gata3, mmp9, socs1, and tp53; cf. Figure 1b, [7]). The use of 2000 ng of Pias2 also reduced the transcript levels of mmp9, gata3, and socs1 by 1.9- to 3.3-fold, while the levels of tp53 remained unchanged (Figure 9b).

3. Discussion

PIAS proteins interact with more than 60 different proteins linked with transcriptional processes [23,24,25] and fine-regulate not only the STAT-dependent pathway but also NF-κB-signalling. Four different Pias proteins are encoded in humans, whereas PIAS3 has been lost in fish. In the present study, we found eight Pias-encoding genes in Oncorhynchus sp., and these likely result from two additional genome duplications in teleosts [44] and salmonids [45]. These eight genes encode at least 14 different pias transcripts. We speculate that the fish-specific and salmonid-specific duplications expanded the pias gene family in fishes by additional members, thereby compensating for the loss of PIAS3. The question that remains is why the number of Pias proteins in trout is still twice as high as that in humans.
In previous studies, we inspected the diversity of ohnologue and paralogue genes in salmonid fish that encode immune inhibitors [14]. We repeatedly found that structural modifications of the protein may fundamentally impact its function [46,47]. However, all three Pias1 proteins from rainbow trout strongly resemble the prototypical PIAS architecture of their human orthologue. This structural conservation suggests that the three Pias1 proteins from rainbow trout are functionally homologous to their counterparts in other vertebrates. One of the two Pias2 proteins from trout also resembles human PIAS1, while its paralogue and one of the Pias4 paralogues lack the SAP domain and one NLS. Similarly, all Pias4 proteins from trout lack the ST-rich region (as their mammalian counterparts), which is vital for the pleiotropic interactions associated with SUMO. Confocal microscopy provided evidence that Pias1 (with its SAP domain and two NLS) and Pias2 (without a SAP domain and with only one NLS) differentially localise in the nucleus. The ‘dot-like signatures’ of Pias2 from trout have also previously been observed for Pias4 from zebrafish [34]. Mammalian PIAS proteins interact with different (sets of) other (transcription) factors [48,49]. The dissimilar localisation of Pias1 and Pias2 from trout probably results from their cooperation with different sets of proteins that bind to distinct nuclear structures. The LxxLL motif, in particular, has been established to interact with nuclear receptors and co-receptors [49]; this motif is present in Pias1 but missing in Pias2 from rainbow trout.
Expression profiling of the individual pias variants from trout provided further evidence of their sub-functionalisation. While the stat1 transcripts were expressed in relatively similar ratios to each other across the tissues analysed, the pias transcripts showed a rather tissue-specific expression pattern. Although pias1a1 is the predominantly expressed gene in most tissues and cell fractions, the pias4 transcripts, which do not encode an ST-rich region, dominated in muscle and in cell fractions enriched with dendritic cells, granulocytes, and monocytes/macrophages. The non-myeloid cell fraction contained mostly pias2a2 transcripts, which are structurally quite similar to the pias1a1 transcripts. The non-myeloid fraction is enriched with lymphocytes and thrombocytes and may also contain hematopoietic progenitor cells. The murine PIAS1 pathway has been reported to regulate self-renewal and differentiation of hematopoietic stem cells [50]. Therefore, the role of pias1 and pias2 in immunity and haematopoiesis remains an open topic for research in trout. The myeloid cell fraction expressed the highest levels of pias transcripts in general, thereby underpinning the importance of the Pias factors in immunophysiology.
Functional in vitro studies on Pias proteins in a non-mammalian model have only been carried out for Pias4 from zebrafish [34] to date. Therefore, we restricted our studies to one representative of Pias1 and Pias2 from rainbow trout and a truncated variant of Pias1 for comparative purposes. Since our expression studies on the salmonid fish cell model revealed that all transcript variants of both pias1 and pias2 were abundantly detectable, our aim was to knock out both factors using CRISPR/Cas9 technology. Since this approach was not successful, we were left with overexpression, a well-established method [51], to gain first insights into the function of trout Pias factors.
Both Pias1 and Pias2 from rainbow trout reduced the basal activity of NF-κB in unstimulated cells to a similar extent and in a dose-dependent fashion. This was not expected, as St2/Il1rlL1, another established inhibitor of NF-κB signalling, failed to modulate the basal level of NF-κB in our previous in vitro experiments in rainbow trout [52]. However, a study on murine PIAS1 has pointed to its potential to reduce NF-κB activity in a dose-dependent manner [23]. Murine PIAS1 directly interferes with the binding of NF-κB p65 to its corresponding response elements [48], and this mechanism is apparently conserved in fish. Interestingly, both Pias1 and Pias2 were similarly efficient in lowering the level of activated NF-κB, even though Pias2 lacks the SAP domain with the intrinsic LxxLL motif. A point worth mentioning in this context is that the expression of a mammalian PIAS3 mutant with point mutations in the LxxLL motif also did not interfere with the NF-κB activity [31].
In contrast to NF-κB-dependent promoters, Pias1 and Pias2 from rainbow trout did not modulate the activity of a trout mx promoter. Mx is a potent effector of antiviral defence [53]. We observed that overexpressed pias1, pias2 and truncated pias1 from trout strongly reduced the transcript level of mx in ifnγ-expressing cells. Apart from this effect, the truncated Pias1 variant did not modulate the transcript levels of any of the selected immune genes. Pias1 and, to a lesser extent, Pias2 lowered the transcript level of il6. In this regard, we note that the JAK-STAT signalling pathway is also known as the IL6 signalling pathway [54], as IL6 activates the cascade and thus also regulates its own expression. In contrast to the full-length and truncated Pias1 variants, Pias2 also reduced the transcript levels of several other NF-κB-dependent genes (ifna3, stat4, and il10) and, beyond those, the STAT-dependent genes socs1, gata3, and mmp9. These apparently different efficiencies in expression regulation likely reflect another consequence of the structural differences between Pias1 and Pias2 from trout. Previous studies have demonstrated that the overexpression of PIAS proteins enhanced the SUMOylation of nuclear receptors [55]. Since Pias1 and Pias2 from trout contain the required SP-RING and SIM domains, both should be capable of transferring SUMO proteins and thus altering the activity of transcription factors. The SAP domain is crucial for the translocation of transcription factors to the nuclear periphery [18], and for this reason, only Pias1, but not Pias2, from trout should be capable of an alternative regulatory mechanism that does not involve SUMO tags.
In conclusion, this study provides evidence for the multiplication of pias genes and their sub-functionalisation during salmonid evolution. For the functional analysis, we largely relied on the widely used CHSE-214 cell line. We note, in this regard, that this model cell is characterised by certain immunocompetence [56,57], although it cannot represent the complex interactions of different cell populations that tailor immune responses in vivo. For this reason, the CHSE cell line is a helpful tool, but it alone is not sufficient to map out the multiple functions of the Pias factors. Subsequent studies may investigate the influence of Pias proteins from trout using different immune cell subsets and in vivo.

4. Materials and Methods

4.1. Sampling and Cell Sorting

Rainbow trout (O. mykiss) were obtained from a local commercial fish farm ‘Forellenzucht Uthoff GmbH’, Neubrandenburg (Germany). Four fish were euthanised using an overdose of benzocaine (100 mg/L, Sigma-Aldrich/Merck, Steinheim, Germany) in compliance with the relevant European guidelines on animal welfare (Directive 2010/63/EU on the protection of animals used for scientific purposes) and were approved by the institute’s ethics board (approval ID: FLI 28/17). For the preparation of leukocyte suspensions, head kidneys were homogenized separately in 5 mL of 1% newborn calf serum (NCS)/phosphate-buffered saline (PBS) buffer (FB buffer). Cell suspensions were centrifuged at 4 °C at 290 g for 5 min and then resuspended in 3 mL FB. A Percoll gradient to discard erythrocytes was prepared as described previously [58]. One million leucocytes were labelled for 30 min at 4 °C with the monoclonal antibody 21 (mAb21, [59]), which recognises cells from a myeloid lineage. Thereafter, the cells were washed by centrifugation at 300× g and 4 °C for 5 min in 700 µL MACS Buffer (Miltenyi Biotec, Bergisch Gladbach, Germany). The pellet was resuspended in 200 µL of secondary antibody solution containing anti-mouse IgG-conjugated magnetic beads (Miltenyi Biotec), followed by a 30 min incubation at 4 °C and a final washing step. The cells were resuspended in 500 µL MACS buffer (Miltenyi Biotec, Germany) and placed into ice-cold racks to perform the magnetic separation in the autoMACS Pro Separator (Miltenyi Biotec). The sorting was conducted using the Possel_S program. After the separation, the enriched (mAb21-positive) cell fraction consisted of >95% myeloid cells, and the depleted (mAb21-negative) fraction consisted mostly of B- and T-lymphocytes, as well as thrombocytes. Both fractions were centrifuged, and the resulting pellets were resuspended in 350 µL RLT lysis buffer (Qiagen, Hilden, Germany) for RNA extraction and gene expression analysis.

4.2. RNA Isolation, cDNA Synthesis, and Quantitative PCR (qPCR) Analysis

RNA was isolated from the brain, gills, head kidney, trunk kidney, liver, muscle, and spleen of rainbow trout first with TRIzol (Thermo Fisher Scientific, Bremen, Germany) and then with the RNeasy Mini Kit (Qiagen), including an in-column DNase treatment for 30 min. For RNA isolation from cells, we used the ISOLATE II RNA Micro Kit (Bioline/Meridian Bioscience, Luckenwalde, Germany). RNA quantity was determined with a NanoDrop Onec (Thermo Fisher Scientific), and the integrity was assessed by agarose-gel electrophoresis. Total RNA was reverse-transcribed using a SensiFAST cDNA Synthesis Kit (Bioline/Meridian Bioscience).
The expression of (a) paralogues and ohnologues of pias genes in different tissues and cells of Oncorhynchus and (b) various immune genes in CHSE-214 cells transfected with pias-expressing vectors was profiled by establishing a panel of oligonucleotides (Table 2) using the Pyrosequencing Assay Design software (v.1.0.6; Biotage, Uppsala, Sweden) to amplify specific fragments between 95 and 195 bp.
The cDNA input into the individual RT-qPCR assays was equivalent to 2.5 ng total RNA isolated from cells and 75 ng total RNA isolated from tissues. The analyses were conducted with a LightCycler 96 instrument (Roche, Mannheim, Germany) using a SensiFAST SYBR No-ROX Kit (Bioline/Meridian Bioscience). Melting curve analyses validated the amplification of distinct products. In addition, we validated the size and quality of the PCR products on 1.5% agarose gels. Standard curves were generated based on the crossing points of 10-fold dilutions containing 103 to 106 copies of a PCR-generated standard fragment. The copy number was calculated for each fragment based on linear regression of the standard curve and relative to the amount of input RNA. Each expression value of the target genes was divided by the geometric mean of the reference genes eef1a1 (eukaryotic translation elongation factor) [60] and rps5 (ribosomal protein S5) [61].

4.3. Construction of Pias Expression Constructs

We amplified the open reading frames (ORF) of trout pias1a1.1 (XM_036963708) and pias2a1 (XM_036936540) using the oligonucleotide primers listed in Table 2. To this end, we performed standard PCRs using the Platinum Taq High-Fidelity DNA Polymerase (Thermo Fisher Scientific). The resulting amplicon was subcloned into pGEM-T Easy (Promega, Walldorf, Germany), retrieved by digestion with the restriction enzymes HindIII and EcoRI, and inserted into the mammalian expression vector v280 that had been previously double-digested with the above restriction enzymes. The resulting plasmids (v280_pias1, v280_pias2) were used for functional analyses.
We identified the subcellular localisation of Pias1 and Pias2 from rainbow trout by inserting the respective sequences in an expression vector flagged with green fluorescent proteins (GFP). In detail, we inserted a fragment coding for GFP at the 3‘-end of the CDS of the v280_pias1 and _pias2 plasmid. The GFP fragments had previously been amplified from commercial vectors (GFP: pAM505, NCBI-nucleotide accession code: AF140578) and inserted into the v280 clone [47,62] using the restriction sites for HindIII and EcoRI. The truncated pias1 variant was produced by digesting the GFP-v280_pias1 plasmid with BamHI to cut off 1357 bp of the downstream ORF. The two BamHI restriction sites (GGATCA and GGATCC) were located at positions 609 to 611 in the ORF of pias1 and immediately downstream of the GFP sequence. The ends of the linearised plasmid were subsequently joined using the T4 ligase (Promega).

4.4. Transfection, Luciferase Assay, and Confocal Microscopy

Endotoxin-free preparations (ZymoPure II Plasmid Maxi Prep Kit, ZymoResearch/Biozol, Eching, Germany) of the expression constructs for pias1, pias2i, and truncated pias1 were transfected into CHSE-214 cells (Chinook salmon embryo-214; order ID: 91041114-1VL, Sigma-Aldrich/Merck) using the X-tremeGENE HP DNA Transfection Reagent (Roche). For co-transfection assays in six-well plates, we used 50 ng of the ELAM or the mx promoter constructs and increasing concentrations (50, 500, and 2000 ng) of the respective pias-expression construct. Three wells of each row were left as unstimulated controls, while the other three were additionally co-transfected with 50 ng of a vector coding for ifnγ [63]. The total DNA concentration of each transfection mixture was adjusted to 2500 ng/assay by adding the empty cloning vector. Finally, the luciferase activity of the cell lysates was measured with the Dual-Luciferase Reporter Assay System (Promega) with a Lumat LB9501 luminometer (Berthold, Bad Wildbad, Germany). Values were normalised against the protein concentration of the CHSE-214 cell extracts. Each transfection was assayed in triplicate; each transfection experiment was performed three times.
CHSE-214 cells transfected with the vector expressing GFP-tagged pias1 or pias2 from rainbow trout were fixed with 4% paraformaldehyde (Merck KGaA, Darmstadt, Germany) and subsequently inspected by confocal microscopy (LSM 780; Carl Zeiss Microscopy, Jena, Germany), equipped with a 63× oil-immersion DIC objective. For staining the nuclei, Hoechst 33342 dye (1 mg/mL; Sigma-Aldrich/Merck) was added to the medium 30 min before fixation.

4.5. Strategy for the Generation of a Pias-Knock-Out Cell Line

The genetically modified CHSE cell line CHSE-EC that stably expresses Cas9 and monomeric enhanced green fluorescence protein (mEGFP) [39] was chosen as the terminus a quo for this study. These cells were grown at 20 °C in Eagle Minimal Essential Medium with Earle’s salts (MEM) (Sigma-Aldrich) supplemented with 500 mg/mL G418 (Sigma-Aldrich), 30 mg/mL hygromycin (Thermo Fisher Scientific), 100 U/mL penicillin, 100 µg/mL streptomycin, 1% non-essential amino acids (NEAA; Biochrom AG), 2 mM L-glutamine (Biochrom AG), and 10% foetal bovine serum (FBS; Thermo Fisher Scientific).
Each sgRNA was designed on the first 100 nt of the coding sequence. The sgRNAs were synthesised using a 120 nt blunt-ended oligo (Sigma Aldrich/Merck) as a template and a RiboMAX Express T7 kit (Promega). The resulting product was purified using TRIzol (Thermo Fisher Scientific), then resuspended in RNAse-free and DNAse-free water and quantified with a NanoDrop One© (Thermo Fisher Scientific) before the transfection.
CHSE-EC cells were transfected with 100 ng mixed sgRNA (Table 2), together with 100 ng sgRNA targeting the mEGFP per 10 µL of cell suspension as previously described [39]. Transfected cells were plated onto a 25 cm2 flask and passaged weekly for 4 weeks. The mEGFP-negative cells were suspended in 2 mL MEM and sorted using a MoFlo XDP high-speed cell sorter (Beckman Coulter, Krefeld, Germany) with an incorporated air-cooled Coherent Sapphire laser (488 nm, 100 mW). The cells were sorted through a 70 μm nozzle at 60 psi in purify mode into 24-well plates and cultured with 1 mL MEM, weekly renewed for 4 months. The genomic DNA of CHSE-EC cells was isolated using DNeasy Blood & Tissue Kits (Qiagen) following the standard protocol. Sequencing primers (Table 2) were used to validate the success of the KO strategy.

4.6. Data Analysis

A parametric t-test or nonparametric Mann-Whitney U-test and GraphPad Prism software v.9 for macOSX were used to evaluate the statistical significance of the qRT-PCR data and reporter-gene measurements.
Alignment and phylogenetic reconstructions were performed to compare multiple Pias nucleotide and amino acid (aa) sequences using the ‘build’ function of ETE3 v3.1.1, as implemented on the GenomeNet site (https://www.genome.jp/tools/ete/, accessed on 1 March 2021) [64]. The tree was constructed using fasttree (with slow NNI and MLACC=3) to make the maximum-likelihood NNIs more exhaustive [65]. The gene synteny was determined using Genomicus v1.01 (https://www.genomicus.bio.ens.psl.eu/genomicus-100.01/cgi-bin/search.pl; accessed on 1 March 2021).
The three-dimensional structure was obtained using UCSF ChimeraX, offered as free software (http://www.rbvi.ucsf.edu/chimerax, accessed on 1 March 2021) [66]. Signal peptides were predicted using SignaIP-5.0 (http://www.cbs.dtu.dk/services/SignalP/ accessed on 1 March 2021). Disordered protein regions were predicted using PrDOS [67] (http://prdos.hgc.jp/cgi-bin/top.cgi accessed on 1 March 2021). An upstream analysis was performed using the Ingenuity program (Ingenuity Pathway Analyses/Qiagen accessed on 1 June 2021) to evaluate the target genes of STAT/NF-κB-dependent signalling.

Supplementary Materials

The following are available online at https://www.mdpi.com/article/10.3390/ijms222312815/s1.

Author Contributions

Conceptualisation, A.R., F.S. and B.C.; methodology, B.C., A.R. and B.K.; investigation, F.S., S.K., R.M. and H.R.; writing—original draft preparation, F.S. and S.K.; writing—review and editing, A.R.; visualisation, F.S. and A.R.; supervision, A.R., B.C., T.G. and B.K.; project administration, B.K. and T.G.; funding acquisition, B.K. and T.G. All authors have read and agreed to the published version of the manuscript.

Funding

This work was financed by the European Maritime and Fisheries Fund (EMFF) and the Ministry of Agriculture and the Environment of Mecklenburg-Western Pomerania, Germany (Grant #: MV-II.1-LM-004). R.M. was financed by the Scholarship Becas Chile-DAAD: Doctoral scholarship with bilateral agreement abroad CONICYT-DAAD. The publication of this article was funded by the Open Access Fund of the FBN.

Institutional Review Board Statement

The study was conducted according to the guidelines of the Declaration of Helsinki and was approved by the Institutional Ethics Board (approval ID: FLI 28/17).

Informed Consent Statement

Not applicable.

Data Availability Statement

The pias-cDNA sequences and associated metadata have been submitted to the ‘European Nucleotide Archive’ under accession number PRJEB47768.

Acknowledgments

Christian Plinski, Luisa Falkenthal, Ingrid Hennings and Brigitte Schöpel are greatly acknowledged for their excellent technical assistance. We thank Ulrike Gimsa and Torsten Viergutz (both FBN) for helpful discussions.

Conflicts of Interest

The authors declare no conflict of interest.

Abbrevations

Aa, amino acid(s); CDS, coding sequence; CHSE, Chinook salmon embryo; CRISPR, clustered regularly interspaced short palindromic repeats; ELAM, endothelial cell-leukocyte adhesion molecule; GFP, green fluorescent protein; hpi, hours post infection; IFN, interferon; JAK, Janus kinase; LG, linkage group; mEGFP, monomeric enhanced green fluorescence protein; NCS, newborn calf serum; NF-κB, nuclear factor kappa-light-chain-enhancer of activated B cells; nt, nucleotide(s); PBS, phosphate-buffered saline; SAP, scaffold attachment factor A/B/acinus/PIAS; sgRNA, short guide RNA; SIM, SUMO-interacting motif; SP-RING, Siz/PIAS RING finger; STAT, signal transducer and activator of transcription; TNF, tumour necrosis factor; WGD, whole-genome duplication.

References

  1. Wilks, A.F. Two putative protein-tyrosine kinases identified by application of the polymerase chain reaction. Proc. Natl. Acad. Sci. USA 1989, 86, 1603–1607. [Google Scholar] [CrossRef] [PubMed] [Green Version]
  2. Rane, S.G.; Mangan, J.K.; Amanullah, A.; Wong, B.C.; Vora, R.K.; Liebermann, D.A.; Hoffman, B.; Graña, X.; Reddy, E.P. Activation of the Jak3 pathway is associated with granulocytic differentiation of myeloid precursor cells. Blood 2002, 100, 2753–2762. [Google Scholar] [CrossRef] [PubMed] [Green Version]
  3. Rawlings, J.S.; Rosler, K.M.; Harrison, D.A. The JAK/STAT signaling pathway. J. Cell Sci. 2004, 117, 1281–1283. [Google Scholar] [CrossRef] [PubMed] [Green Version]
  4. Bousoik, E.; Aliabadi, H.M. “Do We Know Jack” About JAK? A Closer Look at JAK/STAT Signaling Pathway. Front. Oncol. 2018, 8, 287. [Google Scholar] [CrossRef] [PubMed] [Green Version]
  5. Laurence, A. JAK Kinases in Health and Disease: An Update. Open Rheumatol. J. 2012, 6, 232–244. [Google Scholar] [CrossRef]
  6. Gilmore, T.D.; Wolenski, F.S. NF-κB: Where did it come from and why? Immunol. Rev. 2012, 246, 14–35. [Google Scholar] [CrossRef]
  7. Hiroi, M.; Ohmori, Y. Transcriptional Synergism between NF-κB and STAT1. J. Oral Biosci. 2005, 47, 230–242. [Google Scholar] [CrossRef]
  8. Platanitis, E.; Decker, T. Regulatory Networks Involving STATs, IRFs, and NFκB in Inflammation. Front. Immunol. 2018, 9, 2542. [Google Scholar] [CrossRef] [Green Version]
  9. Murphy, J.M.; Tannahill, G.M.; Hilton, D.J.; Greenhalgh, C.J. The Negative Regulation of Jak/stat Signaling, 2nd ed.; Elsevier Inc.: Amsterdam, The Netherlands, 2010. [Google Scholar] [CrossRef]
  10. Landsman, T.; Waxman, D.J. Role of the Cytokine-induced SH2 Domain-containing Protein CIS in Growth Hormone Receptor Internalization. J. Biol. Chem. 2005, 45, 37471–37480. [Google Scholar] [CrossRef] [Green Version]
  11. Feng, G.S.; Hui, C.C.; Pawson, T. Sh2-containing phosphotyrosine phosphatase as a target of protein-tyrosine kinases. Science 1993, 259, 1607–1611. [Google Scholar] [CrossRef]
  12. Kiu, H.; Nicholson, S.E. Biology and significance of the JAK/STAT signalling pathways. Growth Factors 2012, 30, 88–106. [Google Scholar] [CrossRef] [Green Version]
  13. Shuai, K.; Liu, B. Regulation of JAK-STAT signalling in the immune system. Nat. Rev. Immunol. 2003, 3, 900–911. [Google Scholar] [CrossRef]
  14. Rebl, A.; Goldammer, T. Under control: The innate immunity of fish from the inhibitors’ perspective. Fish Shellfish. Immunol. 2018, 77, 328–349. [Google Scholar] [CrossRef]
  15. Wang, R.; Huang, S.; Fu, X.; Huang, G.; Yan, X.; Yue, Z.; Chen, S.; Li, Y.; Xu, A. The conserved ancient role of chordate PIAS as a multilevel repressor of the NF-κB pathway. Sci. Rep. 2017, 7, 17063. [Google Scholar] [CrossRef]
  16. Liongue, C.; O’Sullivan, L.A.; Trengove, M.C.; Ward, A.C. Evolution of JAK-STAT pathway components: Mechanisms and role in immune system development. PLoS ONE 2012, 7, e32777. [Google Scholar] [CrossRef]
  17. Palvimo, J.J. PIAS proteins as regulators of small ubiquitin-related modifier (SUMO) modifications and transcription. Biochem. Soc. Trans. 2007, 35, 1405–1408. [Google Scholar] [CrossRef]
  18. Kipp, M.; Göhring, F.; Ostendorp, T.; van Drunen, C.M.; van Driel, R.; Przybylski, M.; Fackelmayer, F.O. SAF-Box, a conserved protein domain that specifically recognizes scaffold attachment region DNA. Mol. Cell. Biol. 2000, 20, 7480–7489. [Google Scholar] [CrossRef] [Green Version]
  19. Duval, D.; Duval, G.; Kedinger, C.; Poch, O.; Boeuf, H. The ‘PINIT’ motif, of a newly identified conserved domain of the PIAS protein family, is essential for nuclear retention of PIAS3L. FEBS Lett. 2003, 554, 111–118. [Google Scholar] [CrossRef] [Green Version]
  20. Joazeiro, C.A.; Weissman, A.M. RING finger proteins: Mediators of ubiquitin ligase activity. Cell 2000, 102, 549–552. [Google Scholar] [CrossRef] [Green Version]
  21. Lussier-Price, M.; Mascle, X.H.; Cappadocia, L.; Kamada, R.; Sakaguchi, K.; Wahba, H.M.; Omichinski, J.G. Characterization of a C-Terminal SUMO-Interacting Motif Present in Select PIAS-Family Proteins. Structure 2020, 28, 573–585. [Google Scholar] [CrossRef]
  22. Shuai, K.; Liu, B. Regulation of gene-activation pathways by pias proteins in the immune system. Nat. Rev. Immunol. 2005, 5, 593–605. [Google Scholar] [CrossRef] [PubMed]
  23. Liu, B.; Yang, R.; Wong, K.A.; Getman, C.; Stein, N.; Teitell, M.A.; Cheng, G.; Wu, H.; Shuai, K. Negative Regulation of NF- B Signaling by PIAS1. Mol. Cell. Biol. 2005, 25, 1113–1123. [Google Scholar] [CrossRef] [PubMed] [Green Version]
  24. Liu, B.; Liao, J.; Rao, X.; Kushner, S.A.; Chung, C.D.; Chang, D.D.; Shuai, K.E. Inhibition of Stat1-mediated gene activation by PIAS1. Proc. Natl. Acad. Sci. USA 1998, 95, 10626–10631. [Google Scholar] [CrossRef] [PubMed] [Green Version]
  25. Chung, C.D.; Liao, J.; Liu, B.; Rao, X.; Jay, P.; Berta, P.; Shuai, K. Specific inhibition of Stat3 signal transduction by PIAS3. Science 1997, 278, 1803–1805. [Google Scholar] [CrossRef]
  26. Tussié-Luna, M.I.; Bayarsaihan, D.; Seto, E.; Ruddle, F.H.; Roy, A.L. Physical and functional interactions of histone deacetylase 3 with TFII-I family proteins and PIASx. Proc. Natl. Acad. Sci. USA 2002, 99, 12807–12812. [Google Scholar] [CrossRef] [Green Version]
  27. Sachdev, S.; Bruhn, L.; Sieber, H.; Pichler, A.; Melchior, F.; Grosschedl, R. PIASy, a nuclear matrix-associated SUMO E3 ligase, represses LEF1 activity by sequestration into nuclear bodies. Genes Dev. 2001, 15, 3088–3103. [Google Scholar] [CrossRef] [Green Version]
  28. Liu, B.; Gross, M.; Hoeve, J.T.; Shuai, K. A transcriptional corepressor of Stat1 with an essential LXXLL signature motif. Proc. Natl. Acad. Sci. USA 2001, 98, 3203–3207. [Google Scholar] [CrossRef] [Green Version]
  29. Liu, B.; Yang, Y.; Chernishof, V.; Loo, R.R.O.; Jang, H.; Tahk, S.; Yang, R.; Mink, S.; Shultz, D.; Bellone, C.J.; et al. Proinflammatory stimuli induce IKKalpha-mediated phosphorylation of PIAS1 to restrict inflammation and immunity. Cell 2007, 129, 903–914. [Google Scholar] [CrossRef] [Green Version]
  30. Liu, Y.; Bridges, R.; Wortham, A.; Kulesz-Martin, M. NF-κB repression by PIAS3 mediated RelA SUMOylation. PLoS ONE 2012, 7, e37636. [Google Scholar] [CrossRef] [Green Version]
  31. Jang, H.D.; Yoon, K.; Shin, Y.J.; Kim, J.; Lee, S.Y. PIAS3 suppresses NF-kappaB-mediated transcription by interacting with the p65/RelA subunit. J. Biol. Chem. 2004, 279, 24873–24880. [Google Scholar] [CrossRef] [Green Version]
  32. Gross, M.; Liu, B.; Tan, J.A.; French, F.S.; Carey, M.; Shuai, K. Distinct effects of PIAS proteins on androgen-mediated gene activation in prostate cancer cells. Oncogene 2001, 20, 3880–3887. [Google Scholar] [CrossRef] [Green Version]
  33. Mabb, A.M.; Wuerzberger-Davis, S.M.; Miyamoto, S. PIASy mediates NEMO sumoylation and NF-κB activation in response to genotoxic stress. Nat. Cell Biol. 2006, 8, 986–993. [Google Scholar] [CrossRef]
  34. Xiong, R.; Nie, L.; Xiang, L.; Shao, J. Characterization of a PIAS4 homologue from zebrafish: Insights into its conserved negative regulatory mechanism in the TRIF, MAVS, and IFN signaling pathways during vertebrate evolution. J. Immunol. 2012, 188, 2653–2668. [Google Scholar] [CrossRef] [Green Version]
  35. Boudinot, P.; Bird, S.; Pasquier, L.D.; Collet, B. The repertoire of vertebrate STAT transcription factors: Origin and variations in fish. Dev. Comp. Immunol. 2021, 116, 103929. [Google Scholar] [CrossRef]
  36. Levraud, J.-P.; Jouneau, L.; Briolat, V.; Laghi, V.; Boudinot, P. IFN-stimulated genes in zebrafish and humans define an ancient arsenal of antiviral immunity. J. Immunol. 2019, 203, 3361–3373. [Google Scholar] [CrossRef]
  37. Dehler, C.E.; Lester, K.; della Pelle, G.; Jouneau, L.; Houel, A.; Collins, C.; Dovgan, T.; Machat, R.; Zou, J.; Boudinot, P.; et al. Viral resistance and IFN signaling in STAT2 knockout fish cells. J. Immunol. 2019, 203, 465–475. [Google Scholar] [CrossRef] [Green Version]
  38. Valdez, B.C.; Henning, D.; Perlaky, L.; Busch, R.K.; Busch, H. Cloning and characterization of Gu/RH-II binding protein. Biochem. Biophys. Res. Commun. 1997, 234, 335–340. [Google Scholar] [CrossRef]
  39. Dehler, C.E.; Boudinot, P.; Martin, S.A.M.; Collet, B. Development of an efficient genome editing method by CRISPR/Cas9 in a fish cell line. Mar. Biotechnol. 2016, 18, 449–452. [Google Scholar] [CrossRef] [Green Version]
  40. Rytinki, M.M.; Kaikkonen, S.; Pehkonen, P.; Jääskeläinen, T.; Palvimo, J.J. PIAS proteins: Pleiotropic interactors associated with SUMO. Cell. Mol. Life Sci. 2009, 66, 3029–3041. [Google Scholar] [CrossRef]
  41. Collet, B.; Secombes, C.J. The rainbow trout (Oncorhynchus mykiss) Mx1 promoter: Structural and functional characterization. Eur. J. Biochem. 2001, 268, 1577–1584. [Google Scholar] [CrossRef]
  42. Johansen, A.; Collet, B.; Sandaker, E.; Secombes, C.J.; Jørgensen, J.B. Quantification of Atlantic salmon type-I interferon using an Mx1 promoter reporter gene assay. Fish Shellfish. Immunol. 2004, 16, 173–184. [Google Scholar] [CrossRef]
  43. Schindler, U.; Baichwal, V.R. Three NF-kappa B binding sites in the human E-selectin gene required for maximal tumor necrosis factor alpha-induced expression. Mol. Cell. Biol. 1994, 14, 5820–5831. [Google Scholar] [PubMed] [Green Version]
  44. Glasauer, S.M.K.; Neuhauss, S.C.F. Whole-genome duplication in teleost fishes and its evolutionary consequences. Mol. Genet. Genom. 2014, 289, 1045–1060. [Google Scholar] [CrossRef] [Green Version]
  45. Macqueen, D.J.; Johnston, I.A. A well-constrained estimate for the timing of the salmonid whole genome duplication reveals major decoupling from species diversification. Proc. R. Soc. B Biol. Sci. 2014, 281, 20132881. [Google Scholar] [CrossRef] [Green Version]
  46. Rebl, A.; Rebl, H.; Verleih, M.; Haupt, S.; Köbis, J.M.; Goldammer, T.; Seyfert, H.M. At least two genes encode many variants of Irak3 in rainbow trout, but neither the full-length factor nor its variants interfere directly with the TLR-mediated stimulation of inflammation. Front. Immunol. 2019, 10, 2246. [Google Scholar] [CrossRef] [Green Version]
  47. Sarais, F.; Rebl, H.; Verleih, M.; Ostermann, S.; Krasnov, A.; Köllner, B.; Goldammer, T.; Rebl, A. Characterisation of the teleostean κB-Ras family: The two members NKIRAS1 and NKIRAS2 from rainbow trout influence the activity of NF-κB in opposite ways. Fish Shellfish. Immunol. 2020, 106, 1004–1013. [Google Scholar] [CrossRef]
  48. Munarriz, E.; Barcaroli, D.; Stephanou, A.; Townsend, P.A.; Maisse, C.; Terrinoni, A.; Neale, M.H.; Martin, S.J.; Latchman, D.S.; Knight, R.A.; et al. PIAS-1 is a checkpoint regulator which affects exit from G1 and G2 by sumoylation of p73. Mol. Cell. Biol. 2004, 24, 10593–10610. [Google Scholar] [CrossRef] [Green Version]
  49. Heery, D.M.; Kalkhoven, E.; Hoare, S.; Parker, M.G. A signature motif in transcriptional co-activators mediates binding to nuclear receptors. Nature 1997, 387, 733–736. [Google Scholar] [CrossRef]
  50. Liu, B.; Yee, K.M.; Tahk, S.; Mackie, R.; Hsu, C.; Shuai, K. PIAS1 SUMO ligase regulates the self-renewal and differentiation of hematopoietic stem cells. EMBO J. 2014, 33, 101–113. [Google Scholar] [CrossRef] [Green Version]
  51. Prelich, G. Gene overexpression: Uses, mechanisms, and interpretation. Genetics 2012, 190, 841–854. [Google Scholar] [CrossRef] [Green Version]
  52. Rebl, A.; Rebl, H.; Köbis, J.M.; Goldammer, T.; Seyfert, H.-M. ST2 from rainbow trout quenches TLR signalling, localises at the nuclear membrane and allows the nuclear translocation of MYD88. Dev. Comp. Immunol. 2017, 67, 139–152. [Google Scholar] [CrossRef] [PubMed] [Green Version]
  53. Haller, O.; Arnheiter, H.; Pavlovic, J.; Staeheli, P. The discovery of the antiviral resistance gene Mx: A story of great ideas, great failures, and some success. Annu. Rev. Virol. 2018, 5, 33–51. [Google Scholar] [CrossRef] [PubMed]
  54. Hirano, T.; Matsuda, T.; Nakajima, K. Signal transduction through gp130 that is shared among the receptors for the interleukin 6 related cytokine subfamily. Stem Cells 1994, 12, 262–277. [Google Scholar] [CrossRef]
  55. Kotaja, N.; Aittomäki, S.; Silvennoinen, O.; Palvimo, J.J.; Jänne, O.A. ARIP3 (androgen receptor-interacting protein 3) and other PIAS (protein inhibitor of activated STAT) proteins differ in their ability to modulate steroid receptor-dependent transcriptional activation. Mol. Endocrinol. 2000, 14, 1986–2000. [Google Scholar] [CrossRef]
  56. Bautista-Hernández, L.A.; Gómez-Olivares, J.L.; Buentello-Volante, B.; Bautista-de Lucio, V.M. Fibroblasts: The unknown sentinels eliciting immune responses against microorganisms. Eur. J. Microbiol. Immunol. 2017, 7, 151–157. [Google Scholar] [CrossRef]
  57. Estévez, R.A.; Mostazo, M.G.C.; Rodriguez, E.; Espinoza, J.C.; Kuznar, J.; Jónsson, Z.O.; Guðmundsson, G.H.; Maier, V.H. Inducers of salmon innate immunity: An in vitro and in vivo approach. Fish Shellfish. Immunol. 2018, 72, 247–258. [Google Scholar] [CrossRef]
  58. Köllner, B.; Blohm, U.; Kotterba, G.; Fischer, U. A monoclonal antibody recognising a surface marker on rainbow trout (Oncorhynchus mykiss) monocytes. Fish Shellfish Immunol. 2001, 11, 127–142. [Google Scholar] [CrossRef]
  59. Korytář, T.; Thi, H.D.; Takizawa, F.; Köllner, B. A multicolour flow cytometry identifying defined leukocyte subsets ofrainbow trout (Oncorhynchus mykiss). Fish Shellfish Immunol. 2013, 35, 2017–2019. [Google Scholar] [CrossRef]
  60. Bowers, R.M.; Lapatra, S.E.; Dhar, A.K. Detection and quantitation of infectious pancreatic necrosis virus by real-time reverse transcriptase-polymerase chain reaction using lethal and non-lethal tissue sampling. J. Virol. Methods. 2008, 147, 226–234. [Google Scholar] [CrossRef]
  61. Köbis, J.M.; Rebl, H.; Goldammer, T.; Rebl, A. Multiple gene and transcript variants encoding trout C-polysaccharide binding proteins are differentially but strongly induced after infection with Aeromonas salmonicida. Fish Shellfish Immunol. 2017, 60, 509–519. [Google Scholar] [CrossRef] [Green Version]
  62. Yang, W.; Zerbe, H.; Petzl, W.; Brunner, R.M.; Günther, J.; Draing, C.; von Aulock, S.; Schuberth, H.J.; Seyfert, H.M. Bovine TLR2 and TLR4 properly transduce signals from Staphylococcus aureus and E. coli, but S. aureus fails to both activate NF-kappaB in mammary epithelial cells and to quickly induce TNFalpha and interleukin-8 (CXCL8) expression in the udder. Mol. Immunol. 2008, 45, 1385–1397. [Google Scholar] [CrossRef] [PubMed]
  63. Collins, C.; Ganne, G.; Collet, B. Isolation and activity of the promoters for STAT1 and 2 in Atlantic salmon Salmo salar. Fish Shellfish Immunol. 2014, 40, 644–647. [Google Scholar] [CrossRef] [PubMed]
  64. Huerta-Cepas, J.; Serra, F.; Bork, P. ETE 3: Reconstruction, analysis, and visualization of phylogenomic data. Mol. Biol. Evol. 2016, 33, 1635–1638. [Google Scholar] [CrossRef] [PubMed] [Green Version]
  65. Price, M.N.; Dehal, P.S.; Arkin, A.P. Fasttree: Computing large minimum evolution trees with profiles instead of a distance matrix. Mol. Biol. Evol. 2009, 26, 1641–1650. [Google Scholar] [CrossRef]
  66. Pettersen, E.F.; Goddard, T.D.; Huang, C.C.; Meng, E.C.; Couch, G.S.; Croll, T.I.; Morris, J.H.; Ferrin, T.E. UCSF ChimeraX: Structure visualization for researchers, educators, and developerS. Protein Sci. 2021, 30, 70–82. [Google Scholar] [CrossRef]
  67. Ishida, T.; Kinoshita, K. PrDOS: Prediction of disordered protein regions from amino acid sequence. Nucleic Acids Res. 2007, 35, W460–W464. [Google Scholar] [CrossRef]
Figure 1. (a) Regulation of STAT/NF-κB-mediated pathways via PIAS; (b) target genes of the STAT/NF-κB-dependent signalling.
Ijms 22 12815 g001
Figure 2. Phylogenetic relationship and synteny between the (a) PIAS1, (b) PIAS2, and (c) PIAS4 genes from different vertebrate species. The bootstrap values of the phylogenetic analysis are given at the nodes of the tree. The NCBI protein accession codes, species names, and chromosomal location are listed between the phylogenetic and synteny analyses; the target species are labelled in bold. Arrows represent the reading direction of genes found in synteny; the same colours indicate orthologous genes. The figure is not scaled.
Ijms 22 12815 g002
Figure 3. Sequence identity of (a) PIAS1, (b) PIAS2, and (c) PIAS4 genes from different vertebrate species, listed to the left and below the individual graphs (different PIAS gene variants are indicated behind the species name). For NCBI protein accession codes, please refer to Figure 2.
Ijms 22 12815 g003
Figure 4. Representation of the domains and motifs characteristic of the variants of (a) Pias1, (b) Pias2, and (c) Pias4 in rainbow trout (Om). A schematic structure of the human (Hs) PIAS1 protein is included. The tertiary structures of (d) Pias1a1, (e) Pias2a2, and (f) Pias4a1 from rainbow trout were drawn using UCSF ChimeraX. The domains and motifs (af) are labelled according to the legend to the right of the Pias4 structures. The two underlined Pias variants were overexpressed in a cell model; the segment framed in red was overexpressed as a third ‘truncated Pias1′ variant.
Ijms 22 12815 g004
Figure 5. Levels of pias transcripts in rainbow trout tissues and salmonid cells (as listed above the diagrams). Bars represent the averaged copy numbers (n = 4) normalised against two reference genes; error bars represent the standard error of the mean. Asterisks represent significantly different transcript levels across ohnologues and transcript variants (*, p < 0.05; **, p < 0.01; ***, p < 0.001; ****, p < 0.0001).
Ijms 22 12815 g005
Figure 6. Expression profile of the stat genes in rainbow trout tissues and salmonid cells (as listed above the diagrams). Bars represent the averaged copy numbers (n = 4) normalised against two reference genes; error bars represent the standard error of the mean. Asterisks represent significantly different transcript levels (*, p < 0.05; **, p < 0.01; ***, p < 0.001; ****, p < 0.0001).
Ijms 22 12815 g006
Figure 7. Knock-out targeting pias1 and pias2 in CHSE-EC cells. (a) Sorting of GFP-positive (+) and GFP-negative (-) cells; (b) genotype of GFP(-) clones.
Ijms 22 12815 g007
Figure 8. Overexpression of Pias factors in salmonid cell models. Confocal analysis of (a) GFP-tagged Pias1 (green) and (b) GFP-tagged Pias2 (green) in CHSE-214 cells; nuclei were stained with Hoechst 33342 dye (blue). The white scale bar represents 2 μm. The luciferase activity of CHSE-214 cells co-expressing (c) mx-reporter construct or (d) ELAM-reporter construct was determined in unstimulated control cells or ifnγ-expressing cells (as indicated above the graphs) co-expressing increasing concentrations of the pias-expressing vector (indicated on the abscissa). The luciferase activity in all cell cultures not expressing pias was set to 1.0. Statistical significance compared with the control group was assessed using one-way ANOVA (*, p < 0.05; **, p < 0.01; ***, p < 0.001; ****, p < 0.0001). The standard error of the mean (SEM) is indicated.
Ijms 22 12815 g008
Figure 9. Expression profiling of pias-overexpressing CHSE-214 cells. (a) The heatmap and (b) bar chart illustrate the averaged fold-change values of the mRNA concentrations measured in cells transfected without (CTRL, set as 1.0) or with the ifnγ-expression vector (0 ng pias vector amount) together with pias-expression vectors (as indicated). The quantified transcripts are listed as gene symbols. All expression values shown in (a,b) were normalised against the geometric mean of two reference genes. Significantly different FC values compared to CTRL are underlined in (a). Statistical significance compared with the control group was assessed in (b) using one-way ANOVA (****, p < 0.0001); standard error of the mean (SEM) is indicated.
Ijms 22 12815 g009
Table 1. Pias sequences identified in rainbow trout.
Nucleotide NCBI Accession NumberChromosomeGeneTranscript IsoformCDS Length [nt]UTR Length [bp]
5′    3′
Instability MotifsProtein Length [aa]Protein NCBI Accession Number
Pias1
XM_03696370826 (6) *LOC110527003pias1a1.1 (X1)21304111131 (3′ UTR)709XP_036819603
XM_03696370926 (6)LOC110527003pias1a1.2 (X2)21124111131 (3′ UTR)703XP_036819604
XM_0369613532pias1bpias1b196878332620 (3′ UTR)655XP_036817248
XM_03696902930 (4)LOC110521158pias1a2192914017186 (3′ UTR)642XP_036824924
Pias2
XM_03693654011pias2pias2a2.1 (X1)1965289315214 (3′ UTR)654XP_036792435
XM_03693654211pias2pias2a2.2 (X2)1950286313414 (3′ UTR)649XP_036792437
XM_03693654311pias2pias2a2.3 (X3)1920411313414 (3′ UTR)639XP_036792438
XM_0369791936LOC110525143pias2a1.1 (X1)152757225022 (5′ UTR),
3 (3′ UTR)
508XP_036835088
XM_0369791946LOC110525143pias2a1.2 (X2)151257225022 (5′ UTR),
3 (3′ UTR)
503XP_036835089
Pias4
XM_0215989844LOC110521438pias4a1.1 (X1)1485125293324 (3′ UTR)494XP_021454659
XM_0215989854LOC110521438pias4a1.2 (X2)145560293124 (3′ UTR)484XP_021454660
XM_0216038175LOC11052429pias4a21497132361726 (3′ UTR)498XP_021459492
XM_0216139408pias4bpias4b.1 (X1)14914106961 (5′ UTR),
5 (3′ UTR)
496XP_021469615
XM_0369863568pias4bpias4b.2 (X2)14224986961 (5′ UTR),
5 (3′ UTR)
473XP_036842251
* Brackets indicate the former chromosomal location.
Table 2. Primers used in this study.
Gene SymbolPrimer Sequence 5′→3′
(Sense, Antisense)
Nucleotide NCBI Accession Number
Used for Primer Design
Fragment Length
[bp]
O. mykissO. tshawytscha
Quantitative PCR Analysis (Oncorhynchus mykiss, O. tshawytscha)
Pias1a1.1GTTGGAAGGCACCTTCTGTGTT,
CTACGGTCCAAAGGCATCAGG
XM_036963708XM_031812568108
Pias1bGGAGCTACTCTATGGCGGTGT,
ATCAGGAACCCAGACCATTCCA
XM_036961353XM_04231787299
Pias1a2TAGGCAGGAATTTCTCCATGGC,
AGAGAAGTTAACAGCTGACCCG
XM_036969029XM_042310862140
Pias2a1.1GTGTGCATCTCCAGGGACTTTT,
CTAAGAATGGAGTGGAACAGAAG
XM_036979193XM_024414775195
Pias2a2.1GAGCTACGGAGCATGGTGTCA,
AACTTTATCGACGCCGCTATCC
XM_036936540XM_042331195185
Pias4a1.1ATTGGAAGCAGAGAACCGTCGA,
ATTTTCGGGTGTCTGACCTGCA
XM_021598984XM_024398270158
Pias4a1.2GCCTGCTAGGCTGGGAAACTA,
CGCAGTAAAAGTGGTCTGAAGC
XM_02159898599
Pias4a2AGGAGGAGGGGGGAGGAGG,
CGGACTGACCCCACAAACTGA
XM_021603817XM_024421382144
Pias4b.1ACATAGCAGAAGCAATTAGGTTGT,
AATCTGCTGGTGAGGGCAGTG
XM_021613940XM_024421383146
Pias4b.2ACAAAGGCCCCGGAGTGAACA,
GGGAGGGGAGTCAAGCTACAT
XM_021613941129
Stat1a1 (stat1-1)GAGAGCATCGACTGGGAAAATGT,
AAACAACTTCCTGCTACAACACAA
NM_001124707XM_024426102131
Stat1a2 (stat1-2)CCCCGTTCACATGGCCATGAT,
CATAGAGACCGACAGAGAAAACA
XM_021608237XM_04232408395
Stat1b1 (stat1ab)GGCCATGATAATCTGTAACTGTC,
ACGTTAAAGACCTGAGGAACCG
XM_021579196XM_042306329150
Cxcl8ATATAACACTTGTTACCAGCGAGA,
ATTACTGAGGAGATGAGTCTGAG
HG917307XM_024415648106
Il6GTGTTAGTTAAGGGGAATCCAGT,
CCTTGCGGAACCAACAGTTTGT
NM_001124657XM_024404411128
Il10TGCCCAGTGCAGACGTGTACC,
TACACCACTTGAAGAGCCCCG
NM_001245099XM_042324963137
TgfbATCAGGGATGAACAAGCTGAGG,
CGGAGAGTTGCTGTGTGCGAA
XM_021591332XM_024397891161
Ifna1TTGAAGAGAGCAAATGTATGATGG,
TCCTGTACAGCCTACAGTTCATT
XM_024434105 (representative for LOC110538045, LOC110538046, LOC110538047,LOC110538053, LOC110538937, LOC118937709)XM_024434105
(representative for LOC112259401, LOC112259404, LOC121847201, LOC121847202, LOC112258510)
173
Ifna3CCAACATCACTTTACAGACACATA,
GGGACAAGAAAAACCTGGACGA
XM_024432928
(representative for LOC110511235, LOC110517168, LOC110538043, LOC110538058)
XM_024389910
(representative for LOC121838839, LOC112225816, LOC112258507, LOC112258508)
140
Stat4bACCTCATCAAAAGCTCCTTTGTG,
TTCACCACCAAAGTCAGATTGCT
XM_024388828XM_024388828112
MxGTAGCGGTATTGTAACACGATGC,
TCGTGAAGCCCAGGATGAAATG
XM_036958922XM_024415949158
Gata3CCACCTCCTCCACATAGTAGTC,
GACCTGCCGGGGAACCGTG
XM_036957437XM_042311479160
Mmp9TGCCAAGATAGAGGCTACAGTC,
TGTCTTGGACCCATAGAGATAGT
XM_036986917XM_024376362181
Socs1ACGGATTCTGCGTCGGAAAATAT,
ACACAGTTCCCTGGCATCCGT
XM_036973400XM_04231367191
Tp53GAATTTGAACCTGGTGGCAGTTC,
CACCTCAAACAGACTCGGATCA
NM_001124692XM_024394883115
Construction of PIAS-expression constructs
Pias1a1ATGCAAGCTTATGGCGGAGAGTGCGGAACT,
CATACCAGACGTGATCTCGTTAGACGAATTCGCAT
XM_036963708 1968
Pias2a1ATGCAAGCTTATGATCCTGACAAGAAAAATGGCGG,
ACATCATCTCAGACATCATCTCATTGGACGAATTCGCAT
XM_036936540 1965
SgRNA target sequence
Pias1a2AGTAACACTTGTAGCTCTGA
GCGTAGCCTAGTAACACTTG
TGTTTGTTGCGTCCTGCGTA
XM_02440718020
Pias1bTCTACAATAACACAAAAAGA
ACACGACTCTGCAAGAGGGT
TCTGTCAATCCATCTACAAT
XM_02441056920
Pias2a1.1ACACGTCGTAGAACGGGAGA
GAGGGATGAGAGGGGCGGGC
CCAGCAGCCCGCCCCTCTCA
XM_02441477520
Pias2a2CCATTTTTCTTGTCAGGATC
GCGAAGCCCAGTAACACTTG
TAGCTCCTCAAATTCCGCCA
XM_02440748620
mEGFPGGCGAGGGCGATGCCACCTA [39]20
Sequencing primers for GFP(-) cells
Pias1a2TTAGTTGTTCTATTCGTGTGTCCTA,
TTACACACACTGTGTGTACAAAACA
XM_024407180500
Pias1bGACCCCACTGCCTTTGTTTCAAACC,
CATTCCTCCAAGGAGACAACCACCAG
XM_024410569500
Pias2a2AGTCTAAGCTTGACATCCATGAAAG,
GTGTAGGCATTGGCTTAGCAATGC
XM_024407486360
Pias2a1.1CCCAAGGCGGTAGACAGTAGTCT,
ACTGGGCTTTATGTTTCTGGTGACG
XM_024414775500
mEGFPATGGTGAGCAAGGGCGAGCTG,
GTCCTCCTTGAAGTCGATGCCCT
[39]500
Publisher’s Note: MDPI stays neutral with regard to jurisdictional claims in published maps and institutional affiliations.

