
Sigma-1 Receptor Is Critical for Mitochondrial Activity and Unfolded Protein Response in Larval Zebrafish

 , and
, and 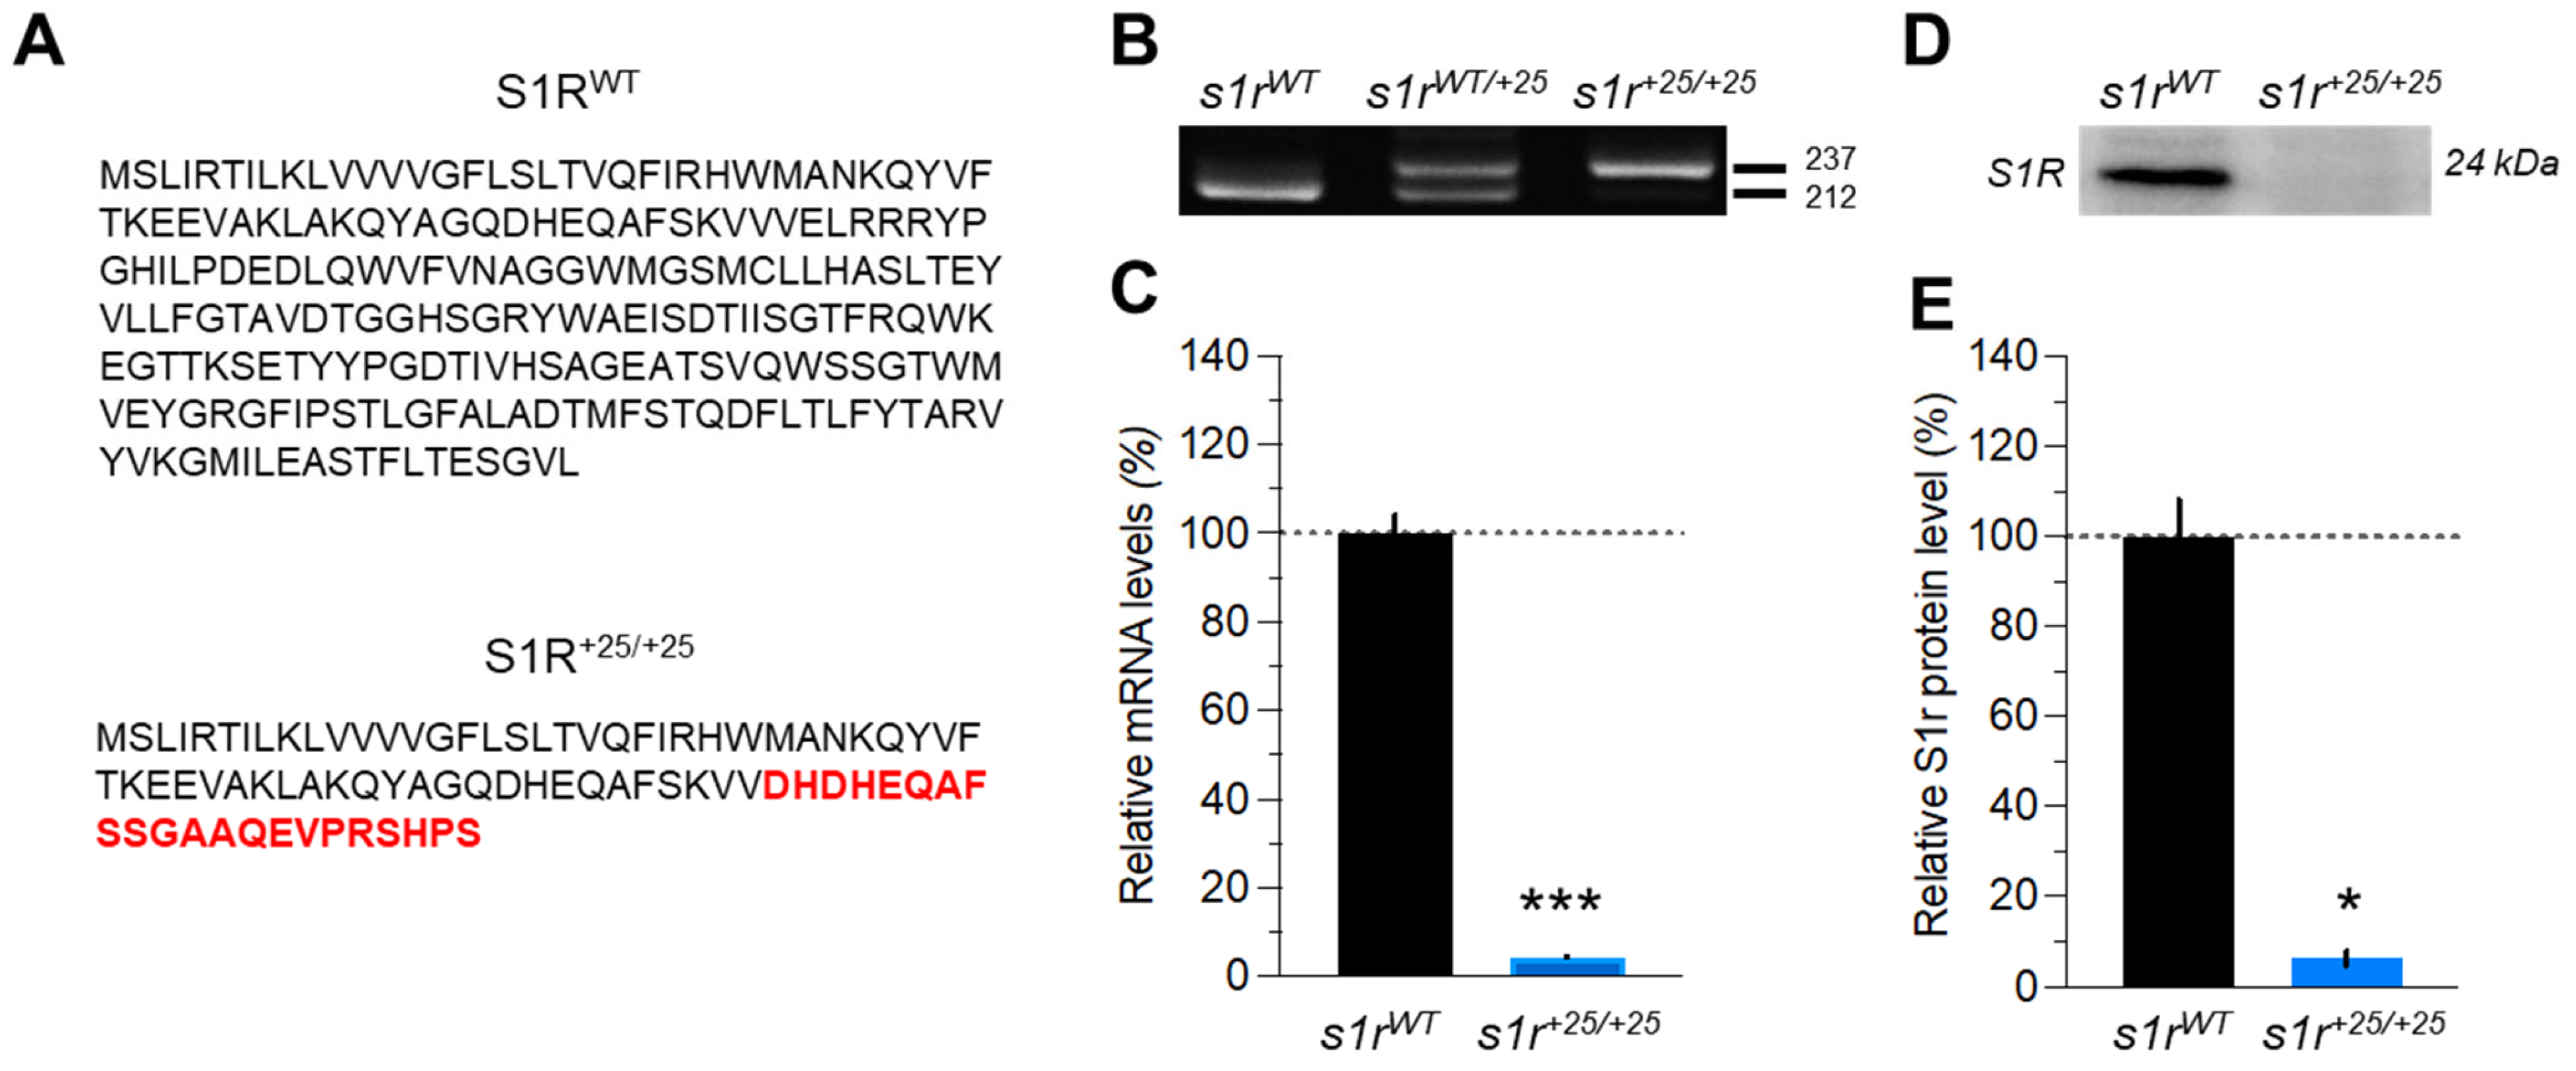
Abstract
1. Introduction
2. Results
2.1. Characterization of the s1r+25/+25 Mutant Zebrafish Line
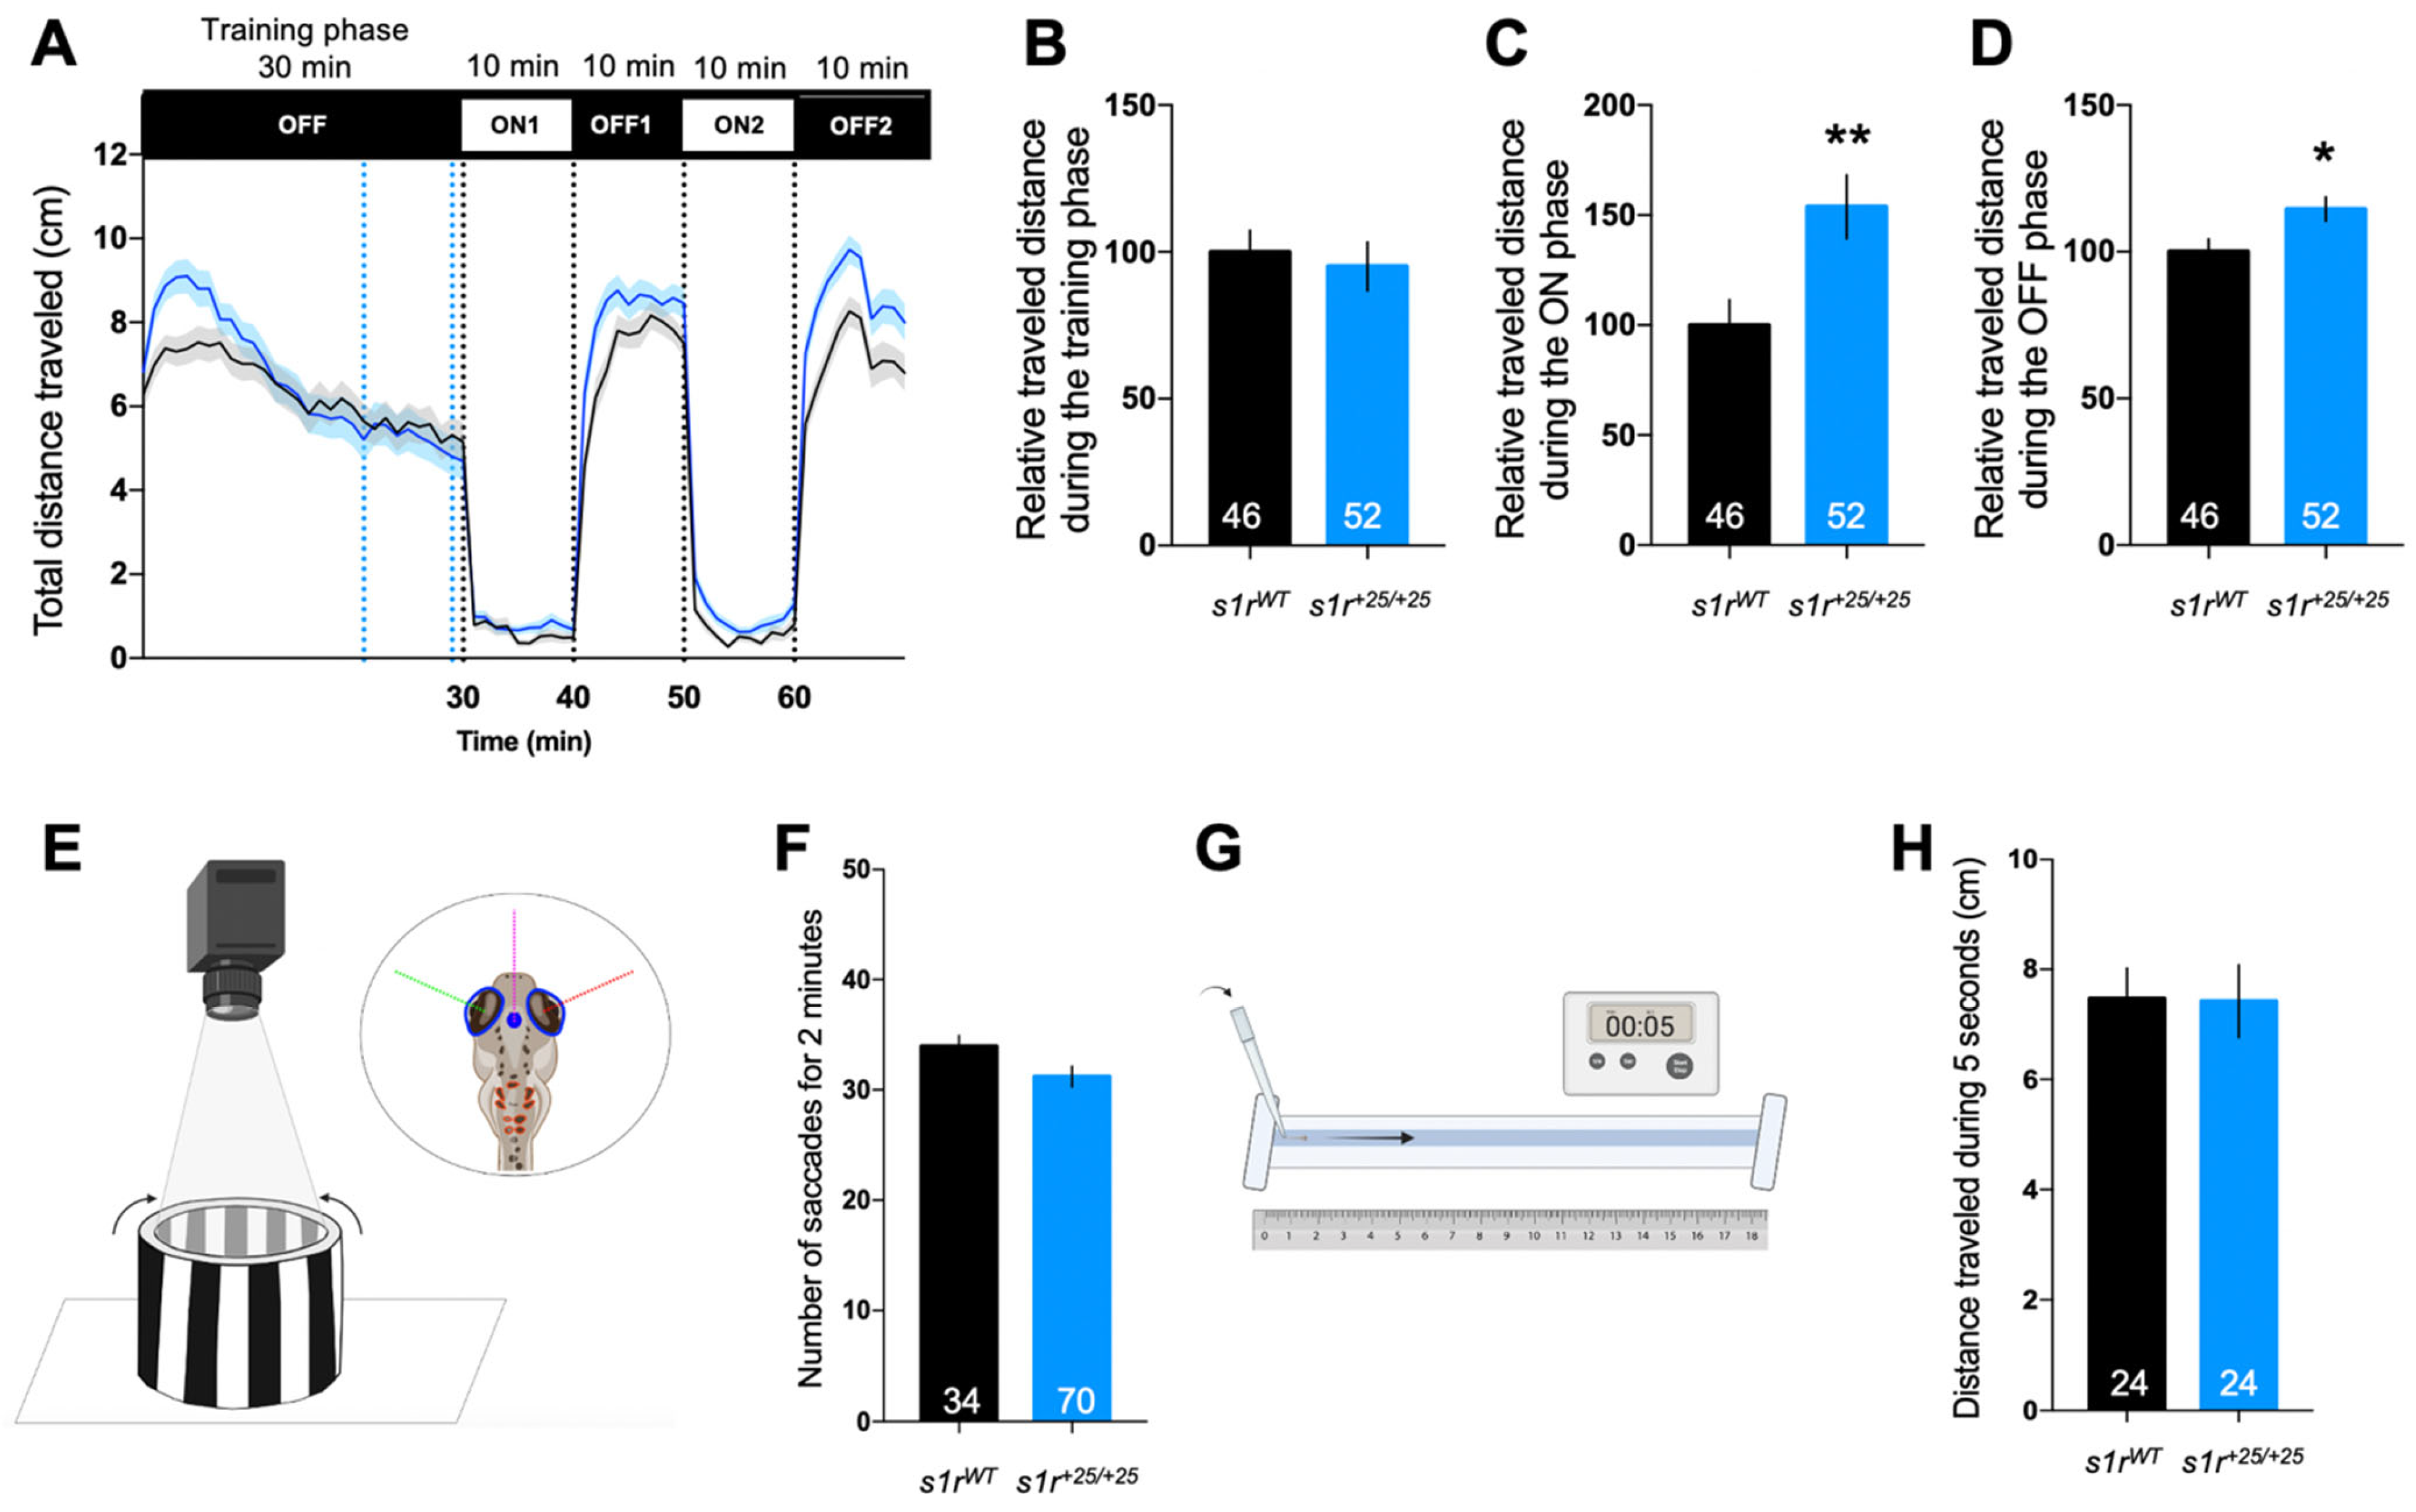
2.2. The s1r+25/+25 Larvae Exhibited Increased Locomotor Response
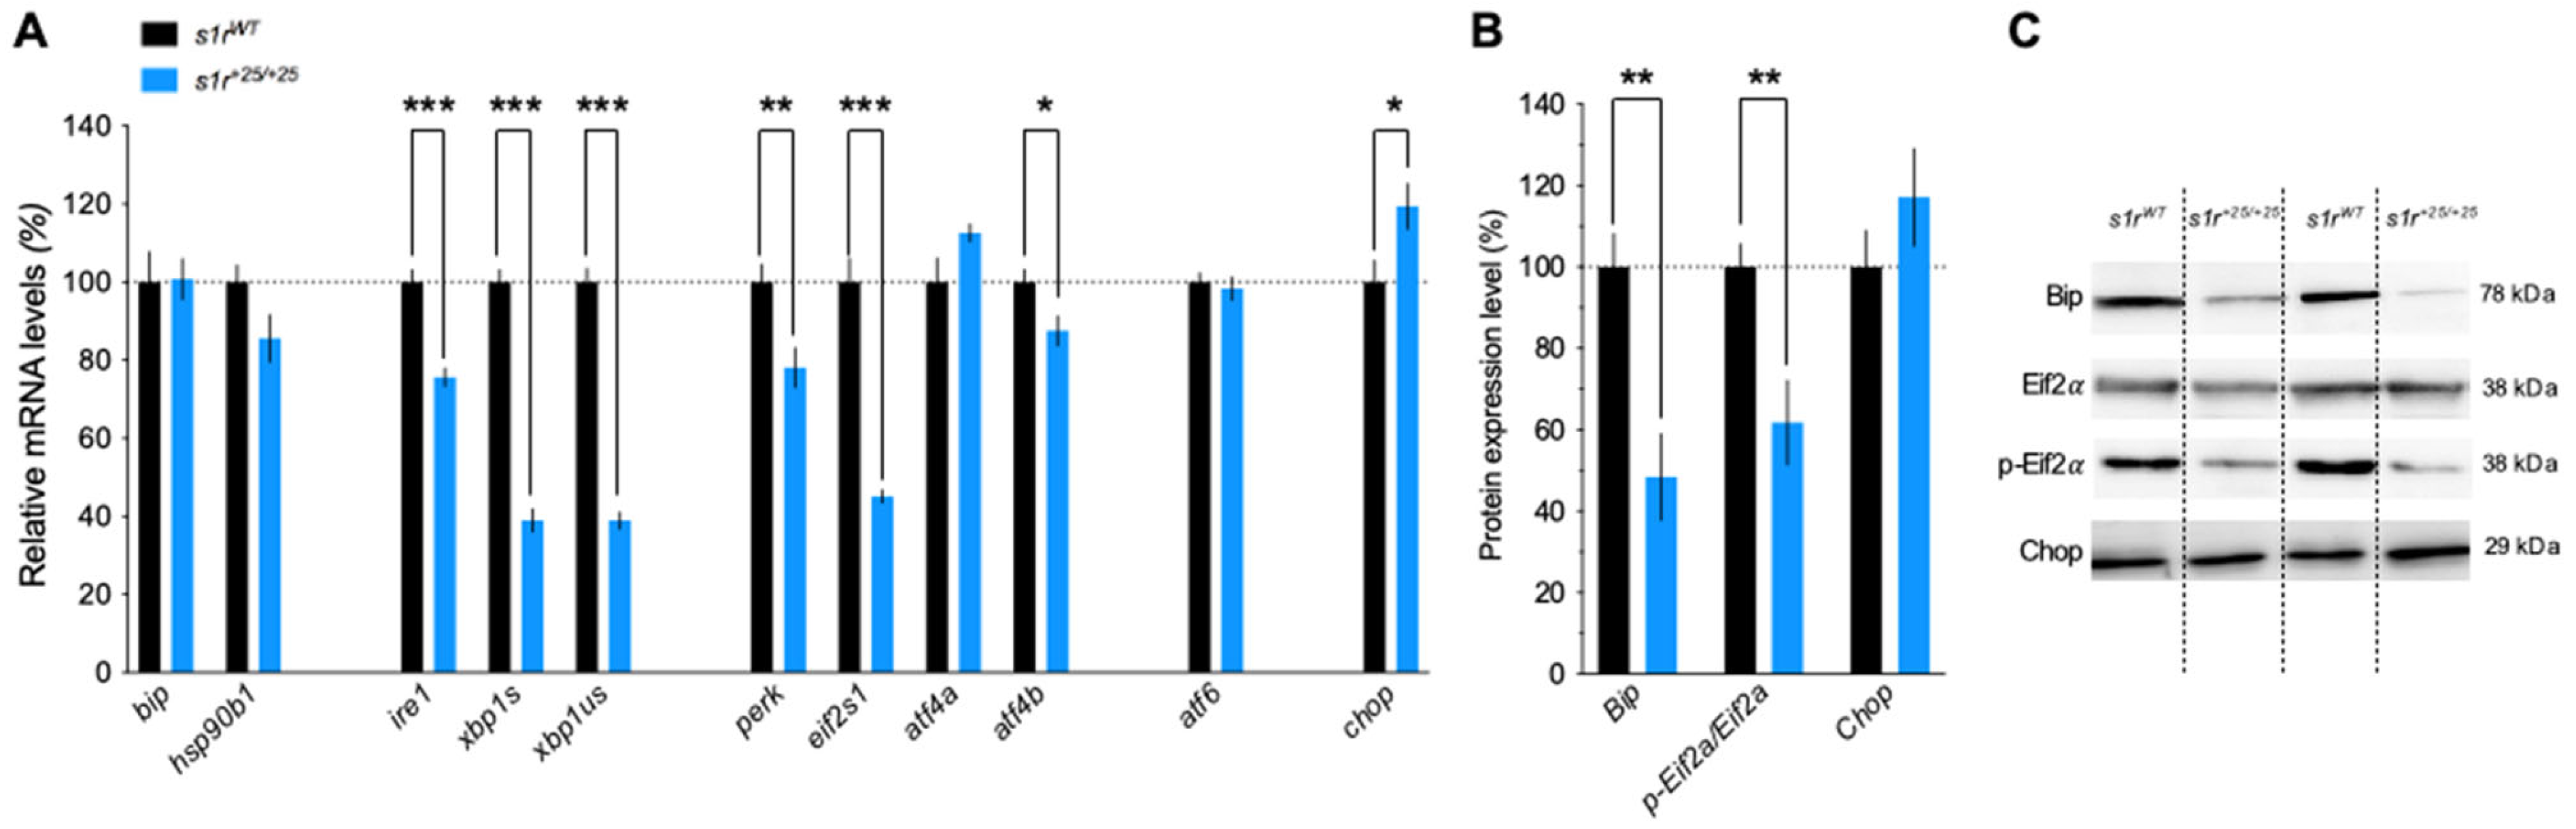
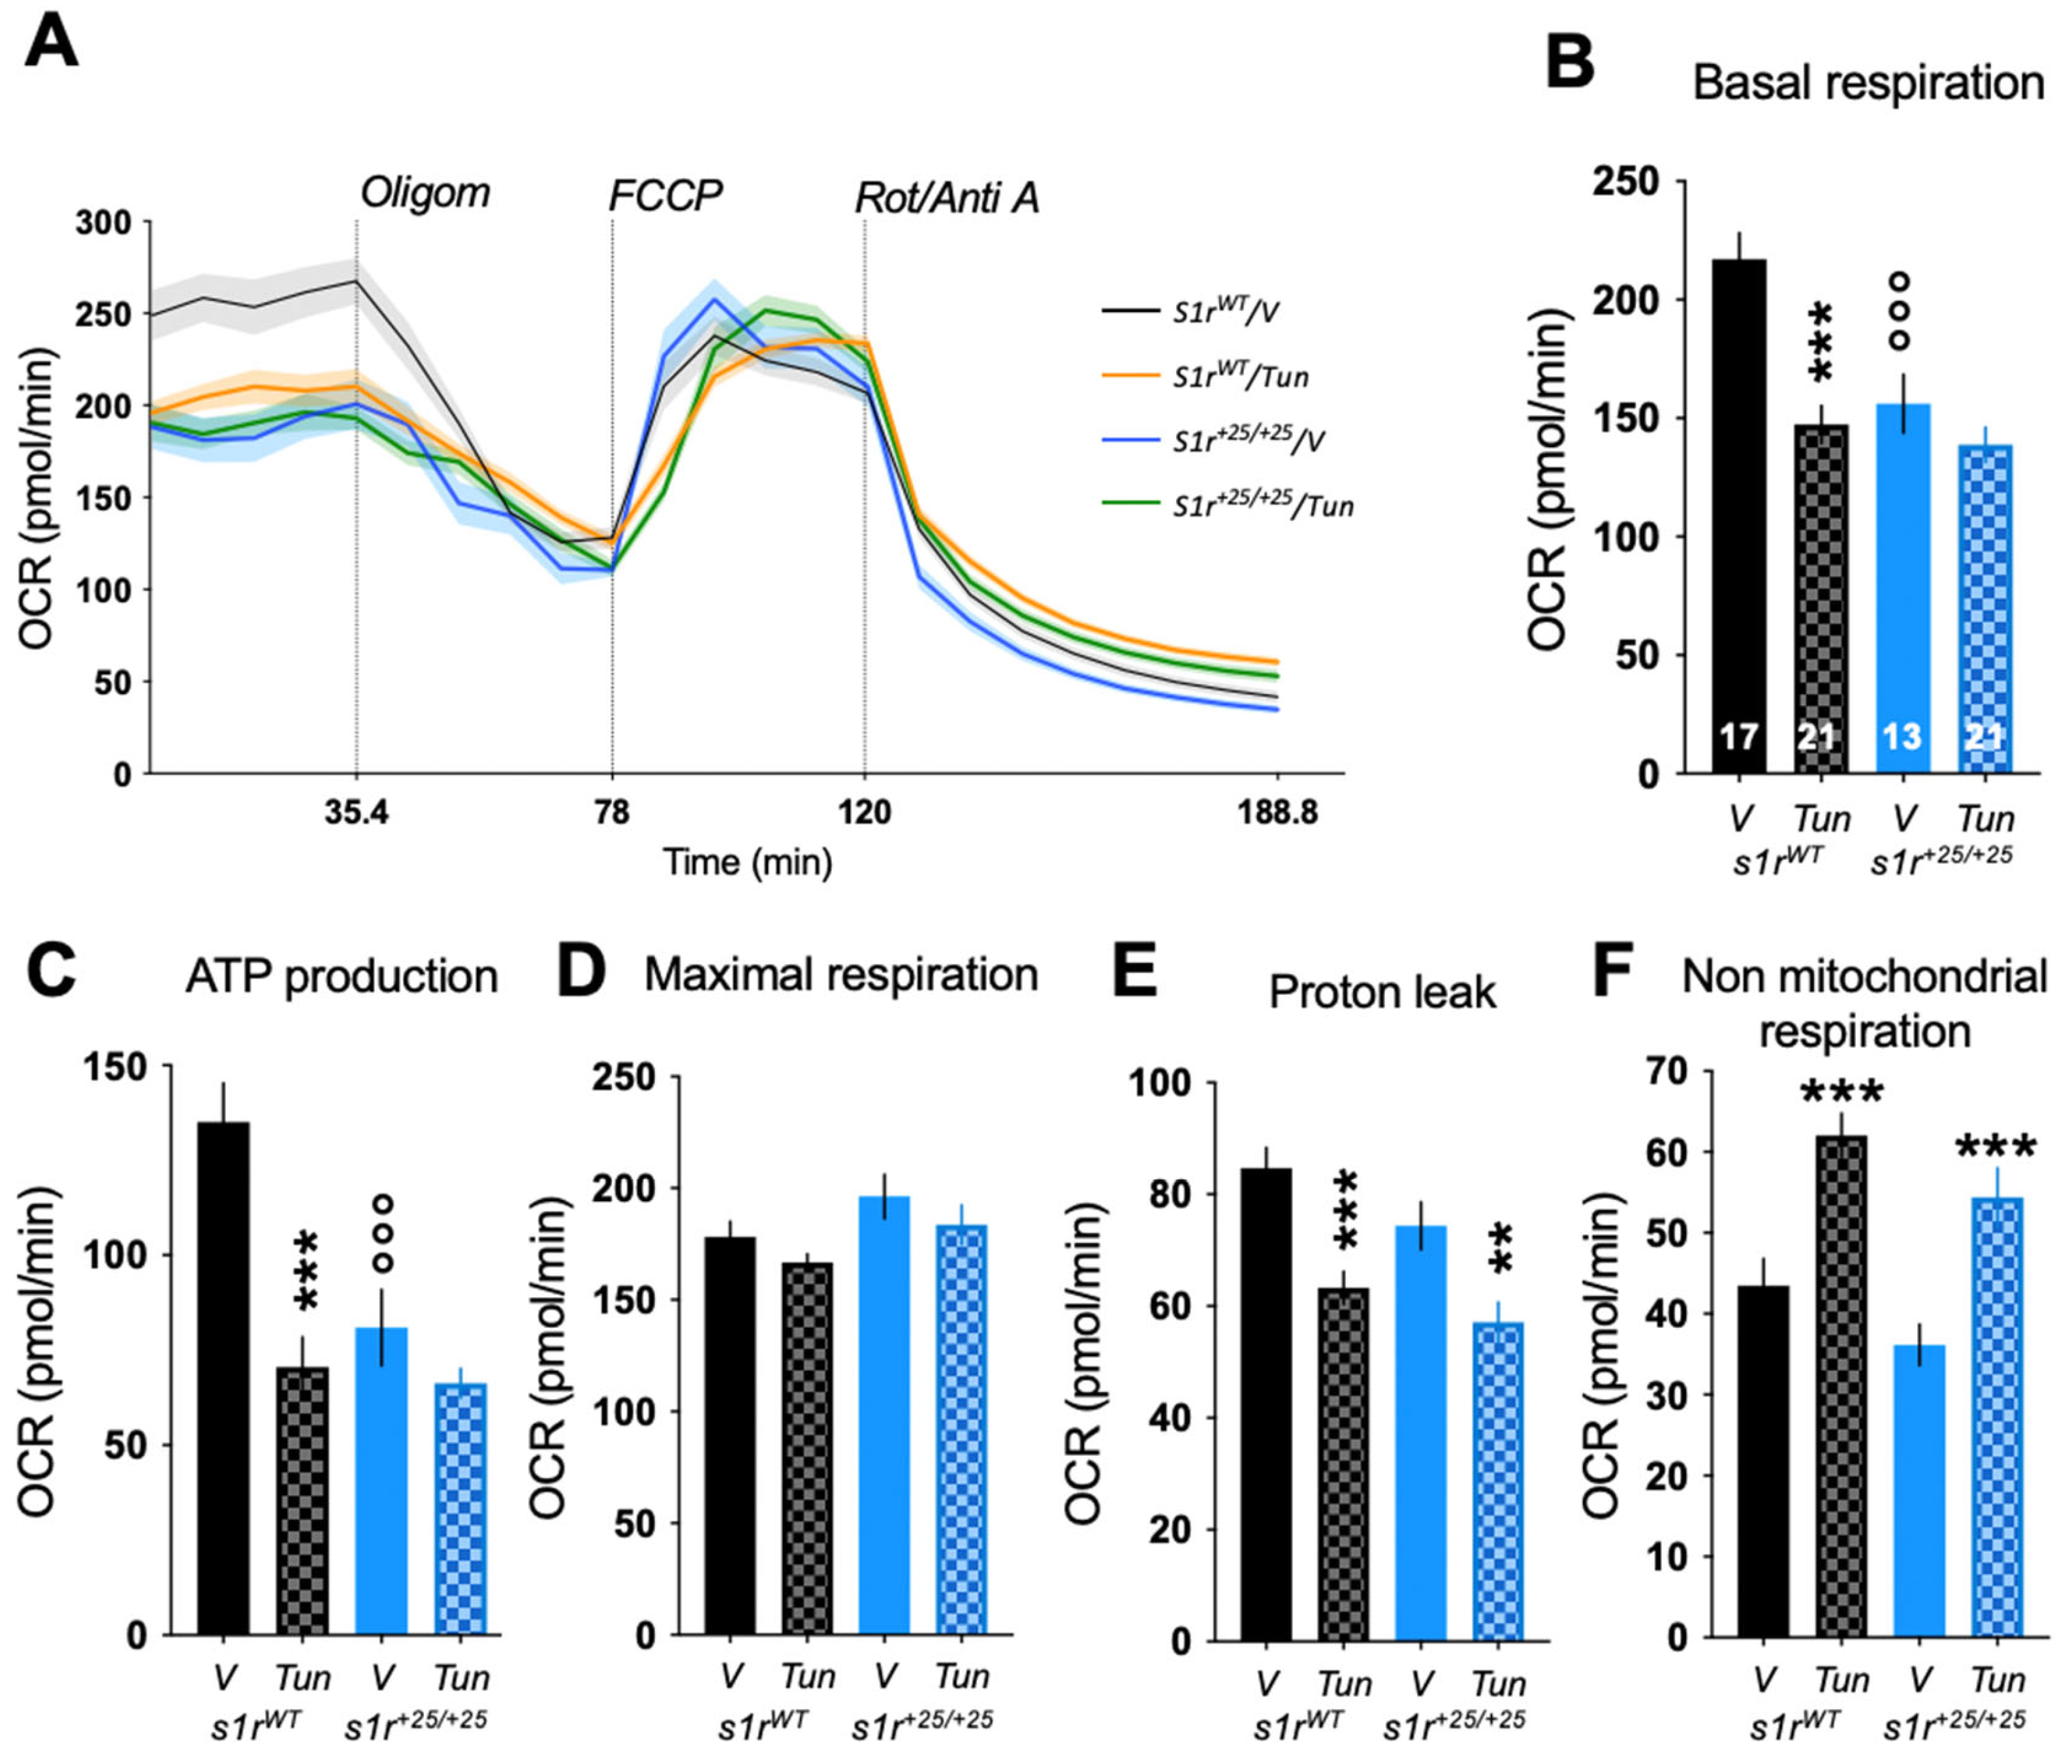
2.3. S1R Invalidation Modulated the Expression of ER Stress Genes, in Resting and Tunicamycin-Induced Pathological Conditions
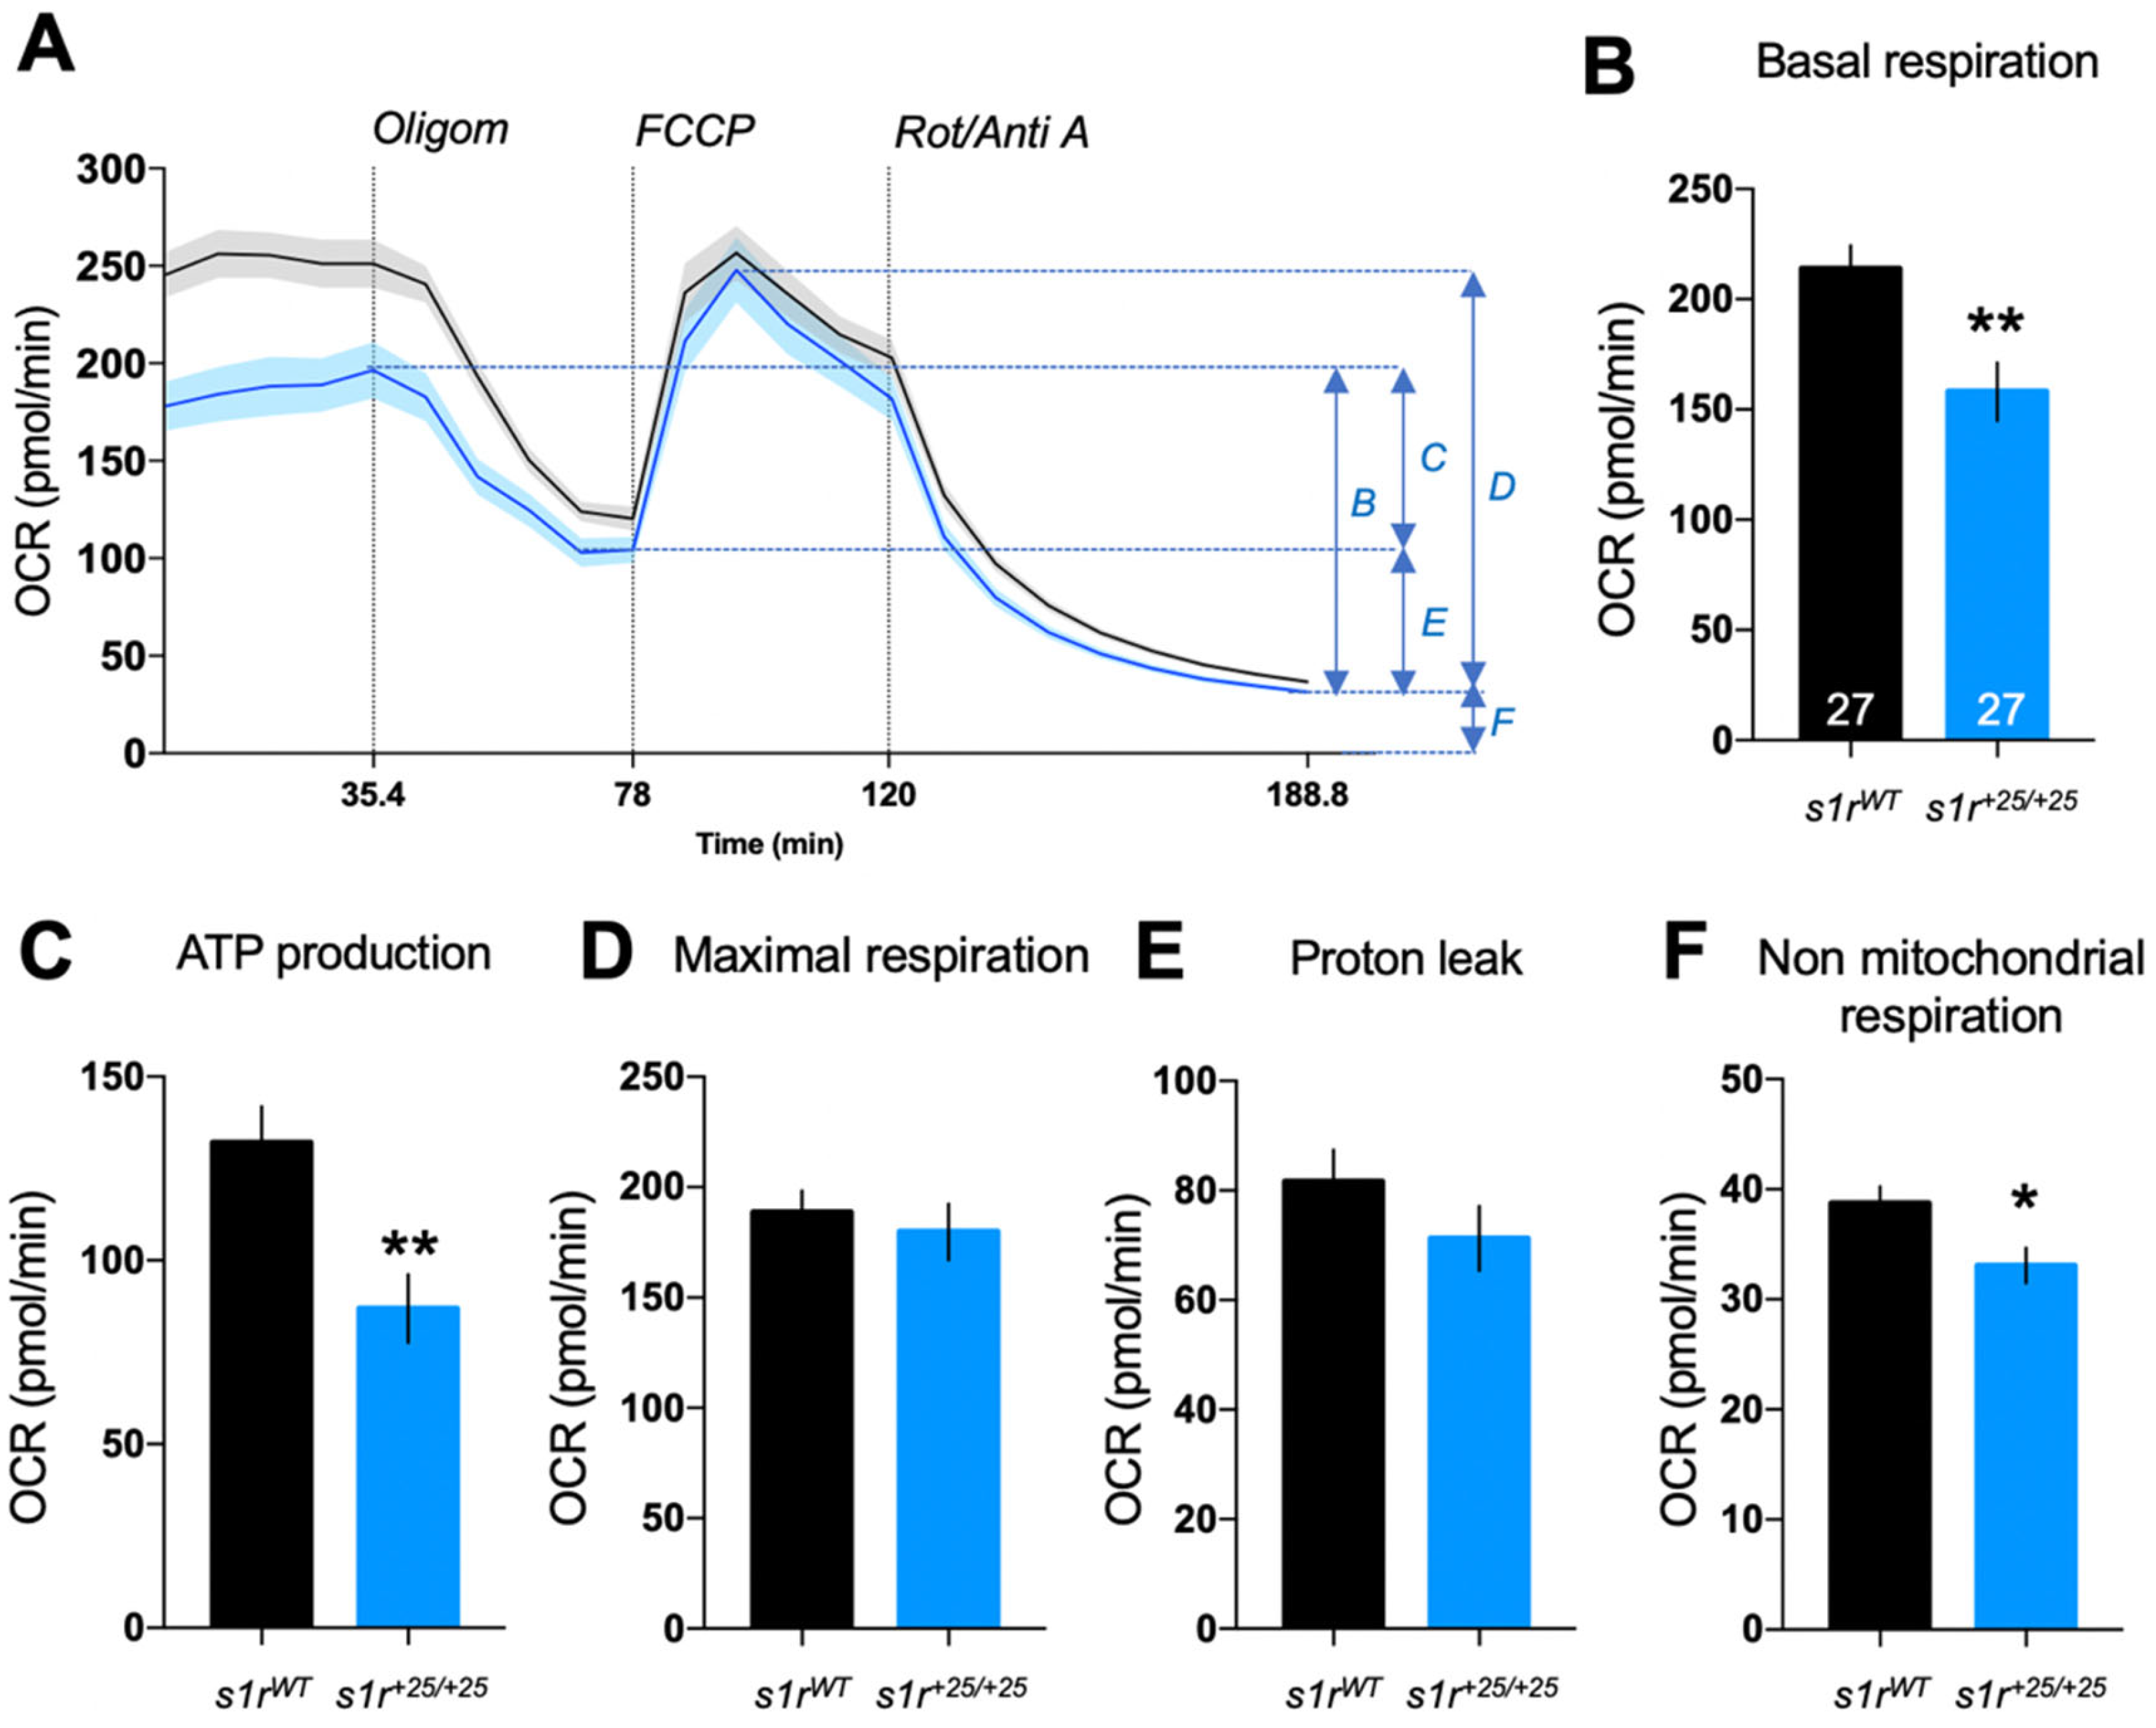
2.4. S1R Invalidation Altered Mitochondrial Bioenergetics
3. Discussion
4. Materials and Methods
4.1. Zebrafish and Maintenance
4.2. Genotyping
4.3. Chemical Treatment
4.4. RT-PCR and Quantitative Real-Time PCR (qPCR)
4.5. Visual Motor Response (VMR) Assay
4.6. Acoustic Startle Response (ASR) Assay
4.7. Optokinetic Response (OKR) Assay
4.8. Touch Response
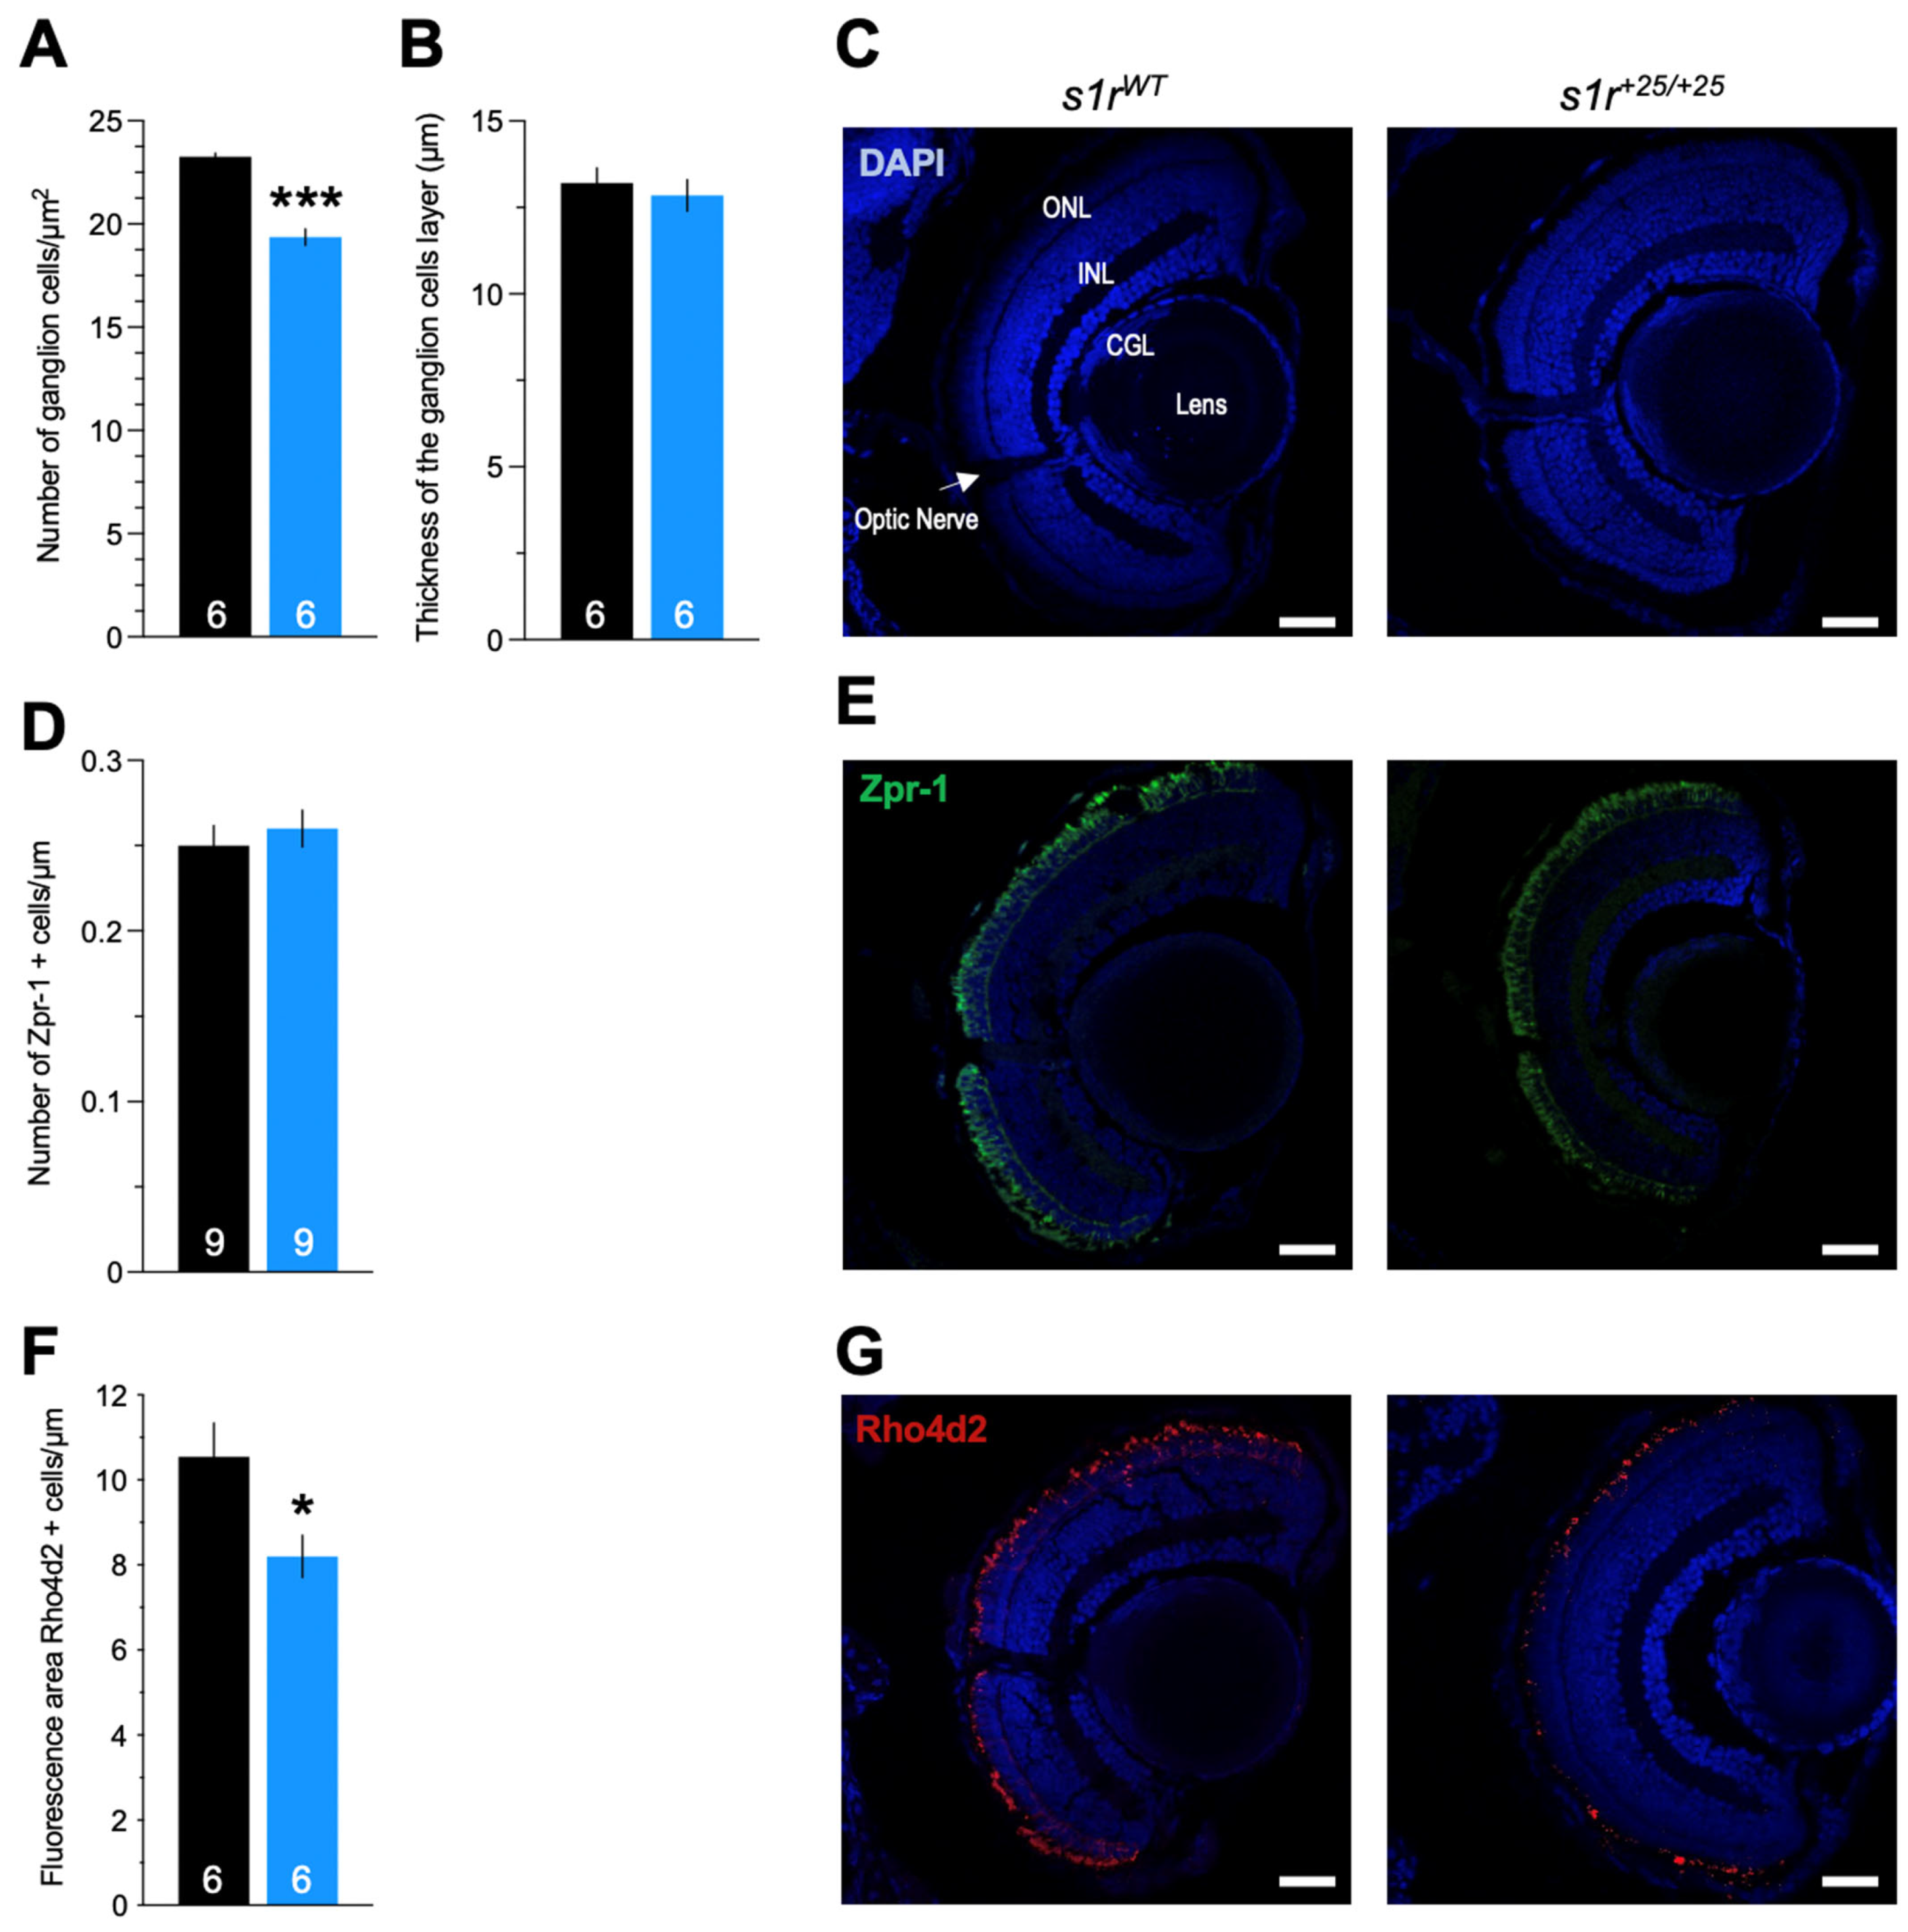
4.9. Morphological Analyses
4.10. Immunohistochemistry
4.11. Cell Counting
4.12. Seahorse XF Cell Mito Stress Test
4.13. Western Blot Analyses
4.14. Statistical Analyses
Supplementary Materials
Author Contributions
Funding
Institutional Review Board Statement
Informed Consent Statement
Data Availability Statement
Acknowledgments
Conflicts of Interest
Abbreviations
| ALS | Amyotrophic lateral sclerosis |
| ASR | Acoustic startle response |
| ATP | Adenosine triphosphate |
| ATF6 | Activating transcription factor 6 |
| BDNF | Brain-derived neurotrophic factor |
| BIP | Glucose-regulated protein (GRP-78) |
| DAPI | 4′,6-Diamidino-2-phenylindole |
| DMSO | Dimethyl sulfoxyde |
| dpf | Day post fertilization |
| ER | Endoplasmic reticulum |
| FCCP | Carbonyl cyanide-p-trifluoromethoxyphenylhydrazone |
| HRP | horseradish peroxydase |
| IP3R | Inositol 1,4,5-trisphosphate receptor |
| IRE1 | Inositol-requiring enzyme 1 |
| KO | Knockout |
| MAM | Mitochondria-associated ER membrane |
| MCU | Mitochondrial calcium uniporter |
| OCR | Oxygen consumption rate |
| OKR | Optokinetic response |
| PERK | Protein kinase R (PKR)-like endoplasmic reticulum kinase |
| qPCR | Quantitative polymerase chain reaction |
| S1R | σ1 Receptor |
| TCA | Tricarboxylic acid |
| UPR | Unfolded protein response |
| VMR | Visual motor response |
References
- Hayashi, T.; Su, T.P. Sigma-1 receptor chaperones at the ER-mitochondrion interface regulate Ca2+ signaling and cell survival. Cell 2007, 131, 596–610. [Google Scholar] [CrossRef] [PubMed]
- Penke, B.; Bogár, F.; Fülöp, L. β-Amyloid and the pathomechanisms of Alzheimer’s disease: A comprehensive view. Molecules 2017, 22, 1692. [Google Scholar] [CrossRef] [PubMed]
- Hayashi, T.; Maurice, T.; Su, T.P. Ca2+ signaling via sigma1-receptors: Novel regulatory mechanism affecting intracellular Ca2+ concentration. J. Pharmacol. Exp. Ther. 2000, 293, 788–798. [Google Scholar] [PubMed]
- Su, T.P.; Hayashi, T.; Maurice, T.; Buch, S.; Ruoho, A.E. The sigma-1 receptor chaperone as an inter-organelle signaling modulator. Trends Pharmacol. Sci. 2010, 31, 557–566. [Google Scholar] [CrossRef]
- Mori, T.; Hayashi, T.; Su, T.P. Compromising σ1 receptors at the endoplasmic reticulum render cytotoxicity to physiologically relevant concentrations of dopamine in a nuclear factor-κB/Bcl-2-dependent mechanism: Potential relevance to Parkinson’s disease. J. Pharmacol. Exp. Ther. 2012, 341, 663–671. [Google Scholar] [CrossRef]
- Eisner, V.; Picard, M.; Hajnóczky, G. Mitochondrial dynamics in adaptive and maladaptive cellular stress responses. Nat. Cell Biol. 2018, 20, 755–765. [Google Scholar] [CrossRef]
- Brailoiu, G.C.; Deliu, E.; Console-Bram, L.M.; Soboloff, J.; Abood, M.E.; Unterwald, E.M.; Brailoiu, E. Cocaine inhibits store-operated Ca2+ entry in brain microvascular endothelial cells: Critical role for sigma-1 receptors. Biochem. J. 2016, 473, 1–5. [Google Scholar] [CrossRef]
- Zhang, H.; Cuevas, J. Sigma receptors inhibit high-voltage-activated calcium channels in rat sympathetic and parasympathetic neurons. J. Neurophysiol. 2002, 87, 2867–2879. [Google Scholar] [CrossRef]
- Zhemkov, V.; Ditlev, J.A.; Lee, W.R.; Wilson, M.; Liou, J.; Rosen, M.K.; Bezprozvanny, I. The role of sigma 1 receptor in organization of endoplasmic reticulum signaling microdomains. Elife 2021, 10, e65192. [Google Scholar] [CrossRef]
- Su, T.P.; Junien, J.L. Sigma receptors in the central nervous system and the periphery. In Sigma Receptors; Itzhak, Y., Ed.; Academic Press: London, UK, 1994; pp. 21–44. [Google Scholar]
- Vilner, B.J.; John, C.S.; Bowen, W.D. Sigma-1 and sigma-2 receptors are expressed in a wide variety of human and rodent tumor cell lines. Cancer Res. 1995, 55, 408–413. [Google Scholar]
- Hayashi, T.; Su, T. The sigma receptor: Evolution of the concept in neuropsychopharmacology. Curr. Neuropharmacol. 2005, 3, 267–280. [Google Scholar] [CrossRef] [PubMed]
- Maurice, T.; Goguadze, N. Sigma-1 (σ1) receptor in memory and neurodegenerative diseases. Handb. Exp. Pharmacol. 2017, 244, 81–108. [Google Scholar] [CrossRef]
- Maurice, T. Bi-phasic dose response in the preclinical and clinical developments of sigma-1 receptor ligands for the treatment of neurodegenerative disorders. Expert Opin. Drug Discov. 2021, 16, 373–389. [Google Scholar] [CrossRef]
- Mancuso, R.; Oliván, S.; Rando, A.; Casas, C.; Osta, R.; Navarro, X. Sigma-1R agonist improves motor function and motoneuron survival in ALS mice. Neurotherapeutics 2012, 9, 814–826. [Google Scholar] [CrossRef] [PubMed]
- Mavlyutov, T.A.; Epstein, M.L.; Verbny, Y.I.; Huerta, M.S.; Zaitoun, I.; Ziskind-Conhaim, L.; Ruoho, A.E. Lack of sigma-1 receptor exacerbates ALS progression in mice. Neuroscience 2013, 240, 129–134. [Google Scholar] [CrossRef]
- Peviani, M.; Salvaneschi, E.; Bontempi, L.; Petese, A.; Manzo, A.; Rossi, D.; Salmona, M.; Collina, S.; Bigini, P.; Curti, D. Neuroprotective effects of the Sigma-1 receptor (S1R) agonist PRE-084, in a mouse model of motor neuron disease not linked to SOD1 mutation. Neurobiol. Dis. 2014, 62, 218–232. [Google Scholar] [CrossRef]
- Bhuiyan, M.S.; Fukunaga, K. Stimulation of sigma-1 receptor signaling by dehydroepiandrosterone ameliorates pressure overload-induced hypertrophy and dysfunctions in ovariectomized rats. Expert Opin. Ther. Targets 2009, 13, 1253–1265. [Google Scholar] [CrossRef] [PubMed]
- Tagashira, H.; Bhuiyan, S.; Shioda, N.; Hasegawa, H.; Kanai, H.; Fukunaga, K. Sigma1-receptor stimulation with fluvoxamine ameliorates transverse aortic constriction-induced myocardial hypertrophy and dysfunction in mice. Am. J. Physiol. Heart Circ. Physiol. 2010, 299, H1535–H1545. [Google Scholar] [CrossRef]
- Kibaly, C.; Meyer, L.; Patte-Mensah, C.; Mensah-Nyagan, A.G. Biochemical and functional evidence for the control of pain mechanisms by dehydroepiandrosterone endogenously synthesized in the spinal cord. FASEB J. 2008, 22, 93–104. [Google Scholar] [CrossRef]
- Gris, G.; Merlos, M.; Vela, J.M.; Zamanillo, D.; Portillo-Salido, E. S1RA, a selective sigma-1 receptor antagonist, inhibits inflammatory pain in the carrageenan and complete Freund’s adjuvant models in mice. Behav. Pharmacol. 2014, 25, 226–235. [Google Scholar] [CrossRef]
- Urani, A.; Roman, F.J.; Phan, V.L.; Su, T.P.; Maurice, T. The antidepressant-like effect induced by sigma1-receptor agonists and neuroactive steroids in mice submitted to the forced swimming test. J. Pharmacol. Exp. Ther. 2001, 298, 1269–1279. [Google Scholar]
- Chaki, S.; Nakazato, A.; Kennis, L.; Nakamura, M.; Mackie, C.; Sugiura, M.; Vinken, P.; Ashton, D.; Langlois, X.; Steckler, T. Anxiolytic- and antidepressant-like profile of a new CRF1 receptor antagonist, R278995/CRA0450. Eur. J. Pharmacol. 2004, 485, 145–158. [Google Scholar] [CrossRef]
- Omi, T.; Tanimukai, H.; Kanayama, D.; Sakagami, Y.; Tagami, S.; Okochi, M.; Morihara, T.; Sato, M.; Yanagida, K.; Kitasyoji, A.; et al. Fluvoxamine alleviates ER stress via induction of Sigma-1 receptor. Cell Death Dis. 2014, 5, e1332. [Google Scholar] [CrossRef] [PubMed]
- Romieu, P.; Martin-Fardon, R.; Bowen, W.D.; Maurice, T. Sigma1 receptor-related neuroactive steroids modulate cocaine-induced reward. J. Neurosci. 2003, 23, 3572–3576. [Google Scholar] [CrossRef]
- Maurice, T.; Casalino, M.; Lacroix, M.; Romieu, P. Involvement of the sigma 1 receptor in the motivational effects of ethanol in mice. Pharmacol. Biochem. Behav. 2003, 74, 869–876. [Google Scholar] [CrossRef]
- John, C.S.; Vilner, B.J.; Geyer, B.C.; Moody, T.; Bowen, W.D. Targeting sigma receptor-binding benzamides as in vivo diagnostic and therapeutic agents for human prostate tumors. Cancer Res. 1999, 59, 4578–4583. [Google Scholar] [PubMed]
- Gregianin, E.; Pallafacchina, G.; Zanin, S.; Crippa, V.; Rusmini, P.; Poletti, A.; Fang, M.; Li, Z.; Diano, L.; Petrucci, A.; et al. Loss-of-function mutations in the SIGMAR1 gene cause distal hereditary motor neuropathy by impairing ER-mitochondria tethering and Ca2+ signalling. Hum. Mol. Genet. 2016, 25, 3741–3753. [Google Scholar] [CrossRef] [PubMed]
- Lee, J.J.Y.; van Karnebeek, C.D.M.; Drögemoller, B.; Shyr, C.; Tarailo-Graovac, M.; Eydoux, P.; Ross, C.J.; Wasserman, W.W.; Björnson, B.; Wu, J.K. Further Validation of the SIGMAR1 c.151+1G>T mutation as cause of distal hereditary motor neuropathy. Child Neurol. Open 2016, 3, 2329048X16669912. [Google Scholar] [CrossRef]
- Al-Saif, A.; Al-Mohanna, F.; Bohlega, S. A mutation in sigma-1 receptor causes juvenile amyotrophic lateral sclerosis. Ann. Neurol. 2011, 70, 913–919. [Google Scholar] [CrossRef] [PubMed]
- Watanabe, S.; Ilieva, H.; Tamada, H.; Nomura, H.; Komine, O.; Endo, F.; Jin, S.; Mancias, P.; Kiyama, H.; Yamanaka, K. Mitochondria-associated membrane collapse is a common pathomechanism in SIGMAR1- and SOD1-linked ALS. EMBO Mol. Med. 2016, 8, 1421–1437. [Google Scholar] [CrossRef]
- Couly, S.; Goguadze, N.; Yasui, Y.; Kimura, Y.; Wang, S.M.; Sharikadze, N.; Wu, H.E.; Su, T.P. Knocking Out Sigma-1 Receptors Reveals Diverse Health Problems. Cell. Mol. Neurobiol. 2020. [Google Scholar] [CrossRef]
- Bai, Q.; Burton, E.A. Zebrafish models of Tauopathy. Biochim. Biophys. Acta 2011, 1812, 353–363. [Google Scholar] [CrossRef] [PubMed]
- Bandmann, O.; Burton, E.A. Genetic zebrafish models of neurodegenerative diseases. Neurobiol. Dis. 2010, 40, 58–65. [Google Scholar] [CrossRef]
- Das, S.; Rajanikant, G.K. Huntington disease: Can a zebrafish trail leave more than a ripple? Neurosci. Biobehav. Rev. 2014, 45, 258–261. [Google Scholar] [CrossRef] [PubMed]
- Laird, A.S.; Mackovski, N.; Rinkwitz, S.; Becker, T.S.; Giacomotto, J. Tissue-specific models of spinal muscular atrophy confirm a critical role of SMN in motor neurons from embryonic to adult stages. Hum. Mol. Genet. 2016, 25, 1728–1738. [Google Scholar] [CrossRef] [PubMed]
- Howe, K.; Clark, M.D.; Torroja, C.F.; Torrance, J.; Berthelot, C.; Muffato, M.; Collins, J.E.; Humphray, S.; McLaren, K.; Matthews, L.; et al. The zebrafish reference genome sequence and its relationship to the human genome. Nature 2013, 496, 498–503. [Google Scholar] [CrossRef] [PubMed]
- Taylor, K.L.; Grant, N.J.; Temperley, N.D.; Patton, E.E. Small molecule screening in zebrafish: An in vivo approach to identifying new chemical tools and drug leads. Cell Commun. Signal. 2010, 8, 11. [Google Scholar] [CrossRef]
- Rennekamp, A.J.; Huang, X.P.; Wang, Y.; Patel, S.; Lorello, P.J.; Cade, L.; Gonzales, A.P.; Yeh, J.R.; Caldarone, B.J.; Roth, B.L.; et al. σ1 receptor ligands control a switch between passive and active threat responses. Nat. Chem. Biol. 2016, 12, 552–558. [Google Scholar] [CrossRef]
- Hanner, M.; Moebius, F.F.; Flandorfer, A.; Knaus, H.G.; Striessnig, J.; Kempner, E.; Glossmann, H. Purification, molecular cloning, and expression of the mammalian sigma1-binding site. Proc. Natl. Acad. Sci. USA 1996, 93, 8072–8077. [Google Scholar] [CrossRef]
- Ruoho, A.E.; Chu, U.B.; Ramachandran, S.; Fontanilla, D.; Mavlyutov, T.; Hajipour, A.R. The ligand binding region of the sigma-1 receptor: Studies utilizing photoaffinity probes, sphingosine and N-alkylamines. Curr. Pharm. Des. 2012, 18, 920–929. [Google Scholar] [CrossRef]
- Schmidt, H.R.; Zheng, S.; Gurpinar, E.; Koehl, A.; Manglik, A.; Kruse, A.C. Crystal structure of the human σ1 receptor. Nature 2016, 532, 527–530. [Google Scholar] [CrossRef]
- Mavylutov, T.; Chen, X.; Guo, L.; Yang, J. APEX2- tagging of Sigma 1-receptor indicates subcellular protein topology with cytosolic N-terminus and ER luminal C-terminus. Protein Cell 2018, 9, 733–737. [Google Scholar] [CrossRef]
- Langa, F.; Codony, X.; Tovar, V.; Lavado, A.; Giménez, E.; Cozar, P.; Cantero, M.; Dordal, A.; Hernández, E.; Pérez, R.; et al. Generation and phenotypic analysis of sigma receptor type I (σ1) knockout mice. Eur. J. Neurosci. 2003, 18, 2188–2196. [Google Scholar] [CrossRef] [PubMed]
- Yamashita, D.; Sun, G.W.; Cui, Y.; Mita, S.; Otsuki, N.; Kanzaki, S.; Nibu, K.; Ogawa, K.; Matsunaga, T. Neuroprotective effects of cutamesine, a ligand of the sigma-1 receptor chaperone, against noise-induced hearing loss. J. Neurosci. Res. 2015, 93, 788–795. [Google Scholar] [CrossRef] [PubMed]
- Koshenov, Z.; Oflaz, F.E.; Hirtl, M.; Pilic, J.; Bachkoenig, O.A.; Gottschalk, B.; Madreiter-Sokolowski, C.T.; Rost, R.; Malli, R.; Graier, W.F. Sigma-1 receptor promotes mitochondrial bioenergetics by orchestrating ER Ca2+ leak during early ER stress. Metabolites 2021, 11, 422. [Google Scholar] [CrossRef]
- Hayashi, T.; Justinova, Z.; Hayashi, E.; Cormaci, G.; Mori, T.; Tsai, S.Y.; Barnes, C.; Goldberg, S.R.; Su, T.P. Regulation of sigma-1 receptors and endoplasmic reticulum chaperones in the brain of methamphetamine self-administering rats. J. Pharmacol. Exp. Ther. 2010, 332, 1054–1063. [Google Scholar] [CrossRef] [PubMed]
- Mitsuda, T.; Omi, T.; Tanimukai, H.; Sakagami, Y.; Tagami, S.; Okochi, M.; Kudo, T.; Takeda, M. Sigma-1Rs are upregulated via PERK/eIF2α/ATF4 pathway and execute protective function in ER stress. Biochem. Biophys. Res. Commun. 2011, 415, 519–525. [Google Scholar] [CrossRef]
- Su, T.P. Non-canonical targets mediating the action of drugs of abuse: Cocaine at the sigma-1 receptor as an example. Front. Neurosci. 2019, 13, 761. [Google Scholar] [CrossRef]
- Hedskog, L.; Pinho, C.M.; Filadi, R.; Rönnbäck, A.; Hertwig, L.; Wiehager, B.; Larssen, P.; Gellhaar, S.; Sandebring, A.; Westerlund, M.; et al. Modulation of the endoplasmic reticulum-mitochondria interface in Alzheimer’s disease and related models. Proc. Natl. Acad. Sci. USA 2013, 10, 7916–7921. [Google Scholar] [CrossRef]
- Angebault, C.; Fauconnier, J.; Patergnani, S.; Rieusset, J.; Danese, A.; Affortit, C.A.; Jagodzinska, J.; Mégy, C.; Quiles, M.; Cazevieille, C.; et al. ER-mitochondria cross-talk is regulated by the Ca2+ sensor NCS1 and is impaired in Wolfram syndrome. Sci. Signal. 2018, 11, eaaq1380. [Google Scholar] [CrossRef]
- Delprat, B.; Crouzier, L.; Su, T.P.; Maurice, T. At the crossing of ER stress and MAMs: A key role of sigma-1 receptor? Adv. Exp. Med. Biol. 2020, 1131, 699–718. [Google Scholar] [CrossRef]
- Goguadze, N.; Zhuravliova, E.; Morin, D.; Mikeladze, D.; Maurice, T. Sigma-1 receptor agonists induce oxidative stress in mitochondria and enhance complex i activity in physiological condition but protect against pathological oxidative stress. Neurotox. Res. 2019, 35, 1–18. [Google Scholar] [CrossRef]
- Sabino, V.; Cottone, P.; Parylak, S.L.; Steardo, L.; Zorrilla, E.P. Sigma-1 receptor knockout mice display a depressive-like phenotype. Behav. Brain. Res. 2009, 198, 472–476. [Google Scholar] [CrossRef]
- Chevallier, N.; Keller, E.; Maurice, T. Behavioural phenotyping of knockout mice for the sigma-1 (σ₁) chaperone protein revealed gender-related anxiety, depressive-like and memory alterations. J. Psychopharmacol. 2011, 25, 960–975. [Google Scholar] [CrossRef] [PubMed]
- Eachus, H.; Choi, M.K.; Ryu, S. The effects of early life stress on the brain and behaviour: Insights from zebrafish models. Front. Cell Dev. Biol. 2021, 9, 657591. [Google Scholar] [CrossRef] [PubMed]
- Tsai, S.Y.; Hayashi, T.; Harvey, B.K.; Wang, Y.; Wu, W.W.; Shen, R.F.; Zhang, Y.; Becker, K.G.; Hoffer, B.J.; Su, T.P. Sigma-1 receptors regulate hippocampal dendritic spine formation via a free radical-sensitive mechanism involving Rac1xGTP pathway. Proc. Natl. Acad. Sci. USA 2009, 106, 22468–22473. [Google Scholar] [CrossRef] [PubMed]
- Ryskamp, D.A.; Zhemkov, V.; Bezprozvanny, I. Mutational Analysis of Sigma-1 Receptor’s Role in Synaptic Stability. Front. Neurosci. 2019, 13, 1012. [Google Scholar] [CrossRef] [PubMed]
- Tsai, S.Y.; Chuang, J.Y.; Tsai, M.S.; Wang, X.F.; Xi, Z.X.; Hung, J.J.; Chang, W.C.; Bonci, A.; Su, T.P. Sigma-1 receptor mediates cocaine-induced transcriptional regulation by recruiting chromatin-remodeling factors at the nuclear envelope. Proc. Natl. Acad. Sci. USA 2015, 112, E6562–E6570. [Google Scholar] [CrossRef] [PubMed]
- Fontanilla, D.; Johannessen, M.; Hajipour, A.R.; Cozzi, N.V.; Jackson, M.B.; Ruoho, A.E. The hallucinogen N,N-dimethyltryptamine (DMT) is an endogenous sigma-1 receptor regulator. Science 2009, 323, 934–937. [Google Scholar] [CrossRef]
- Berg, E.M.; Björnfors, E.R.; Pallucchi, I.; Picton, L.D.; El Manira, A. Principles governing locomotion in vertebrates: Lessons from zebrafish. Front. Neural Circuits 2018, 12, 73. [Google Scholar] [CrossRef]
- Alonso, G.; Phan, V.; Guillemain, I.; Saunier, M.; Legrand, A.; Anoal, M.; Maurice, T. Immunocytochemical localization of the sigma(1) receptor in the adult rat central nervous system. Neuroscience 2000, 97, 155–170. [Google Scholar] [CrossRef]
- Casas, C.; Herrando-Grabulosa, M.; Manzano, R.; Mancuso, R.; Osta, R.; Navarro, X. Early presymptomatic cholinergic dysfunction in a murine model of amyotrophic lateral sclerosis. Brain Behav. 2013, 3, 145–158. [Google Scholar] [CrossRef]
- Gaja-Capdevila, N.; Hernández, N.; Zamanillo, D.; Vela, J.M.; Merlos, M.; Navarro, X.; Herrando-Grabulosa, M. Neuroprotective effects of sigma 1 receptor ligands on motoneuron death after spinal root injury in mice. Int. J. Mol. Sci. 2021, 22, 6956. [Google Scholar] [CrossRef]
- Naia, L.; Ly, P.; Mota, S.I.; Lopes, C.; Maranga, C.; Coelho, P.; Gershoni-Emek, N.; Ankarcrona, M.; Geva, M.; Hayden, M.R.; et al. The Sigma-1 receptor mediates pridopidine rescue of mitochondrial function in Huntington disease models. Neurotherapeutics 2021, 18, 1017–1038. [Google Scholar] [CrossRef]
- Zhang, B.; Wang, L.; Chen, T.; Hong, J.; Sha, S.; Wang, J.; Xiao, H.; Chen, L. Sigma-1 receptor deficiency reduces GABAergic inhibition in the basolateral amygdala leading to LTD impairment and depressive-like behaviors. Neuropharmacology 2017, 116, 387–398. [Google Scholar] [CrossRef]
- Fetcho, J.R.; Cox, K.J.; O’Malley, D.M. Monitoring activity in neuronal populations with single-cell resolution in a behaving vertebrate. Histochem. J. 1998, 30, 153–167. [Google Scholar] [CrossRef]
- Ola, M.S.; Moore, P.; El-Sherbeny, A.; Roon, P.; Agarwal, N.; Sarthy, V.P.; Casellas, P.; Ganapathy, V.; Smith, S.B. Expression pattern of sigma receptor 1 mRNA and protein in mammalian retina. Mol. Brain Res. 2001, 95, 86–95. [Google Scholar] [CrossRef]
- Fleisch, V.C.; Jametti, T.; Neuhauss, S.C. Electroretinogram (ERG) Measurements in Larval Zebrafish. CSH Protoc. 2008, 2008, pdb.prot4973. [Google Scholar] [CrossRef][Green Version]
- Morihara, R.; Yamashita, T.; Liu, X.; Nakano, Y.; Fukui, Y.; Sato, K.; Ohta, Y.; Hishikawa, N.; Shang, J.; Abe, K. Protective effect of a novel sigma-1 receptor agonist is associated with reduced endoplasmic reticulum stress in stroke male mice. J. Neurosci. Res. 2018, 96, 1707–1716. [Google Scholar] [CrossRef]
- Shenkman, M.; Geva, M.; Gershoni-Emek, N.; Hayden, M.R.; Lederkremer, G.Z. Pridopidine reduces mutant huntingtin-induced endoplasmic reticulum stress by modulation of the Sigma-1 receptor. J Neurochem. 2021, 158, 467–481. [Google Scholar] [CrossRef]
- Abdullah, C.S.; Alam, S.; Aishwarya, R.; Miriyala, S.; Panchatcharam, M.; Bhuiyan, M.A.N.; Peretik, J.M.; Orr, A.W.; James, J.; Osinska, H.; et al. Cardiac dysfunction in the sigma 1 receptor knockout mouse associated with impaired mitochondrial dynamics and bioenergetics. J. Am. Heart Assoc. 2018, 7, e009775. [Google Scholar] [CrossRef]
- He, J.; Gong, M.; Wang, Z.; Liu, D.; Xie, B.; Luo, C.; Li, G.; Tse, G.; Liu, T. Cardiac abnormalities after induction of endoplasmic reticulum stress are associated with mitochondrial dysfunction and connexin43 expression. Clin. Exp. Pharmacol. Physiol. 2021, 48, 1371–1381. [Google Scholar] [CrossRef]
- Jackisch, L.; Murphy, A.M.; Kumar, S.; Randeva, H.; Tripathi, G.; McTernan, P.G. Tunicamycin-induced endoplasmic reticulum stress mediates mitochondrial dysfunction in human adipocytes. J. Clin. Endocrinol. Metab. 2020, 105, dgaa258. [Google Scholar] [CrossRef]
- Kilkenny, C.; Browne, W.; Cuthill, I.C.; Emerson, M.; Altman, D.G.; NC3Rs Reporting Guidelines Working Group. Animal research: Reporting in vivo experiments: The ARRIVE guidelines. Br. J. Pharmacol. 2010, 160, 1577–1579. [Google Scholar] [CrossRef]
- Lee, S.; Lee, H.; Kim, K.T. Optimization of experimental conditions and measurement of oxygen consumption rate (OCR) in zebrafish embryos exposed to organophosphate flame retardants (OPFRs). Ecotoxicol. Environ. Saf. 2019, 182, 109377. [Google Scholar] [CrossRef]


Publisher’s Note: MDPI stays neutral with regard to jurisdictional claims in published maps and institutional affiliations. |
© 2021 by the authors. Licensee MDPI, Basel, Switzerland. This article is an open access article distributed under the terms and conditions of the Creative Commons Attribution (CC BY) license (https://creativecommons.org/licenses/by/4.0/).
Share and Cite
Crouzier, L.; Denus, M.; Richard, E.M.; Tavernier, A.; Diez, C.; Cubedo, N.; Maurice, T.; Delprat, B. Sigma-1 Receptor Is Critical for Mitochondrial Activity and Unfolded Protein Response in Larval Zebrafish. Int. J. Mol. Sci. 2021, 22, 11049. https://doi.org/10.3390/ijms222011049
Crouzier L, Denus M, Richard EM, Tavernier A, Diez C, Cubedo N, Maurice T, Delprat B. Sigma-1 Receptor Is Critical for Mitochondrial Activity and Unfolded Protein Response in Larval Zebrafish. International Journal of Molecular Sciences. 2021; 22(20):11049. https://doi.org/10.3390/ijms222011049
Chicago/Turabian StyleCrouzier, Lucie, Morgane Denus, Elodie M. Richard, Amarande Tavernier, Camille Diez, Nicolas Cubedo, Tangui Maurice, and Benjamin Delprat. 2021. "Sigma-1 Receptor Is Critical for Mitochondrial Activity and Unfolded Protein Response in Larval Zebrafish" International Journal of Molecular Sciences 22, no. 20: 11049. https://doi.org/10.3390/ijms222011049
APA StyleCrouzier, L., Denus, M., Richard, E. M., Tavernier, A., Diez, C., Cubedo, N., Maurice, T., & Delprat, B. (2021). Sigma-1 Receptor Is Critical for Mitochondrial Activity and Unfolded Protein Response in Larval Zebrafish. International Journal of Molecular Sciences, 22(20), 11049. https://doi.org/10.3390/ijms222011049