Article

Comparison of Cr(VI) Adsorption Using Synthetic Schwertmannite Obtained by Fe3+ Hydrolysis and Fe2+ Oxidation: Kinetics, Isotherms and Adsorption Mechanism

Department of Process Engineering and Technology of Polymer and Carbon Materials, Wroclaw University of Science and Technology, Wybrzeże Wyspiańskiego Street 27, 50-370 Wrocław, Poland
*
Author to whom correspondence should be addressed.
Int. J. Mol. Sci. 2021, 22(15), 8175; https://doi.org/10.3390/ijms22158175
Submission received: 24 June 2021 / Revised: 17 July 2021 / Accepted: 23 July 2021 / Published: 30 July 2021
(This article belongs to the Special Issue Mesoporous Materials 2020: From Synthesis to Applications)

Abstract

:
Good sorption properties and simple synthesis route make schwertmannite an increasingly popular adsorbent. In this work, the adsorption properties of synthetic schwertmannite towards Cr(VI) were investigated. This study aimed to compare the properties and sorption performance of adsorbents obtained by two methods: Fe3+ hydrolysis (SCHA) and Fe2+ oxidation (SCHB). To characterise the sorbents before and after Cr(VI) adsorption, specific surface area, particle size distribution, density, and zeta potential were determined. Additionally, optical micrographs, SEM, and FTIR analyses were performed. Adsorption experiments were performed in varying process conditions: pH, adsorbent dosage, contact time, and initial concentration. Adsorption isotherms were fitted by Freundlich, Langmuir, and Temkin models. Pseudo-first-order, pseudo-second-order, intraparticle diffusion, and liquid film diffusion models were used to fit the kinetics data. Linear regression was used to estimate the parameters of isotherm and kinetic models. The maximum adsorption capacity resulting from the fitted Langmuir isotherm is 42.97 and 17.54 mg·g−1 for SCHA and SCHB. Results show that the adsorption kinetics follows the pseudo-second-order kinetic model. Both iron-based adsorbents are suitable for removing Cr(VI) ions from aqueous solutions. Characterisation of the adsorbents after adsorption suggests that Cr(VI) adsorption can be mainly attributed to ion exchange with SO42 groups.

1. Introduction

Environmental pollution is a constant struggle in our thriving society. Toxic metal ions present in certain process effluents, if discharged into surface water, are a threat not only to the environment [1,2] but directly to human health, as well [3]. The negative impact of toxic metal pollution in water on living organisms was described in the literature by many authors over the years [1,2]. Through decades, industry impact on the environment was ignored by governments, as in Poland or other Eastern Europe countries under Soviet Union influence [4]. This ignorance has led to irreversible devastation of the environment. Nowadays, emission problems are addressed in most regions of the world. Adequate institutions were established and set the emission limit values by the Best Available Techniques (European Commission, Directive 2010/75/EU). Those limit values can be lowered further as new techniques are developed, or the present methods are optimised to be more accessible and economically viable. There is a constant pursuit for better, cheaper, and safer toxic metal removal methods.
Chromium is one of many metals with ions that are considered toxic. Chromium mostly occurs in the two most stable oxidation states, Cr(III) and Cr(VI) [5], both of which are toxic to living organisms [6]. One of the most abundant elements on earth, chromium ions are present in the environment naturally deposited in the form of minerals [5]. However, chromium has found its use in many industry sectors, including metal processing or dye and pigment production [3]. Processing this metal leads to toxic chromium ions emissions into the environment with industrial wastewater. Another source of chromium contamination is fumes from fossil fuel incineration [3]. Chromium released into the environment in excess through anthropogenic activity is threatening to the environment and human health. Hence, there is a need to improve existing chromium ion removal techniques to minimise human-caused devastation.
Over the past few decades, water treatment became one of the most pressing industry matters. Many metal ion removal techniques were developed. Chromium ion removal techniques include adsorption [7], biosorption [8], chemical precipitation [9], ion exchange [10], and electrochemical methods [11]. Adsorptive methods can be very efficient and employ low-cost materials-by-products or waste products of certain large-scale processes. Fly ash would be an example, as certain fly ash types can perform well as adsorbents on their own or after brief modification [12,13,14]. Use of problematic waste such as fly ash or iron oxides to remove toxic ions fulfils the guidelines of sustainable management and development.
Iron oxyhydroxides are known adsorbents of toxic chromium ions as weak acid oxyanions have a strong affinity towards their proton-specific surface sites [15]. Iron-containing minerals can effectively remove chromium oxyanions in acidic conditions (pH 2–7). However, oxyanions affinity towards iron oxyhydroxides can be disrupted by other ion species such as sulphuric, selenite, or phosphate anions [16,17]. Adsorption is one of two mechanisms employed by iron oxyhydroxides as chromium ion removal agents. The second mechanism of Cr(VI) removal from aqueous solutions is their reduction with the use of iron(II)-containing minerals [18,19], as the products of the reduction are poorly soluble in water. New materials based on chromium affinity towards iron-containing minerals are still being developed. Researchers have published reports on novel solutions implementing iron oxides and oxyhydroxides properties [20,21].
Schwertmannite is a name of an iron–oxyhydroxysulfate mineral with a chemical formula of Fe3+16O16(OH,SO4)1213 × 1012 H2O. It is chemically stable, although it tends to transform into goethite in acidic conditions [22]. Schwertmannite loaded with Cr(VI) oxyanions is stable at pH 4 and does not transform to goethite [22]. Schwertmannite occurs naturally, but for pollutant removal, synthetic schwertmannite is usually used [23]. Schwertmannite sorbents can remove a variety of contaminants including fluorides, toxic metal ions, oxyanions, and organic pollutants [23,24,25,26,27,28,29,30,31,32]. Schwertmannite is an excellent oxyanion adsorbent as it is characterised by positive surface potential and a large surface area of 100–200 m2·g−1, and additionally its crystallographic structure allows it to incorporate oxyanions to its crystal structure [22]. Schwertmannite is a universal adsorbent that requires careful investigation of its adsorptive properties. Synthetic schwertmannite is attracting interest because, due to its simple and relatively inexpensive method of production, it could provide an alternative to natural schwertmannite, thereby reducing its exploitation from the environment.
This paper presents adsorption studies of Cr(VI) on synthetic schwertmannite sorbents obtained through two different synthesis methods: Fe2+ oxidation and Fe3+ hydrolysis. The physicochemical characteristics of the sorbents were determined, described, and then contrasted. The adsorption properties of two sorbents were then compared in terms of Cr(VI) affinity under varying conditions of dosage, pH, time, and Cr(VI) concentration. The effects of pH and dosage were investigated to find the optimum process parameters and then kinetics and isotherm experiments were performed and described.

2. Results and Discussion

2.1. Characterisation of Adsorbents

The particle size analysis by laser diffraction enabled visualisation of the volumetric particle size distribution of the synthesised schwertmannite by two methods: Fe3+ hydrolysis (SCHA) and Fe2+ oxidation (SCHB). The particle size distributions for both materials are shown in Figure 1.
A complete analysis of particle size by laser diffraction showed that the particle size distribution of SCHA indicated a median diameter (d50) of about 6.6 μm, while d10 and d90 were 2.8 and 15.9 μm, respectively. SCHB particle size analysis showed a median diameter (d50) of approximately 7.1 μm, while d10 and d90 were 2.2 and 14.7 μm, respectively. It can be seen in Figure 1 that the systems considered are dominated by particles in the range of 2 to 15 μm, but a group of particles smaller than 1 μm also appears, suggesting that the resulting materials may be nano-sized. Additionally, a parameter, which shows the width of the size distribution (span), was calculated. The span is determined as [33]:
span = (d90 − d10)/d50
The span indicates how far the 10% and 90% points are apart, normalised with the midpoint. Merkus, in his classification, proposed six ranges of the width of the size distribution [33]: span < 1.02 dimensional, 1.02 < span < 1.05 very narrow, 1.05 < span < 1.5 narrow, 1.5 < span < 4.0 average, 4.0 < span < 10 wide, and span > 10 very wide. The calculated using Equation (1) span values for SCHA and SCHB are 1.98 and 1.76, respectively, which means that the width of the particle size distribution for tested schwertmannite sorbents is in the average range.
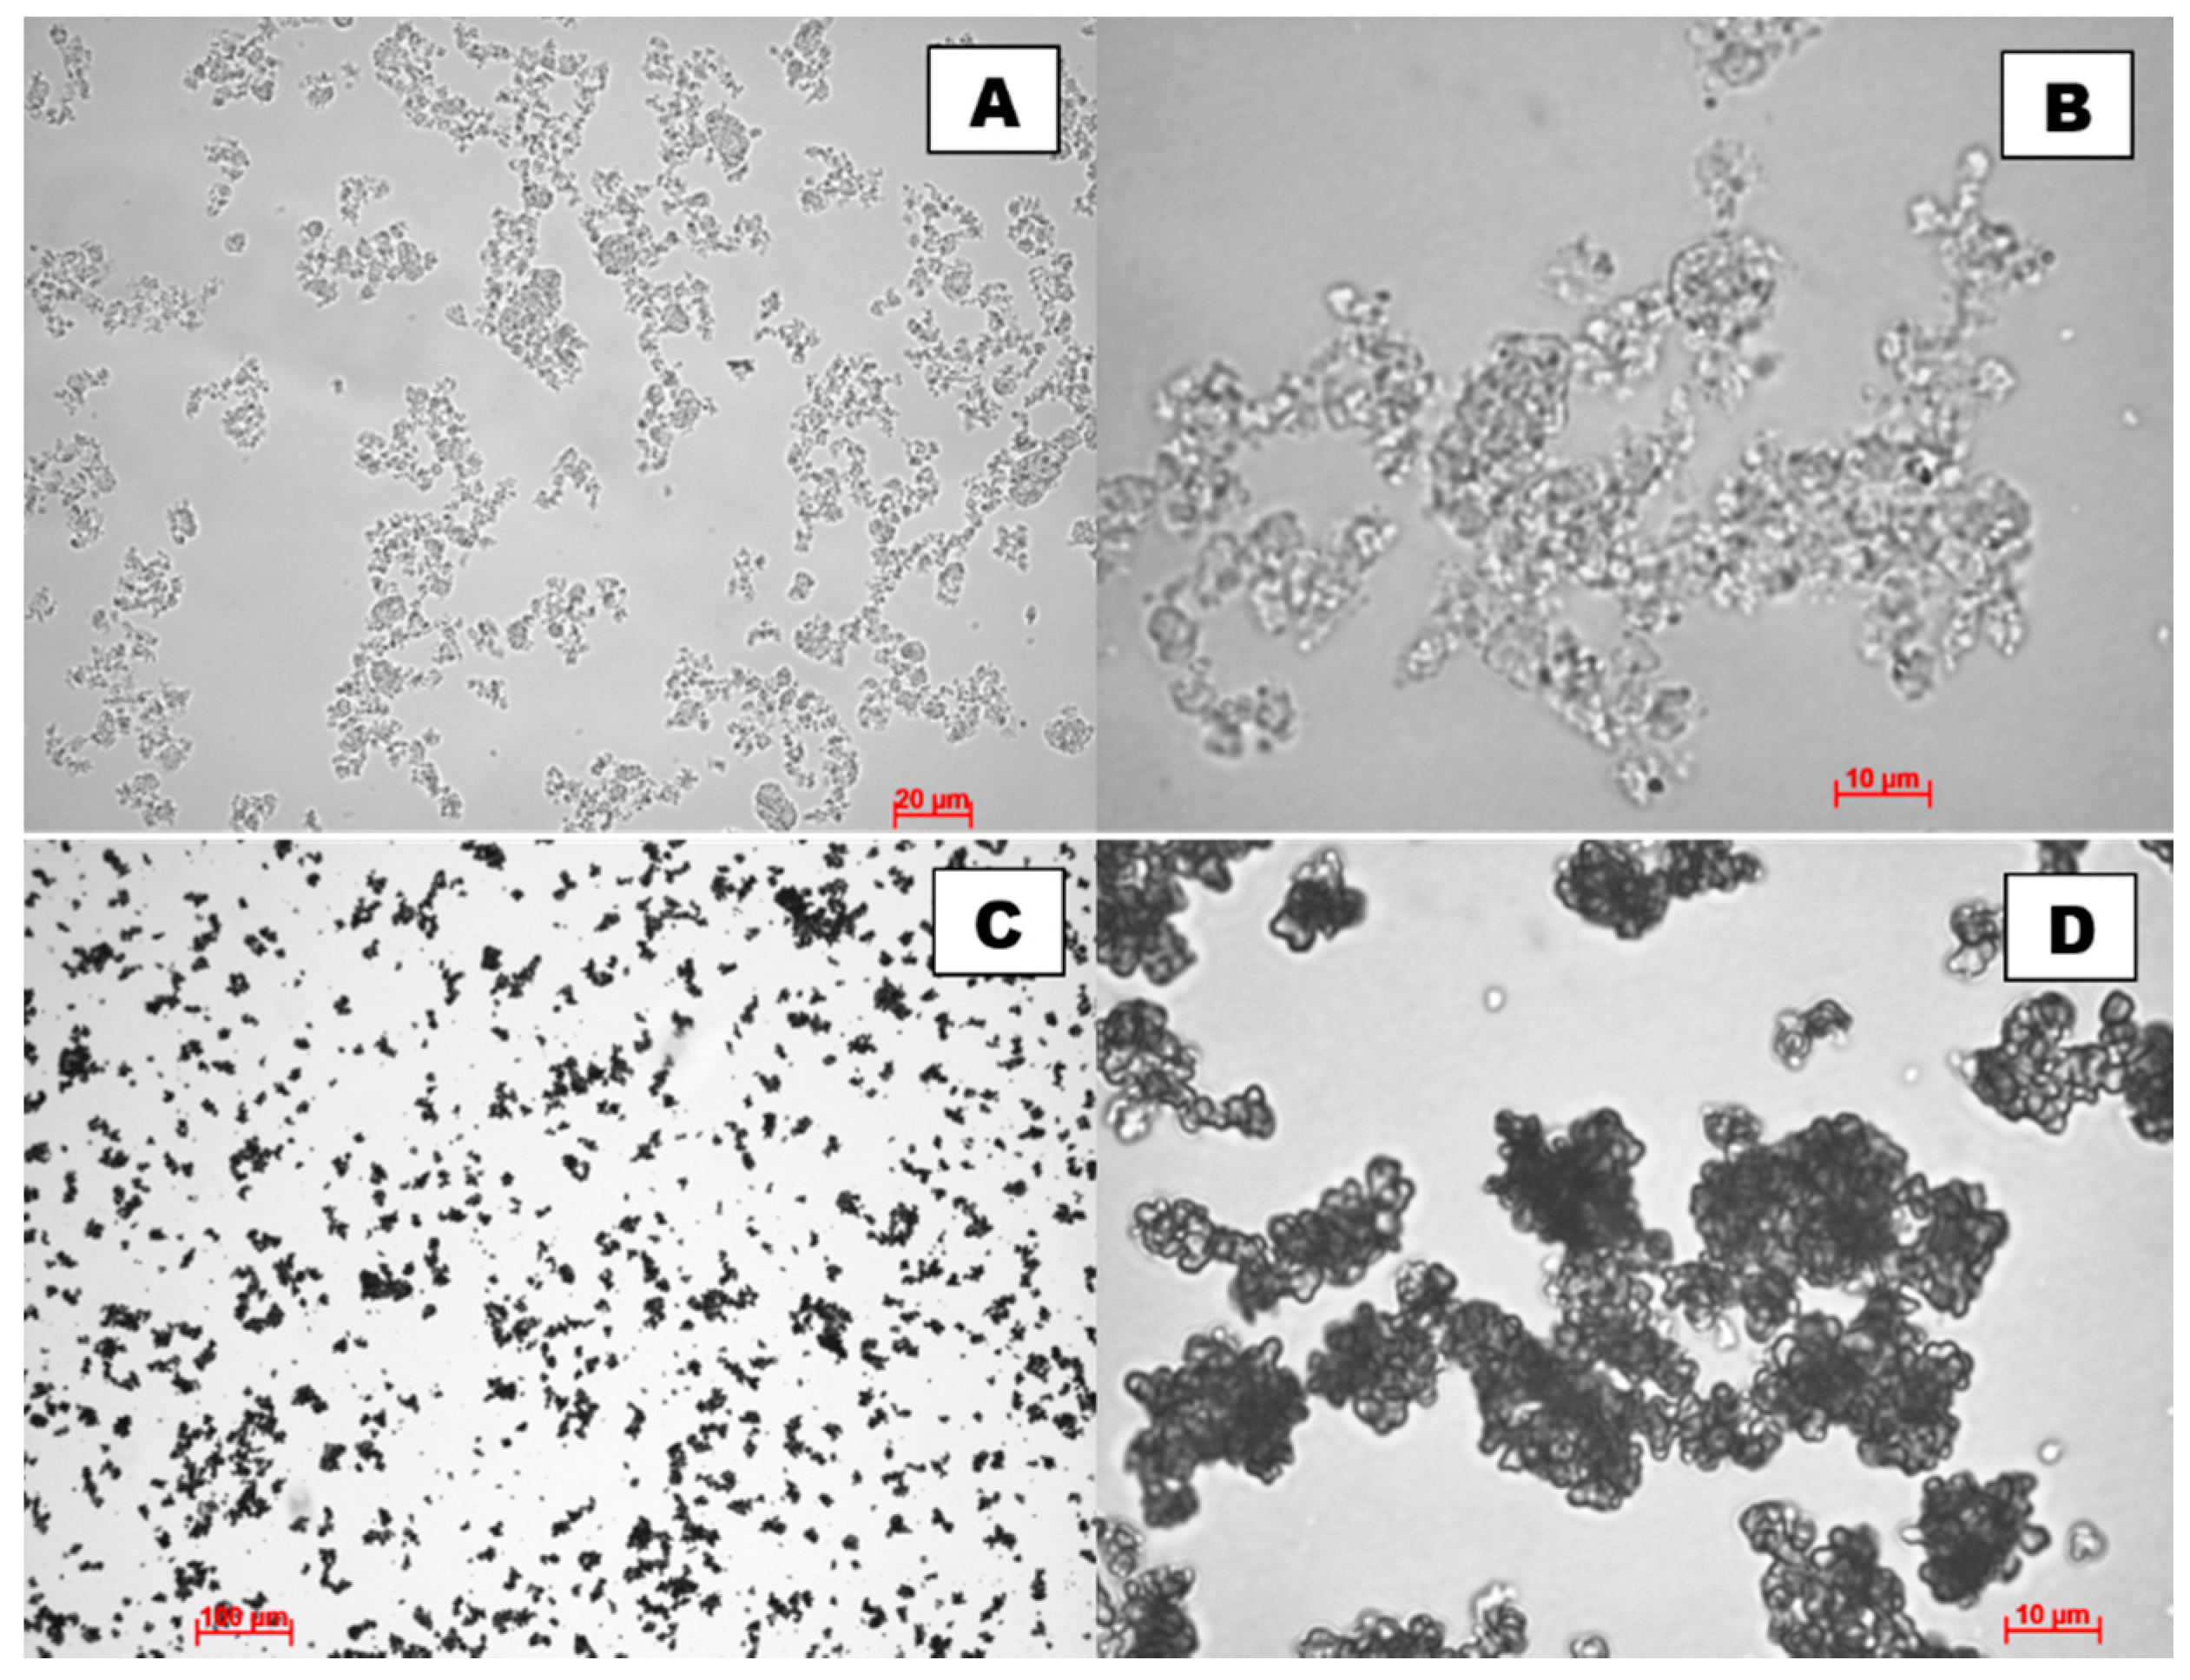
The morphology and particle size of the produced schwertmannite were observed using both optical and scanning electron microscope. The optical micrographs are shown in Figure 2 and SEM micrographs in Figure 3. The size of adsorbent particles is visible in the optical microscope images. Particles of several hundred nanometres in size are visible alongside aggregates of around a few tens of microns, as confirmed by an earlier analysis of the particle size distribution (Figure 1). The SCHA sample is brighter in transmitted light, and has more crystalline and smaller particles than the SCHB sample.
In the SCHA sample (Fe3+ hydrolysis), disorderly distributed, elongated, locally fibrous crystallites forming clusters with considerable porosity can be observed (Figure 3A,B). In contrast, characteristic “hedgehog” aggregates can be observed in the SCHB sample (Fe2+ oxidation), but the main forms in which schwertmannite occurs are rounded, isomeric aggregates of about 2 μm in size (Figure 3C,D), resembling ferrihydrite clusters but differing in surface character, indicating that they consist of very fine, elongated crystallites. Very similar morphological features were observed for synthetic schwertmannite in the literature [27,34,35,36,37,38,39,40,41,42,43]. Finally, the SEM images show the size of the sorbent particles produced.
The extent of the specific surface area of the sorbents is strongly influenced by the surface morphology and schwertmannite particle size. The measured BET specific surface area was 78.6 and 136.7 m2·g−1 for SCHA and SCHB, respectively. The well-developed specific surface area suggests that both obtained schwertmannite samples may be good Cr(VI) sorbents. The literature also confirms that schwertmannite obtained by chemical oxidation is characterised by a smaller surface area than that obtained by rapid hydrolysis. Chemical oxidation yields schwertmannite with a specific surface area of 4–14 m2·g1 [30], 2.06–16.3 m2·g1 [44], 48.2 m2·g1 [27], and even 130.9 m2·g1 [45]. In contrast, rapid hydrolysis enables the synthesis of schwertmannite with a specific surface area several times greater, e.g., 165 m2·g1 [46], 199.4 m2·g1 [47], 206.1 m2·g1 [29], and even 325.5 m2·g1 [48]. The density of SCHA and SCHB was determined using a pycnometer, and amounts to 3.54 and 3.75 g·cm3, respectively.
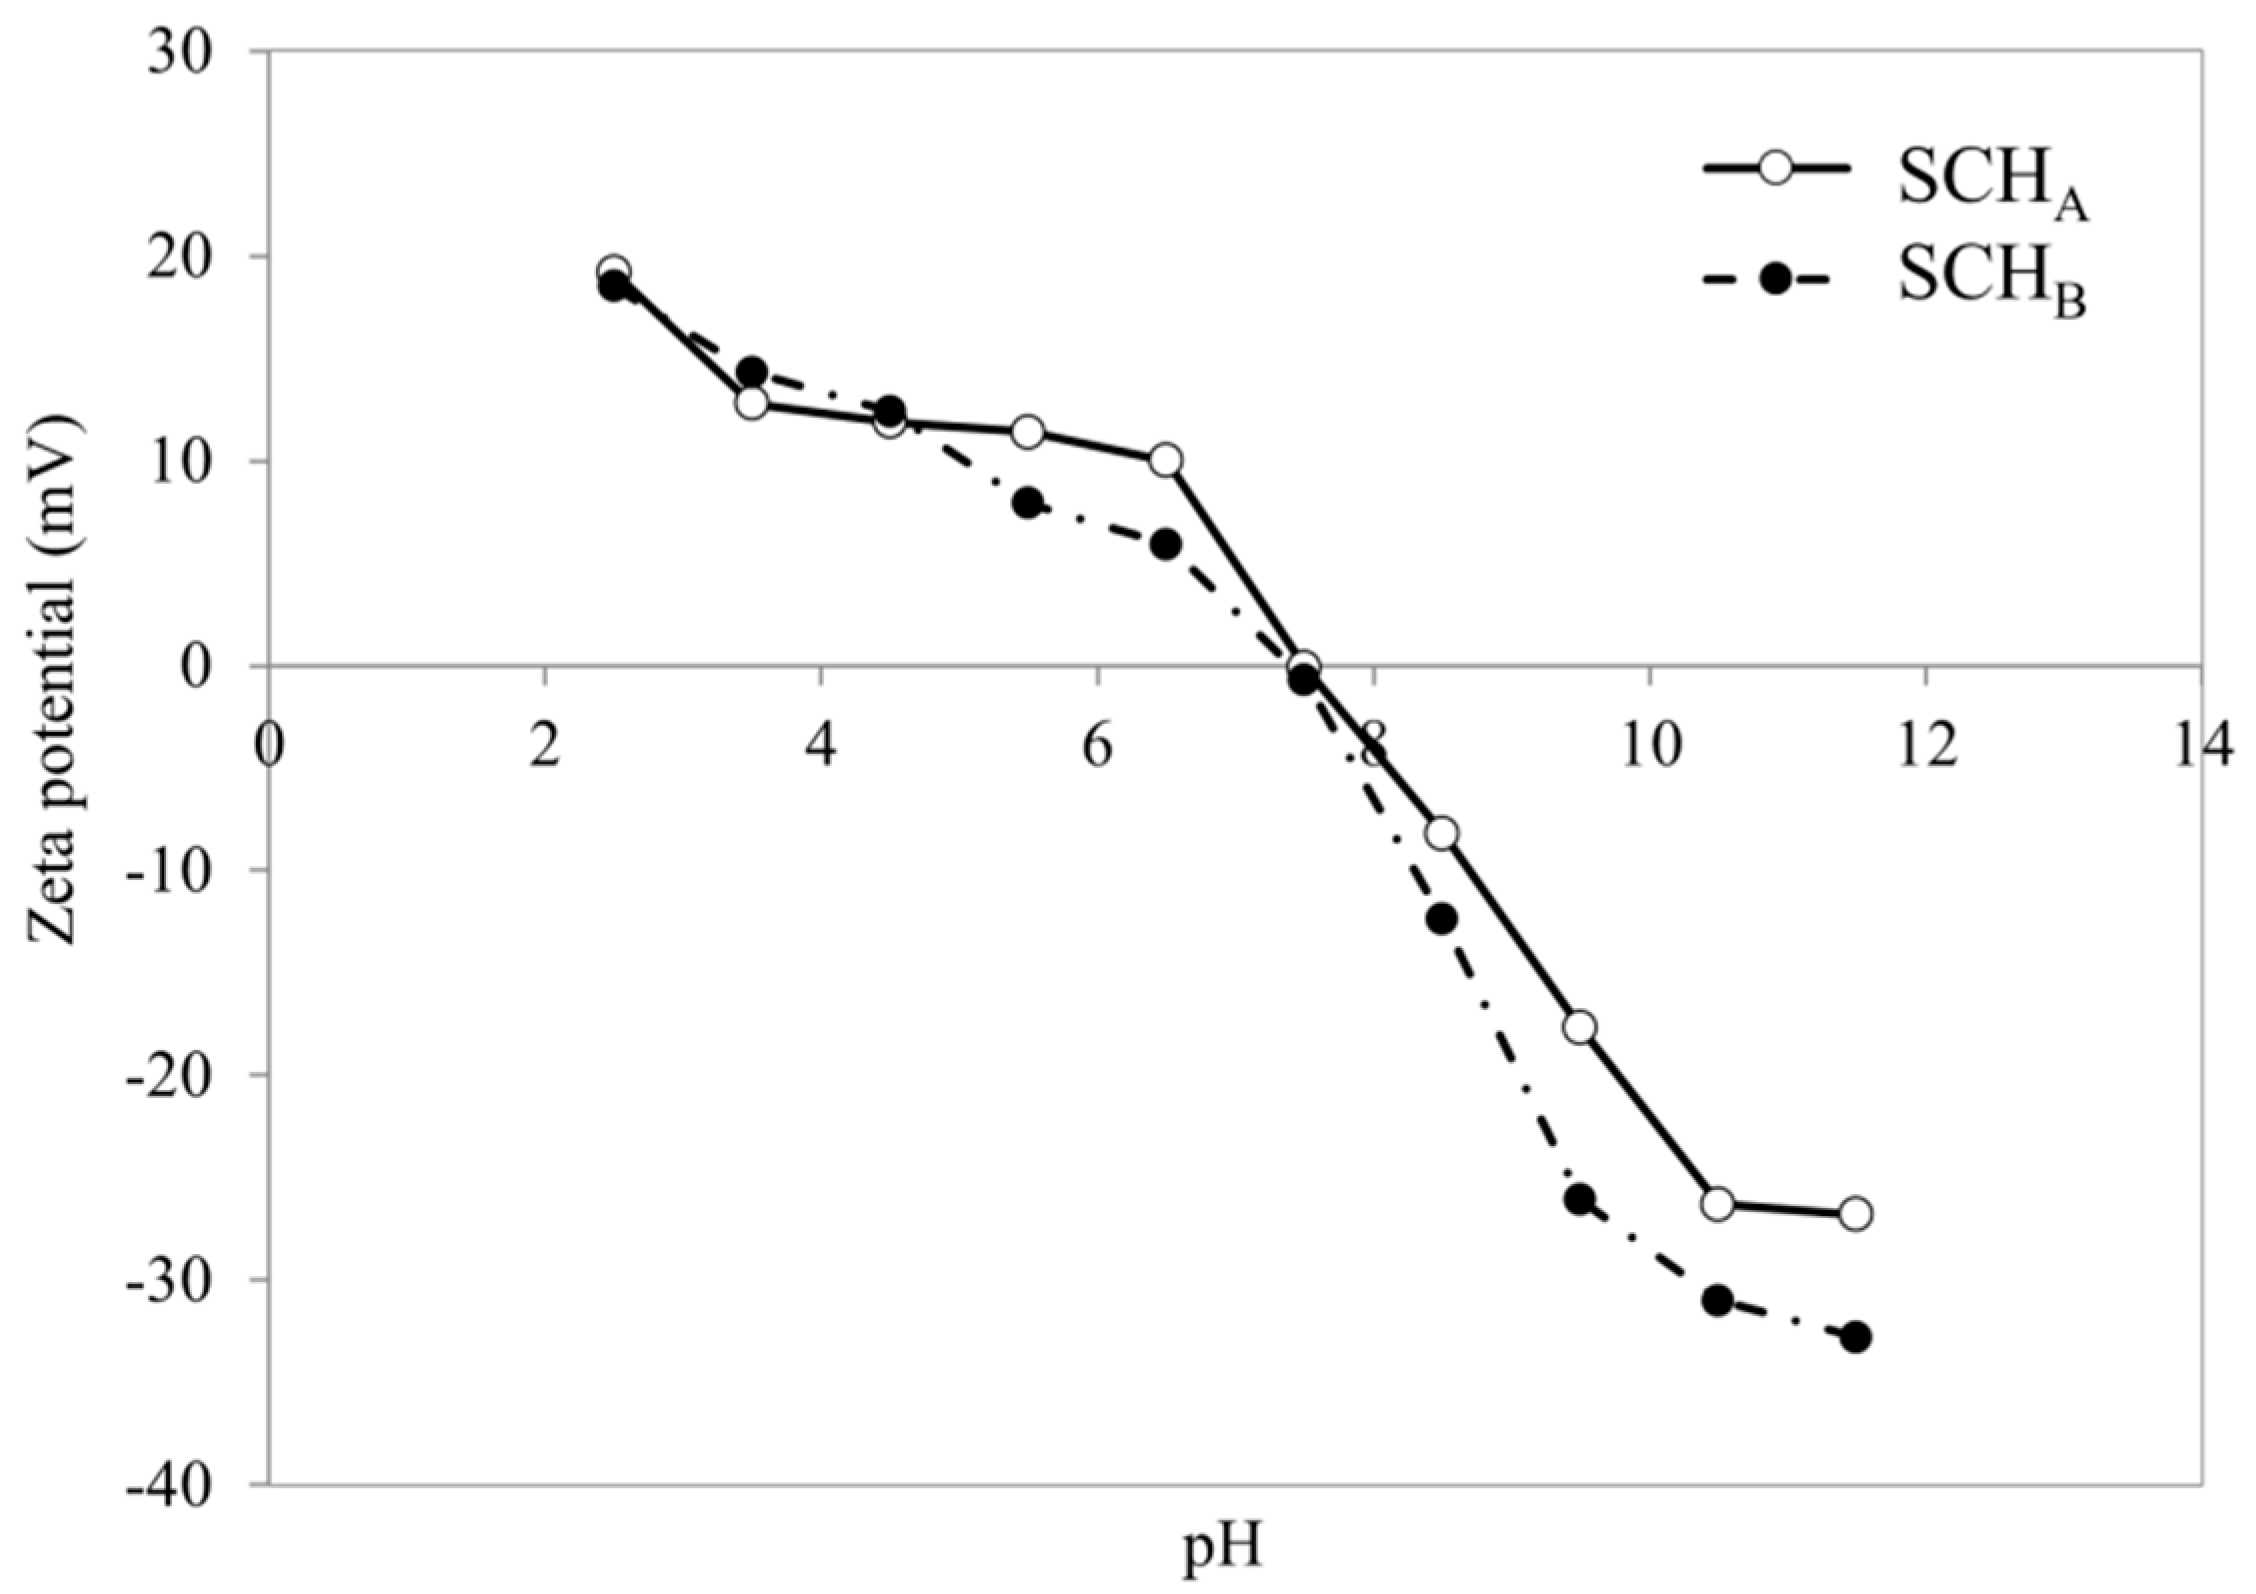
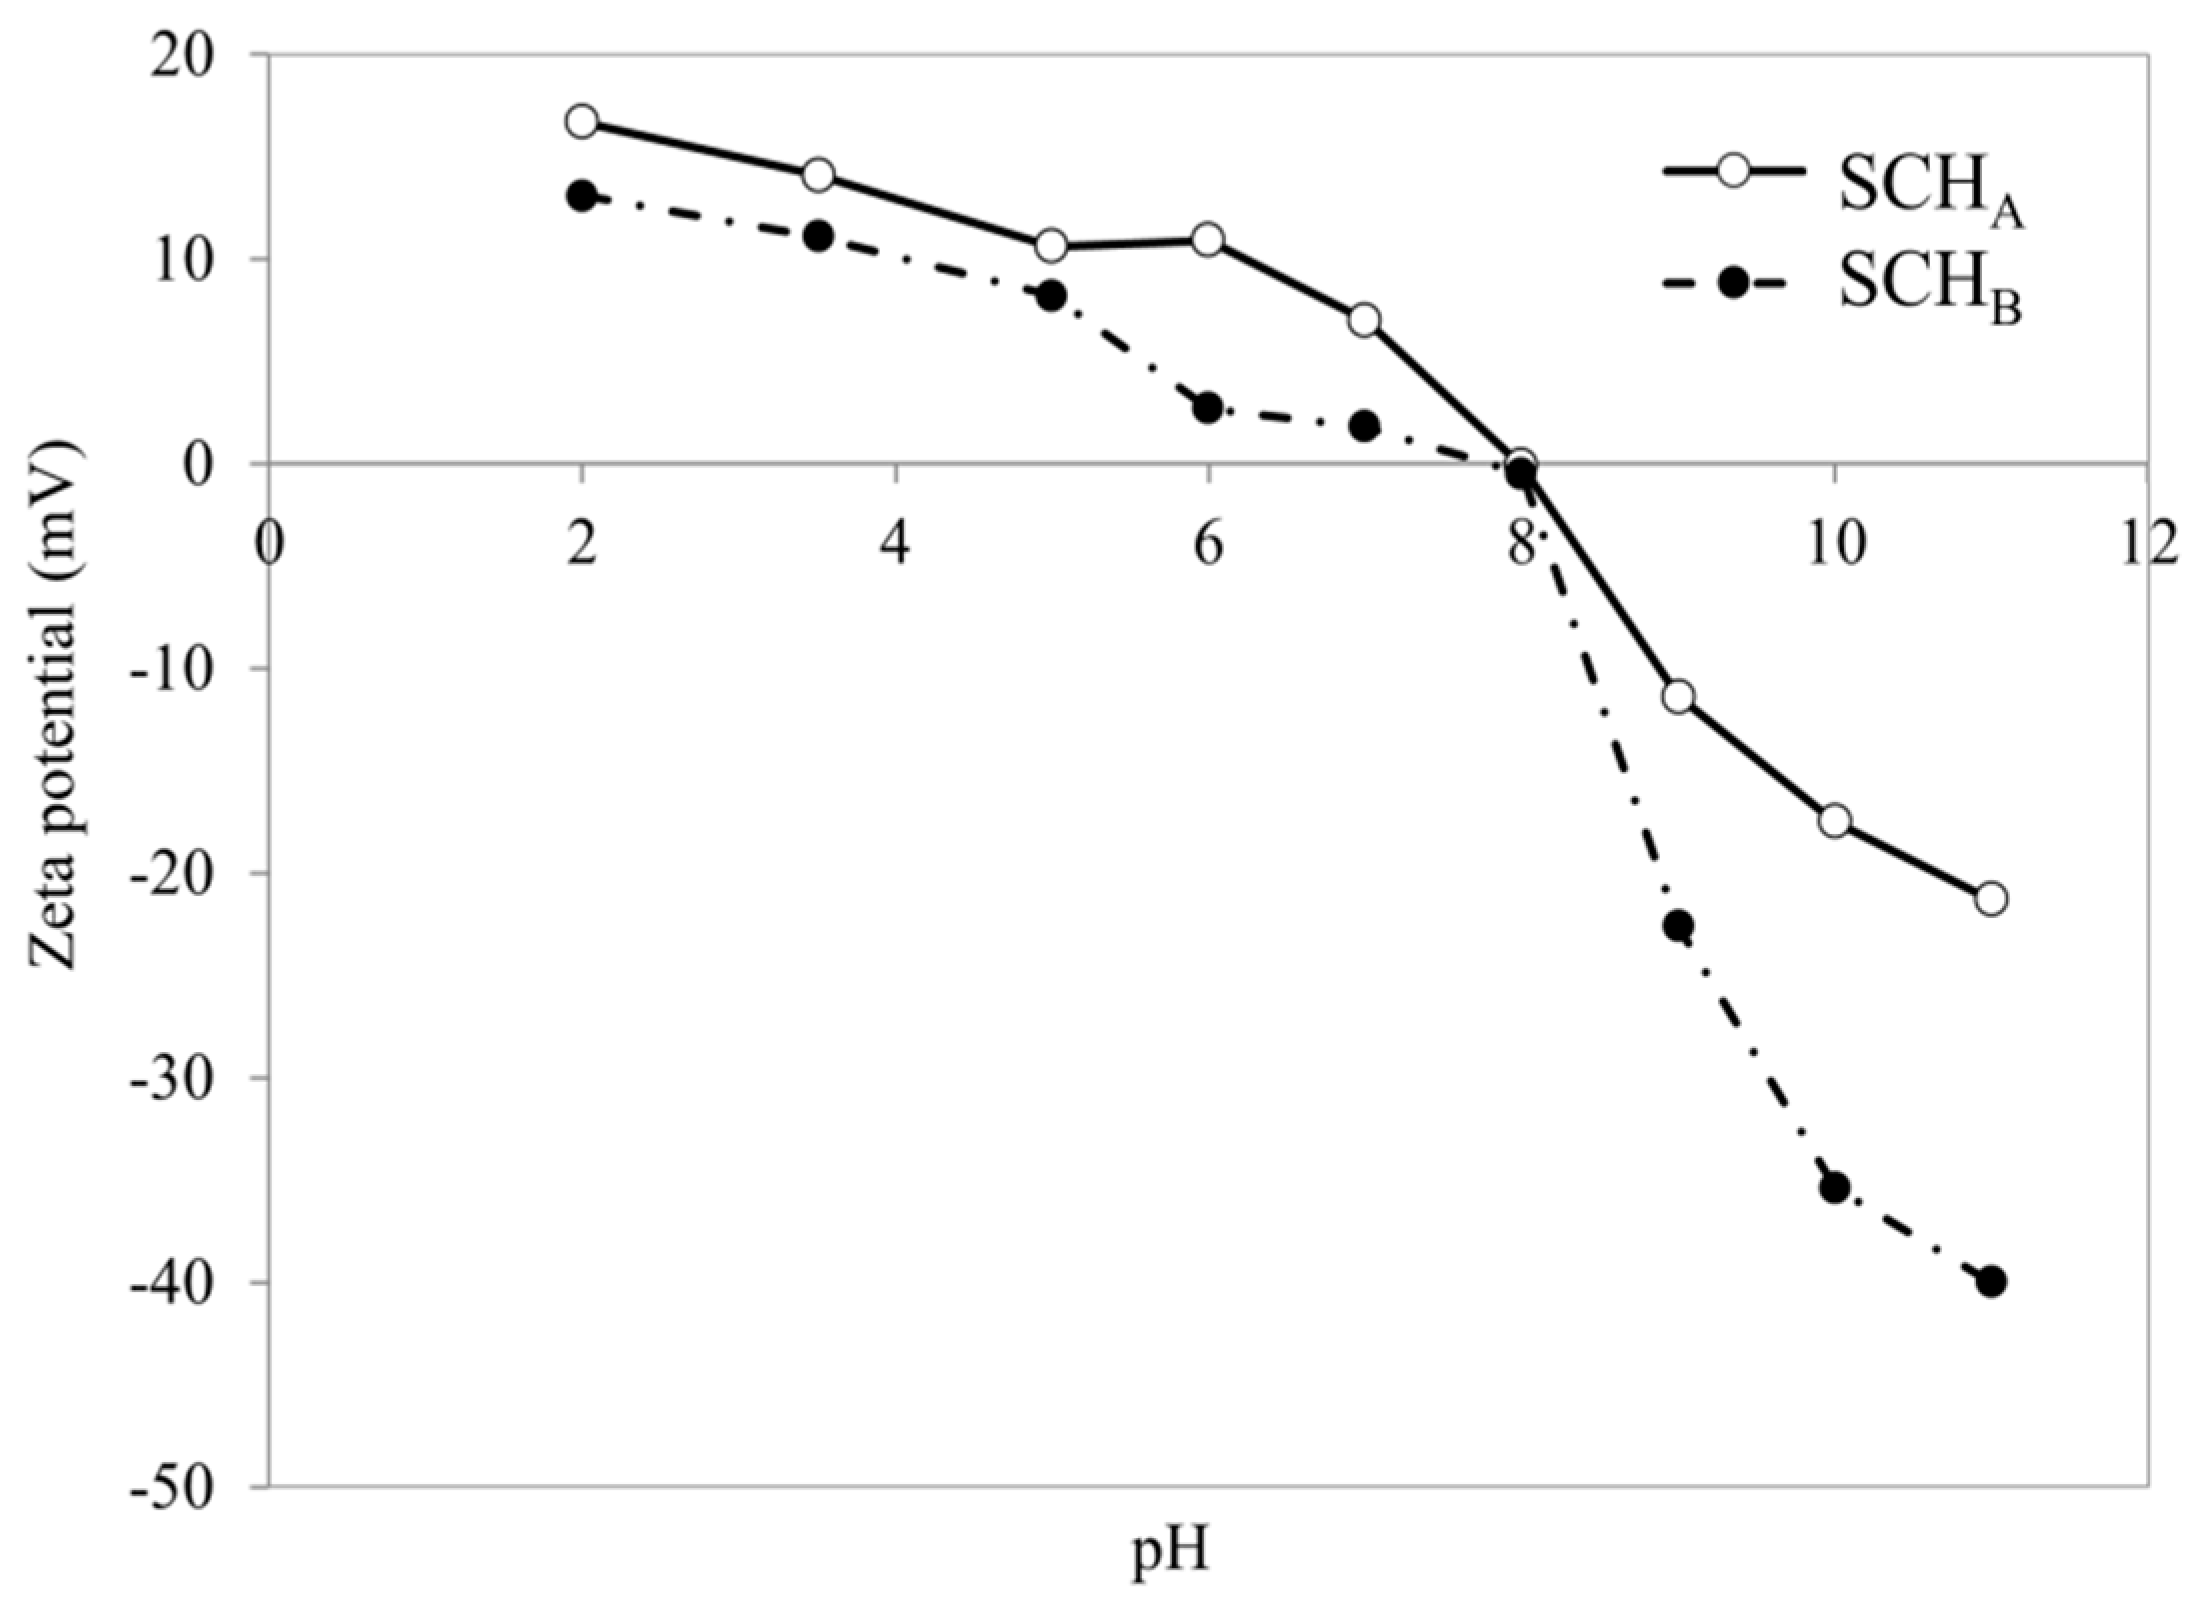
Figure 4 shows the zeta potential changes in the pH function for schwertmannite sorbents (SCHA and SCHB). Zeta potential measurements are essential to determine the surface potential of these adsorbents. The results showed that the negative charge and thus the negative potential increases with increasing pH and reaches a pH 11.5 maximum value of −26.8 and −32.8 mV for SCHA and SCHB, respectively. At acidic pH, the zeta potential of the tested adsorbents is positive, and at pH 4.5 it takes the value of +11.9 and +12.4 mV for SCHA and SCHB, respectively. As reported by Cornell and Schwertmann, iron minerals usually exhibit so-called points of zero charge at neutral pH and therefore are often used as anion and cation adsorbents [49]. For both synthetic schwertmannite adsorbents, the isoelectric point is observed at pHiep around 7.5. The obtained data are consistent with the literature, as some authors report that the isoelectric point of schwertmannite is in the range 5.4–7.4 [40,49].

2.2. Effect of Adsorbent Dose

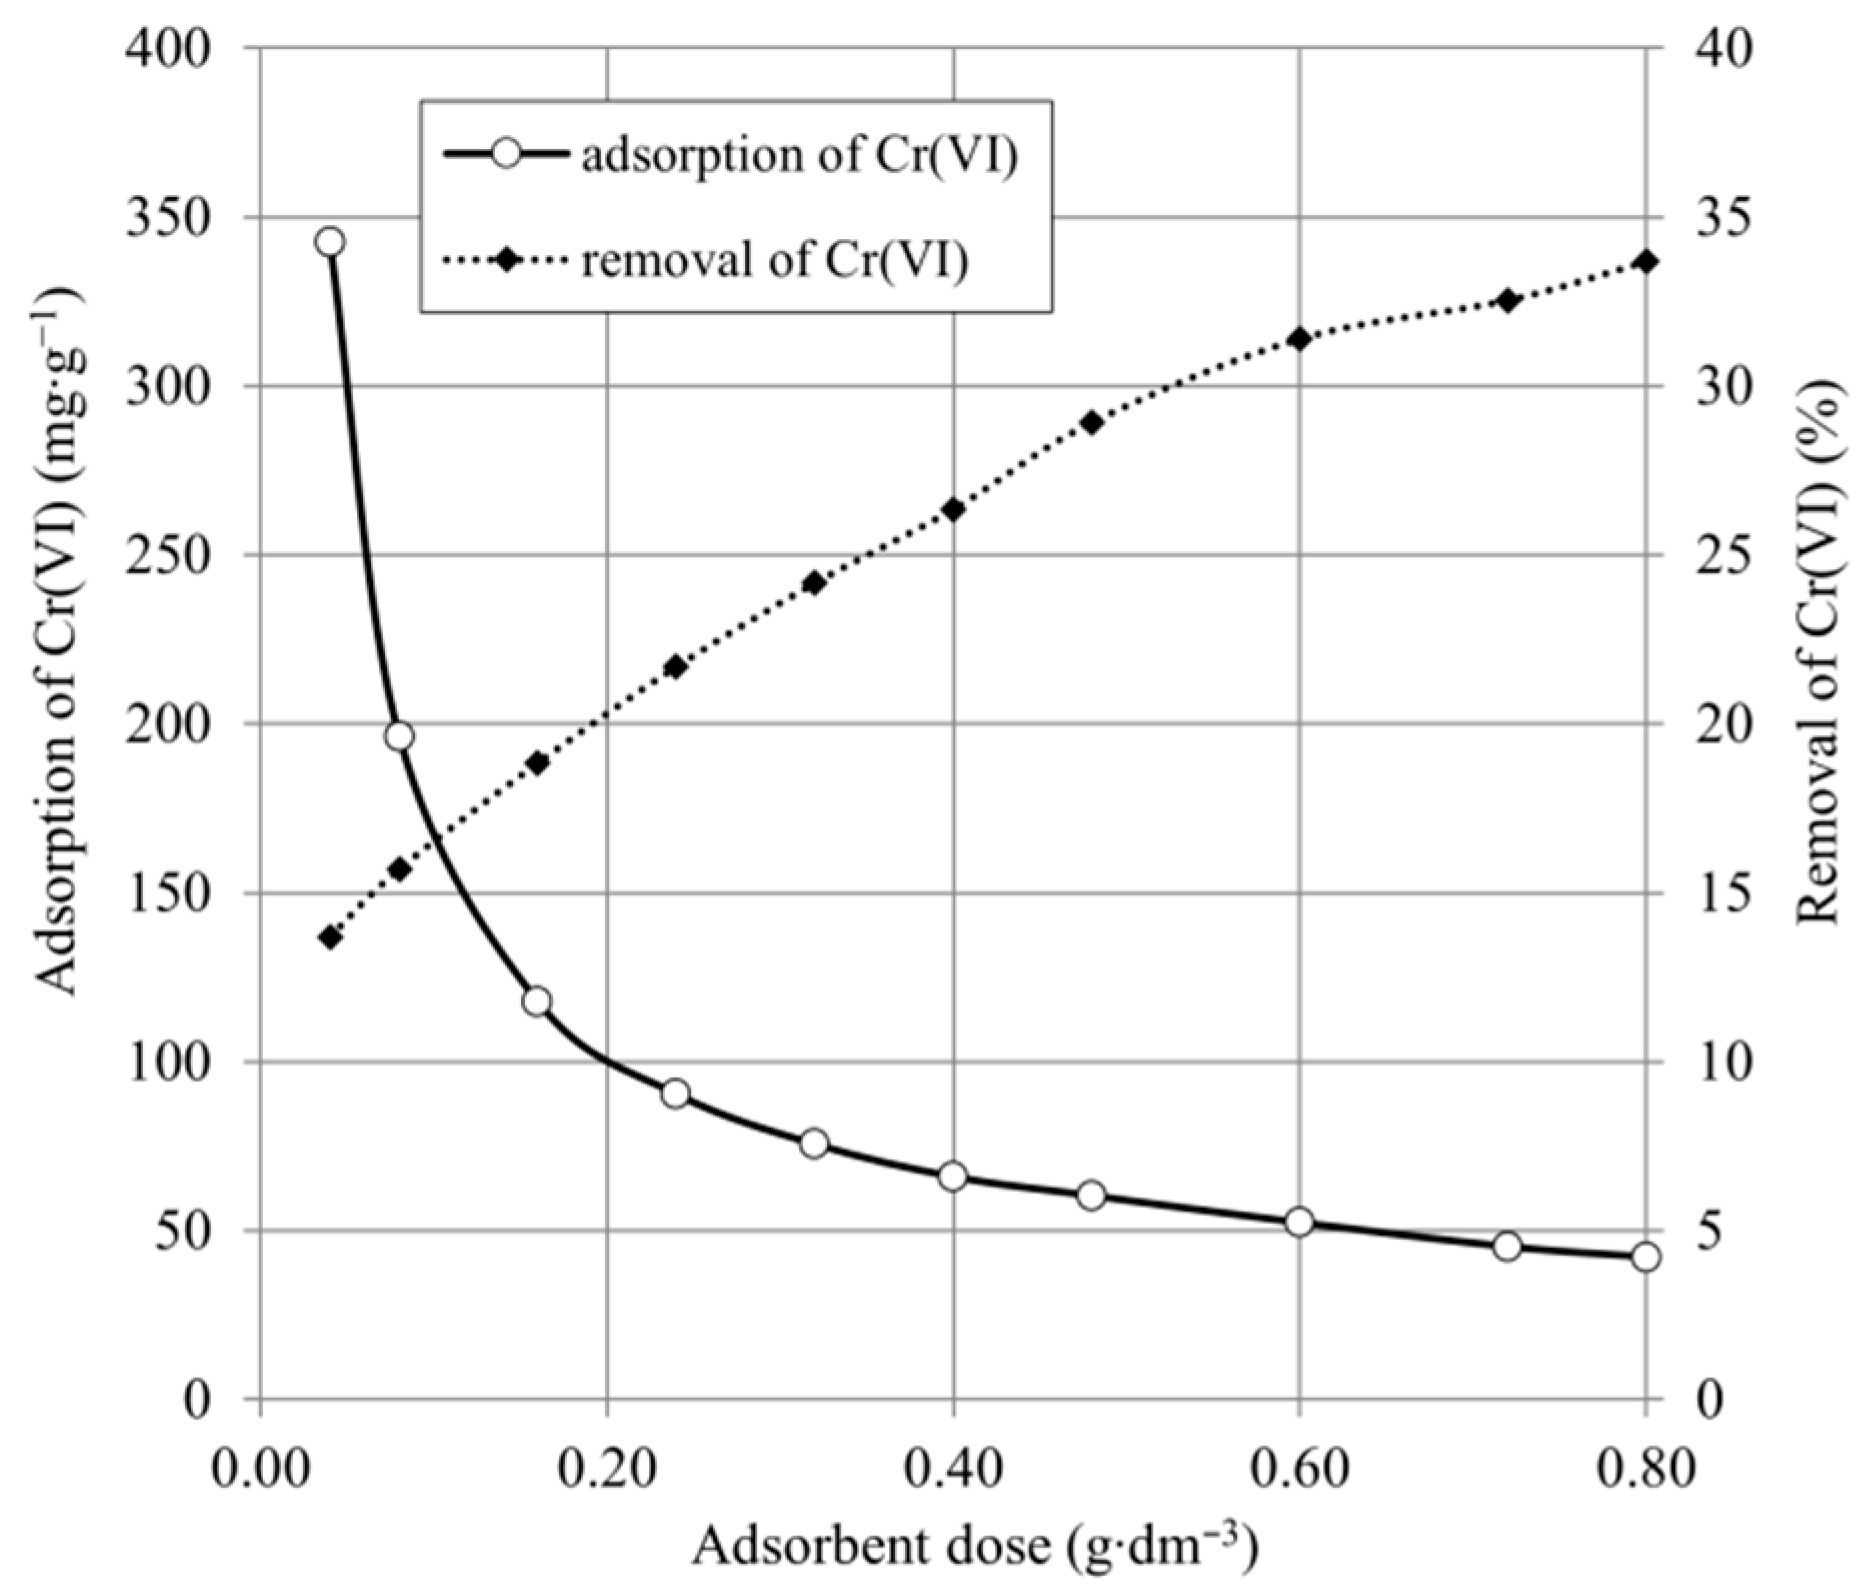
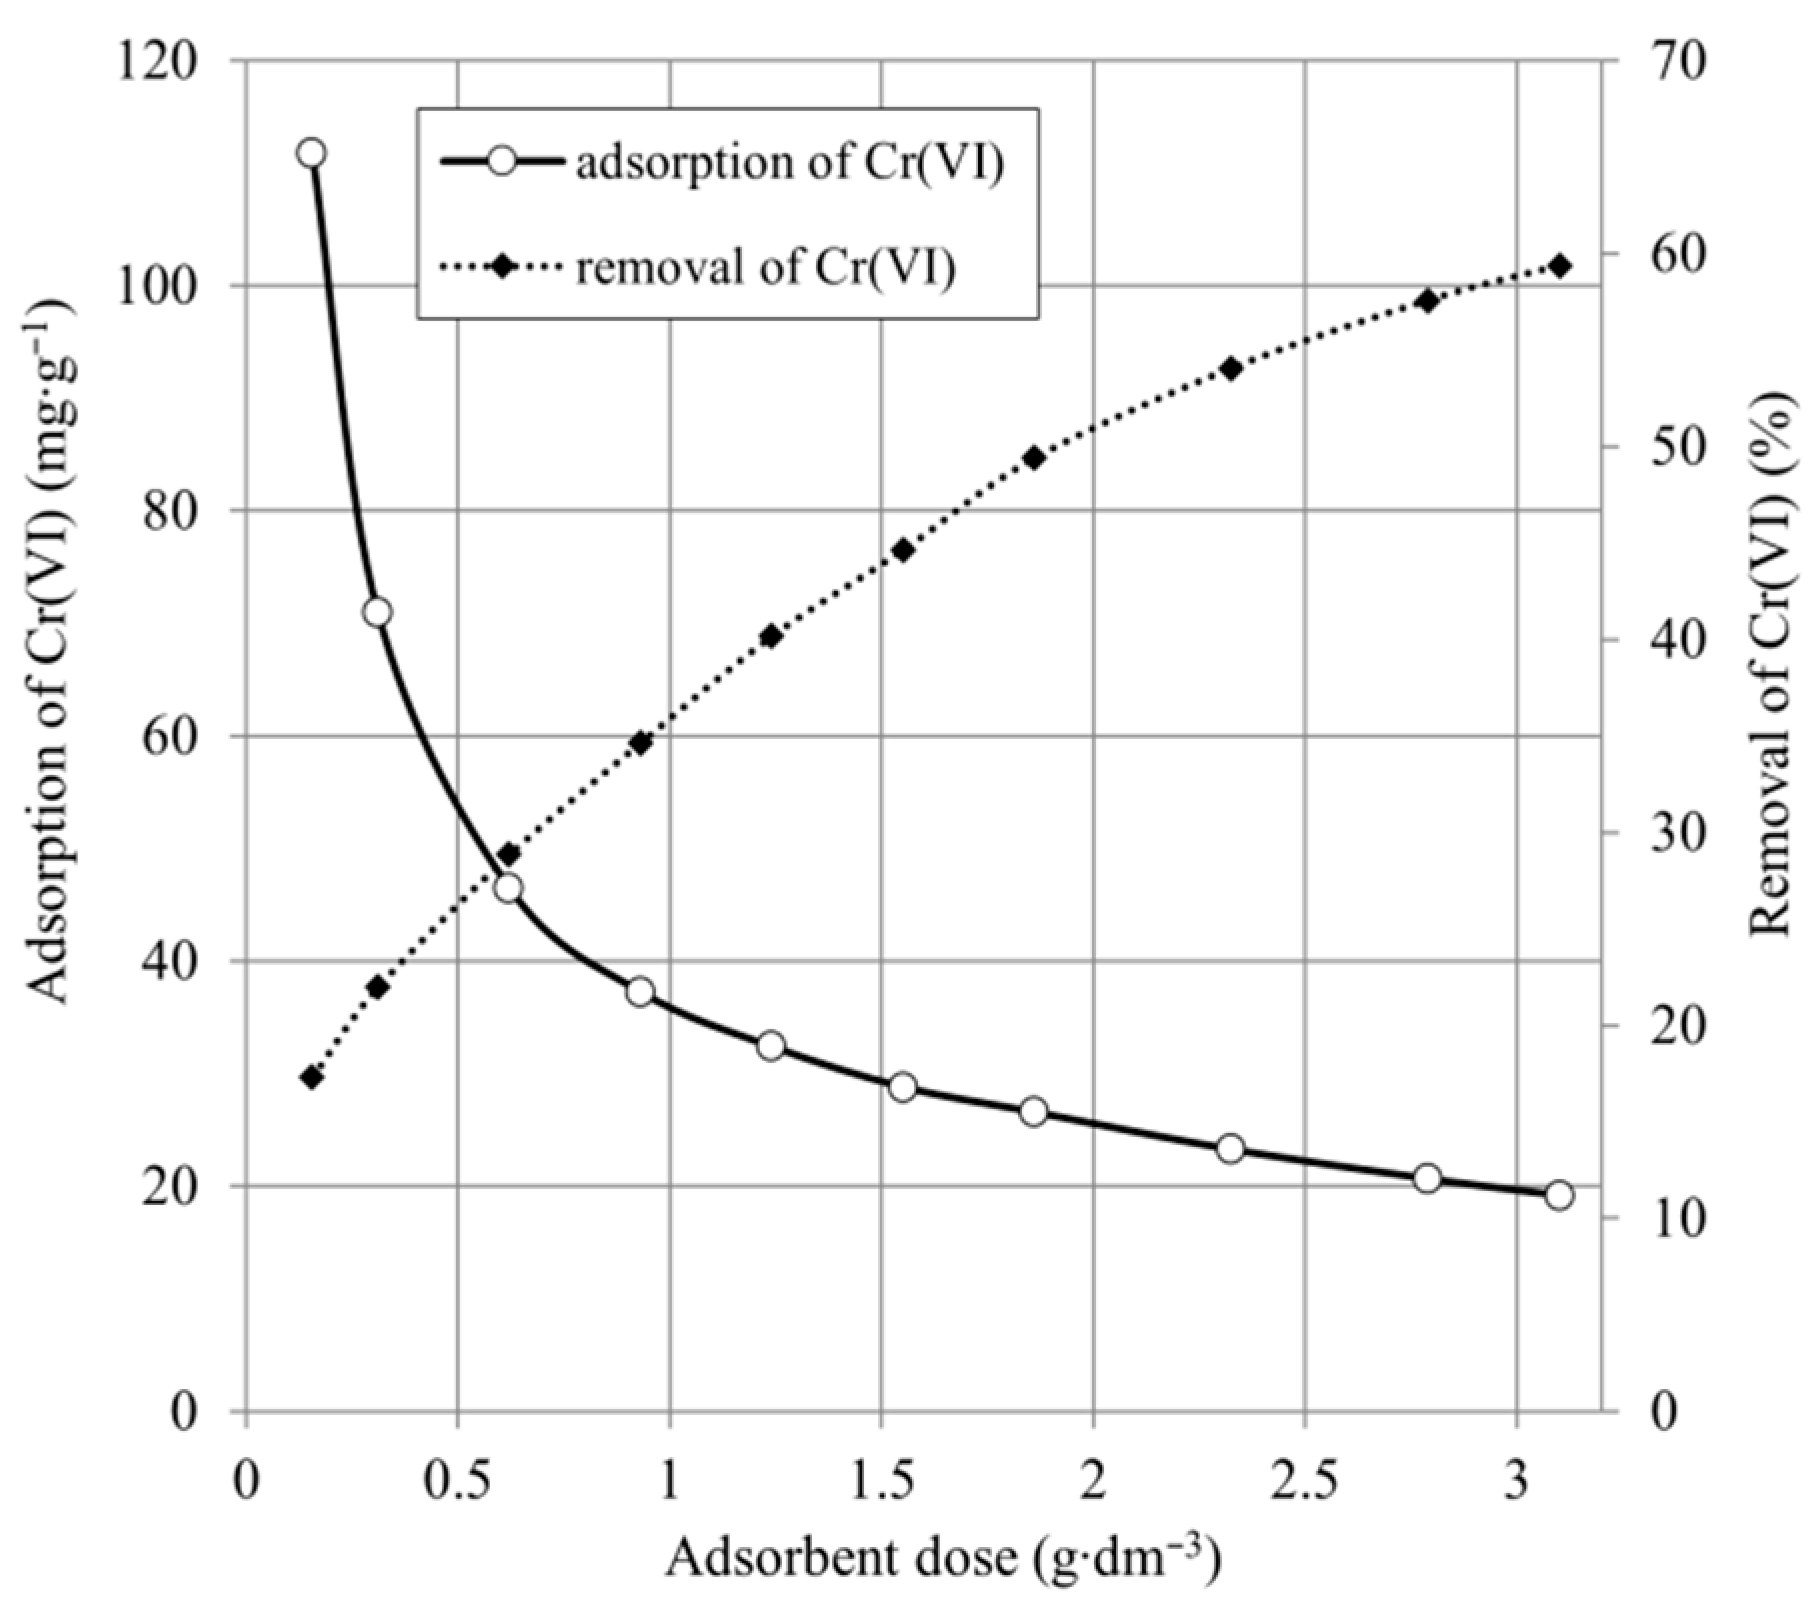
The effect of the adsorbent dose is an important parameter determining the removal efficiency and the economics of the process. Figure 5 and Figure 6 show the influence of adsorbent dose on Cr(VI) removal.
As shown in Figure 5, the adsorption capacity decreased from 324.5 to 42.1 mg·g1, and the percentage of Cr(VI) removal increased from 13.7% to 33.9%, proportionally to the increase in SCHA dose. The experimental results in Figure 5 show that the adsorption capacity decreased from 111.7 to 19.2 mg·g1 and the percentage of Cr(VI) removal increased from 17.3% to 59.4%, in proportion to the increase in SCHB dose. The decrease in adsorption capacity with increasing adsorbent dose is due to the fact that the more active adsorbent sites remain unsaturated during the adsorption process. The maximum static uptake of Cr(VI) by the SCHA and SCHB samples was achieved for minimal possible adsorbent dose and was 342.5 and 111.7 mg·g1, respectively. The maximum Cr(VI) reduction was obtained for maximal adsorbent dose and was 33.6% and 59.4%, respectively, for SCHA and SCHB. The results clearly indicate that despite the lower dry matter content of the SCHA adsorbent, the Cr(VI) uptake in this adsorbent is significantly higher than of SCHB.

2.3. Effect of pH

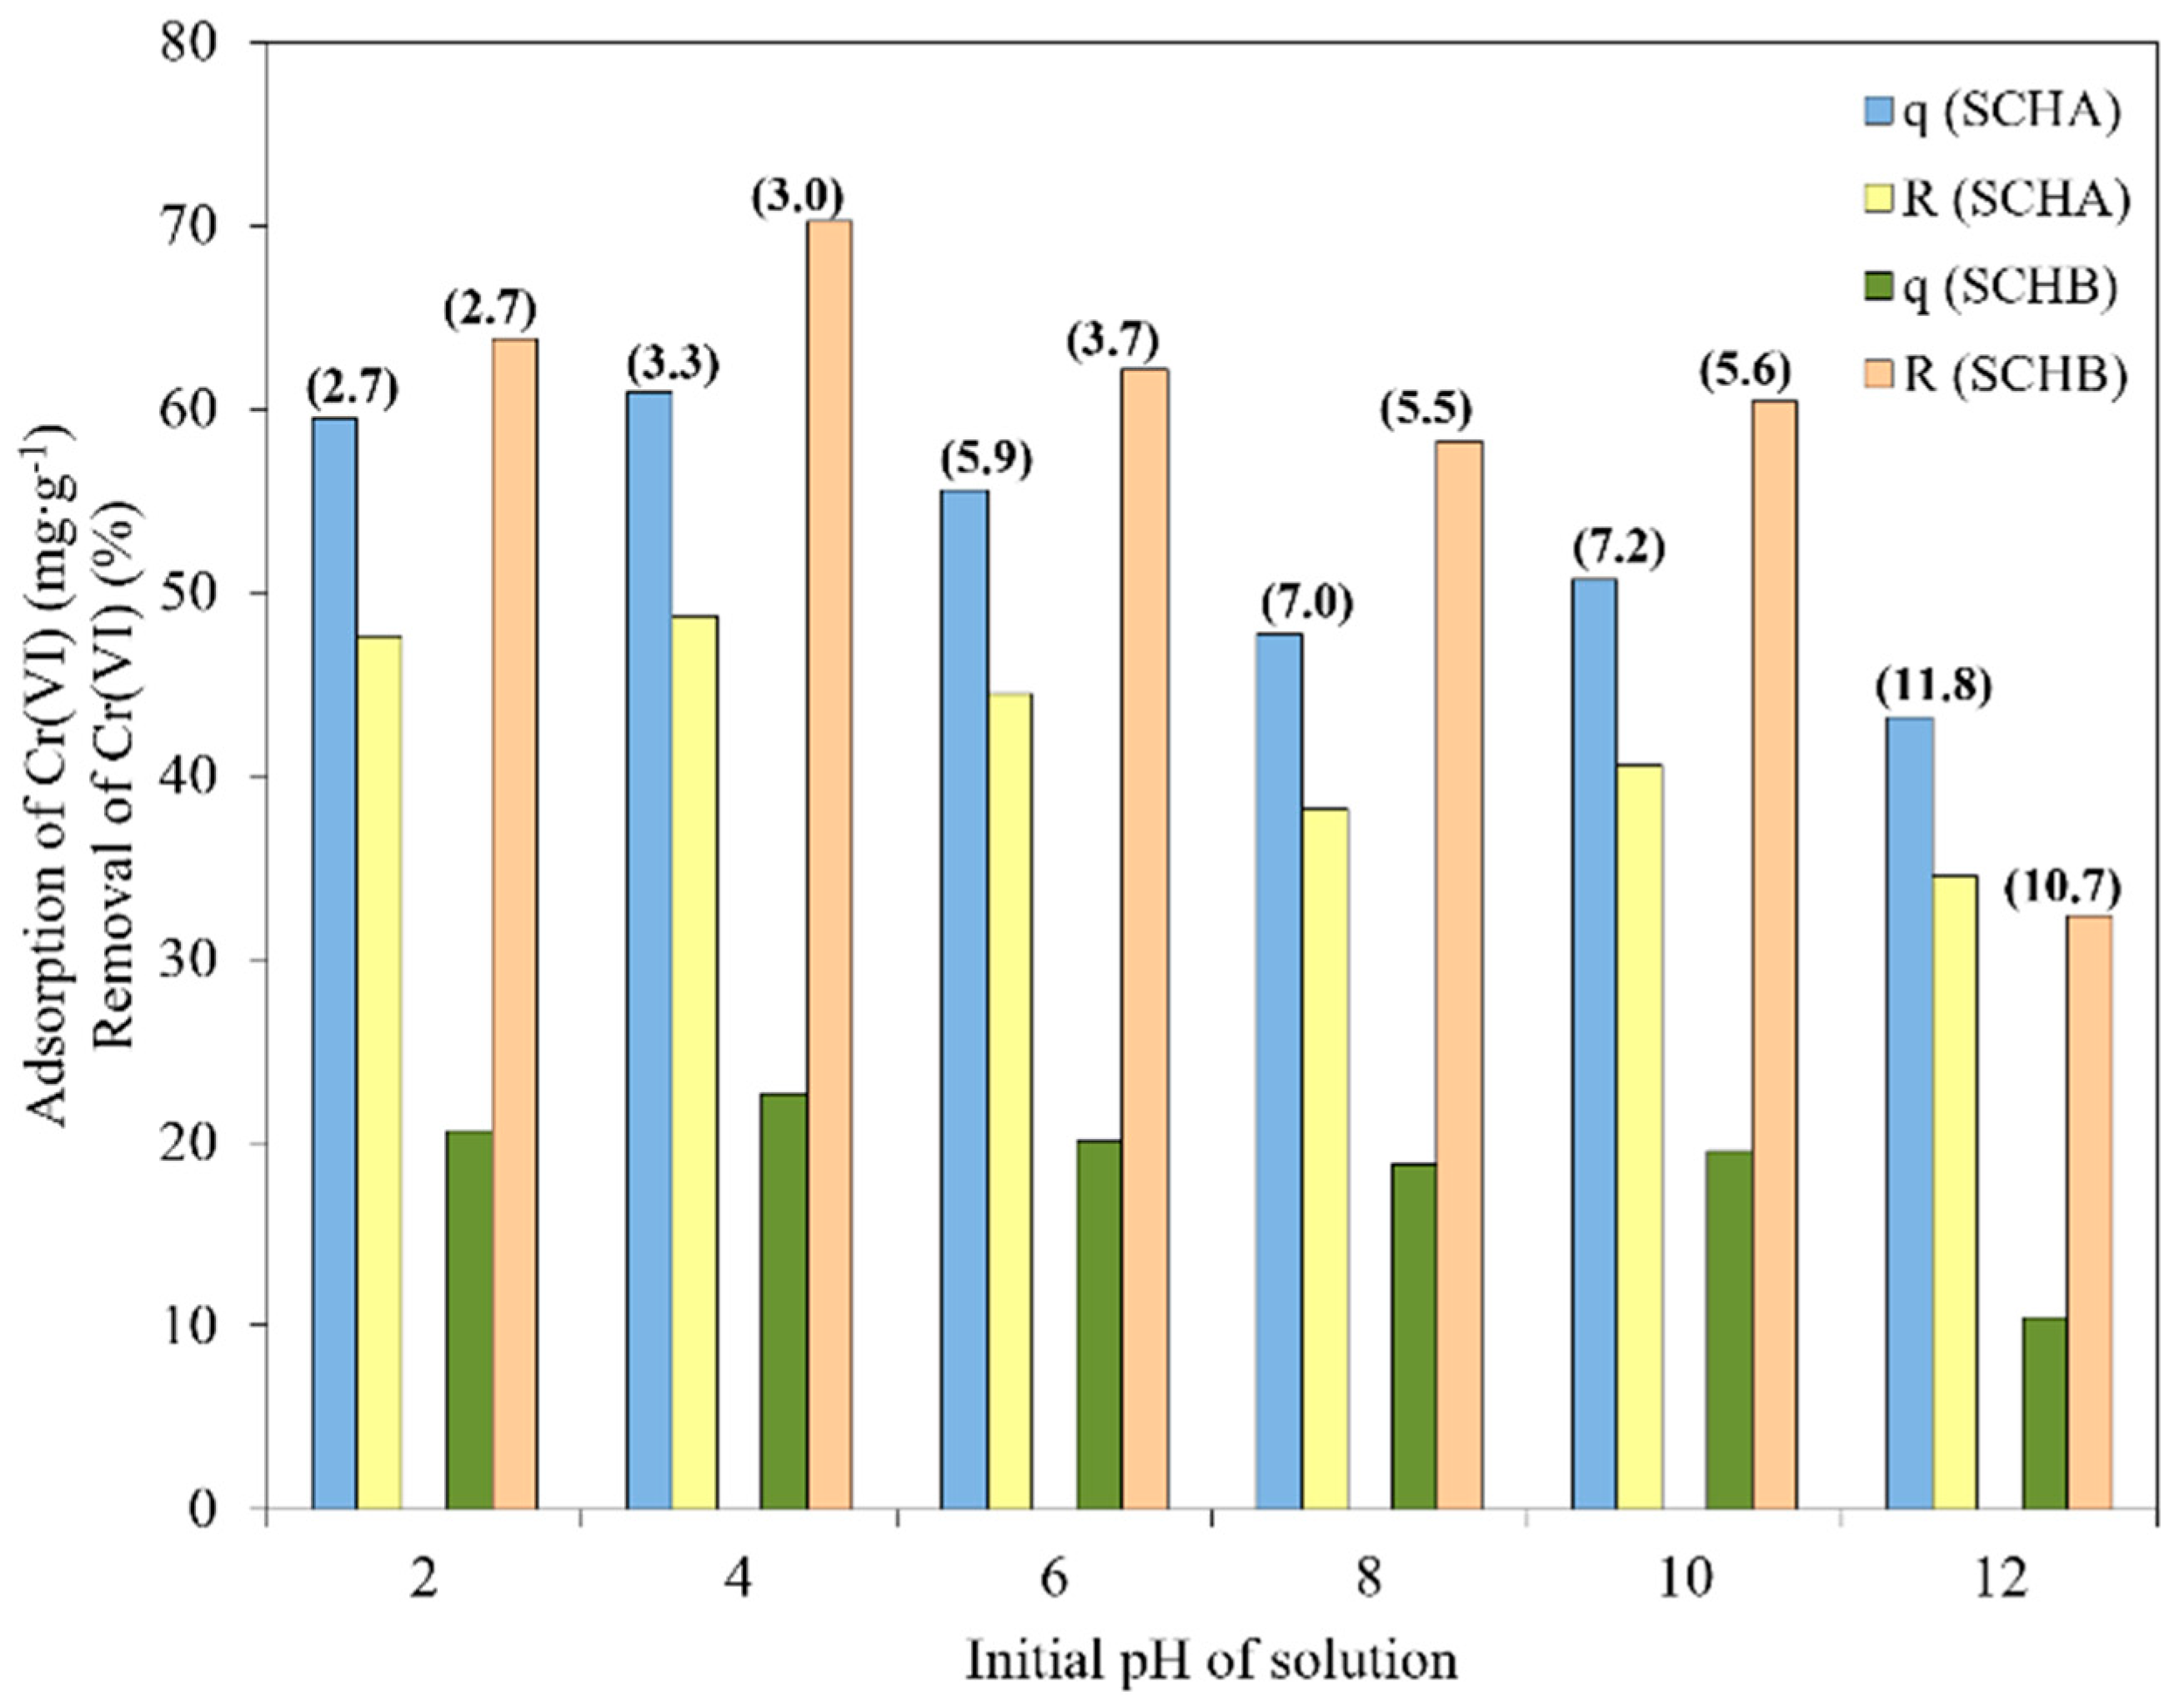
SCHA and SCHB samples were contacted with solutions of pH varying from 2 to 12. The effect of pH on Cr(VI) adsorption and removal is shown in Figure 7.
As can be seen in Figure 7, Cr(VI) adsorption is the highest for acidic solutions, and Cr(VI) adsorption decreases with increasing pH. The optimum pH for Cr(VI) removal was set at 4.0 and a maximum Cr(VI) adsorption capacity of 60.9 and 22.7 mg·g1 was obtained for SCHA and SCHB, respectively. The lowest removal ratio was observed at pH 12. Additionally, it can be seen that the pH of the solution changed after adsorption. SCHA and SCHB have a pH of about 5.5, and the addition of these materials caused the pH of the solutions to change after adsorption. For solutions with an initial acidic pH, an increase in pH is observed, while a decrease in pH is observed for basic solutions. The effect of pH on the adsorption of Cr(VI) on schwertmannite can be attributed to the chromium speciation and surface charge of the adsorbent in an aqueous solution. Cr(VI) can occur in aqueous solutions as chromate (CrO42), dichromate (Cr2O72), hydrogen chromate (CrHO4), and hydrogen dichromate (Cr2HO7) ions, as well as chromic acid. In strongly acidic solutions (pH < 3) it exists only as HCrO4 and CrO72 ions. Chromate ions are predominant at pH > 7, whereas hydrogen chromate ions are predominant at pH < 6 [50]. According to Anah and Astrini, high adsorption in acidic conditions can be explained by the fact that negatively charged Cr(VI) ions are strongly attracted to the positively charged adsorbent surface [51]. As can be seen from the zeta potential study (Figure 4), at alkaline pH, the surface potential of schwertmannite is negative and significantly, resulting in lower adsorption of Cr(VI) ions. When the zeta potential of adsorbent particles is negative, the electrostatic attraction between Cr(VI) ions and the schwertmannite surface decreases, leading to a reduced adsorption capacity. On the other hand, the zeta potential value becomes positive at acidic pH, increasing the electrostatic force between Cr(VI) ions and the schwertmannite surface. Thus, the adsorption capacity increases. Additionally, at alkaline pH conditions, inhibition of Cr(VI) hydrolysis may be one of the reasons for reduced adsorption [51]. Zhang and co-workers reported that an increase in pH may also release sulphate groups through higher concentration of OH ions, converting schwertmannite to goethite, and this may decrease the adsorption efficiency of Cr(VI) [52].
Since the most significant amount of Cr(VI) ions was adsorbed from a solution with an initial pH of 4.5, all adsorption experiments were conducted at pH 4.5.

2.4. Effect of Contact Time

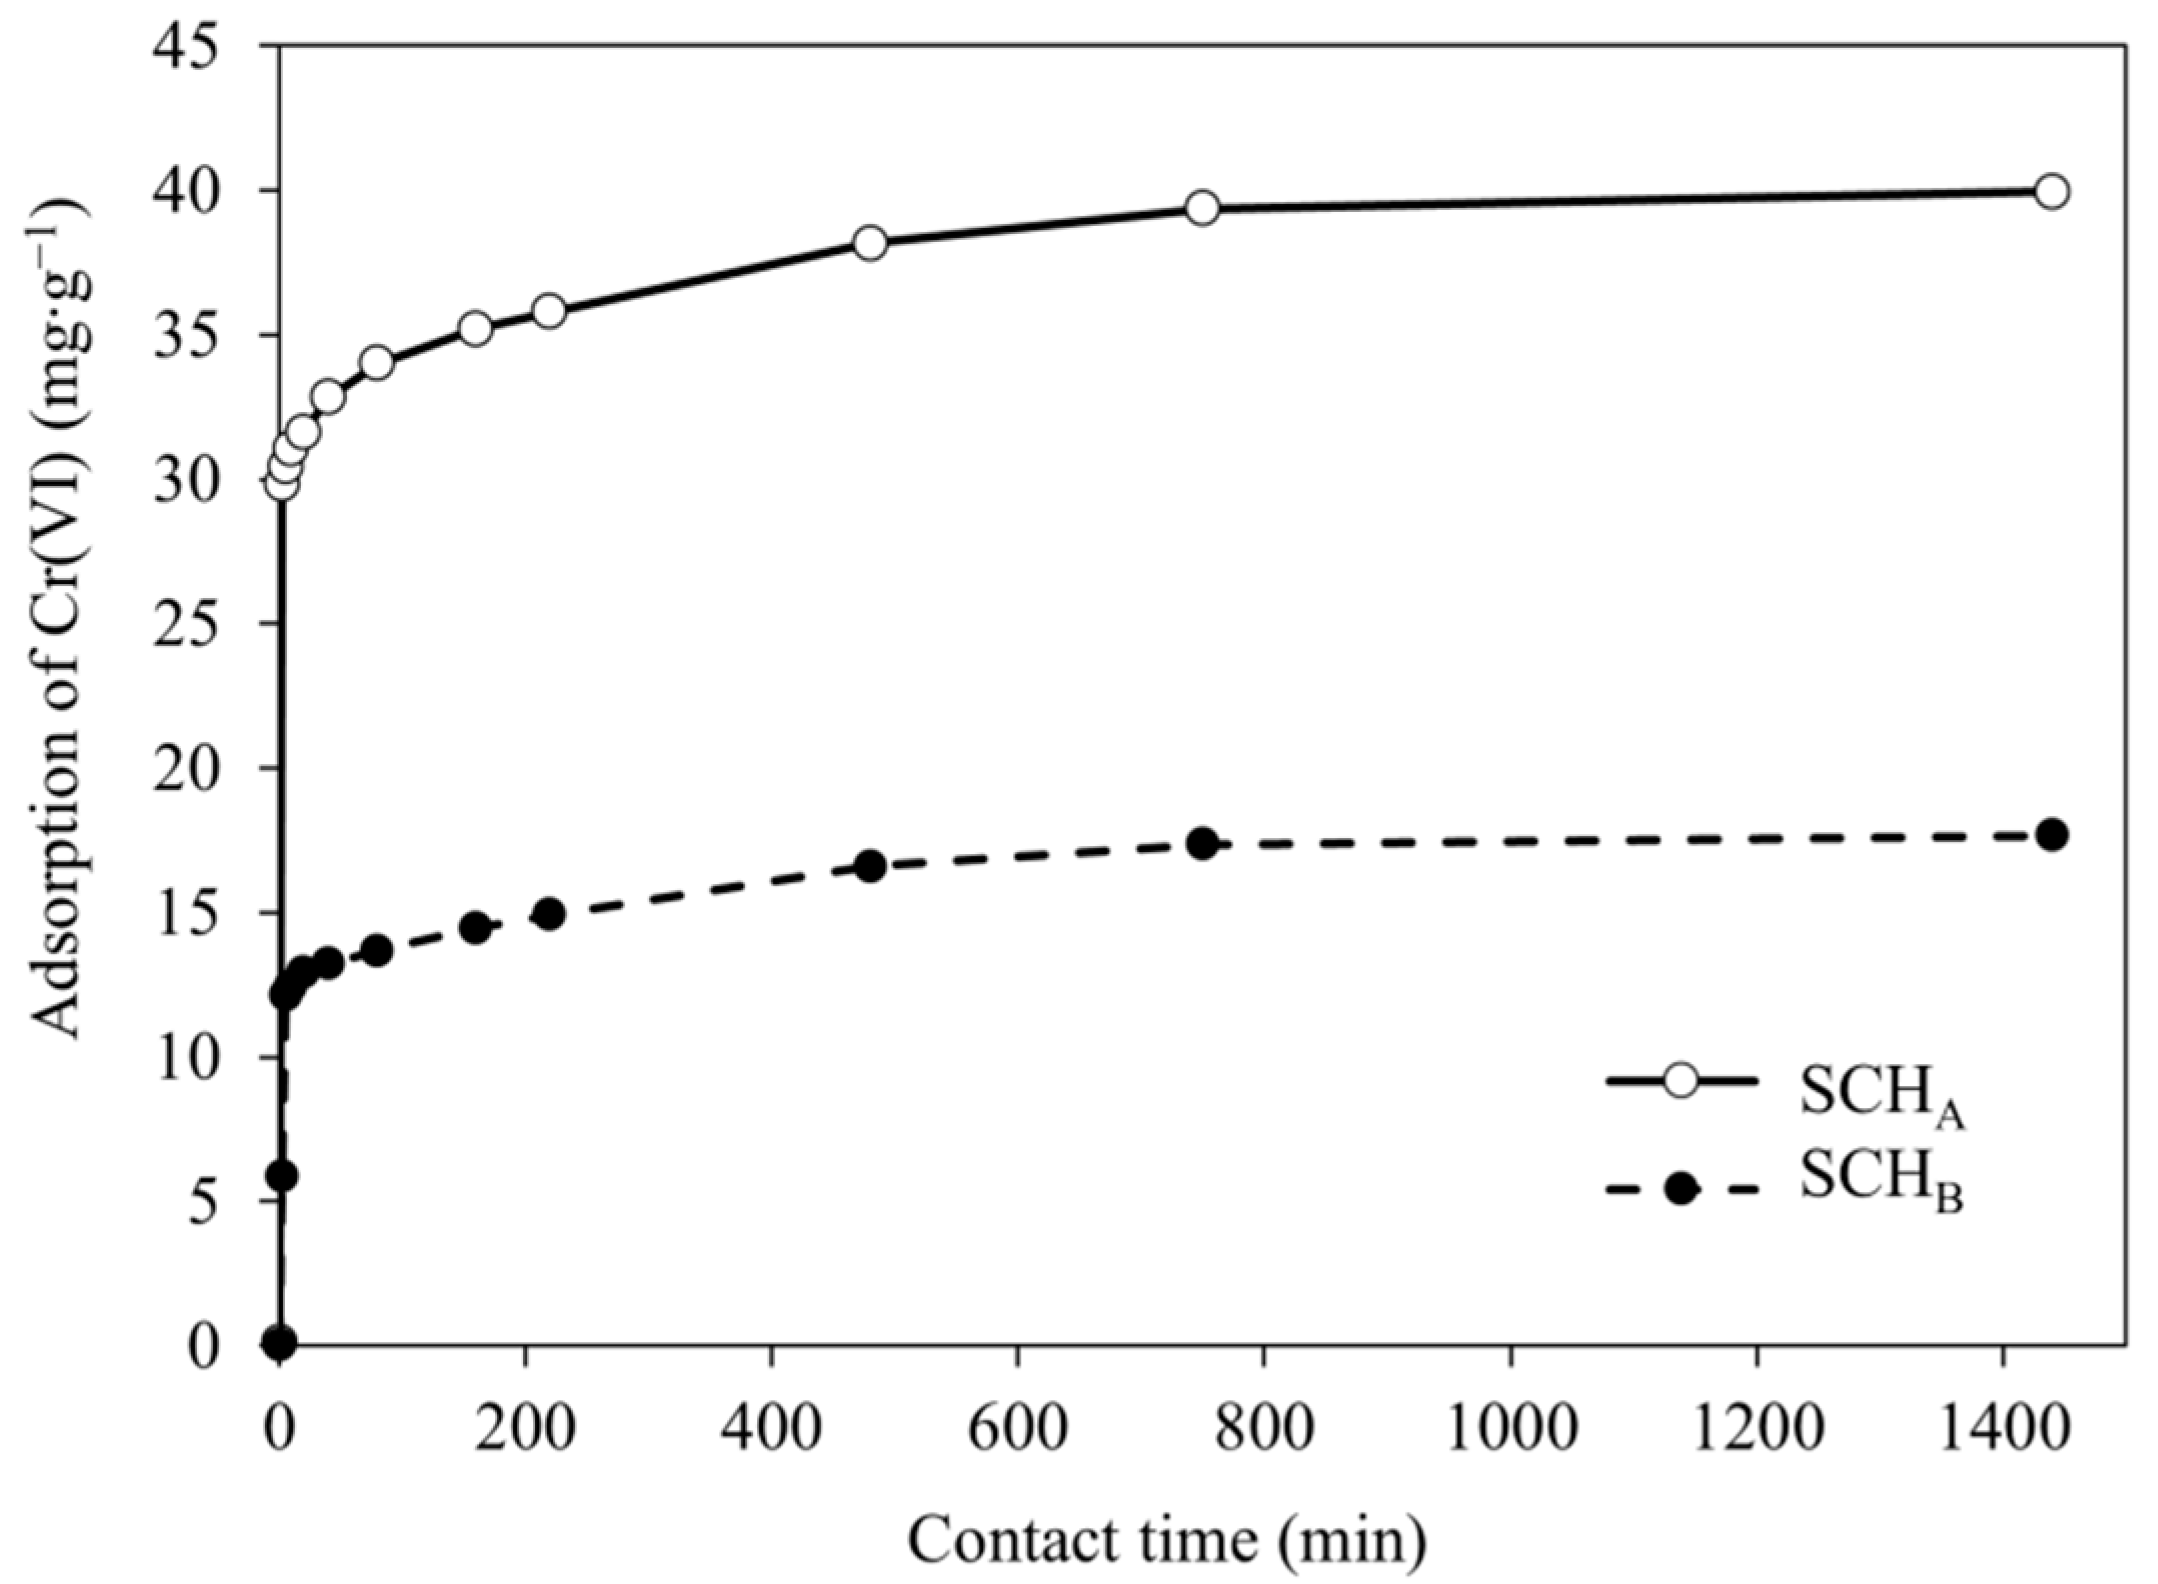
The effect of contact time on the amount of Cr(VI) ions removal from the solution during the adsorption by schwertmannite sorbents (SCHA and SCHB) was studied with the use of the solution containing 100 mg·dm3 of Cr(VI). The solution with added adsorbent was stirred over 24 h and the samples were drawn periodically to measure the residual Cr(VI) concentration starting from the second minute at room temperature (25 ± 1 °C). Figure 8 shows the effect of contact time on the adsorption of Cr(VI).
The equilibrium for both SCHA and SCHB adsorbents was achieved after 12 h. No significant changes in Cr(VI) concentration in solution were observed after equilibrium was reached. The results showed that Cr(VI) adsorption process on schwertmannite increases with increasing contact time until an equilibrium is attained between Cr(VI) ions adsorbed on the schwertmannite surface and Cr(VI) ions present solution. It can also be observed that Cr(VI) adsorption on both schwertmannite sorbents was faster in the first minutes of the process and gradually slowed down until equilibrium was reached. This effect is related to the saturation of the available surface-active sites in the initial stages of the adsorption process. Figure 8 also shows that more Cr(VI) ions were adsorbed on SCHA than on SCHB.

Adsorption Kinetic Models

To investigate the mechanism and determine the rate-controlling step in the adsorption of Cr(VI) ions onto synthetic schwertmannite sorbents, kinetic models were used. The rate constants were calculated using pseudo-first-order (PFO) (Equation (2)) and pseudo-second-order (PSO) kinetic models (Equation (3)) [53,54,55,56], while the rate-controlling step was determined using the intraparticle diffusion (IPD) (Equation (4)) and the liquid film diffusion (LFD) models (Equation (5)) [57,58,59]. Table 1 shows the equations of the applied models.
It is observed that the adsorption kinetics data fit both models well (R2 > 0.9), but judging by high R2 values, the adsorption data were better fitted by the PSO model. The experimental and calculated adsorption capacity (qe) values of the PSO model indicate better consistency than the PFO model, as evidenced by significantly lower standard deviation (SD) values. The calculated adsorption capacities (q2) by the PSO model are close to their experimental values (qexp) both for SCHA and for SCHB (Table 2). These results prompt that the adsorption of Cr(VI) onto SCHA and SCHB schwertmannite sorbents follows the PSO kinetic, further suggesting that chemisorption is the rate-controlling step [55]. The PSO rate constants were calculated as 2.7 × 10⁻³ and 0.7 × 10⁻³ g·mg−1·min−1 for SCHA and SCHB, respectively. The PSO rate constant is over three times greater for SCHA. This is directly correlated with the significant difference between initial adsorption rates, which are 4.18 and 0.228 mg·g−1·min−1 for SCHA and SCHB, respectively. The obtained initial adsorption rates indicate that Cr(VI) adsorption on SCHA is faster than on SCHB.
In addition, it was investigated whether intraparticle diffusion (IPD) or liquid film diffusion (LFD) kinetics play an important role in Cr(VI) adsorption from aqueous solutions on schwertmannite sorbents. Table 3 summarises the values of the calculated parameters for IPD and LFD models, and gives the values of the determination coefficient (R2).
The IPD rate was obtained from the plots of qt vs t1/2. In theory, the slope of this plot can be linearised in four regions, which represent the distinct stages of mass transfer of adsorbates onto adsorbents. The initial stage represents external mass transfer with the following three stages being intraparticle diffusion in the macro-, meso-, and micropore structure of the adsorbent [60,61]. As can be seen in Figure 9 (the linear dependence of qt to t1/2), two stages of diffusion can be distinguished, both for the adsorption of Cr(VI) on SCHA and on SCHB. Additionally, the first segment does not pass through the origin of the coordinate system (parameter B is different from zero), suggesting that internal diffusion is not the only limiting step in the liquid phase adsorption process in this study. It is said that the greater the value of B, the greater the influence of the boundary layer on the adsorption process. As a result of the linear extrapolation of the first stage and the intersection of this line with the ordinate axis, a value corresponding to diffusion in the boundary layer was obtained, while the second linear part concerns diffusion inside the pores. The values of kIPD1, kIPD2, and B were calculated from the slope of each line. The obtained values are given in Table 3. If the value of kIPD1 is greater than the value of kIPD2, it indicates that the boundary layer controls the adsorption of Cr(VI) on schwertmannite sorbents.
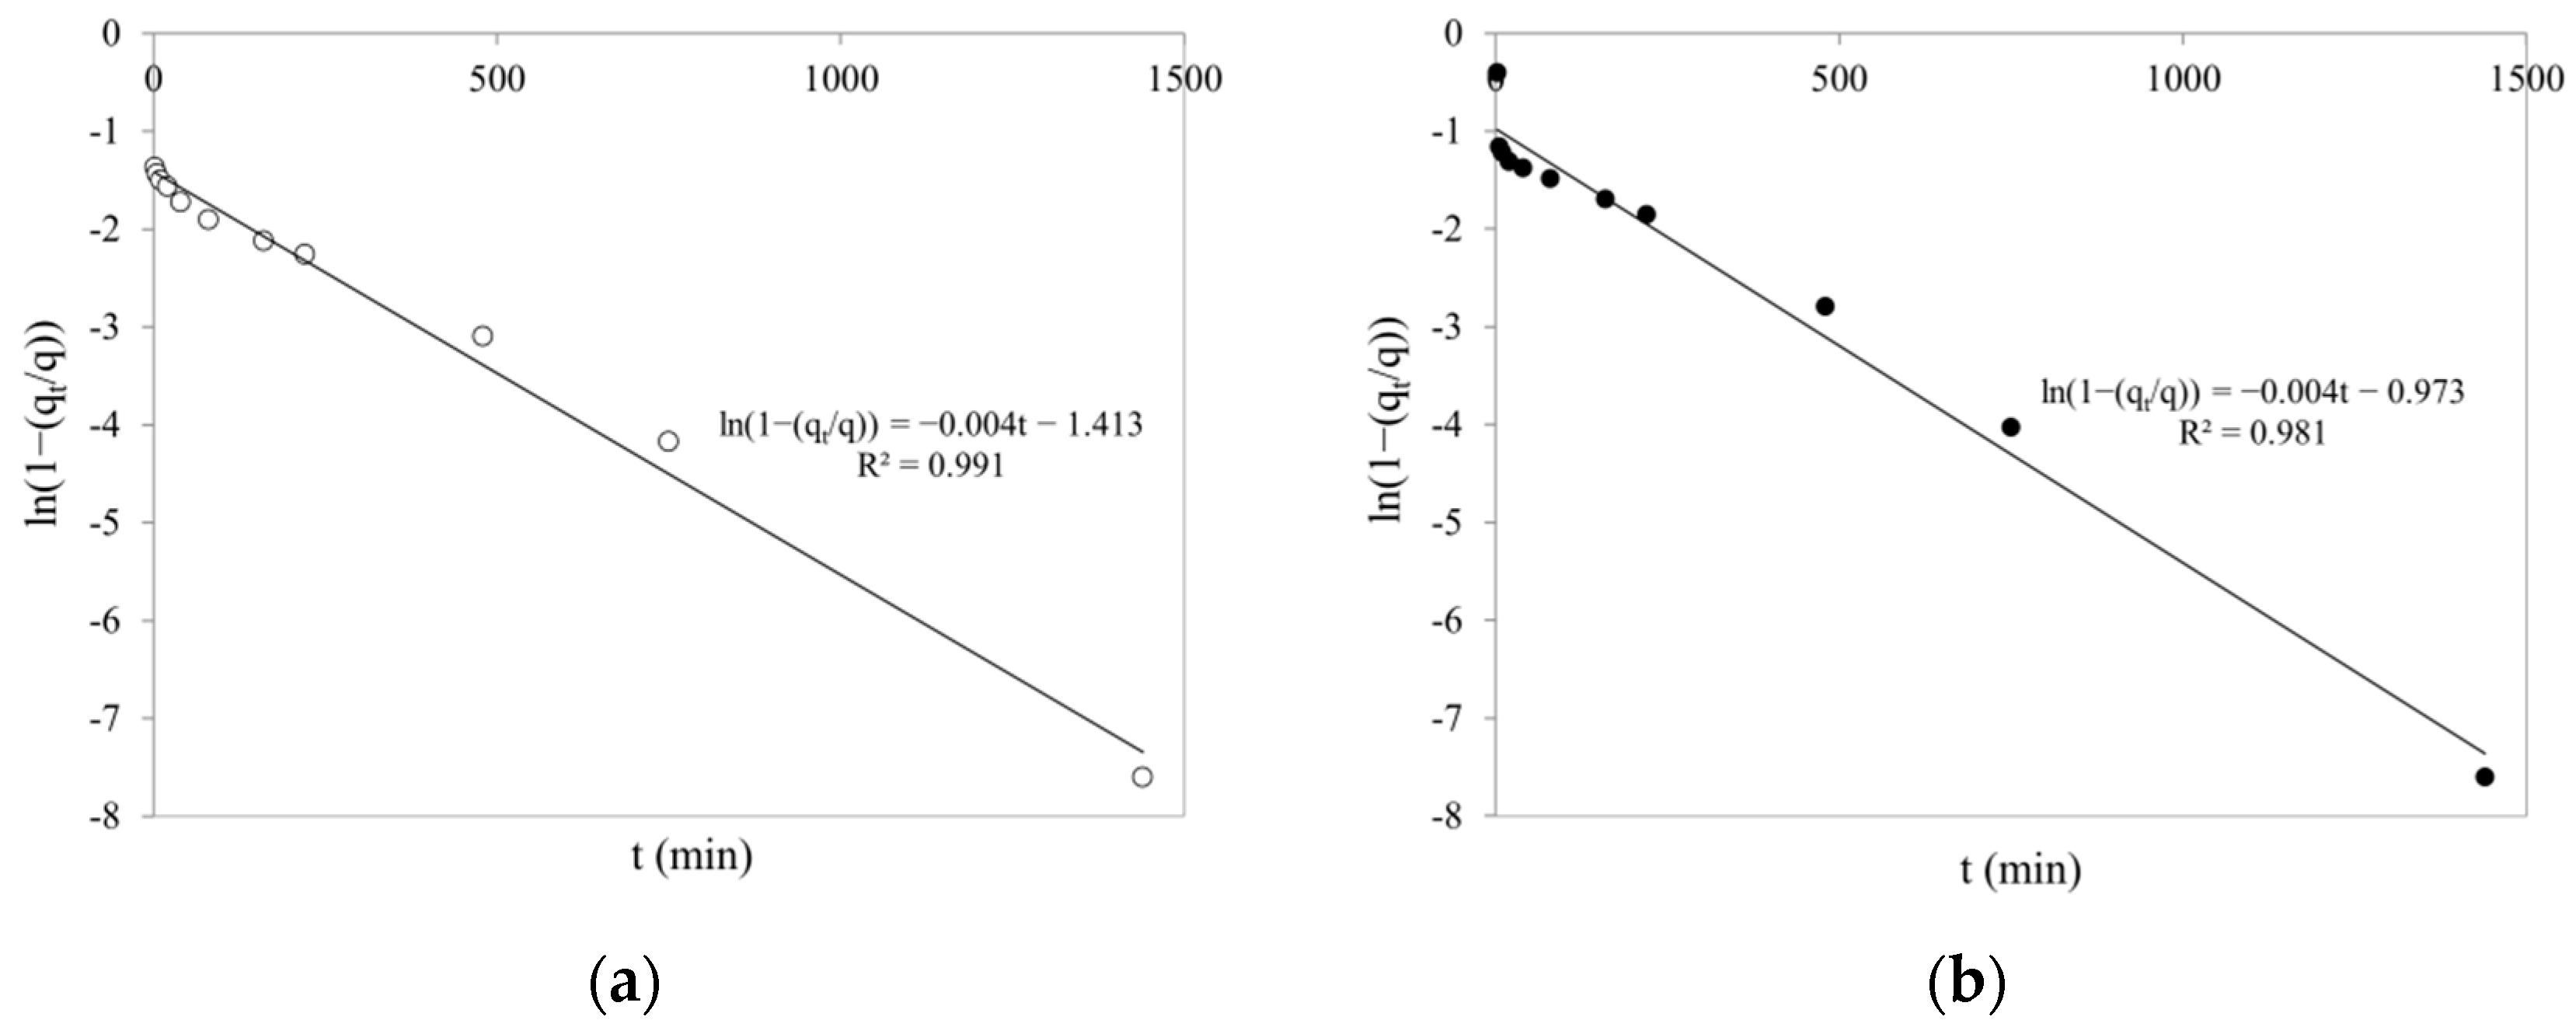
According to the obtained results, suggesting that adsorption in the boundary layer is the limiting stage of the adsorption process, the effectiveness of fitting the experimental data to the liquid film model was also investigated. A linear plot of ln(1 − (qt/q)) vs. t, with zero intercepts, would suggest that the kinetics of the adsorption process is controlled by liquid film diffusion.
As can be seen in Figure 10, the plots are linear but do not pass through the coordinate origin. Thus, diffusion in the liquid layer is not the dominant mechanism of Cr(VI) adsorption on SCHA and SCHB schwertmannite sorbents. The rate constant for liquid film diffusion (kLFD) was 0.0041 and 0.0044 min−1 for SCHA and SCHB, respectively (Table 3).

2.5. Effect of Initial Cr(VI) Concentration

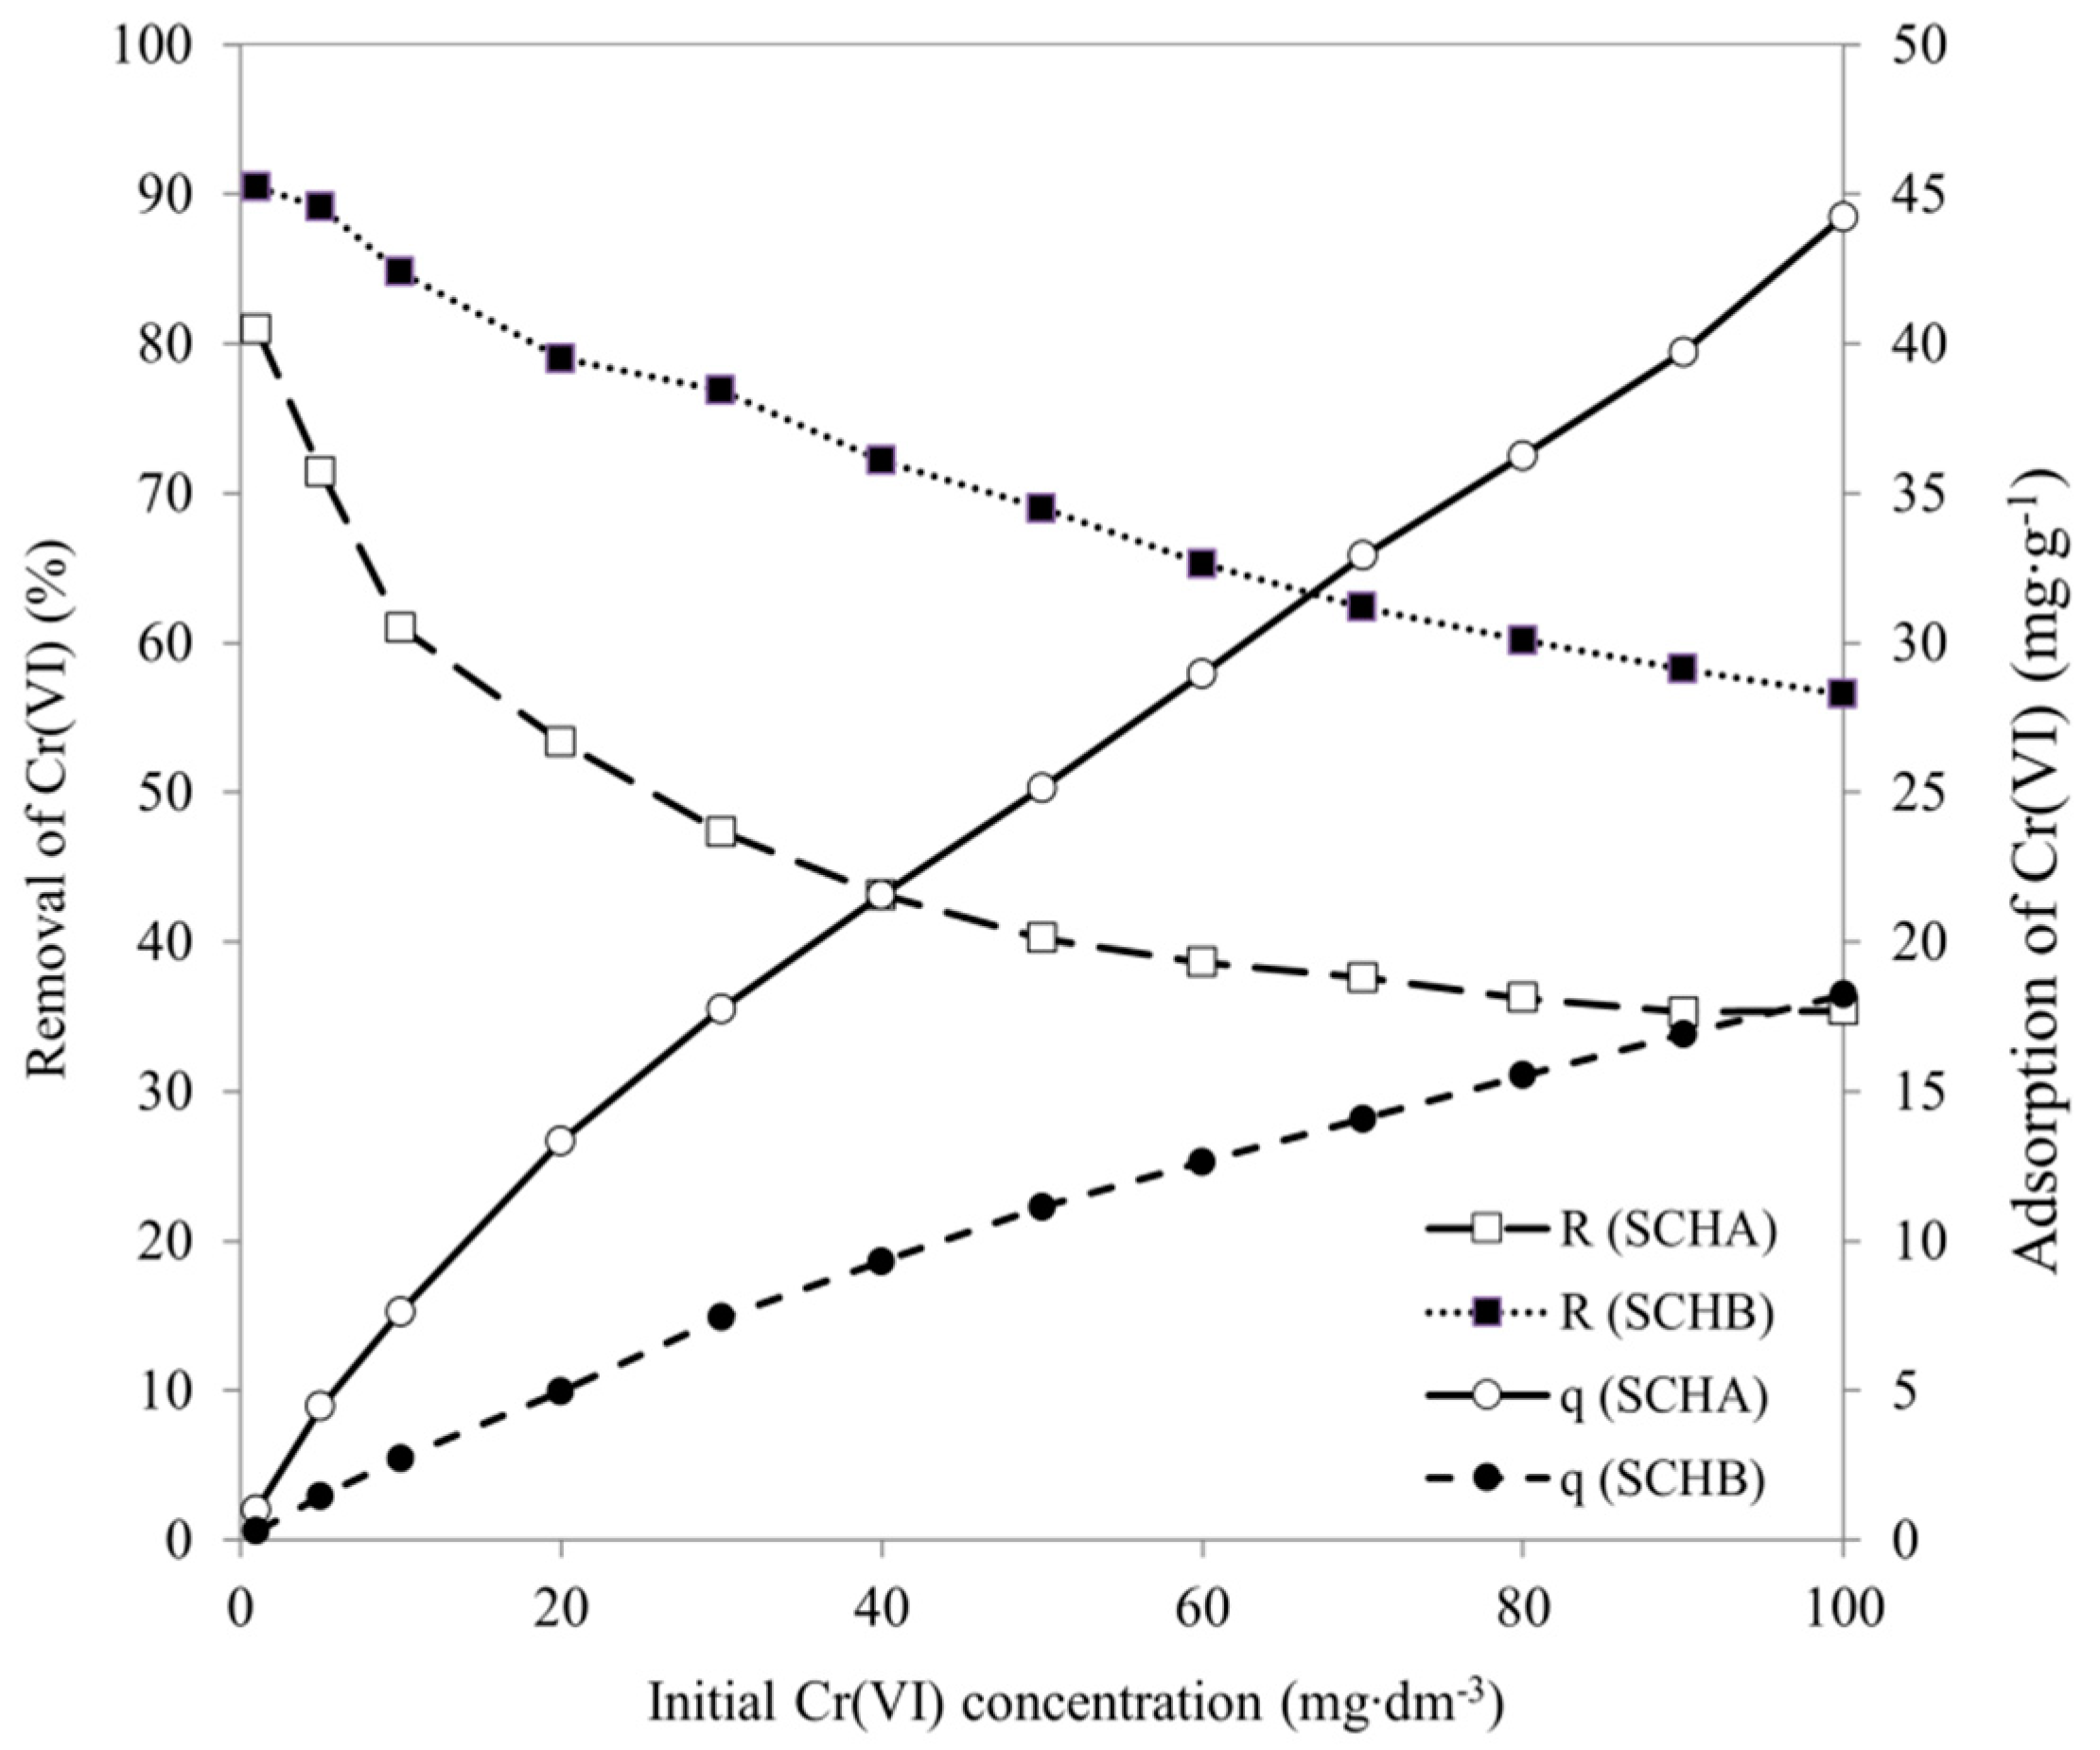
The effect of initial Cr(VI) concentration on adsorption onto SCHA and SCHB is presented in Figure 11. The results show that as the initial concentration increases, the amount of adsorbed Cr(VI) ions increases but the removal rate decreases. At higher initial concentration, the active sites of adsorbent are surrounded by more Cr(VI) ions in solution. Therefore, the equilibrium adsorption capacity increases with increasing initial Cr(VI) concentration. Furthermore, the percentage of Cr(VI) removal decreases with an increase in the initial Cr(VI) concentration. At low initial concentration, the ratio of the initial number of Cr(VI) ions to available active sites of adsorbent is low. Therefore, the percentage removal of Cr(VI) is higher, and at higher concentration, further residual Cr(VI) ions remain in solution [62].

Adsorption Isotherm Models

Estimation of the adsorption isotherm is crucial to determine the adsorption capacity and to study the adsorption nature. In this work, the experimental data on Cr(VI) adsorption equilibrium have been investigated using three two-parameter equations: Freundlich (Equation (6)) [63,64], Langmuir (Equation (7)) [64,65], and Temkin (Equation (8)) [64,66]. Table 4 shows the equations of the applied isotherm models.
The parameters of adsorption isotherms were estimated by linear regression method. In order to determine the parameters by linear regression, the adsorption isotherm equations are transformed to the linearised forms. The isotherm parameters were estimated based on the slope of the regression line and the intersection of the straight line with the axis of ordinates. The criterion for fitting the model was the value of the coefficient of determination (R2).
The adsorption isotherm parameters were determined for both measurement series, in the range of low and high initial Cr(VI) concentrations. The calculated parameters are presented in Table 5.
It can be seen in Table 5 that the Freundlich isotherm model best describes the experimental data—the values of the coefficient of determination close to 1. The Freundlich model is the best for describing data in the low concentration range (1–100 mg·dm1), which is confirmed by numerous literature sources [63,64]. On the other hand, in the wide range of initial concentrations studied, the Freundlich model performs well for Cr(VI) adsorption on SCHA. At the same time, the Langmuir isotherm model also performs well for adsorption on SCHB. The Temkin isotherm model fails when describing the adsorption of Cr(VI) on synthetic schwertmannite (R2 < 0.85). Therefore, it is not discussed in detail in this paper.
The dimensionless parameter 1/n in the Freundlich equation allows determining the adsorption intensity or surface heterogeneity indicating. When 1/n is greater than zero (0 < 1/n < 1), the adsorption is favourable; when 1/n is greater than 1, the adsorption process is unfavourable; and it is irreversible when 1/n = 1 [67]. The calculated values based on static adsorption tests are in the range of 0 < 1/n < 1, suggesting that Cr(VI) adsorption on schwertmannite is a favourable process. From the values of 1/n, it can also be concluded that the adsorbent surface is partially heterogeneous, as the inverse of the parameter n is closer to 1 than to 0. Schwertmannite is a versatile adsorbent that requires careful study of its adsorption properties. The kF parameter, on the other hand, is defined as the capacitance factor, which depends on 1/n. The obtained values for kF are higher for SCHA than for SCHB.
The validity of the Langmuir isotherm model was checked by calculating the separation coefficient RL [68,69]. It can be calculated from the following equation (Equation (9)) [70]:
RL = 1/(1 + kL·c0)
where kL and qL are parameters of Langmuir isotherm. As shown in Figure 12, the ranges of values of the separation coefficient RL were in all cases between 0 and 1 range, which means that the adsorption under the studied conditions was favourable [64,70].
Figure 12 shows the dependence of the equilibrium parameter on the initial concentration of Cr(VI) solution. The RL values range from 0 to 1, suggesting that adsorption proceeds favourably and SCHA and SCHB are suitable adsorbents for removing Cr(VI) ions from aqueous solutions.
Considering the high value of the coefficient of determination for the Langmuir isotherm (R2 > 0.96), it can be assumed that the calculated maximum adsorption capacity towards Cr (VI) at a low initial concentration of this element in the solution can reached 42.97 and 17.54 mg·g1 for SCHA and SCHB, respectively, which is in agreement with Figure 5 and Figure 6. For higher initial concentrations of Cr(VI), on the other hand, it can achieve 201.8 and 131.8 mg·g1 for SCHA and SCHB, respectively. According to Zhang and co-workers and Gan and co-workers, Freundlich and Langmuir models are the best fitting models for adsorption of Cr(VI) on schwertmannite [26,52], confirmed by the obtained experimental results.

2.6. Comparison with Other Studies

Cr(VI) removal on schwertmannite sorbents has been carried out and described by few authors. The literature survey shows that there are three different synthesis methods that yield schwertmannite of varying quality. These methods are Fe2+ oxidation, Fe3+ hydrolysis, and biosynthesis. However, there is still insufficient data to establish which synthesis method is superior for Cr(VI) removal, as most of the papers on schwertmannite adsorbents explore the affinity towards arsenic oxyanions for these hydroxysulphates [24,27,29,37,71]. The maximum adsorption capacities of schwertmannite sorbents synthesised by these three methods towards Cr(VI) are presented in Table 6. Bio-synthesised schwertmannite sorbents reach capacities up to 58.2 mg·g1 towards Cr(VI). In contrast, the adsorption capacities of chemically synthesised schwertmannite sorbents vary significantly from 17.5 mg·g1 to 219 mg·g1 for materials obtained by Fe2+ oxidation and from 43.0 mg·g1 to 178.6 mg·g1 for materials obtained by Fe3+ hydrolysis. The synthesis of mineral sorbents can be influenced by small changes in reaction conditions, including temperature, pressure, and concentration of substrates. Therefore, method optimisation is an important part of sorbent design.
As the sorbents reported in the literature show promising adsorption properties, including large surface area and favourable surface potential, it is important to continue research and gain further data on the schwertmannite synthesis process to obtain the most efficient product. An important conclusion is that the adsorption properties of schwertmannite are affected by the method of fabrication of this material. Despite their formal structural similarity, SCHA and SCHB have different characteristics that affect their adsorption capacity towards Cr(VI). SCHA has a smaller specific surface area but has a higher adsorption capacity. It is related to the structure of this adsorbent. It is finer and formed by fibrous crystallites (Figure 3B), which adsorb Cr(VI) better. In contrast, SCHB is mainly rounded aggregates (Figure 3D) that give a larger specific surface area. Still, their arrangement probably makes it difficult to access all active sites, and a lower adsorption capacity of this material is observed.

2.7. Possible Cr(VI) Adsorption Mechanism

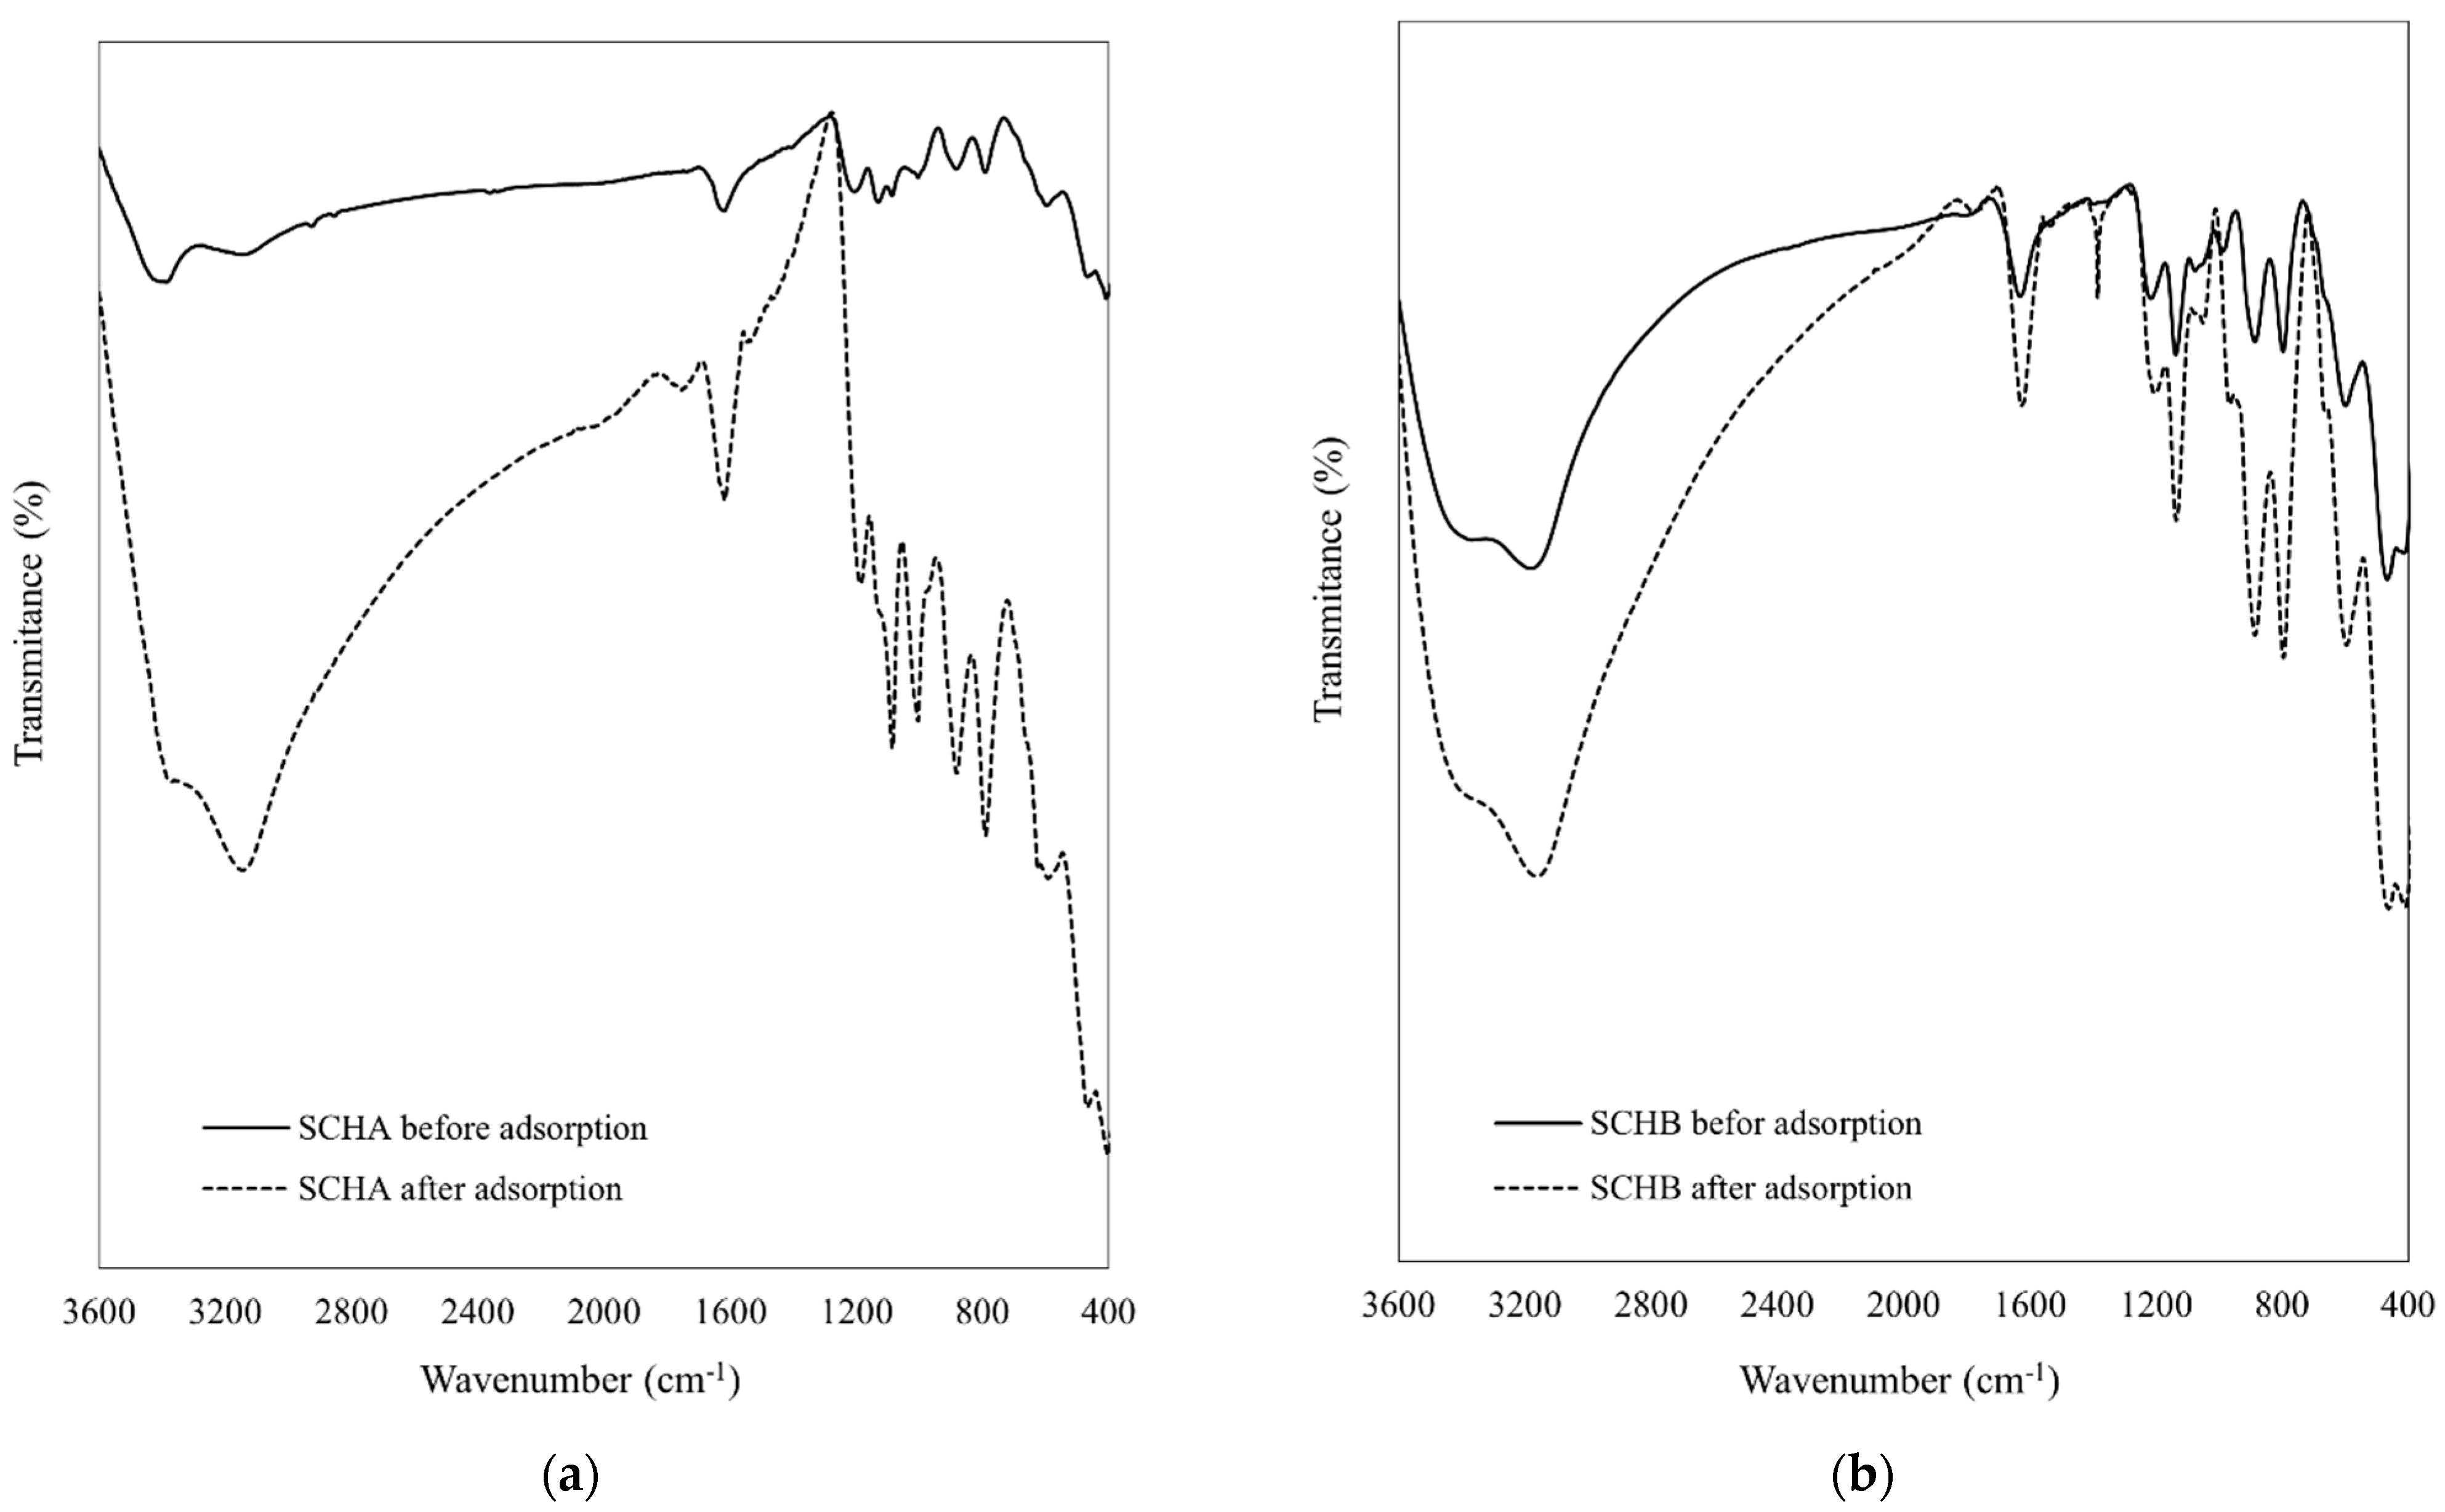
As reported by several authors, Cr(VI) adsorption on schwertmannite can be mainly attributed to ion exchange with SO42 groups [22,25,52,71]. Due to the same charge and a similar radius of SO42 (0.23 nm) and CrO42 (0.24 nm) ions, the replacement of sulphate groups with chromate groups occurs without changing the crystal structure of the schwertmannite [52]. No change in the structure of synthetic schwertmannite is observable when analysing FTIR spectra before and after adsorption of Cr(VI) and SEM images of schwertmannite after adsorption of Cr(VI).
According to the literature, the schwertmannite spectrum can consist of seven to eleven characteristic active infrared bands. Five of them correspond to sulphate vibrations and are located at wavenumber about 610, 975, 1055, 1130, and 1200 cm1 [22,23]. In addition, bands in the 3300 cm1 and 1630 cm1 range originate from the vibrations of the −OH and H2O groups, respectively. In the range of 400–700 cm−1, stretching bands appear originating from FeO bonds [23,34,52,75,76].
The FTIR spectra of the prepared schwertmannite adsorbents before and after Cr(VI) adsorption were measured and are shown in Figure 13. Analysis of FTIR spectra allows identification of the probable mechanism of Cr(VI) adsorption. Both samples (SCHA and SCHB) before adsorption of Cr(VI) had absorption bands in the range 3200–3400 cm−1 and 1630 cm−1 corresponding to −OH and H2O vibrations, respectively. Most of the bands allowing the identification of schwertmannite on the FTIR spectrum are located in the range 1200–600 cm1. In this region, the dominant absorption bands are the −SO42 stretching vibrations at 980, 1020, 1120, and 1200 cm1 and the bending vibration at 600 cm1, which are specific sulphate absorption bands for schwertmannite [22]. The −OH absorption bands at 790 and 880 cm1 are present in SCHA and SCHB, which may indicate low goethite content in both SCHA and SCHB. Moreover, a wide band at the wavenumber of about 485 cm1 indicates the presence of FeO bonds in the studied adsorbents.
In the FTIR spectra of SCHA and SCHB adsorbents after Cr(VI) adsorption, an increase in the intensity of the peaks at 3300 cm1, 1630 cm1, and in the range of 800–1200 cm1 can be observed. This change may indicate the involvement of −SO42− groups in Cr(VI) adsorption. These results are in line with other studies, which showed that many groups, especially sulphate groups, were responsible for Cr(VI) removal. The appearance of bands between 750 and 950 cm1 indicates Cr(VI) ions in the studied samples. In addition, other authors also note that bands from CrO42− appear in this range at 761, 777, 781, 828, 833, 882, 901, and 933 cm1 [42,77,78]. In this range, the changes that occurred after adsorption of Cr(VI) onto schwertmannite are most evident. In addition, a new band at the wavenumber of 1380 cm1 can be distinguished in the FTIR spectrum. The appearance of a new peak may suggest that a change in the structure of schwertmannite occurred during Cr(VI) adsorption. The vibrations at the wavenumber of 1380 cm1 may originate from chromium compounds, e.g., chromium(VI) oxide or chromium(III) sulphate hydrate (Spectral Database for Organic Compounds, SDBS), but Tinti and co-workers indicate that a band approximately 1380 cm1 would be due to coordinatively bound water [79].
SEM images of schwertmannite after Cr(VI) adsorption were also taken to determine the effect of adsorption on the structure of the adsorbents used. No significant changes in the morphology of schwertmannite after Cr(VI) adsorption were observed, and therefore these SEM micrographs are not included in this paper. In addition, Regenspurg did not observe any apparent effect on the structure and arrangement of the crystals in the samples containing chromates [42].
The electrokinetic potential and pHiep of schwertmannite after Cr(VI) adsorption were also determined. The results are shown in Figure 14. After Cr(VI) adsorption, the pHiep of both adsorbents increased and is around 8.0. This confirms the results of Regenspurg that adsorption of Cr(VI) on schwertmannite results in the replacement of sulphate groups with Cr(VI) ions and thus an increase in pHiep compared to the pHiep of schwertmannite before adsorption [42].
After analysing the obtained experimental results (FTIR spectra before and after adsorption, SEM images and electrokinetic potential) and the literature data, it can be concluded that Cr(VI) adsorption on schwertmannite can be controlled in two stages. Khamphila and co-workers found that the adsorption of Cr(VI) on easily accessible active sites during the fast initial stage is likely to be ion exchange with SO42 groups. In contrast, the second stage involves the slow diffusion of Cr(VI) from the surface sites into the interior of the adsorbent and the formation of complexes [25]. According to Zhang and co-workers, two types of surface complexes can form on the schwertmannite surface: monodentate (≡FeOCrO3) and bidentate (≡Fe2O2CrO2) [52].

3. Materials and Methods

3.1. Preparation of Schwertmannite Sorbents

The synthetic schwertmannite was obtained by two methods. The first synthesis method (Fe3+ hydrolysis) involved the hydrolytic transformation of iron chloride in the presence of large amounts of sulphate ions, according to the method published by Bigham and later by Schwertmann and Cornell [80,81]. For this purpose, 10.8 g FeCl3 × 6H2O and 3 g Na2SO4 were added to 2 dm3 of deionised water heated to 60 °C in a water bath. The precipitated brown-red suspension was kept at this temperature for 12 min, and it was stirred from time to time. The mixture was then cooled to room temperature and decanted to obtain a concentrated sludge. The sludge was then dialysed for about 30 days. Dialysis was completed when the conductivity of dialysate reached 2–3 μS·cm1. The suspension prepared in this way was stored in a glass vessel. The product thus obtained was labelled as synthetic schwertmannite A (SCHA).
The second type of schwertmannite was obtained by forced oxidation of iron(II) sulphate, according to the method (Fe2+ oxidation) published by Regenspurg and Peiffer [22,52]. In this method, 18.3 g FeSO4 × 7H2O was dissolved in 1 dm3 of deionised water and then 5 cm3 30% H2O2 was added. The precipitated brown-red suspension was stirred for about 24 h, centrifuged, and then dialysed for about 30 days. Dialysis was completed when the conductivity of dialysate reached 2–3 µS·cm1. The suspension prepared in this way was stored in a glass vessel. The obtained material was labelled as synthetic schwertmannite B (SCHB).

3.2. Characterisation of Schwertmannite

The images were taken using an Axio Imager.M1m optical microscope (Zeiss, Jena, Germany) and a JSM-6610LV scanning electron microscope (JEOL Ltd., Akishima, Japan) after sputtering the samples with carbon using an automatic coating machine JEC-530 (JEOL Ltd., Akishima, Japan). In addition, the dry matter content was measured in both suspensions. Particle size analysis by laser diffraction was carried out using a particle size analyser Mastersizer 2000 (Malvern Instruments Ltd., Malvern, UK). The specific surface areas of schwertmannite A (SCHA) and schwertmannite B (SCHB) were determined using FlowSorb 2300 apparatus (Micromeritics Instruments Corp, Norcross, GA, USA). The density of schwertmannite sorbents was performed using a pycnometer. The isoelectric point (pHiep) was determined by electrophoretic zeta potential measurements using a Zetasizer 2000 (Malvern Instruments Ltd., Malvern, UK). FT-IR measurements of the obtained schwertmannite sorbents were performed with a Vertex 70/70V spectrometer (Brucker, Billerica, MA, USA).

3.3. Adsorption Experiments

Potassium dichromate (K2Cr2O7) was used as the source of Cr(VI). A stock solution was prepared in deionised water by dissolving 2.8300 g of potassium dichromate in 1000 cm3. The solution had a concentration of 1000 mg·dm3 and a pH of about 4.5. The solutions used in the experiments were prepared from the stock solution by diluting it with deionised water. Most of the adsorption studies were performed using a Cr(VI) solution with a concentration of 100 mg·dm3. This concentration can be found in waters located in the vicinity of electroplating plants.
The adsorption studies were carried out by a batch method at room temperature. Concentrations of Cr(VI) were determined by measuring the absorbance at the characteristic wavelength (545 nm) using a UV-visible spectrophotometer Evolution 201 (Thermo Fisher Scientific, Madison, WI, USA), accordingly to the diphenylcarbazide method.
In all adsorption studies, schwertmannite suspensions were used directly after synthesis rather than dried material. The volume of the suspension samples was recalculated to dry schwertmannite content. Each experiment was repeated three times under the same conditions. The dry matter content in 1 cm3 of the suspension was 8.00 mg and 31.0 mg for SCHA and SCHB, respectively. It can be observed that the dry matter content for SCHB is approximately four times higher than for SCHA, which significantly affects the adsorption results.
Studies of Cr(VI) adsorption were carried out for both schwertmannite A (SCHA) and schwertmannite B (SCHB). Removal of Cr(VI) was tested in batch studies as a function of adsorbent dosage, pH, contact time, and initial Cr(VI) concentration. All adsorption studies were carried out using the batch method at room temperature for 24 h. The effect of pH was investigated by adjusting the pH of Cr(VI) solutions using 0.1 M HCl and 0.1 M NaOH. In this set of experiments, 1 cm3 of adsorbent (SCHA or SCHB) per 10 cm3 of 100 mg·dm3 Cr(VI) standard solution were taken. The effect of the adsorbent dose was studied by adding the varying volume of adsorbent (SCHA or SCHB) from 0.05 to 1 cm3 to Cr(VI) solution at an initial concentration of 100 mg·dm3 The kinetic experiments were conducted in batch mode by shaking 1 cm3 of adsorbent (SCHA or SCHB) with Cr(VI) solution at a constant pH (~4.5). Cr(VI) concentration was monitored for 24 h. The adsorption isotherms were performed in two measurement series—in the range of low initial Cr(VI) concentration (1–100 mg·dm3) and in the range of high initial Cr(VI) concentration (10–1000 mg·dm3). The adsorbent SCHA or SCHB (1 cm3) was added to 10 cm3 Cr(VI) solution (1–1000 mg·dm3). The pH of the solutions was 4.5 and the equilibrium time for this experiment was 24 h.
The amount of Cr(VI) adsorbed (removal in percentages) is calculated as follows (Equation (10)) [28]:
R(%) = ((c0 − c)/c0)·100
where c0 and c are the initial and the final concentrations of Cr(VI) in the aqueous solution (mg·dm−3).
The equilibrium adsorption capacity was calculated from the standard equation (Equation (11)) [28]:
qe = (c0 − c)·V/m
where c0 and c (mg·dm3) are the initial and equilibrium Cr(VI) concentrations, respectively; V (cm3) is the volume of the solution and m (g) is the amount of adsorbent.

4. Conclusions

The sorption of Cr(VI) from aqueous solutions has been examined on two types of schwertmannite sorbents (SCHA and SCHB). SCHA was formed by Fe3+ hydrolysis and SCHB by Fe2+ oxidation. Based on the experimental results and theoretical predictions, the following conclusions can be drawn:
  • Compared with literature data, both SCHA and SCHB are efficient adsorbents for Cr(VI) removal.
  • SCHA has a higher adsorption capacity than SCHB, despite its smaller specific surface area.
  • The well-developed specific surface area suggests that schwertmannite (SCHA and SCHB) can be a good Cr(VI) sorbents, especially in acidic conditions.
  • Adsorption of Cr(VI) on schwertmannite sorbents should be carried out at pH of around 4 as the removal of Cr(VI) is the most efficient under those conditions.
  • The IPD model suggested that intraparticle diffusion is not the only rate-limiting step in Cr(VI) adsorption on schwertmannite.
  • The PSO model describes the adsorption kinetics of Cr(VI) on SCHA and SCHB better than the PFO model.
  • The sorption isotherm was well described by Freundlich and Langmuir models.
  • According to the Langmuir model, the maximum adsorption capacity of Cr(VI) at low initial concentration is 42.97 and 17.54 mg·g1 for SCHA and SCHB, respectively, and at high initial concentrations is 201.8 and 131.8 mg·g1 for SCHA and SCHB, respectively.
Although schwertmannite sorbents have been thoroughly investigated for the adsorption of arsenic oxyanions, Cr(VI) removal on schwertmannite is still a poorly explored area. Nevertheless, the results of the present work and those of previously published studies indicate that schwertmannite has promising properties as a Cr(VI) removal sorbent and is worthy of thorough investigation.

Author Contributions

Conceptualisation, J.U.; Formal analysis, J.U., Ł.S. and I.P.; Investigation, J.U.; Methodology, J.U.; Resources, J.U.; Validation, J.U., Ł.S. and I.P.; Visualisation, J.U.; Writing—original draft, J.U. and Ł.S.; Writing—review and editing, Ł.S. and I.P. All authors have read and agreed to the published version of the manuscript.

Funding

This research was funded by a subsidy from the Polish Ministry of Science and Higher Education for K25W03D05 of Wroclaw University of Science and Technology, subsidy number 8211104160 (MPK 9030250000).

Conflicts of Interest

The authors declare no conflict of interest. The funders had no role in the design of the study; in the collection, analyses, or interpretation of data; in the writing of the manuscript, or in the decision to publish the results.

Nomenclature

ttime (min)
qethe amount of Cr(VI) adsorbed at equilibrium (mg·g−1)
qtthe amount of Cr(VI) adsorbed at time t (mg·g−1)
cethe equilibrium concentration of Cr(VI) (mg·dm−3)
c0the initial concentration of Cr(VI) (mg·dm−3)
mthe adsorbent mass (g)
Vthe solution volume (dm3)
q1the adsorption capacity of Cr(VI) at equilibrium for pseudo-first-order model (mg·g−1)
k1the rate constant of pseudo-first-order model (min−1)
q2the adsorption capacity of Cr(VI) at equilibrium for pseudo-second-order model (mg·g−1)
k2the rate constant of pseudo-second-order model (g·mg−1·min−1)
kIPDthe intraparticle diffusion rate constant (mg·g−1·min−1/2)
Bthe parameter related to the thickness of the boundary layer (mg·g−1)
kLFDthe external mass transfer coefficient (min−1)
kFthe Freundlich constant indicative of the relative adsorption capacity of the adsorbent ((dm3)1/n·mg(1−1/n)·g−1)
nthe Freundlich equation exponent (-)
qLthe maximum adsorption capacity in Langmuir model (mg·g−1)
kLthe Langmuir constant related to the energy of adsorption (dm3·mg−1)
Rthe universal gas constant (kJ·mol−1·K−1)
Ttemperature (K)
BTthe Temkin constant related to heat of sorption (kJ·mol−1)
kTthe Temkin equilibrium isotherm constant (dm3·g−1)
RLthe separation parameter (-)
qthe amount of Cr(VI) adsorbed (mg·g−1)
cthe concentration of Cr(VI) (mg·dm−3)

References

  1. Aris, A.Z.; Lim, W.Y.; Looi, L.J. Natural and Anthropogenic Determinants of Freshwater Ecosystem Deterioration: An Environmental Forensic Study of the Langat River Basin, Malaysia. In Environmental Management of River Basin Ecosystems; Ramkumar, M., Kumaraswamy, K., Mohanraj, R., Eds.; Springer Earth System Sciences: Cham, Switzerland, 2015. [Google Scholar] [CrossRef]
  2. Markert, B.; Kayser, G.; Korhammer, S.; Oehlmann, J. Distribution and effects of trace substances in soils, plants and animals. Trace Met. Environ. 2000, 4, 3–31. [Google Scholar] [CrossRef]
  3. Jaishankar, M.; Tseten, T.; Anbalagan, N.; Mathew, B.B.; Beeregowda, K.N. Toxicity, mechanism and health effects of some heavy metals, Interdisciplinary Toxicology. Interdiscip. Toxicol. 2014, 7, 60–72. [Google Scholar] [CrossRef] [PubMed] [Green Version]
  4. Bochniarz, Z. The Ecological Disaster in Eastern Europe: Background, Current Aspects and Suggestions for the Future. Pol. Rev. 1992, 37, 5–25. Available online: http://www.jstor.org/stable/25778608 (accessed on 9 March 2021).
  5. Greenwood, N.N.; Earnshaw, A. Chromium, molybdenum and tungsten. Chem. Elem. 1997, 1002–1039. [Google Scholar] [CrossRef]
  6. Mohanty, M.; Patra, H.K. Effect of Ionic and Chelate Assisted Hexavalent Chromium on Mung Bean Seedlings (Vigna radiata L. wilczek. var k-851) During Seedling Growth. J. Stress Physiol. Biochem. 2013, 9, 232–241. [Google Scholar]
  7. Gusain, D.; Verma, V.; Uma; Bux, F.; Sharma, Y.C. A novel approach for the removal of chromium (VI) from aqueous solutions using nano iron oxide. Int. J. Environ. Anal. Chem. 2020, 1–16. [Google Scholar] [CrossRef]
  8. Boddu, S.; Alugunulla, V.N.; Dulla, J.B.; Pilli, R.R.; Khan, A.A. Estimation of biosorption characteristics of chromium (VI) from aqueous and real tannery effluents by treated T. vulgaris: Experimental assessment and statistical modelling. Int. J. Environ. Anal. Chem. 2020, 1–20. [Google Scholar] [CrossRef]
  9. Minas, F.; Chandravanshi, B.S.; Leta, S. Chemical precipitation method for chromium removal and its recovery from tannery wastewater in Ethiopia. Chem. Int. 2017, 3, 291–305. [Google Scholar] [CrossRef]
  10. Ren, Y.; Han, Y.; Lei, X.; Lu, C.; Liu, J.; Zhang, G.; Zhang, B.; Zhang, Q. A magnetic ion exchange resin with high efficiency of removing Cr(VI). Colloids Surf. A Physicochem. Eng. Asp. 2020, 604, 125279. [Google Scholar] [CrossRef]
  11. Nur-E-Alam, M.; Mia, M.A.S.; Ahmad, F.; Rahman, M.M. An overview of chromium removal techniques from tannery effluent. Appl. Water Sci. 2020, 10, 205. [Google Scholar] [CrossRef]
  12. Jahangiri, K.; Yousefi, N.; Ghadiri, S.K.; Fekri, R.; Bagheri, A.; Talebi, S.S. Enhancement adsorption of hexavalent chromium onto modified fly ash from aqueous solution; optimization; isotherm, kinetic and thermodynamic study. J. Dispers. Sci. Technol. 2019, 40, 1147–1158. [Google Scholar] [CrossRef]
  13. Deng, X.; Qi, L.; Zhang, Y. Experimental study on adsorption of hexavalent chromium with microwave-assisted alkali modified fly ash. Water Air Soil Pollut 2018, 229, 18. [Google Scholar] [CrossRef]
  14. Pengthamkeerati, P.; Satapanajaru, T.; Chularuengoaksorn, P. Chemical modification of coal fly ash for the removal of phosphatefrom aqueous solution. Fuel 2008, 87, 2469–2476. [Google Scholar] [CrossRef]
  15. Zachara, J.M.; Glrvin, D.C.; Schmidt, R.L.; Resch, T.C. Chromate Adsorption on Amorphous Iron Oxyhydroxide in the Presence of Major Groundwater Ions. Environ. Sci. Technol. 1987, 21, 589–594. [Google Scholar] [CrossRef] [PubMed] [Green Version]
  16. Hingston, F.J.; Posner, A.M.; Quirk, J.P. Competitive adsorption of negatively charged ligands on oxide surfaces. Discuss. Faraday Soc. 1971, 52, 334–342. [Google Scholar] [CrossRef]
  17. Leckie, J.O.; Benjamin, M.M.; Hayes, K.; Kaufman, G.; Altmann, S. Adsorption/Coprecipitation of Trace Elements from Water with Iron Oxyhydroxide; Environmental Engineering and Science, Stanford University: Stanford, CA, USA, 1980. [Google Scholar] [CrossRef]
  18. Eary, L.E.; Rai, D. Chromate removal from aqueous wastes by reduction with ferrous ion. Environ. Sci. Technol. 1988, 22, 972–977. [Google Scholar] [CrossRef] [PubMed]
  19. Deng, Y.; Stjernström, M.; Banwart, S. Accumulation and remobilization of aqueous chromium(VI) at iron oxide surfaces: Application of a thin-film continuous flow-through reactor. J. Contam. Hydrol. 1996, 21, 141–151. [Google Scholar] [CrossRef]
  20. Jabasingh, S.A.; Belachew, H.; Yimam, A. Iron oxide induced bagasse nanoparticles for the sequestration of Cr6+ ions from tannery effluent using a modified batch reactor. J. Appl. Polym. Sci. 2018, 135, 46683–46698. [Google Scholar] [CrossRef]
  21. Chagas, P.M.B.; Caetano, A.A.; Rossi, M.A.; Gonçalves, M.A.; de Castro Ramalho, T.; Corrêa, A.D.; Guimarães, I.R. Chitosan-iron oxide hybrid composite: Mechanism of hexavalent chromium removal by central composite design and theoretical calculations. Environ. Sci. Pollut. Res. 2019, 26, 15973–15988. [Google Scholar] [CrossRef]
  22. Regenspurg, S.; Peiffer, S. Arsenate and chromate incorporation in schwertmannite. Appl. Geochem. 2005, 20, 1226–1239. [Google Scholar] [CrossRef]
  23. Zhang, Z.; Bi, X.; Li, X.; Zhao, Q.; Chen, H. Schwertmannite: Occurrence, properties, synthesis and application in environmental remediation. RSC Adv. 2018, 8, 33583–33599. [Google Scholar] [CrossRef] [Green Version]
  24. Cao, Q.; Chen, C.; Li, K.; Sun, T.; Shen, Z.; Jia, J. Arsenic(V) removal behavior of schwertmannite synthesized by KMnO4 rapid oxidation with high adsorption capacity and Fe utilization. Chemosphere 2021, 264, 128398. [Google Scholar] [CrossRef] [PubMed]
  25. Khamphila, K.; Kodama, R.; Sato, T.; Otake, T. Adsorption and post adsorption behavior of schwertmannite with various oxyanions. J. Miner. Mater. Charact. Eng. 2017, 5, 90–106. [Google Scholar] [CrossRef] [Green Version]
  26. Gan, M.; Zheng, Z.; Sun, S.; Zhu, J.; Liu, X. The influence of aluminum chloride on biosynthetic schwertmannite and Cu(II)/Cr(VI) adsorption. RSC Adv. 2015, 5, 94500–94512. [Google Scholar] [CrossRef]
  27. Song, J.; Jia, S.Y.; Ren, H.T.; Wu, S.H.; Han, X. Application of a high-surface-area schwertmannite in the removal of arsenate and arsenite. Int. J. Environ. Sci. Technol. 2015, 12, 1559–1568. [Google Scholar] [CrossRef]
  28. Goswami, A.; Purkait, M.K. Removal of fluoride from drinking water using nanomagnetite aggregated schwertmannite. J. Water Process Eng. 2014, 1, 91–100. [Google Scholar] [CrossRef]
  29. Dou, X.; Mohan, D.; Pittman, C.U., Jr. Arsenate adsorption on three types of granular schwertmannite. Water Res. 2013, 47, 2938–2948. [Google Scholar] [CrossRef]
  30. Burton, E.D.; Bush, R.T.; Johnston, S.G.; Watling, K.M.; Hocking, R.K.; Sullivan, L.A.; Parker, G.K. Sorption of Arsenic(V) and Arsenic(III) to Schwertmannite. Environ. Sci. Technol. 2009, 43, 9202–9207. [Google Scholar] [CrossRef]
  31. Jönsson, J.; Sjöberg, S.; Lövgren, L. Adsorption of Cu(II) to schwertmannite and goethite in presence of dissolved organic matter. Water Res. 2006, 40, 969–974. [Google Scholar] [CrossRef]
  32. Kawano, M.; Obokata, S.; Tomita, K. Surface reactive sites and ion adsorption modeling of schwertmannite. Clay Sci. 2006, 45, 223–232. [Google Scholar] [CrossRef]
  33. Merkus, H.G. Particle Size Measurements. Fundamentals, Practice, Quality; Springer Science: Dordrecht, The Netherlands, 2009. [Google Scholar]
  34. Xie, Y.; Lu, G.; Yang, C.; Qu, L.; Chen, M.; Guo, C.; Dang, Z. Mineralogical characteristics of sediments and heavy metal mobilization along a river watershed affected by acid mine drainage. PLoS ONE 2018, 13, 1–17. [Google Scholar] [CrossRef] [Green Version]
  35. Meng, X.; Zhang, C.; Zhuang, J.; Zheng, G.; Zhou, L. Assessment of schwertmannite, jarosite and goethite as adsorbents for efficient adsorption of phenanthrene in water and the regeneration of spent adsorbents by heterogeneous fenton-like reaction. Chemosphere 2020, 244, 125523. [Google Scholar] [CrossRef]
  36. Li, J.; Xie, Y.; Lu, G.; Ye, H.; Yi, X.; Reinfelder, J.R.; Lin, Z.; Dang, Z. Effect of Cu(II) on the stability of oxyanion—Substituted schwertmannite. Environ. Sci. Pollut. Res. 2018, 25, 15492–15506. [Google Scholar] [CrossRef]
  37. Zhang, Z.; Wang, L.; Zhou, B.; Wang, S.; Fan, L.; Hu, S.; Wu, Y. Adsorption performance and mechanism of synthetic schwertmannite to removal low-concentration fluorine in water. Bull. Environ. Contam. Toxicol. 2021, 1–11. [Google Scholar] [CrossRef]
  38. Paikaray, S.; Göttlicher, J.; Peiffer, S. As(III) retention kinetics, equilibrium and redox stability on biosynthesized schwertmannite and its fate and control on schwertmannite stability on acidic (pH 3.0) aqueous exposure. Chemosphere 2012, 86, 557–564. [Google Scholar] [CrossRef]
  39. Reichelt, L.; Bertau, M. Production of ferrihydrite and schwertmannite using a microjet mixer device. Chem. Eng. Res. Des. 2015, 98, 70–80. [Google Scholar] [CrossRef]
  40. Ying, H.; Feng, X.; Zhu, M.; Lanson, B.; Liu, F.; Wang, X. Formation and transformation of schwertmannite through direct Fe3+ hydrolysis under various geochemical conditions. Environ. Sci. Nano 2020, 7, 2385–2398. [Google Scholar] [CrossRef]
  41. Regenspurg, S.; Brand, A.; Peiffer, S. Formation and stability of schwertmannite in acidic mining lakes. Geochim. Cosmochim. Acta 2004, 68, 1185–1197. [Google Scholar] [CrossRef]
  42. Vithana, C.L.; Sullivan, L.A.; Bush, R.T.; Burton, E.D. Schwertmannite in soil materials: Limits of detection of acidified ammonium oxalate method and differential X-ray diffraction. Geoderma 2015, 249–250, 51–60. [Google Scholar] [CrossRef]
  43. Regenspurg, S. Characterisation of Schwertmannite—Geochemical Interactions with Arsenate and Chromate and Significance in Sediments of Lignite Opencast Lakes. Ph.D. Thesis, Lehrstuhl für Hydrologie der Fakultät für Chemie, Biologie und Geowissenschaften, der Universität Bayreuth, Bayreuth, Germany, 2002. [Google Scholar]
  44. Liu, F.W.; Zhou, J.; Zhang, S.S.; Liu, L.L.; Zhou, L.X.; Fan, W.H. Schwertmannite Synthesis through Ferrous Ion Chemical Oxidation under Different H2O2 Supply Rates and Its Removal Efficiency for Arsenic from Contaminated Groundwater. PLoS ONE 2015, 10, e0138891. [Google Scholar] [CrossRef] [PubMed]
  45. Dong, S.; Dou, X.; Mohan, D.; Pittman, C.U., Jr.; Luo, J. Synthesis of graphene oxide/schwertmannite nanocomposites and their application in Sb(V) adsorption from water. Chem. Eng. J. 2015, 270, 205–214. [Google Scholar] [CrossRef]
  46. Eskandarpour, A.; Onyango, M.S.; Tananhashi, M.; Ochieng, A.; Bando, Y.; Iwai, K.; Okado, M.; Asai, S. Magnetic Fixed-bed Column for Cr(VI) Removal from Aqueous Solution Using Schwertmannite. ISIJ Int. 2008, 48, 240–244. [Google Scholar] [CrossRef]
  47. Li, Y.; Mohan, D.; Pittman, C.U., Jr.; Ok, Y.S.; Dou, X.M. Removal of antimonate and antimonite from water by schwertmannite granules. Desalin. Water Treat. 2016, 57, 25639–25652. [Google Scholar] [CrossRef]
  48. Wang, W.M.; Song, J.; Han, X. Schwertmannite as a new Fenton-like catalyst in the oxidation of phenol by H2O2. J. Hazard. Mater. 2013, 262, 412–419. [Google Scholar] [CrossRef] [PubMed]
  49. Cornell, R.M.; Schwertmann, U. The Iron Oxides: Structure, Properties, Reactions, Occurrence and Uses; Wiley-VCH: Weinheim, Germany, 2003. [Google Scholar]
  50. Rakhunde, R.; Deshpande, L.; Juneja, H.D. Chemical speciation of chromium in water: A review. Crit. Rev. Environ. Sci. Technol. 2012, 42, 776–810. [Google Scholar] [CrossRef]
  51. Anah, L.; Astrini, N. Influence of pH on Cr(VI) ions removal from aqueous solutions using carboxymethyl cellulose-based hydrogel as adsorbent. IOP Conf. Ser. Earth Environ. Sci. 2017, 60, 012010. [Google Scholar] [CrossRef] [Green Version]
  52. Zhang, Z.; Guo, G.; Li, X.; Zhao, Q.; Bi, X.; Wu, K.; Chen, H. Effects of hydrogen-peroxide supply rate on schwertmannite microstructure and chromium(VI) adsorption performance. J. Hazard. Mater. 2019, 367, 520–528. [Google Scholar] [CrossRef]
  53. Lagergren, S. Zur theorie der Sogenannten adsorption geloster stoffe, Kungliga Svenska Vetenskapsakademiens. Handlingar 1898, 24, 1–24. [Google Scholar]
  54. Ho, Y.S. Citation review of Lagergren kinetic rate equation on adsorption reactions. Scientometrics 2004, 59, 171–177. [Google Scholar] [CrossRef]
  55. Ho, Y.S.; McKay, G. Pseudo-second order model for sorption processes. Process Biochem. 1999, 34, 451–465. [Google Scholar] [CrossRef]
  56. Demirbas, E.; Kobya, M.; Senturk, E.; Ozkaz, T. Adsorption kinetics for the removal of chromium(VI) from aqueous solutions on the activated carbons prepared from agricultural waste. Water SA 2004, 30, 533–540. [Google Scholar] [CrossRef] [Green Version]
  57. Weber, W.J.; Morris, J.C. Advances in water pollution research: Removal of biologically resistant pollutants from waste waters by adsorption. In Proceedings of the International Conference on Water Pollution Symposium; Pregamon Press: Oxford, UK, 1962; Volume 2, pp. 231–266. [Google Scholar]
  58. Qiu, H.; Lv, L.; Pan, B.; Zhang, Q.; Zhang, W.; Zhang, Q. Critical review in adsorption kinetic models. J. Zhejiang Univ.-Sci. A 2009, 10, 716–724. [Google Scholar] [CrossRef]
  59. Boyd, G.E.; Adamson, A.W.; Myers, L.S. The exchange adsorption of ions from aqueous solutions by organic zeolites: II. Kinetics. J. Am. Chem. Soc. 1947, 69, 2836–2848. [Google Scholar] [CrossRef] [PubMed]
  60. Ho, Y.S.; McKay, G. A comparison of chemisorptions kinetic models applied to pollutant removal on various sorbents. Process Saf. Environ. Prot. 1998, 76B, 332–340. [Google Scholar] [CrossRef] [Green Version]
  61. Aroua, M.K.; Daud, W.M.A.W.; Yin, C.Y.; Adinata, D.J.S. Adsorption capacities of carbon dioxide, oxygen, nitrogen and methane on carbon molecular basket derived from polyethyleneimine impregnation on microporous palm shell activated carbon. Sep. Purif. Technol. 2008, 62, 609–613. [Google Scholar] [CrossRef]
  62. Gorzin, F.; Bahri Rasht Abadi, M.M. Adsorption of Cr(VI) from aqueous solution by adsorbent prepared from paper mill sludge: Kinetics and thermodynamics studies. Adsorpt. Sci. Technol. 2018, 36, 149–169. [Google Scholar] [CrossRef]
  63. Freundlich, H.M.F. Über die Adsorption Lösungen. Z. Phys. Chem. 1906, 57, 385–470. [Google Scholar] [CrossRef]
  64. Wang, J.; Guo, X. Adsorption isotherm models: Classification, physical meaning, application and solving method. Chemosphere 2020, 258, 127279. [Google Scholar] [CrossRef]
  65. Langmuir, I. The constitution and fundamental properties of solids and liquids. J. Am. Chem. Soc. 1916, 38, 2221–2295. [Google Scholar] [CrossRef] [Green Version]
  66. Temkin, M.I.; Pyzhev, V. Kinetics of ammonia synthesis on promoted iron catalyst. Acta Phys. Chim. USSR 1940, 12, 327–356. [Google Scholar]
  67. Al-Ghouki, M.A.; Daana, D.A. Guidelines for the use and interpretation of adsorption isotherm models: A review. J. Hazard. Mater. 2020, 393, 122383. [Google Scholar] [CrossRef] [PubMed]
  68. Hadi, M.; Samarghandi, M.R.; McKay, G. Equilibrium two-parameter isotherms of acid dyes sorption by activated carbons: Study of residual errors. Chem. Eng. J. 2010, 160, 408–416. [Google Scholar] [CrossRef]
  69. Hall, K.R.; Eagleton, L.C.; Acrivos, A.; Vermeulen, T. Pore- and solid-diffusion kinetics in fixed-bed adsorption under constant-pattern conditions. Ind. Eng. Chem. Fundamen. 1966, 5, 212–223. [Google Scholar] [CrossRef]
  70. Foo, K.Y.; Hammed, B.H. Insights into the modeling of adsorption isotherm systems. Chem. Eng. J. 2010, 156, 2–10. [Google Scholar] [CrossRef]
  71. Antelo, J.; Fiol, S.; Gondar, D.; López, R.; Arce, F. Comparison of arsenate, chromate and molybdate binding on schwertmannite: Surface adsorption vs. anion-exchange. J Colloid Interface Sci. 2012, 386, 338–343. [Google Scholar] [CrossRef]
  72. Yu, C.; Zhang, J.; Wu, X.; Lan, Y.; Zhou, L. Cr(VI) removal by biogenic schwertmannite in continous flow column. Geochem. J. 2014, 48, 1–7. [Google Scholar] [CrossRef] [Green Version]
  73. Song, Y.; Zhang, J.; Wang, H. Initial pH and K+ concentrations jointly determine the types of biogenic ferric hydroxysulfate minerals and their effect on adsorption removal of Cr(VI) in simulated acid mine drainage. Water Sci. Technol. 2018, 78, 2183–2191. [Google Scholar] [CrossRef]
  74. Zhu, J.; Chen, F.; Gan, M. Controllable biosynthesis of nanoscale schwertmannite and the application in heavy metal effective removal. Appl. Surf. Sci. 2020, 529, 147012. [Google Scholar] [CrossRef]
  75. Paikaray, S.; Schröder, C.; Peiffer, S. Schwertmannite stability in anoxic Fe(II)—Rich aqueous solution. Geochim. Cosmochim. Acta 2017, 217, 292–305. [Google Scholar] [CrossRef]
  76. Boily, J.F.; Gassman, P.L.; Pevetyahko, T.; Szanyi, J.; Zachora, J.M. FTIR spectral components of schwertmannite. Environ. Sci. Technol. 2010, 44, 1185–1190. [Google Scholar] [CrossRef]
  77. Hoffman, M.M.; Darab, J.G.; Fulton, J.L. An infrared and X–ray absorption study of the equilibria and structures of chromate, bichromate, and dichromate in ambient aqueous solutions. J. Phys. Chem. A 2001, 105, 1772–1782. [Google Scholar] [CrossRef]
  78. Ramsey, J.D.; Xia, L.; Kendig, M.W.; McCreery, R.L. Raman spectroscopic analysis of the speciation of dilute chromate solutions. Corros. Sci. 2001, 43, 1557–1572. [Google Scholar] [CrossRef]
  79. Tinti, A.; Tugnoli, V.; Bonora, S.; Francioso, O. Recent applications of vibrational mid-Infrared (IR) spectroscopy for studying soil components: A review. J. Cent. Eur. Agric. 2015, 16, 1–22. [Google Scholar] [CrossRef]
  80. Bigham, J.M.; Schwertmann, U.; Carlson, I.; Murad, E. A poorly crystallized oxyhydroxysulfate of iron formed by bacterial oxidation of Fe(II) in acid mine waters. Geochim. Cosmochim. Acta 1990, 54, 2743–2758. [Google Scholar] [CrossRef]
  81. Schwertmann, U.; Cornell, R.M. Iron Oxides in the Laboratory: Preparation and Characterization; WILEY-VCH Verlag GmbH: Weinheim, Germany, 2000. [Google Scholar] [CrossRef]
Figure 1. The particle size distribution of obtained schwertmannite: (A) SCHA, (B) SCHB.
Ijms 22 08175 g001
Figure 2. Images of synthetic schwertmannite samples taken using an optical microscope: (A,B) are SCHA; (C,D) are SCHB.
Ijms 22 08175 g002
Figure 3. Images of synthetic schwertmannite samples taken with a scanning electron microscope: (A,B) are SEM images of SCHA; (C,D) are SEM images of SCHB.
Ijms 22 08175 g003
Figure 4. Zeta potential of synthetic schwertmannite adsorbents (SCHA and SCHB) as function of pH.
Ijms 22 08175 g004
Figure 5. The adsorption capacity and Cr(VI) removal of SCHA (100 mg·dm3; 25 °C; pH 4.5).
Ijms 22 08175 g005
Figure 6. The adsorption capacity and Cr(VI) removal of SCHB (100 mg·dm3; 25 °C; pH 4.5).
Ijms 22 08175 g006
Figure 7. Effect of pH on adsorption and removal of Cr(VI) onto SCHA and SCHB (q is adsorption of Cr(VI) (mg·g1), R is removal of Cr(VI) (%); the final pH values are shown above the bar graphs) (100 mg·dm3; 25 °C; volume of adsorbent 1 cm3).
Ijms 22 08175 g007
Figure 8. Effect of contact time on adsorption of Cr(VI) (100 mg·dm3; 25 °C; pH 4.5; volume of adsorbent 1 cm3).
Ijms 22 08175 g008
Figure 9. Intraparticle diffusion model of Cr(VI) adsorption on schwertmannite sorbents: (a) SCHA; (b) SCHB (100 mg·dm−3; 25 °C; pH 4.5; volume of adsorbent 1 cm3).
Ijms 22 08175 g009
Figure 10. Liquid film diffusion model of Cr(VI) adsorption on schwertmannite sorbents: (a) SCHA; (b) SCHB (100 mg·dm−3; 25 °C; pH 4.5; volume of adsorbent 1 cm3).
Ijms 22 08175 g010
Figure 11. Effect of initial Cr(VI) concentration (R is removal of Cr(VI) (%), q is adsorption of Cr(VI) (mg·g1)) (25 °C; pH 4.5; volume of adsorbent 1 cm3).
Ijms 22 08175 g011
Figure 12. The calculated separation coefficient profile for Cr(VI) as a function of the initial Cr(VI) concentration.
Ijms 22 08175 g012
Figure 13. FTIR spectra of synthetic schwertmannite by (a) Fe3+ hydrolysis (SCHA) before and after Cr(VI) adsorption; (b) Fe2+ oxidation (SCHB) before and after Cr(VI) adsorption.
Ijms 22 08175 g013
Figure 14. Zeta potential of synthetic schwertmannite adsorbents after Cr(VI) adsorption.
Ijms 22 08175 g014
Table 1. List of adsorption kinetics models used in this work.
ModelEquationParametersRelationshipReference
Pseudo-first-order (PFO)log(qe − qt) = log(q1) − (k1/2.303)·t
(2)
q1 (mg·g−1)
k1 (min−1)
log(qe − qt) vs. t[53,54]
Pseudo-second-order (PSO)(t/qt) = (1/(k2·q22)) + (1/q2)·t
(3)
q2 (mg·g−1)
k2 (g·mg−1·min−1)
t/qt vs. t[55,56]
Intraparticle diffusion (IPD)qt = kIPD·t1/2 + B
(4)
kIPD (mg·g−1·min−1/2)
B (mg·g−1)
qt vs. t1/2[57,58]
Liquid film diffusion (LFD)ln(1 − qt/qe) = − kLFD·t
(5)
kLFD (min−1)ln(1 − qt/qe) vs. t[58,59]
Table 2. Kinetic parameters of pseudo-first-order (PFO) and pseudo-second-order (PSO) models.
AdsorbentPFOPSO
qexp
(mg·g−1)
k1
(min−1)
q1
(mg·g−1)
R2SDk2
(g·mg−1·min−1)
q2
(mg·g−1)
R2SD
SCHA39.980.004311.490.94920.10.002639.970.9990.007
SCHB17.690.00467.490.9647.210.000717.720.9990.022
Table 3. Parameters of the intraparticle diffusion (IDP) and liquid film diffusion (LFD) models.
AdsorbentIPDLFD
kIPD1
(mg·g−1·min−0.5)
B1
(mg·g−1)
R2kIPD2
(mg·g−1·min−0.5)
B2
(mg·g−1)
R2kLFD
(min−1)
R2
SCHA0.145830.040.9570.008434.880.7980.00410.991
SCHB0.058712.140.9070.005714.300.7760.00440.981
Table 4. List of adsorption isotherm models used in this work.
Isotherm ModelEquationParametersReference
Freundlichqe = kF·ce1/n
(6)
kF ((dm3)1/n·mg(1−1/n)·g−1)
n (−)
[63,64]
Langmuirqe = (qL·kL·ce)/(1 + kL·ce)
(7)
qL (mg·g−1)
kL (dm3·mg−1)
[64,65]
Temkinqe = (R·T/BT)·ln(kT·ce)
(8)
BT (kJ·mol−1)
kT (dm3·g−1)
[64,66]
Table 5. Parameters of isotherm adsorption models.
Low Concentration of Cr(VI)
(1–100 mg·dm−3)
High Concentration of Cr(VI)
(10–1000 mg·dm−3)
SCHASCHBSCHASCHB
Freundlich
n1.681.771.031.29
1/n0.5950.5650.9710.775
kF ((dm3)1/n mg(11/n)·g−1)3.492.241.911.17
R20.9980.9960.9850.982
Langmuir
qL (mg·g−1)42.9717.54201.8131.8
kL (dm3·mg−1)0.0540.1160.01270.0055
R20.9840.9760.9660.961
Temkin
bT (J·mol−1)244.6823.721.856.9
kT (dm3·g−1)0.5843.500.07330.0395
R20.8870.8700.6210.788
Table 6. Comparison of adsorption capacity of schwertmannite synthesised by different methods for Cr(VI).
Method of Synthesisqmax (mg·g−1)Reference
Fe2+ oxidation17.5 *This paper
131.8 **
219[52]
Fe3+ hydrolysis43.0 *This paper
201.8 **
83.5[25]
105[71]
178.6[46]
Biosynthesis38.8[26]
35.3[72]
19.0[73]
58.2[74]
* The maximum adsorption capacity according to the Langmuir model calculated for the experiment performed in low concentrations of Cr(VI). ** The maximum adsorption capacity according to the Langmuir model calculated for the experiment performed in high concentrations of Cr(VI).
Publisher’s Note: MDPI stays neutral with regard to jurisdictional claims in published maps and institutional affiliations.