
Long-Term Fluoxetine Administration Causes Substantial Lipidome Alteration of the Juvenile Macaque Brain

 , , ,
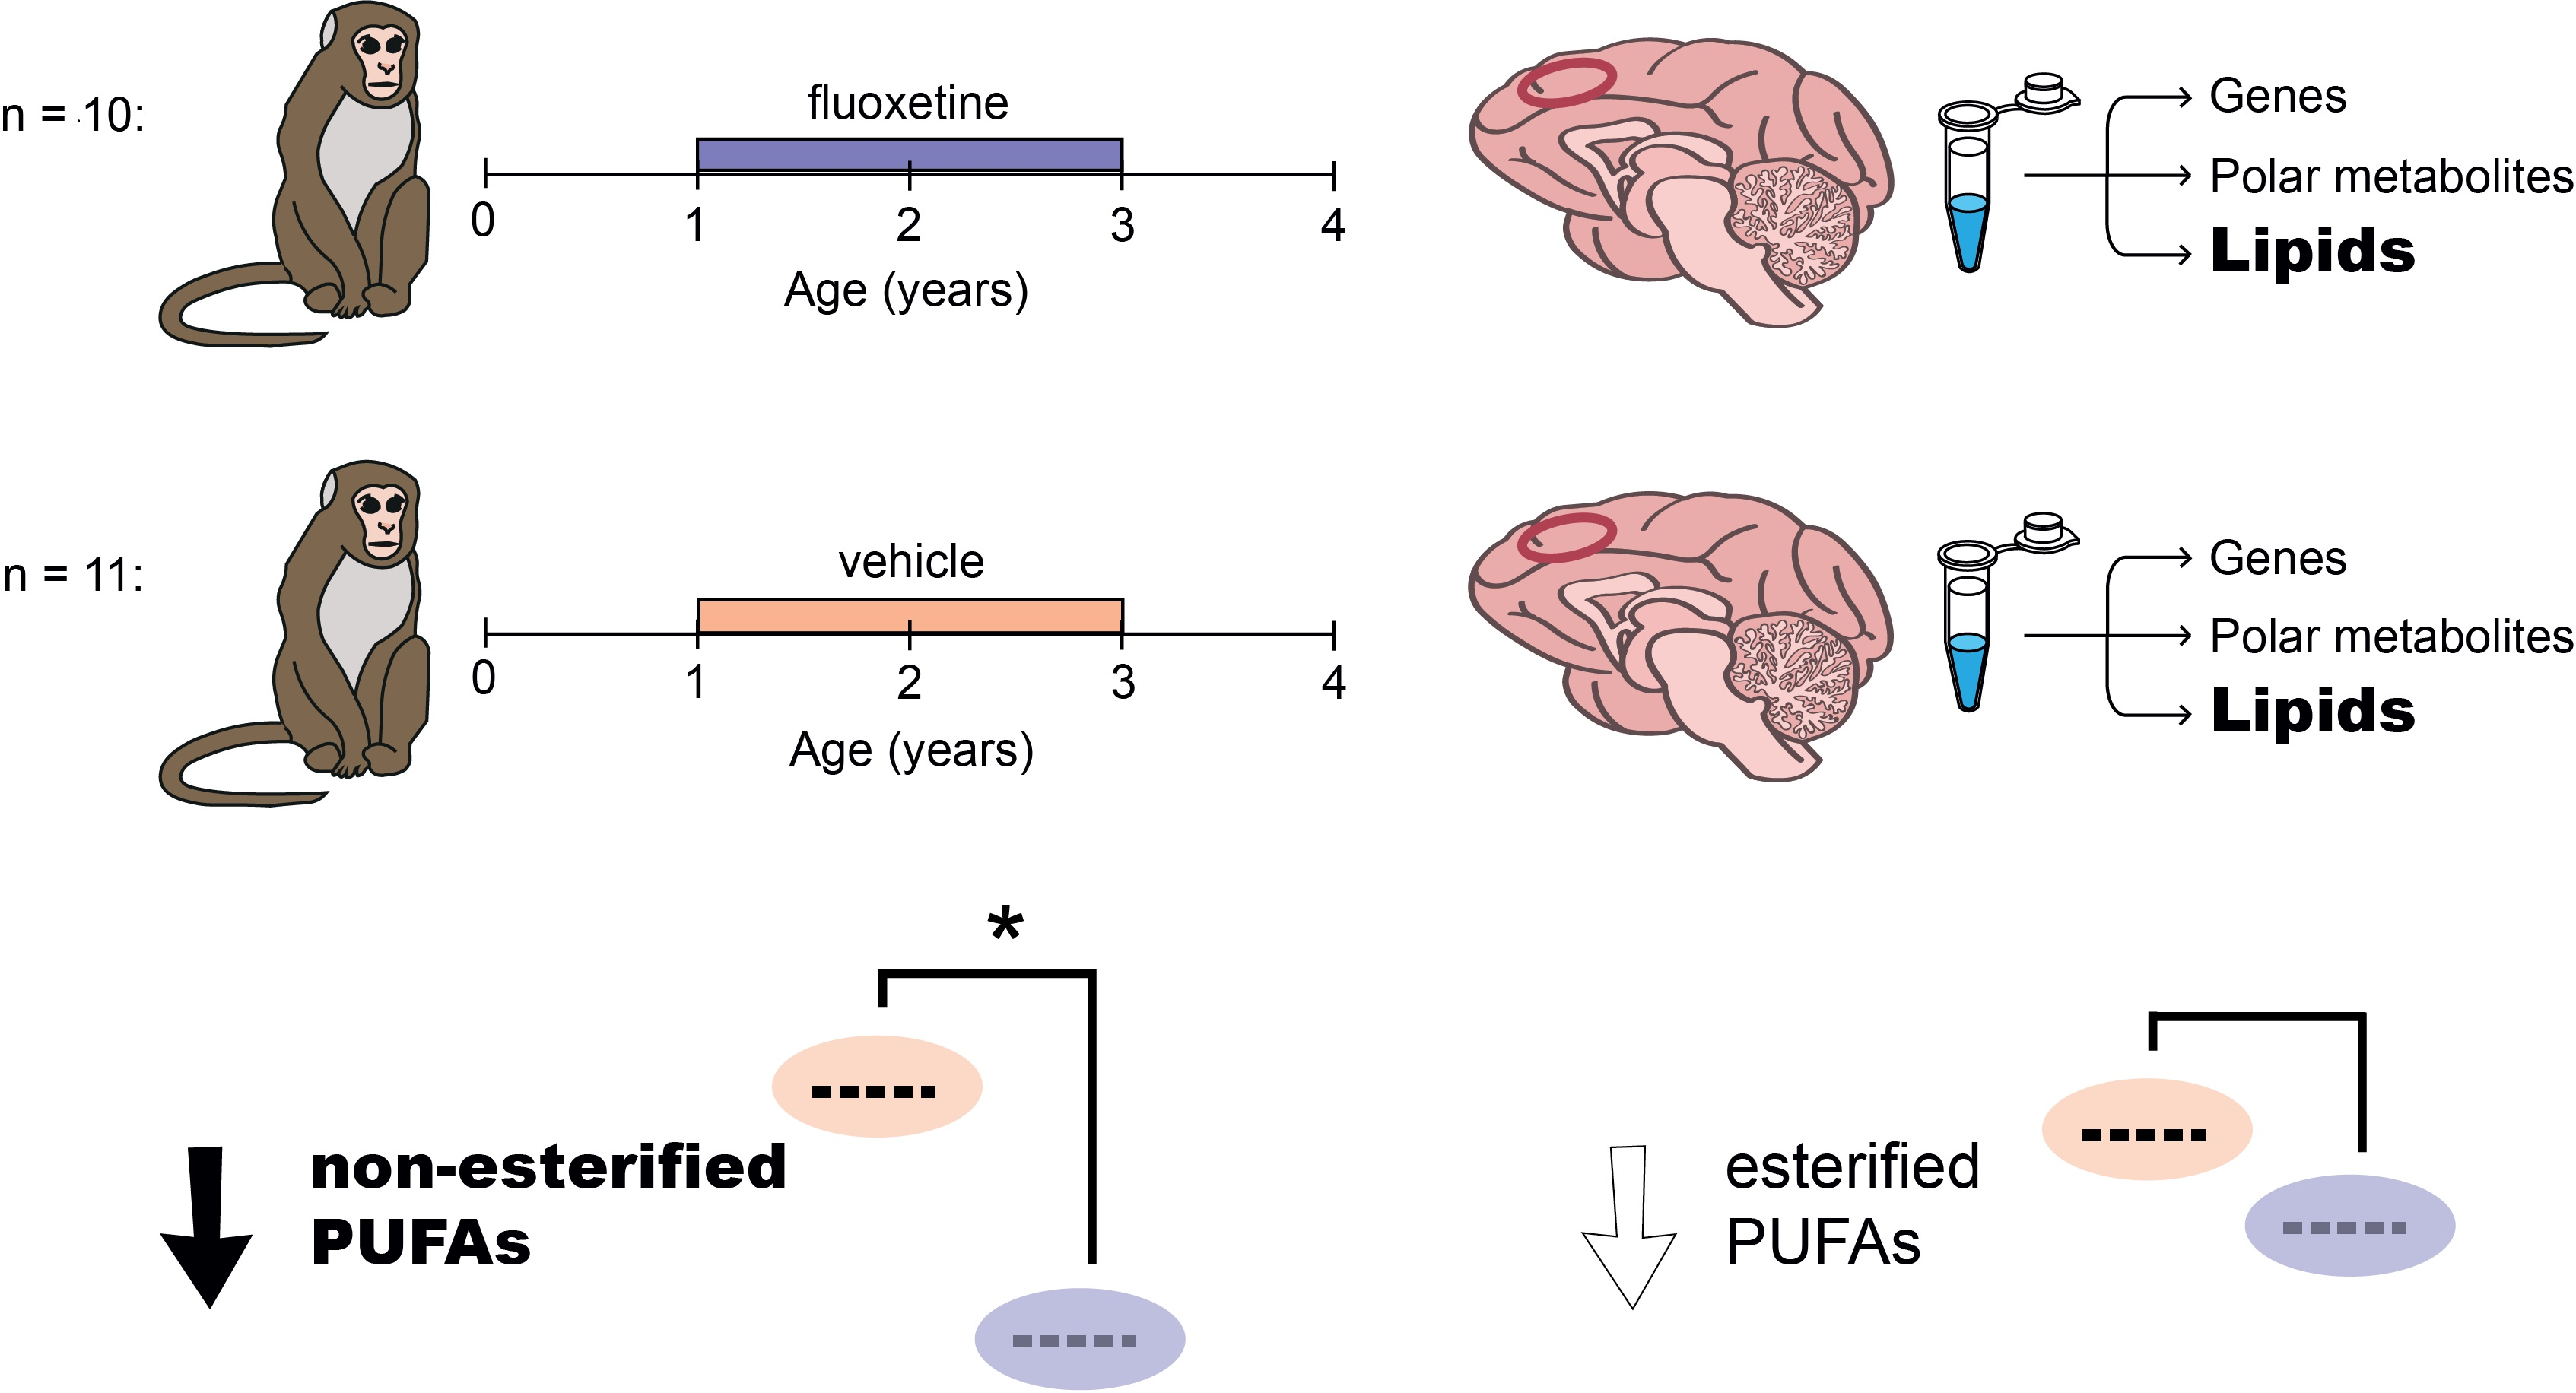
, , ,
Abstract

1. Introduction
2. Results
3. Discussion
4. Materials and Methods
4.1. Assurance of Compliance with Animal Codes
4.2. Subjects and Design
4.3. Fluoxetine Dosing
4.4. MAOA Genotyping
4.5. Necropsy and Medial Prefrontal Cortex Tissue Collection
4.6. Transcriptomics
4.7. Sample Preparation
4.8. Metabolomics
4.9. Lipidomics
4.10. Statistical Analysis
Supplementary Materials
Author Contributions
Funding
Institutional Review Board Statement
Informed Consent Statement
Data Availability Statement
Acknowledgments
Conflicts of Interest
Abbreviations
| AA | arachidonic acid |
| Cer | ceramide |
| DAG | diacylglycerol |
| DHA | docosahexaenoic acid |
| FFA | free fatty acid |
| HexCer | hexosylceramide |
| LPC | lysophosphatidylcholine |
| LPE | lysophosphatidylethanolamine |
| MAG | monoacylglycerol |
| MAOA | monoamine oxidase A |
| PC | phosphatidylcholine |
| PC-O | plasmanylphosphatidylcholine |
| PC-P | plasmenylphosphatidylcholine |
| PE | phosphatidylethanolamine |
| PE-O | plasmanylphosphatidylethanolamine |
| PE-P | plasmenylphosphatidylethanolamine |
| PI | phosphatidylinositol |
| PUFA | polyunsaturated fatty acid |
| SHexCer | sulfatide |
| SM | sphingomyelin |
| TAG | triacylglycerol |
| ;O1 | total number of hydroxyl groups = 1 (sphingolipids) |
| ;O2 | total number of hydroxyl groups = 2 (sphingolipids) |
| ;O3 | total number of hydroxyl groups = 3 (sphingolipids) |
References
- Henry, A.; Kisicki, M.D.; Varley, C. Efficacy and safety of antidepressant drug treatment in children and adolescents. Mol. Psychiatry 2012. [Google Scholar] [CrossRef]
- Geller, D.A.; Hoog, S.L.; Heiligenstein, J.H.; Ricardi, R.K.; Tamura, R.; Kluszynski, S.; Jacobson, J.G. Fluoxetine treatment for obsessive-compulsive disorder in children and adolescents: A placebo-controlled clinical trial. J. Am. Acad. Child Adolesc. Psychiatry 2001. [Google Scholar] [CrossRef] [PubMed]
- Birmaher, B.; Axelson, D.A.; Monk, K.; Kalas, C.; Clark, D.B.; Ehmann, M.; Bridge, J.; Heo, J.; Brent, D.A. Fluoxetine for the treatment of childhood anxiety disorders. J. Am. Acad. Child Adolesc. Psychiatry 2003. [Google Scholar] [CrossRef]
- Nilsson, M.; Joliat, M.J.; Miner, C.M.; Brown, E.B.; Heiligenstein, J.H. Safety of subchronic treatment with fluoxetine for major depressive disorder in children and adolescents. J. Child Adolesc. Psychopharmacol. 2004. [Google Scholar] [CrossRef]
- Hollander, E.; Phillips, A.; Chaplin, W.; Zagursky, K.; Novotny, S.; Wasserman, S.; Iyengar, R. A placebo controlled crossover trial of liquid fluoxetine on repetitive behaviors in childhood and adolescent autism. Neuropsychopharmacology 2005. [Google Scholar] [CrossRef]
- Hetrick, S.E.; Merry, S.; McKenzie, J.; Sindahl, P.; Proctor, M. Selective serotonin reuptake inhibitors (SSRIs) for depressive disorders in children and adolescents. Cochrane Database Syst. Rev. 2007. [Google Scholar] [CrossRef]
- Quintana, H.; Butterbaugh, G.J.; Purnell, W.; Layman, A.K. Fluoxetine monotherapy in attention-deficit/hyperactivity disorder and comorbid non-bipolar mood disorders in children and adolescents. Child Psychiatry Hum. Dev. 2007. [Google Scholar] [CrossRef]
- Strawn, J.R.; Welge, J.A.; Wehry, A.M.; Keeshin, B.; Rynn, M.A. Efficacy and tolerability of antidepressants in pediatric anxiety disorders: A systematic review and meta-analysis. Depress. Anxiety 2015. [Google Scholar] [CrossRef] [PubMed]
- Williams, K.; Brignell, A.; Randall, M.; Silove, N.; Hazell, P. Selective serotonin reuptake inhibitors (SSRIs) for autism spectrum disorders (ASD). Cochrane Database Syst. Rev. 2013. [Google Scholar] [CrossRef]
- Kumar, B.; Prakash, A.; Sewal, R.K.; Medhi, B.; Modi, M. Drug therapy in autism: A present and future perspective. Pharmacol. Rep. 2012. [Google Scholar] [CrossRef]
- Scharfstein, L.A.; Beidel, D.C.; Finnell, L.R.; Distler, A.; Carter, N.T. Do pharmacological and behavioral interventions differentially affect treatment outcome for children with social phobia? Behav. Modif. 2011. [Google Scholar] [CrossRef]
- Stevanovic, D.; Tadic, I.; Knez, R. Are antidepressants effective in quality of life improvement among children and adolescents? A systematic review. CNS Spectr. 2014. [Google Scholar] [CrossRef]
- Teicher, M.H.; Glod, C.; Cole, J.O. Emergence of intense suicidal preoccupation during fluoxetine treatment. Am. J. Psychiatry 1990. [Google Scholar] [CrossRef]
- Nischal, A.; Tripathi, A.; Nischal, A.; Trivedi, J.K. Suicide and antidepressants: What current evidence indicates. Mens Sana Monogr. 2012. [Google Scholar] [CrossRef]
- Sharma, A.; Guski, L.S.; Freund, N.; Gøtzsche, P.C. Suicidality and aggression during antidepressant treatment: Systematic review and meta-analyses based on clinical study reports. BMJ 2016. [Google Scholar] [CrossRef] [PubMed]
- Oberlander, T.F.; Gingrich, J.A.; Ansorge, M.S. Sustained neurobehavioral effects of exposure to ssri antidepressants during development: Molecular to clinical evidence. Clin. Pharmacol. Ther. 2009. [Google Scholar] [CrossRef] [PubMed]
- Shrestha, S.S.; Nelson, E.E.; Liow, J.S.; Gladding, R.; Lyoo, C.H.; Noble, P.L.; Morse, C.; Henter, I.D.; Kruger, J.; Zhang, B.; et al. Fluoxetine administered to juvenile monkeys: Effects on the serotonin transporter and behavior. Am. J. Psychiatry 2014. [Google Scholar] [CrossRef] [PubMed]
- Oh, J.E.; Zupan, B.; Gross, S.; Toth, M. Paradoxical anxiogenic response of juvenile mice to fluoxetine. Neuropsychopharmacology 2009. [Google Scholar] [CrossRef]
- Goldman-Rakic, P.S. Development of cortical circuitry and cognitive function. Child Dev. 1987. [Google Scholar] [CrossRef]
- Bachevalier, J.; Vargha-Khadem, F. The primate hippocampus: Ontogeny, early insult and memory. Curr. Opin. Neurobiol. 2005. [Google Scholar] [CrossRef]
- Alvarado, M.C.; Malkova, L.; Bachevalier, J. Development of relational memory processes in monkeys. Dev. Cogn. Neurosci. 2016. [Google Scholar] [CrossRef]
- Blue, S.N.; Kazama, A.M.; Bachevalier, J. Development of Memory for Spatial Locations and Object/Place Associations in Infant Rhesus Macaques with and without Neonatal Hippocampal Lesions. J. Int. Neuropsychol. Soc. 2013. [Google Scholar] [CrossRef]
- Zeamer, A.; Heuer, E.; Bachevalier, J. Developmental trajectory of object recognition memory in infant rhesus macaques with and without neonatal hippocampal lesions. J. Neurosci. 2010. [Google Scholar] [CrossRef]
- Golub, M.; Hogrefe, C. Sleep disturbance as detected by actigraphy in juvenile monkeys receiving therapeutic doses of fluoxetine. Neurotoxicol. Teratol. 2015. [Google Scholar] [CrossRef]
- Golub, M.S.; Hogrefe, C.E.; Bulleri, A.M. Peer social interaction is facilitated in juvenile rhesus monkeys treated with fluoxetine. Neuropharmacology 2016. [Google Scholar] [CrossRef]
- He, Y.; Hogrefe, C.E.; Grapov, D.; Palazoglu, M.; Fiehn, O.; Turck, C.W.; Golub, M.S. Identifying individual differences of fluoxetine response in juvenile rhesus monkeys by metabolite profiling. Transl. Psychiatry 2014. [Google Scholar] [CrossRef] [PubMed]
- Golub, M.S.; Hackett, E.P.; Hogrefe, C.E.; Leranth, C.; Elsworth, J.D.; Roth, R.H. Cognitive performance of juvenile monkeys after chronic fluoxetine treatment. Dev. Cogn. Neurosci. 2017. [Google Scholar] [CrossRef] [PubMed]
- Golub, M.S.; Bulleri, A.M.; Hogrefe, C.E.; Sherwood, R.J. Bone growth in juvenile rhesus monkeys is influenced by 5HTTLPR polymorphisms and interactions between 5HTTLPR polymorphisms and fluoxetine. Bone 2015. [Google Scholar] [CrossRef]
- Golub, M.S.; Hogrefe, C.E.; Bulleri, A.M. Regulation of emotional response in juvenile monkeys treated with fluoxetine: MAOA interactions. Eur. Neuropsychopharmacol. 2016. [Google Scholar] [CrossRef]
- Hagihara, H.; Ohira, K.; Miyakawa, T. Transcriptomic evidence for immaturity induced by antidepressant fluoxetine in the hippocampus and prefrontal cortex. Neuropsychopharmacol. Rep. 2019. [Google Scholar] [CrossRef]
- Kroeze, Y.; Peeters, D.; Boulle, F.; Van Den Hove, D.L.A.; Van Bokhoven, H.; Zhou, H.; Homberg, J.R. Long-term consequences of chronic fluoxetine exposure on the expression of myelination-related genes in the rat hippocampus. Transl. Psychiatry 2015. [Google Scholar] [CrossRef] [PubMed]
- Klomp, A.; Václavů, L.; Meerhoff, G.F.; Reneman, L.; Lucassen, P.J. Effects of chronic fluoxetine treatment on neurogenesis and tryptophan hydroxylase expression in adolescent and adult rats. PLoS ONE 2014. [Google Scholar] [CrossRef]
- Pan, S.J.; Tan, Y.L.; Yao, S.W.; Xin, Y.; Yang, X.; Liu, J.; Xiong, J. Fluoxetine induces lipid metabolism abnormalities by acting on the liver in patients and mice with depression. Acta Pharmacol. Sin. 2018. [Google Scholar] [CrossRef]
- Golub, M.S.; Hogrefe, C.E.; Campos, L.J.; Fox, A.S. Serotonin Transporter Binding Potentials in Brain of Juvenile Monkeys 1 Year After Discontinuation of a 2-Year Treatment With Fluoxetine. Biol. Psychiatry Cogn. Neurosci. Neuroimaging 2019. [Google Scholar] [CrossRef] [PubMed]
- Golub, M.S.; Hogrefe, C.E.; Sherwood, R.J.; Turck, C.W. Fluoxetine administration in juvenile monkeys: Implications for pharmacotherapy in children. Front. Pediatr. 2018. [Google Scholar] [CrossRef]
- McNamara, R.K.; Able, J.A.; Liu, Y.; Jandacek, R.; Rider, T.; Tso, P.; Lipton, J.W. Omega-3 fatty acid deficiency does not alter the effects of chronic fluoxetine treatment on central serotonin turnover or behavior in the forced swim test in female rats. Pharmacol. Biochem. Behav. 2013. [Google Scholar] [CrossRef]
- McNamara, R.K.; Able, J.A.; Rider, T.; Tso, P.; Jandacek, R. Effect of chronic fluoxetine treatment on male and female rat erythrocyte and prefrontal cortex fatty acid composition. Prog. Neuro-Psychopharmacol. Biol. Psychiatry 2010. [Google Scholar] [CrossRef]
- Champoux, M.; Hibbeln, J.R.; Shannon, C.; Majchrzak, S.; Suomi, S.J.; Salem, N.; Higley, J.D. Fatty acid formula supplementation and neuromotor development in rhesus monkey neonates. Pediatr. Res. 2002. [Google Scholar] [CrossRef] [PubMed]
- Wong, R.Y.; Oxendine, S.E.; Godwin, J. Behavioral and neurogenomic transcriptome changes in wild-derived zebrafish with fluoxetine treatment. BMC Genom. 2013. [Google Scholar] [CrossRef]
- McNamara, R.K. Long-Chain Omega-3 Fatty Acid Deficiency in Mood Disorders: Rationale for Treatment and Prevention. Curr. Drug Discov. Technol. 2013. [Google Scholar] [CrossRef]
- McNamara, R.K.; Jandacek, R.; Rider, T.; Tso, P.; Stanford, K.E.; Hahn, C.G.; Richtand, N.M. Deficits in docosahexaenoic acid and associated elevations in the metabolism of arachidonic acid and saturated fatty acids in the postmortem orbitofrontal cortex of patients with bipolar disorder. Psychiatry Res. 2008. [Google Scholar] [CrossRef] [PubMed]
- McNamara, R.K.; Hahn, C.G.; Jandacek, R.; Rider, T.; Tso, P.; Stanford, K.E.; Richtand, N.M. Selective Deficits in the Omega-3 Fatty Acid Docosahexaenoic Acid in the Postmortem Orbitofrontal Cortex of Patients with Major Depressive Disorder. Biol. Psychiatry 2007. [Google Scholar] [CrossRef] [PubMed]
- McNamara, R.K.; Jandacek, R.; Rider, T.; Tso, P.; Hahn, C.G.; Richtand, N.M.; Stanford, K.E. Abnormalities in the fatty acid composition of the postmortem orbitofrontal cortex of schizophrenic patients: Gender differences and partial normalization with antipsychotic medications. Schizophr. Res. 2007. [Google Scholar] [CrossRef] [PubMed]
- McNamara, R.K.; Jandacek, R.; Tso, P.; Dwivedi, Y.; Ren, X.; Pandey, G.N. Lower docosahexaenoic acid concentrations in the postmortem prefrontal cortex of adult depressed suicide victims compared with controls without cardiovascular disease. J. Psychiatr. Res. 2013. [Google Scholar] [CrossRef] [PubMed]
- Lin, P.Y.; Huang, S.Y.; Su, K.P. A meta-analytic review of polyunsaturated fatty acid compositions in patients with depression. Biol. Psychiatry 2010. [Google Scholar] [CrossRef] [PubMed]
- Thesing, C.S.; Bot, M.; Milaneschi, Y.; Giltay, E.J.; Penninx, B.W.J.H. Omega-3 and omega-6 fatty acid levels in depressive and anxiety disorders. Psychoneuroendocrinology 2018. [Google Scholar] [CrossRef]
- Ganança, L.; Galfalvy, H.C.; Oquendo, M.A.; Hezghia, A.; Cooper, T.B.; Mann, J.J.; Sublette, M.E. Lipid correlates of antidepressant response to omega-3 polyunsaturated fatty acid supplementation: A pilot study. Prostaglandins Leukot. Essent. Fat. Acids 2017. [Google Scholar] [CrossRef]
- Appleton, K.M.; Rogers, P.J.; Ness, A.R. Updated systematic review and meta-analysis of the effects of n-3 long-chain polyunsaturated fatty acids on depressed mood. Am. J. Clin. Nutr. 2010. [Google Scholar] [CrossRef] [PubMed]
- DeMar, J.C.; Ma, K.; Bell, J.M.; Igarashi, M.; Greenstein, D.; Rapoport, S.I. One generation of n-3 polyunsaturated fatty acid deprivation increases depression and aggression test scores in rats. J. Lipid Res. 2006. [Google Scholar] [CrossRef] [PubMed]
- Lafourcade, M.; Larrieu, T.; Mato, S.; Duffaud, A.; Sepers, M.; Matias, I.; De Smedt-Peyrusse, V.; Labrousse, V.F.; Bretillon, L.; Matute, C.; et al. Nutritional omega-3 deficiency abolishes endocannabinoid-mediated neuronal functions. Nat. Neurosci. 2011. [Google Scholar] [CrossRef]
- Able, J.A.; Liu, Y.; Jandacek, R.; Rider, T.; Tso, P.; McNamara, R.K. Omega-3 fatty acid deficient male rats exhibit abnormal behavioral activation in the forced swim test following chronic fluoxetine treatment: Association with altered 5-HT1A and alpha2A adrenergic receptor expression. J. Psychiatr. Res. 2014. [Google Scholar] [CrossRef]
- Martínez, M.; Mougan, I. Fatty Acid Composition of Human Brain Phospholipids During Normal Development. J. Neurochem. 2002. [Google Scholar] [CrossRef] [PubMed]
- Carver, J.D.; Benford, V.J.; Han, B.; Cantor, A.B. The relationship between age and the fatty acid composition of cerebral cortex and erythrocytes in human subjects. Brain Res. Bull. 2001. [Google Scholar] [CrossRef]
- Qi, K.; Hall, M.; Deckelbaum, R.J. Long-chain polyunsaturated fatty acid accretion in brain. Curr. Opin. Clin. Nutr. Metab. Care 2002. [Google Scholar] [CrossRef]
- Bazinet, R.P.; Layé, S. Polyunsaturated fatty acids and their metabolites in brain function and disease. Nat. Rev. Neurosci. 2014. [Google Scholar] [CrossRef] [PubMed]
- Domenichiello, A.F.; Kitson, A.P.; Bazinet, R.P. Is docosahexaenoic acid synthesis from α-linolenic acid sufficient to supply the adult brain? Prog. Lipid Res. 2015. [Google Scholar] [CrossRef] [PubMed]
- Igarashi, M.; Ma, K.; Chang, L.; Bell, J.M.; Rapoport, S.I. Dietary n-3 PUFA deprivation for 15 weeks upregulates elongase and desaturase expression in rat liver but not brain. J. Lipid Res. 2007. [Google Scholar] [CrossRef]
- Scott, B.L.; Bazan, N.G. Membrane docosahexaenoate is supplied to the developing brain and retina by the liver. Proc. Natl. Acad. Sci. USA 1989. [Google Scholar] [CrossRef] [PubMed]
- Rapoport, S.I.; Rao, J.S.; Igarashi, M. Brain metabolism of nutritionally essential polyunsaturated fatty acids depends on both the diet and the liver. Prostaglandins Leukot. Essent. Fat. Acids 2007. [Google Scholar] [CrossRef]
- Inkielewicz-Stêpniak, I. Impact of fluoxetine on liver damage in rats. Pharmacol. Rep. 2011. [Google Scholar] [CrossRef]
- Djordjevic, J.; Djordjevic, A.; Adzic, M.; Elaković, I.; Matić, G.; Radojcic, M.B. Fluoxetine affects antioxidant system and promotes apoptotic signaling in Wistar rat liver. Eur. J. Pharmacol. 2011. [Google Scholar] [CrossRef] [PubMed]
- Feng, X.M.; Xiong, J.; Qin, H.; Liu, W.; Chen, R.N.; Shang, W.; Ning, R.; Hu, G.; Yang, J. Fluoxetine Induces Hepatic Lipid Accumulation Via Both Promotion of the SREBP1c-Related Lipogenesis and Reduction of Lipolysis in Primary Mouse Hepatocytes. CNS Neurosci. Ther. 2012. [Google Scholar] [CrossRef] [PubMed]
- Matsuzaka, T.; Shimano, H.; Yahagi, N.; Amemiya-Kudo, M.; Yoshikawa, T.; Hasty, A.H.; Tamura, Y.; Osuga, J.I.; Okazaki, H.; Iizuka, Y.; et al. Dual regulation of mouse Δ5- and Δ6-desaturase gene expression by SREBP-1 and PPARα. J. Lipid Res. 2002, 43, 107–114. [Google Scholar] [CrossRef]
- Wang, Y.; Botolin, D.; Christian, B.; Busik, J.; Xu, J.; Jump, D.B. Tissue-specific, nutritional, and developmental regulation of rat fatty acid elongases. J. Lipid Res. 2005. [Google Scholar] [CrossRef] [PubMed]
- Jalil, A.; Bourgeois, T.; Ménégaut, L.; Lagrost, L.; Thomas, C.; Masson, D. Revisiting the role of LXRs in PUFA metabolism and phospholipid homeostasis. Int. J. Mol. Sci. 2019. [Google Scholar] [CrossRef] [PubMed]
- Weder, N.; Yang, B.Z.; Douglas-Palumberi, H.; Massey, J.; Krystal, J.H.; Gelernter, J.; Kaufman, J. MAOA Genotype, Maltreatment, and Aggressive Behavior: The Changing Impact of Genotype at Varying Levels of Trauma. Biol. Psychiatry 2009. [Google Scholar] [CrossRef]
- Fergusson, D.M.; Boden, J.M.; Horwood, L.J.; Miller, A.; Kennedy, M.A. Moderating role of the MAOA genotype in antisocial behaviour. Br. J. Psychiatry 2012. [Google Scholar] [CrossRef]
- McDermott, R.; Tingley, D.; Cowden, J.; Frazzetto, G.; Johnson, D.D.P. Monoamine oxidase A gene (MAOA) predicts behavioral aggression following provocation. Proc. Natl. Acad. Sci. USA 2009. [Google Scholar] [CrossRef]
- Newman, T.K.; Syagailo, Y.V.; Barr, C.S.; Wendland, J.R.; Champoux, M.; Graessle, M.; Suomi, S.J.; Higley, J.D.; Lesch, K.P. Monoamine oxidase a gene promoter variation and rearing experience influences aggressive behavior in rhesus monkeys. Biol. Psychiatry 2005. [Google Scholar] [CrossRef]
- Van Dyke, A.M.; Francis, T.C.; Chen, H.; Bailey, A.M.; Thompson, S.M. Chronic fluoxetine treatment in vivo enhances excitatory synaptic transmission in the hippocampus. Neuropharmacology 2019. [Google Scholar] [CrossRef]
- Alme, M.N.; Wibrand, K.; Dagestad, G.; Bramham, C.R. Chronic fluoxetine treatment induces brain region-specific upregulation of genes associated with BDNF-induced long-term potentiation. Neural Plast. 2007. [Google Scholar] [CrossRef]
- Kullyev, A.; Dempsey, C.M.; Miller, S.; Kuan, C.J.; Hapiak, V.M.; Komuniecki, R.W.; Griffin, C.T.; Sze, J.Y. A genetic survey of fluoxetine action on synaptic transmission in Caenorhabditis elegans. Genetics 2010. [Google Scholar] [CrossRef]
- O’Leary, O.F.; Wu, X.; Castren, E. Chronic fluoxetine treatment increases expression of synaptic proteins in the hippocampus of the ovariectomized rat: Role of BDNF signalling. Psychoneuroendocrinology 2009. [Google Scholar] [CrossRef]
- Alboni, S.; Poggini, S.; Garofalo, S.; Milior, G.; El Hajj, H.; Lecours, C.; Girard, I.; Gagnon, S.; Boisjoly-Villeneuve, S.; Brunello, N.; et al. Fluoxetine treatment affects the inflammatory response and microglial function according to the quality of the living environment. Brain. Behav. Immun. 2016. [Google Scholar] [CrossRef] [PubMed]
- Kao, C.Y.; He, Z.; Zannas, A.S.; Hahn, O.; Kühne, C.; Reichel, J.M.; Binder, E.B.; Wotjak, C.T.; Khaitovich, P.; Turck, C.W. Fluoxetine treatment prevents the inflammatory response in a mouse model of posttraumatic stress disorder. J. Psychiatr. Res. 2016. [Google Scholar] [CrossRef]
- Gałecki, P.; Mossakowska-Wójcik, J.; Talarowska, M. The anti-inflammatory mechanism of antidepressants—SSRIs, SNRIs. Prog. Neuro-Psychopharmacol. Biol. Psychiatry 2018. [Google Scholar] [CrossRef]
- Di Rosso, M.E.; Palumbo, M.L.; Genaro, A.M. Immunomodulatory effects of fluoxetine: A new potential pharmacological action for a classic antidepressant drug? Pharmacol. Res. 2016. [Google Scholar] [CrossRef] [PubMed]
- Moriarity, D.P.; Mac Giollabhui, N.; Ellman, L.M.; Klugman, J.; Coe, C.L.; Abramson, L.Y.; Alloy, L.B. Inflammatory Proteins Predict Change in Depressive Symptoms in Male and Female Adolescents. Clin. Psychol. Sci. 2019. [Google Scholar] [CrossRef]
- Khandaker, G.M.; Cousins, L.; Deakin, J.; Lennox, B.R.; Yolken, R.; Jones, P.B. Inflammation and immunity in schizophrenia: Implications for pathophysiology and treatment. Lancet Psychiatry 2015. [Google Scholar] [CrossRef]
- Müller, N.; Weidinger, E.; Leitner, B.; Schwarz, M.J. The role of inflammation in schizophrenia. Front. Neurosci. 2015. [Google Scholar] [CrossRef] [PubMed]
- Bhattacharya, A.; Derecki, N.C.; Lovenberg, T.W.; Drevets, W.C. Role of neuro-immunological factors in the pathophysiology of mood disorders. Psychopharmacology (Berl.) 2016. [Google Scholar] [CrossRef]
- Miller, A.H.; Raison, C.L. The role of inflammation in depression: From evolutionary imperative to modern treatment target. Nat. Rev. Immunol. 2016. [Google Scholar] [CrossRef] [PubMed]
- Kohler, O.; Krogh, J.; Mors, O.; Eriksen Benros, M. Inflammation in Depression and the Potential for Anti-Inflammatory Treatment. Curr. Neuropharmacol. 2016. [Google Scholar] [CrossRef]
- Stapel, B.; Sieve, I.; Falk, C.S.; Bleich, S.; Hilfiker-Kleiner, D.; Kahl, K.G. Second generation atypical antipsychotics olanzapine and aripiprazole reduce expression and secretion of inflammatory cytokines in human immune cells. J. Psychiatr. Res. 2018. [Google Scholar] [CrossRef] [PubMed]
- Kang, H.J.; Voleti, B.; Hajszan, T.; Rajkowska, G.; Stockmeier, C.A.; Licznerski, P.; Lepack, A.; Majik, M.S.; Jeong, L.S.; Banasr, M.; et al. Decreased expression of synapse-related genes and loss of synapses in major depressive disorder. Nat. Med. 2012. [Google Scholar] [CrossRef]
- Duric, V.; Banasr, M.; Stockmeier, C.A.; Simen, A.A.; Newton, S.S.; Overholser, J.C.; Jurjus, G.J.; Dieter, L.; Duman, R.S. Altered expression of synapse and glutamate related genes in post-mortem hippocampus of depressed subjects. Int. J. Neuropsychopharmacol. 2013. [Google Scholar] [CrossRef] [PubMed]
- Osimo, E.F.; Beck, K.; Reis Marques, T.; Howes, O.D. Synaptic loss in schizophrenia: A meta-analysis and systematic review of synaptic protein and mRNA measures. Mol. Psychiatry 2019. [Google Scholar] [CrossRef] [PubMed]
- Golub, M.S.; Hogrefe, C.E. Fluoxetine: Juvenile pharmacokinetics in a nonhuman primate model. Psychopharmacology (Berl.) 2014. [Google Scholar] [CrossRef]
- Anderson, G.M. Peripheral and central neurochemical effects of the selective serotonin reuptake inhibitors (SSRIs) in humans and nonhuman primates: Assessing bioeffect and mechanisms of action. Int. J. Dev. Neurosci. 2004. [Google Scholar] [CrossRef] [PubMed]
- Clarke, A.S.; Ebert, M.H.; Schmidt, D.E.; McKinney, W.T.; Kraemer, G.W. Biogenic amine activity in response to fluoxetine and desipramine in differentially reared rhesus monkeys. Biol. Psychiatry 1999. [Google Scholar] [CrossRef]
- Clarke, A.S.; Kraemer, G.W.; Kupfer, D.J. Effects of rearing condition on HPA axis response to fluoxetine and desipramine treatment over repeated social separations in young rhesus monkeys. Psychiatry Res. 1998. [Google Scholar] [CrossRef]
- Fontenot, M.B.; Musso, M.W.; McFatter, R.M.; Anderson, G.M. Dose-finding study of fluoxetine and venlafaxine for the treatment of self- injurious and stereotypic behavior in rhesus macaques (Macaca mulatto). J. Am. Assoc. Lab. Anim. Sci. 2009, 48, 176–184. [Google Scholar]
- Fontenot, M.B.; Padgett, E.E.; Dupuy, A.M.; Lynch, C.R.; De Petrillo, P.B.; Higley, J.D. The effects of flouxetine and buspirone on self-injurious and stereotypic behavior in adult male rhesus macaques. Comp. Med. 2005, 55, 67–74. [Google Scholar] [PubMed]
- Sawyer, E.K.; Howell, L.L. Pharmacokinetics of fluoxetine in rhesus macaques following multiple routes of administration. Pharmacology 2011. [Google Scholar] [CrossRef] [PubMed]
- Paxinos, G.; Huang, X.F.; Toga, A.W. The Rhesus Monkey Brain in Stereotaxic Coordinates; Academic Press: San Diego, CA, USA, 1999. [Google Scholar]
- Challis, C.; Berton, O. Top-Down Control of Serotonin Systems by the Prefrontal Cortex: A Path toward Restored Socioemotional Function in Depression. ACS Chem. Neurosci. 2015. [Google Scholar] [CrossRef]
- Ulmer, C.Z.; Koelmel, J.P.; Jones, C.M.; Garrett, T.J.; Aristizabal-Henao, J.J.; Vesper, H.W.; Bowden, J.A. A Review of Efforts to Improve Lipid Stability during Sample Preparation and Standardization Efforts to Ensure Accuracy in the Reporting of Lipid Measurements. Lipids 2021. [Google Scholar] [CrossRef]
- Durinck, S.; Spellman, P.T.; Birney, E.; Huber, W. Mapping identifiers for the integration of genomic datasets with the R/ Bioconductor package biomaRt. Nat. Protoc. 2009. [Google Scholar] [CrossRef] [PubMed]
- Yu, G.; Wang, L.G.; Han, Y.; He, Q.Y. ClusterProfiler: An R package for comparing biological themes among gene clusters. Omics J. Integr. Biol. 2012. [Google Scholar] [CrossRef]
- Carlson, M. org.Mmu.eg.db: Genome Wide Annotation for Rhesus 2019. Available online: https://bioconductor.org/packages/org.Mmu.eg.db/ (accessed on 22 June 2021).
- Kanehisa, M.; Goto, S. KEGG: Kyoto encyclopedia of genes and genomes—Release 72.1, December 1, 2014. Nucleic Acids Res. 2000, 28, 27–30. [Google Scholar] [CrossRef] [PubMed]
- Sud, M.; Fahy, E.; Cotter, D.; Brown, A.; Dennis, E.A.; Glass, C.K.; Merrill, A.H.; Murphy, R.C.; Raetz, C.R.H.; Russell, D.W.; et al. LMSD: LIPID MAPS structure database. Nucleic Acids Res. 2007, 35, D527–D532. [Google Scholar] [CrossRef]
- Witting, M.; Maier, T.V.; Garvis, S.; Schmitt-Kopplin, P. Optimizing a ultrahigh pressure liquid chromatography-time of flight-mass spectrometry approach using a novel sub-2μm core-shell particle for in depth lipidomic profiling of Caenorhabditis elegans. J. Chromatogr. A 2014. [Google Scholar] [CrossRef] [PubMed]
- Smith, C.A.; Want, E.J.; O’Maille, G.; Abagyan, R.; Siuzdak, G. XCMS: Processing mass spectrometry data for metabolite profiling using nonlinear peak alignment, matching, and identification. Anal. Chem. 2006. [Google Scholar] [CrossRef]
- Ni, Z.; Angelidou, G.; Lange, M.; Hoffmann, R.; Fedorova, M. LipidHunter Identifies Phospholipids by High-Throughput Processing of LC-MS and Shotgun Lipidomics Datasets. Anal. Chem. 2017. [Google Scholar] [CrossRef] [PubMed]
- Sergushichev, A.A. An algorithm for fast preranked gene set enrichment analysis using cumulative statistic calculation. bioRxiv 2016. [Google Scholar] [CrossRef]
- Chong, J.; Xia, J. MetaboAnalystR: An R package for flexible and reproducible analysis of metabolomics data. Bioinformatics 2018. [Google Scholar] [CrossRef]


Publisher’s Note: MDPI stays neutral with regard to jurisdictional claims in published maps and institutional affiliations. |
© 2021 by the authors. Licensee MDPI, Basel, Switzerland. This article is an open access article distributed under the terms and conditions of the Creative Commons Attribution (CC BY) license (https://creativecommons.org/licenses/by/4.0/).
Share and Cite
Tkachev, A.; Stekolshchikova, E.; Bobrovskiy, D.M.; Anikanov, N.; Ogurtsova, P.; Park, D.I.; Horn, A.K.E.; Petrova, D.; Khrameeva, E.; Golub, M.S.; et al. Long-Term Fluoxetine Administration Causes Substantial Lipidome Alteration of the Juvenile Macaque Brain. Int. J. Mol. Sci. 2021, 22, 8089. https://doi.org/10.3390/ijms22158089
Tkachev A, Stekolshchikova E, Bobrovskiy DM, Anikanov N, Ogurtsova P, Park DI, Horn AKE, Petrova D, Khrameeva E, Golub MS, et al. Long-Term Fluoxetine Administration Causes Substantial Lipidome Alteration of the Juvenile Macaque Brain. International Journal of Molecular Sciences. 2021; 22(15):8089. https://doi.org/10.3390/ijms22158089
Chicago/Turabian StyleTkachev, Anna, Elena Stekolshchikova, Daniil M. Bobrovskiy, Nickolay Anikanov, Polina Ogurtsova, Dong Ik Park, Anja K. E. Horn, Daria Petrova, Ekaterina Khrameeva, Mari S. Golub, and et al. 2021. "Long-Term Fluoxetine Administration Causes Substantial Lipidome Alteration of the Juvenile Macaque Brain" International Journal of Molecular Sciences 22, no. 15: 8089. https://doi.org/10.3390/ijms22158089
APA StyleTkachev, A., Stekolshchikova, E., Bobrovskiy, D. M., Anikanov, N., Ogurtsova, P., Park, D. I., Horn, A. K. E., Petrova, D., Khrameeva, E., Golub, M. S., Turck, C. W., & Khaitovich, P. (2021). Long-Term Fluoxetine Administration Causes Substantial Lipidome Alteration of the Juvenile Macaque Brain. International Journal of Molecular Sciences, 22(15), 8089. https://doi.org/10.3390/ijms22158089