Article

Fatty Acid Amide Hydrolase (FAAH) Inhibition Modulates Amyloid-Beta-Induced Microglia Polarization

1
Department of Biochemical Sciences, Sapienza University of Rome, Piazzale Aldo Moro 5, 00185 Rome, Italy
2
Department of Experimental Medicine, Sapienza University of Rome, Viale Regina Elena 324, 00161 Rome, Italy
3
Department of Medico-Surgical Sciences and Biotechnologies, Sapienza University of Rome, Corso della Repubblica 79, 04100 Latina, Italy
4
Fondazione Santa Lucia IRCCS, Preclinical Neuroscience, Via del Fosso di Fiorano 64, 00143 Rome, Italy
5
Institute for Complex Systems (ISC), C.N.R., Via dei Taurini 19, 00185 Rome, Italy
6
Endocannabinoid Research Group, Institute of Translational Pharmacology, CNR, Via Fosso del Cavaliere 100, 00133 Rome, Italy
7
Department of Biotechnological and Applied Clinical Sciences, University of L’Aquila, Via Vetoio snc, 67100 L’Aquila, Italy
8
European Center for Brain Research/Santa Lucia Foundation IRCCS, Via del Fosso di Fiorano 64, 00143 Rome, Italy
*
Authors to whom correspondence should be addressed.
Equally senior authors.
Int. J. Mol. Sci. 2021, 22(14), 7711; https://doi.org/10.3390/ijms22147711
Submission received: 7 May 2021 / Revised: 28 June 2021 / Accepted: 29 June 2021 / Published: 19 July 2021
(This article belongs to the Special Issue Microglia Heterogeneity and Its Relevance for Translational Research)

Abstract

:
The ability of endocannabinoid (eCB) to change functional microglial phenotype can be explored as a possible target for therapeutic intervention. Since the inhibition of fatty acid amide hydrolase (FAAH), the main catabolic enzyme of anandamide (AEA), may provide beneficial effects in mice model of Alzheimer’s disease (AD)-like pathology, we aimed at determining whether the FAAH inhibitor URB597 might target microglia polarization and alter the cytoskeleton reorganization induced by the amyloid-β peptide (Aβ). The morphological evaluation showed that Aβ treatment increased the surface area of BV-2 cells, which acquired a flat and polygonal morphology. URB597 treatment partially rescued the control phenotype of BV-2 cells when co-incubated with Aβ. Moreover, URB597 reduced both the increase of Rho protein activation in Aβ-treated BV-2 cells and the Aβ-induced migration of BV-2 cells, while an increase of Cdc42 protein activation was observed in all samples. URB597 also increased the number of BV-2 cells involved in phagocytosis. URB597 treatment induced the polarization of microglial cells towards an anti-inflammatory phenotype, as demonstrated by the decreased expression of iNOS and pro-inflammatory cytokines along with the parallel increase of Arg-1 and anti-inflammatory cytokines. Taken together, these data suggest that FAAH inhibition promotes cytoskeleton reorganization, regulates phagocytosis and cell migration processes, thus driving microglial polarization towards an anti-inflammatory phenotype.

Graphical Abstract

1. Introduction

Alzheimer’s disease (AD) is a neurodegenerative disorder characterized by the progressive and inescapable cognitive deterioration, whose main neuropathological hallmarks are the formation of intracellular neurofibrillary tangles and extracellular senile plaques, producing synaptic dysfunction, and ultimately, neural death. While neurofibrillary tangles are composed of hyperphosphorylated tau protein, senile plaques are associated with neurotoxicity and are formed by aggregates of the β-amyloid peptide (Aβ), stemming from the misprocessing of the Amyloid Precursor Protein (APP) [1,2,3]. To date, the molecular mechanisms underlying AD are not completely understood. McGeer and Eikelenboom (1994) were the first to clearly identify the inflammatory component in AD, as recently confirmed by Shippy et al. (2020) [4,5,6]. Indeed, several authors pointed out the ability of Aβ aggregates to activate the microglial cells, thus inducing the release of inflammatory mediators such as ROS, nitric oxide, and interleukins, all responsible for neuronal death [7,8,9,10]. Moreover, the postmortem examination of Alzheimer’s patients has confirmed the incidence of high levels of pro-inflammatory cytokines, chemokines, and inflammation mediators [11].
Microglial cells play a central role in maintaining brain homeostasis and are involved in resolving inflammation from trauma or infectious microorganisms by means of phagocytosis and/or anti-inflammatory mediators. However, while the initial inflammatory response can be neuroprotective for the brain, the persistence of a challenging stimulation and the resultant strong microglia activation may turn the first line of defense (e.g., released cytokines) into detrimental and auto-toxic reactions that lead to synaptic dysfunction and neuronal cell death.
To date, no drugs used in anti-AD therapy seem to improve the prognosis. Indeed, the current therapeutic strategies are aimed at symptoms alleviation or the slowing down of disease progression. Hence, there is the need to introduce innovative drugs capable of interfering with the pathophysiological mechanisms underlying AD. In this scenario, growing interest has been focused on the endocannabinoid (eCB) system that is viewed as a pro-homeostatic and pleiotropic signaling system activated as an adaptive response to multiple pathological conditions [12,13]. The eCB system consists of cannabinoid type-1 (CB1) and type-2 (CB2) receptors, endogenous lipid ligands such as N-arachidonoylethanolamine (AEA) and 2-Arachidonoyglicerol (2-AG), as well as proteins and enzymes involved in their biosynthesis and inactivation. The eCB system is also considered as part of a mechanism that may operate morphological [14], phenotypic, and functional changes of microglia and counteract the neuroinflammatory processes occurring in neurodegenerative diseases [15,16].
Studies performed both in vitro and in vivo have highlighted CB1-2 receptor-mediated inhibition of Aβ-induced neurotoxicity, gliosis, neuroinflammation, and memory deficits [17,18,19]. Moreover, the pharmacological activation of CB1 and/or CB2 receptors improves memory and/or cognitive impairments in both AD-like transgenic and pharmacological (e.g., via intracerebral Aβ infusion) mice models [18,20,21]. In addition, the increased expression of CB2 levels in astrocytes- and microglia-associated neuritic plaques strongly suggest a CB2-mediated neuroprotective effect via the stimulation of microglial proliferation and migration [18,22].
In the past few years, several lines of evidence have suggested that eCB degradative enzymes could be a target for the development of anti-AD therapeutic options. Both the expression and activity of fatty acid amide hydrolase (FAAH), the enzyme responsible for AEA degradation, are increased in astrocytes and microglia-associated neuritic plaque from post-mortem AD patients’ brains [17]. A reduction of AEA levels was also reported in the midfrontal and temporal cortex, where AEA levels inversely correlated with Aβ1-42 content [23]. Furthermore, the pharmacological modulation or genetic ablation of FAAH exerted different beneficial effects in terms of Aβ accumulation, neuroinflammation, and cognitive decline [24,25,26]. Recently, Tanaka et al., (2019) reported that the pharmacological inhibition or ablation of FAAH in BV-2 microglia cells reduced the LPS-induced release of inflammatory mediators and pro-inflammatory cytokines, and siRNA FAAH BV-2-transfected cells led to the reduced expression of pro-inflammatory genes. These findings suggest that genetic suppression and/or pharmacological inhibition of FAAH might modulate microglial phenotypes and produce anti-inflammatory effects via different mechanisms [27].
Taken together, these studies prompted us to investigate the effects produced by FAAH inactivation on microglial inflammatory processes. From among the different FAAH inhibitors developed so far, we selected the 3-(3-carbamoylphenyl)-phenyl N-cyclohexylcarbamate (URB597), as it is one of the best known compounds with a high affinity to FAAH. Hence, we assessed URB597 efficacy in terms of its ability to modulate morphological and functional changes in Aβ25–35-induced microglial activation in BV-2 cells. Our results show that URB597 treatment exerts a potent anti-inflammatory action by inhibiting BV-2 cell microglial polarization, by promoting cytoskeleton reorganization via cell migration and phagocytosis processes as well as by modulating the expression of pro- and anti-inflammatory markers.

2. Results

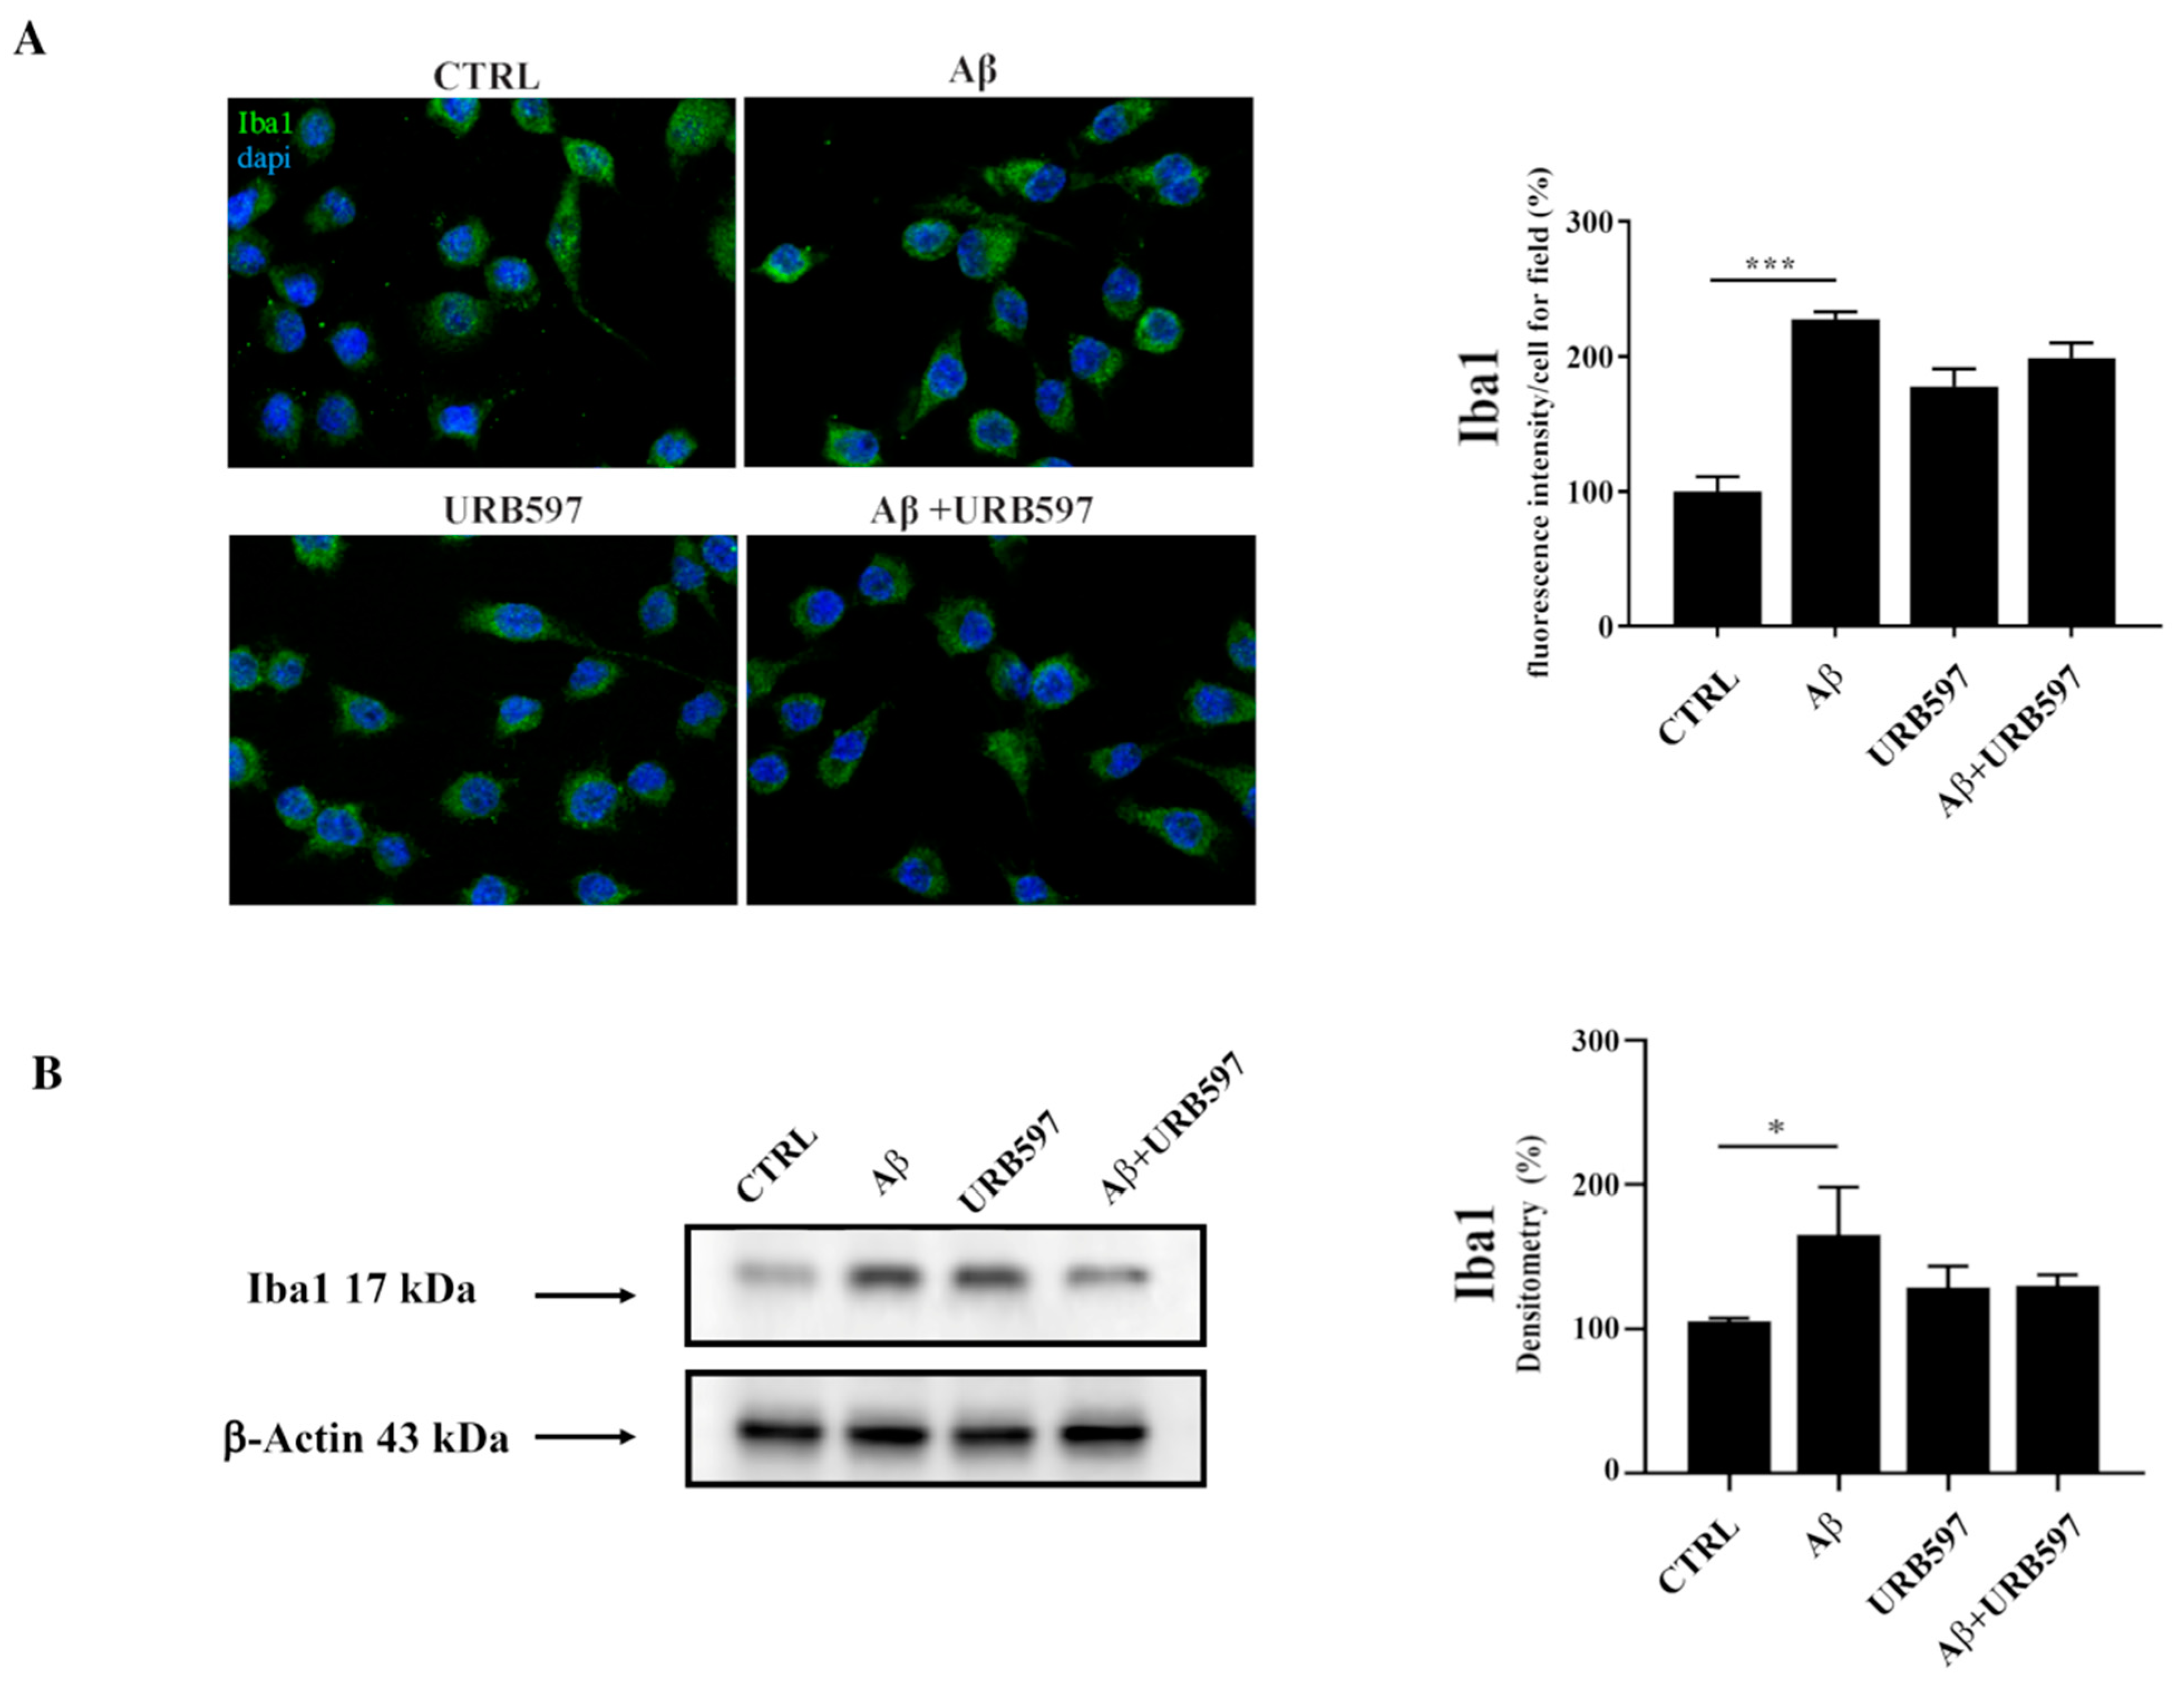
2.1. Aβ25–35 Induces Upregulation of the Iba1 Microglia Marker

Since Iba1 is a selective marker of microglial activation following nerve injury, central nervous system ischemia, inflammatory conditions, and several other forms of brain damage, we assessed whether Aβ25–35 could induce microglia activation by immunofluorescence and western blot analyses [28,29]. We observed an upregulation of Iba1 in BV-2 cells treated with 30 µM of Aβ25–35 for 24 h, thus confirming microglial activation. URB is able to decrease Aβ25–35-induced microglia overactivation (Figure 1).

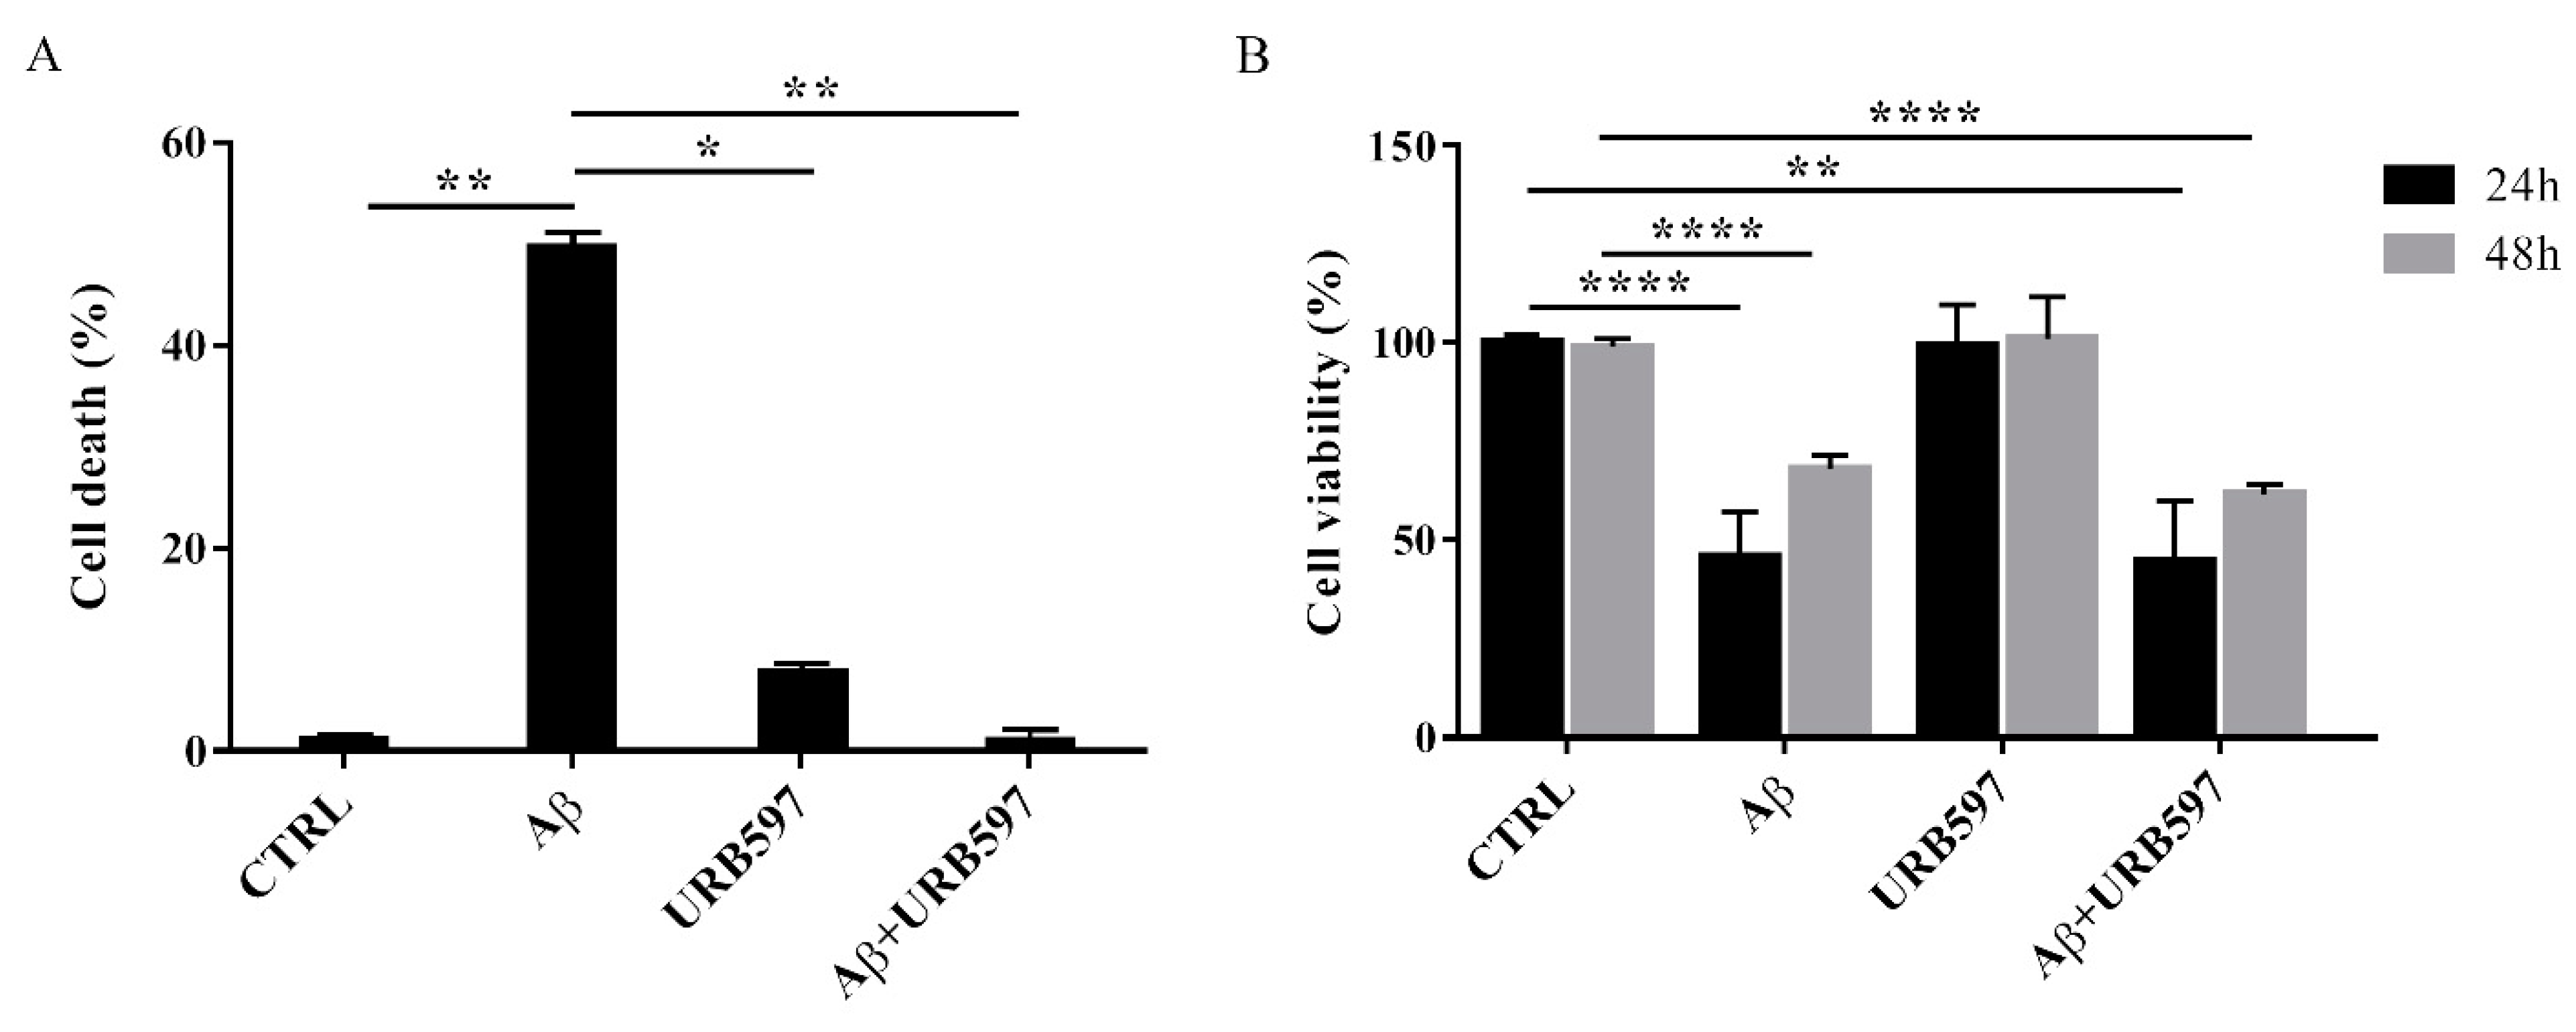
2.2. URB597 on BV-2 Cell Viability

To determine the effect of Aβ25–35 in the presence or absence of URB597 on BV-2 cell viability, the Trypan blue assay and MTT analysis were performed. We selected 5 µM of URB597 concentration based on the dose-response curves on BV-2 cells (data not shown). Microglia cells were pre-treated with 5 μM URB597 and incubated with 30 μM Aβ25–35 for 24 h. Figure 2A shows a significant increase of cell death in the presence of Aβ25–35 as compared to control cells, whereas URB597 reversed Aβ25–35-induced cell death. URB597 alone had no effect.
In addition, we performed an MTT assay using cells treated as described above. The data obtained show that Aβ25–35 induced a decrease in cell viability by around 40% at 24 h, while a slight proliferative effect of Aβ25–35 was observed at 48 h. Treatment with URB597 alone did not interfere with cell survival and did not prevent Aβ25–35 challenge at the mitochondrial level (Figure 2B).

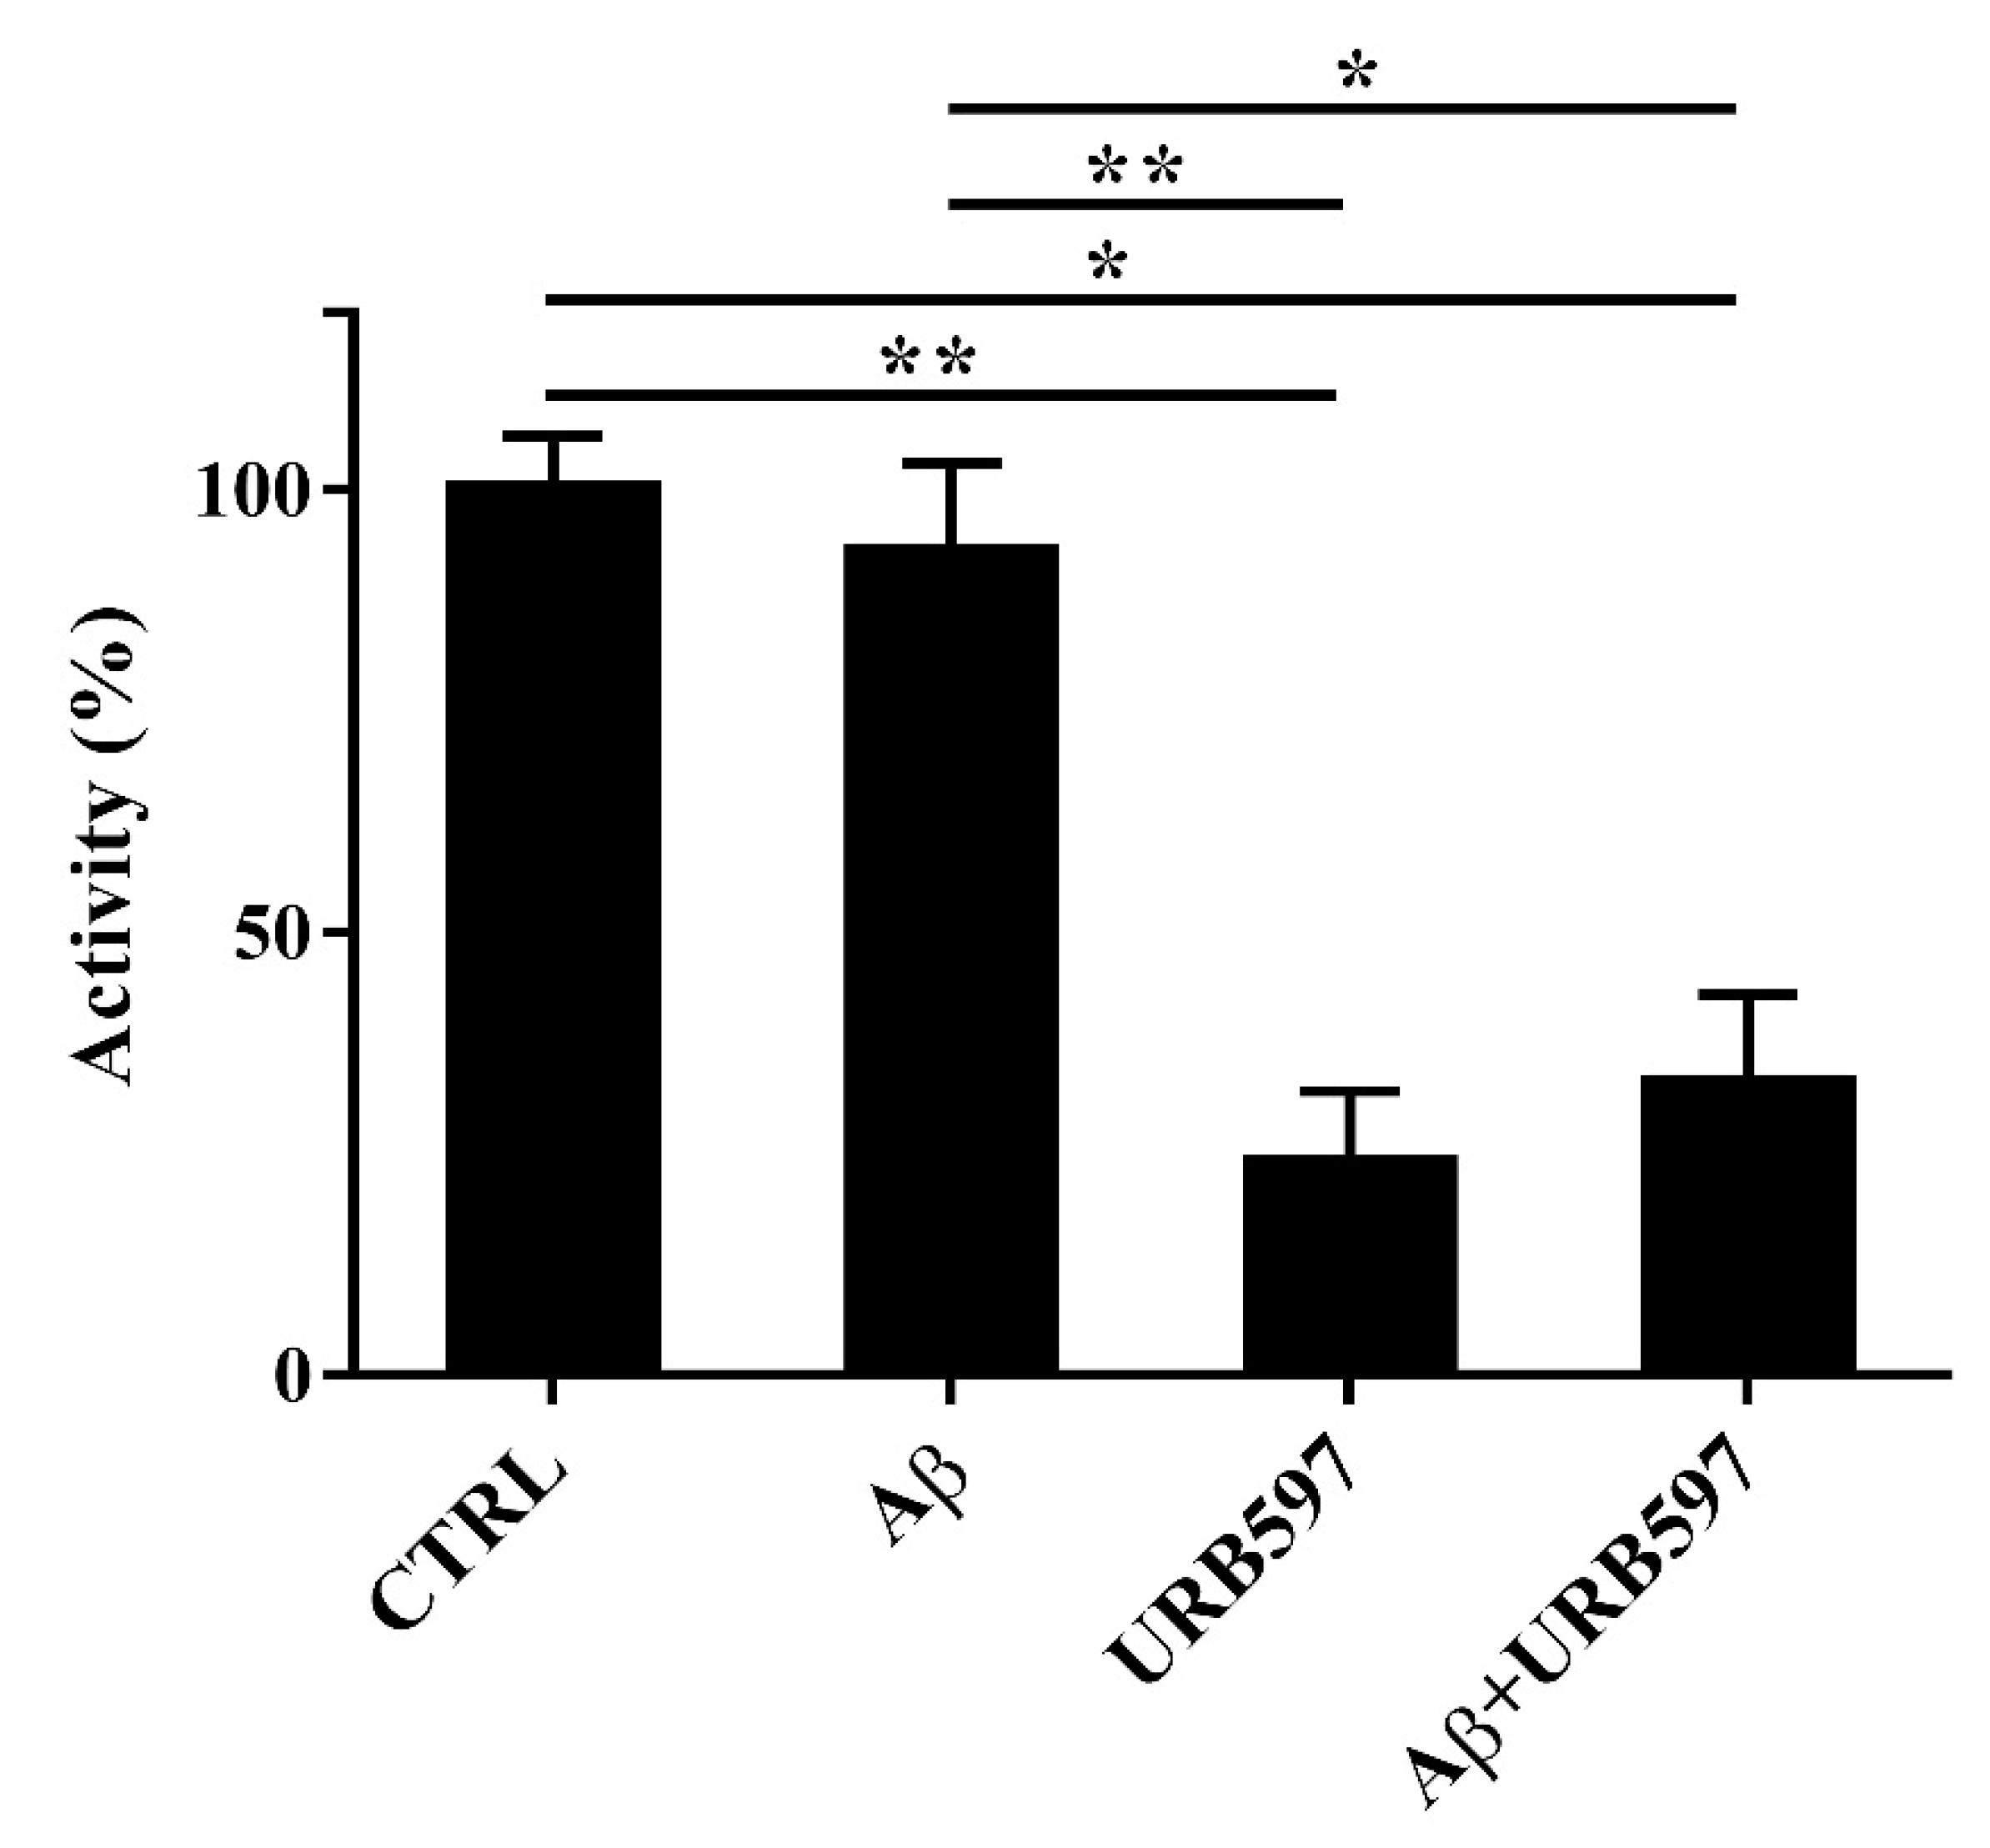
2.3. Aβ25–35 and URB597 Effects on FAAH Enzyme Activity

Since FAAH is a selective eCB-degrading enzyme, we investigated whether Aβ25–35 and URB597 might modulate its activity. For this purpose, BV-2 cells were pre-treated with 5 μM URB597 for 4 h and incubated with 30 μM Aβ25–35 for 24 h. Notably, Aβ25–35 induces neurotoxicity and neuroinflammation, comparable to a full-length Aβ1-42 peptide [30].
25–35 did not have any significant effect on FAAH activity at 24 h (Figure 3). URB597 was also able to inhibit FAAH activity in the presence of Aβ25–35.

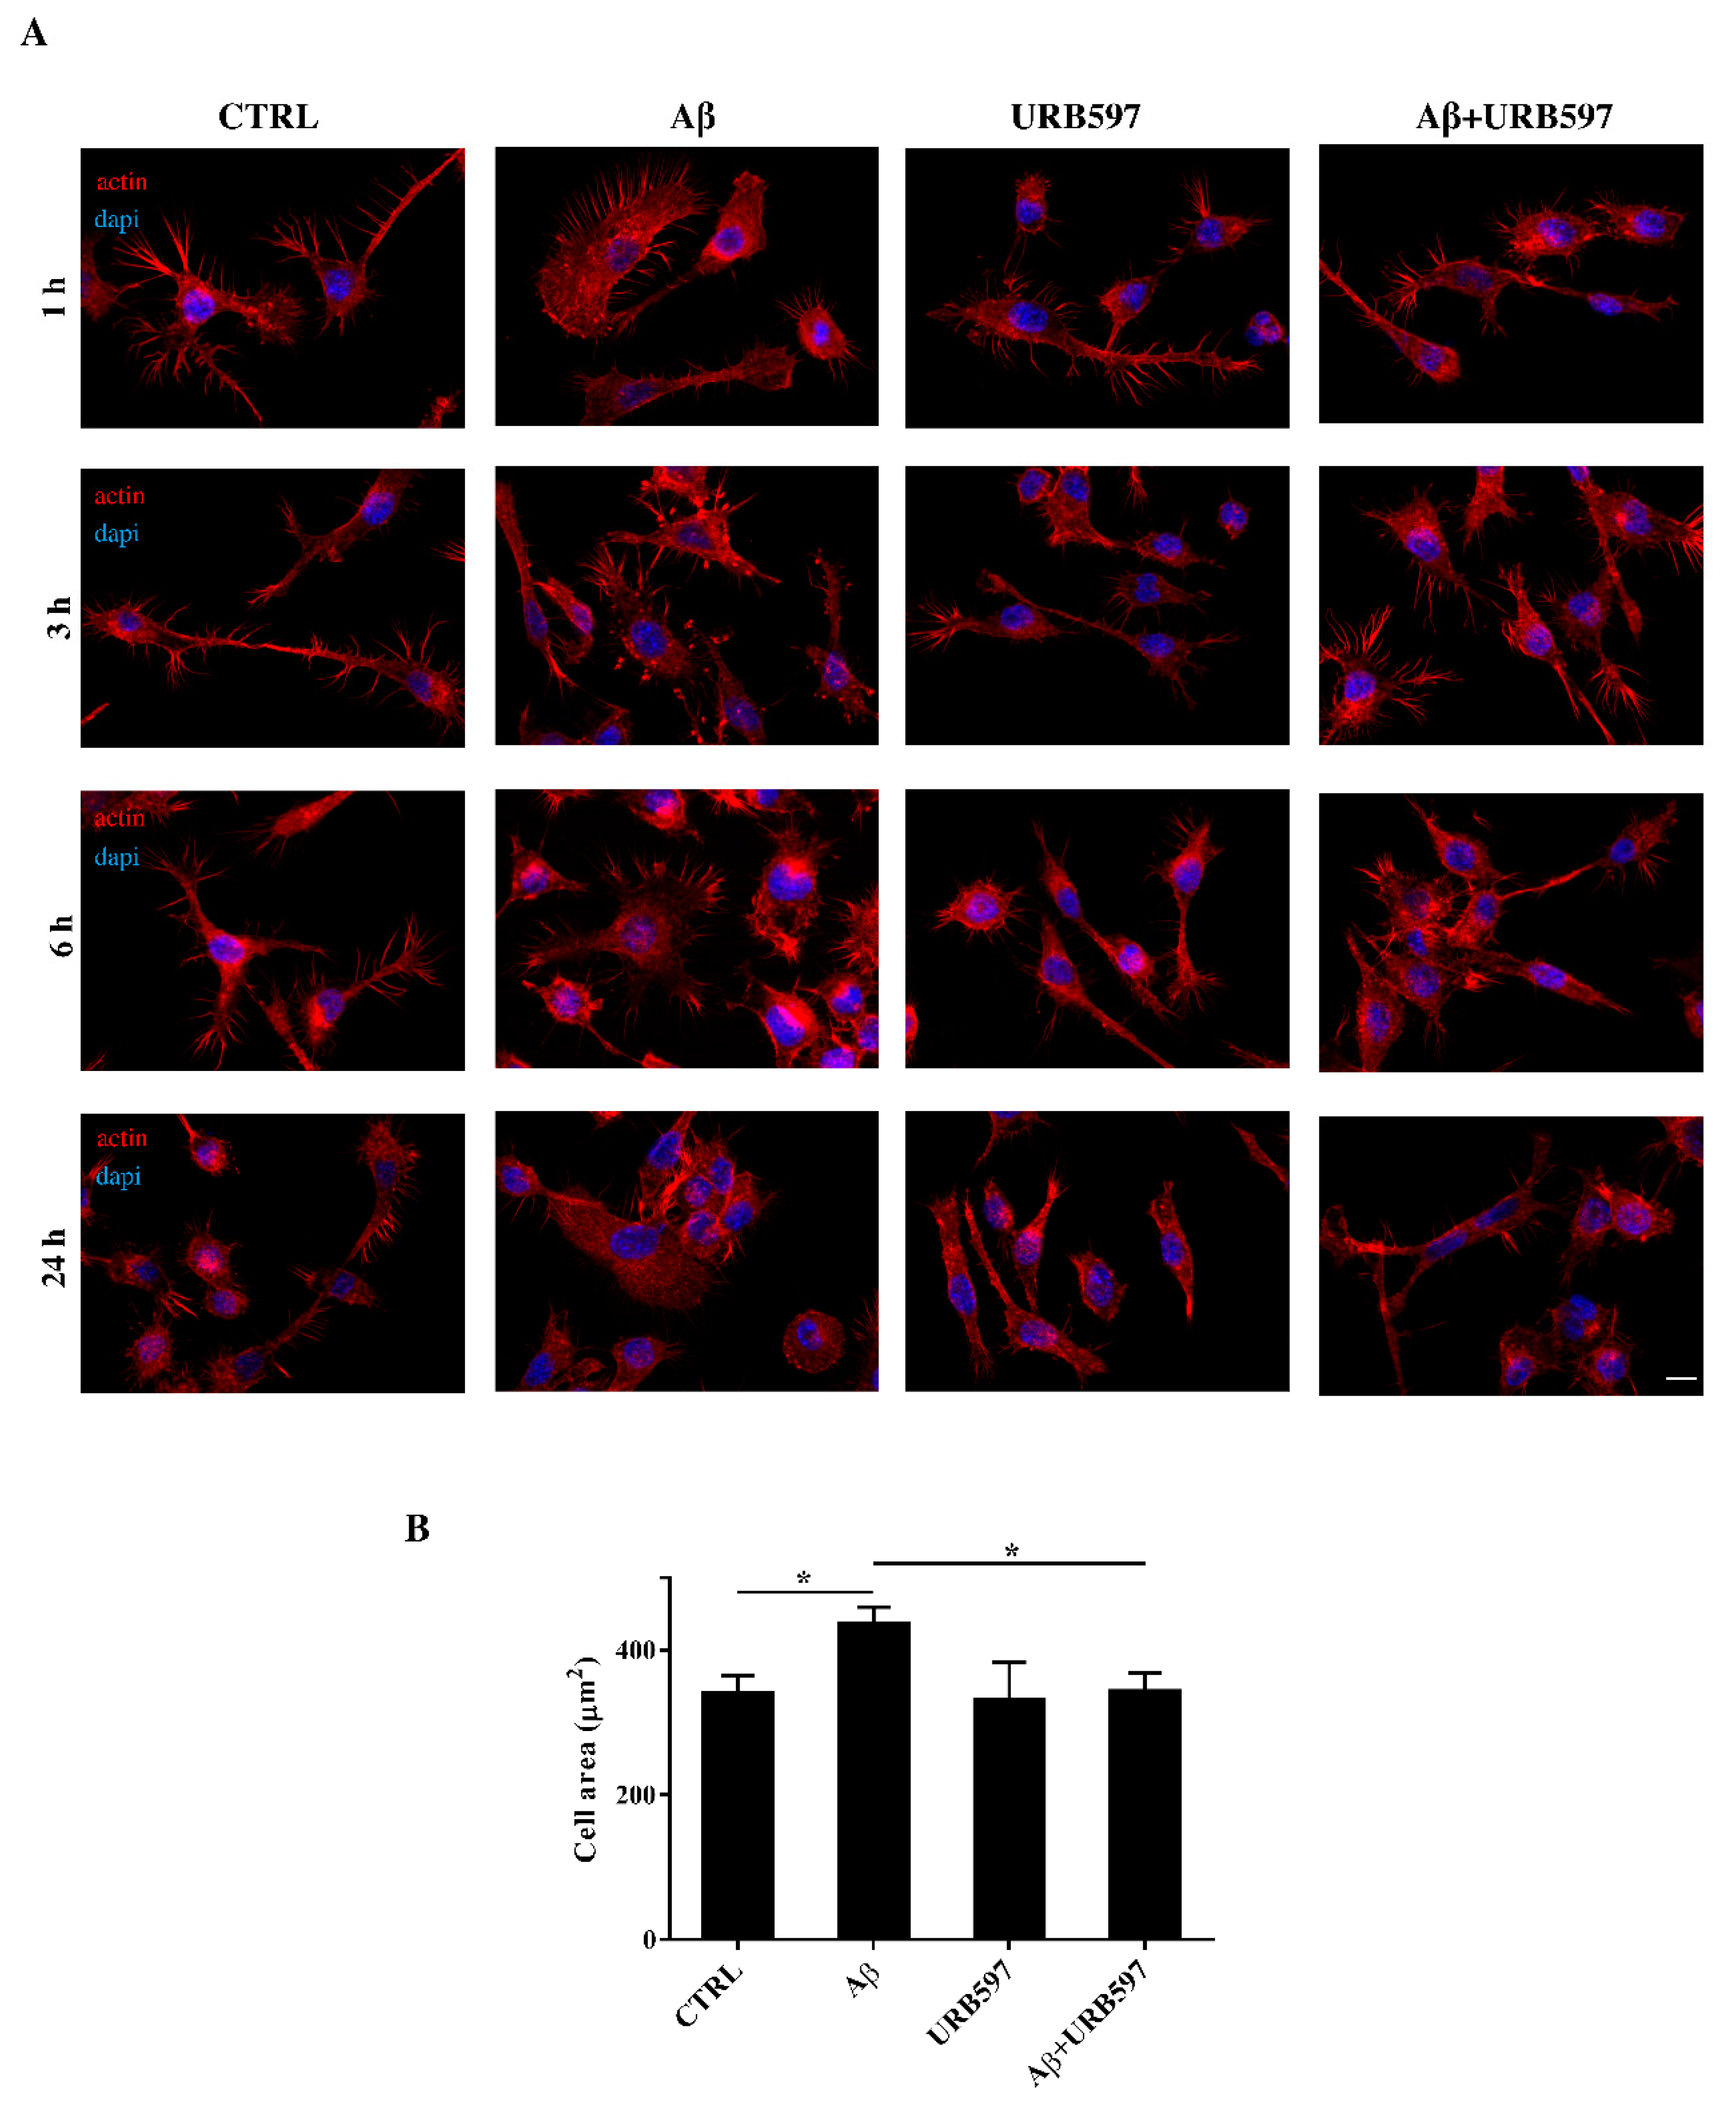
2.4. URB597 Reverts Morphological Changes Induced by Aβ25–35

Microglia rapidly responds to brain injury and disease by altering its morphology and adjusting its phenotype towards an activated state. In the activated state, microglia shifts from its resting form to an ameboid form (M1/M2) [31]. Cells increase their surface area and acquire a flat morphology. To evaluate the effects of FAAH inhibition on cell morphology, we performed an immunofluorescence analysis through the phalloidin staining of F-actin on BV-2 cells pre-treated with 5 μM of URB597 for 4 h and incubated with 30 μM of Aβ25–35 (Figure 4). Cell morphology was analyzed at different time points (1 h, 3 h, 6 h, 24 h).
The results show that control cells exhibited a very small cell body. They had long cell ramifications and actin was organized predominantly in the filopodia, used by the cells to explore the surrounding environment. At all time-points analyzed, cells treated with Aβ25–35 increased their surface area, acquiring a flat and polygonal morphology. Furthermore, cells retracted the branched processes that is typical of microglia in its resting form. On the other hand, cells treated with URB597 had a more rounded morphology, characterized by the shrinkage of the cellular body and the presence of several cellular processes. BV-2 cells co-treated with URB597 and Aβ25–35, showed a phenotype similar to that obtained with only URB597 (Figure 4A). These results were also confirmed by the quantitative analysis carried out by measuring the cellular area expressed in μm2 at 24 h. The quantitative analysis confirmed that the treatment with URB597 alone produced surface areas similar to those of control cells, while after stimulation with Aβ25–35 the cells underwent an enlargement of their soma. The cell had an area of 440 μm2 while the control sample was at 340 μm2. In the combined treatment, URB597 reduced the area to values comparable to those of controls, indicating the capacity of URB597 to restore the amoeboid phenotype observed in the presence of Aβ25–35 (Figure 4B).

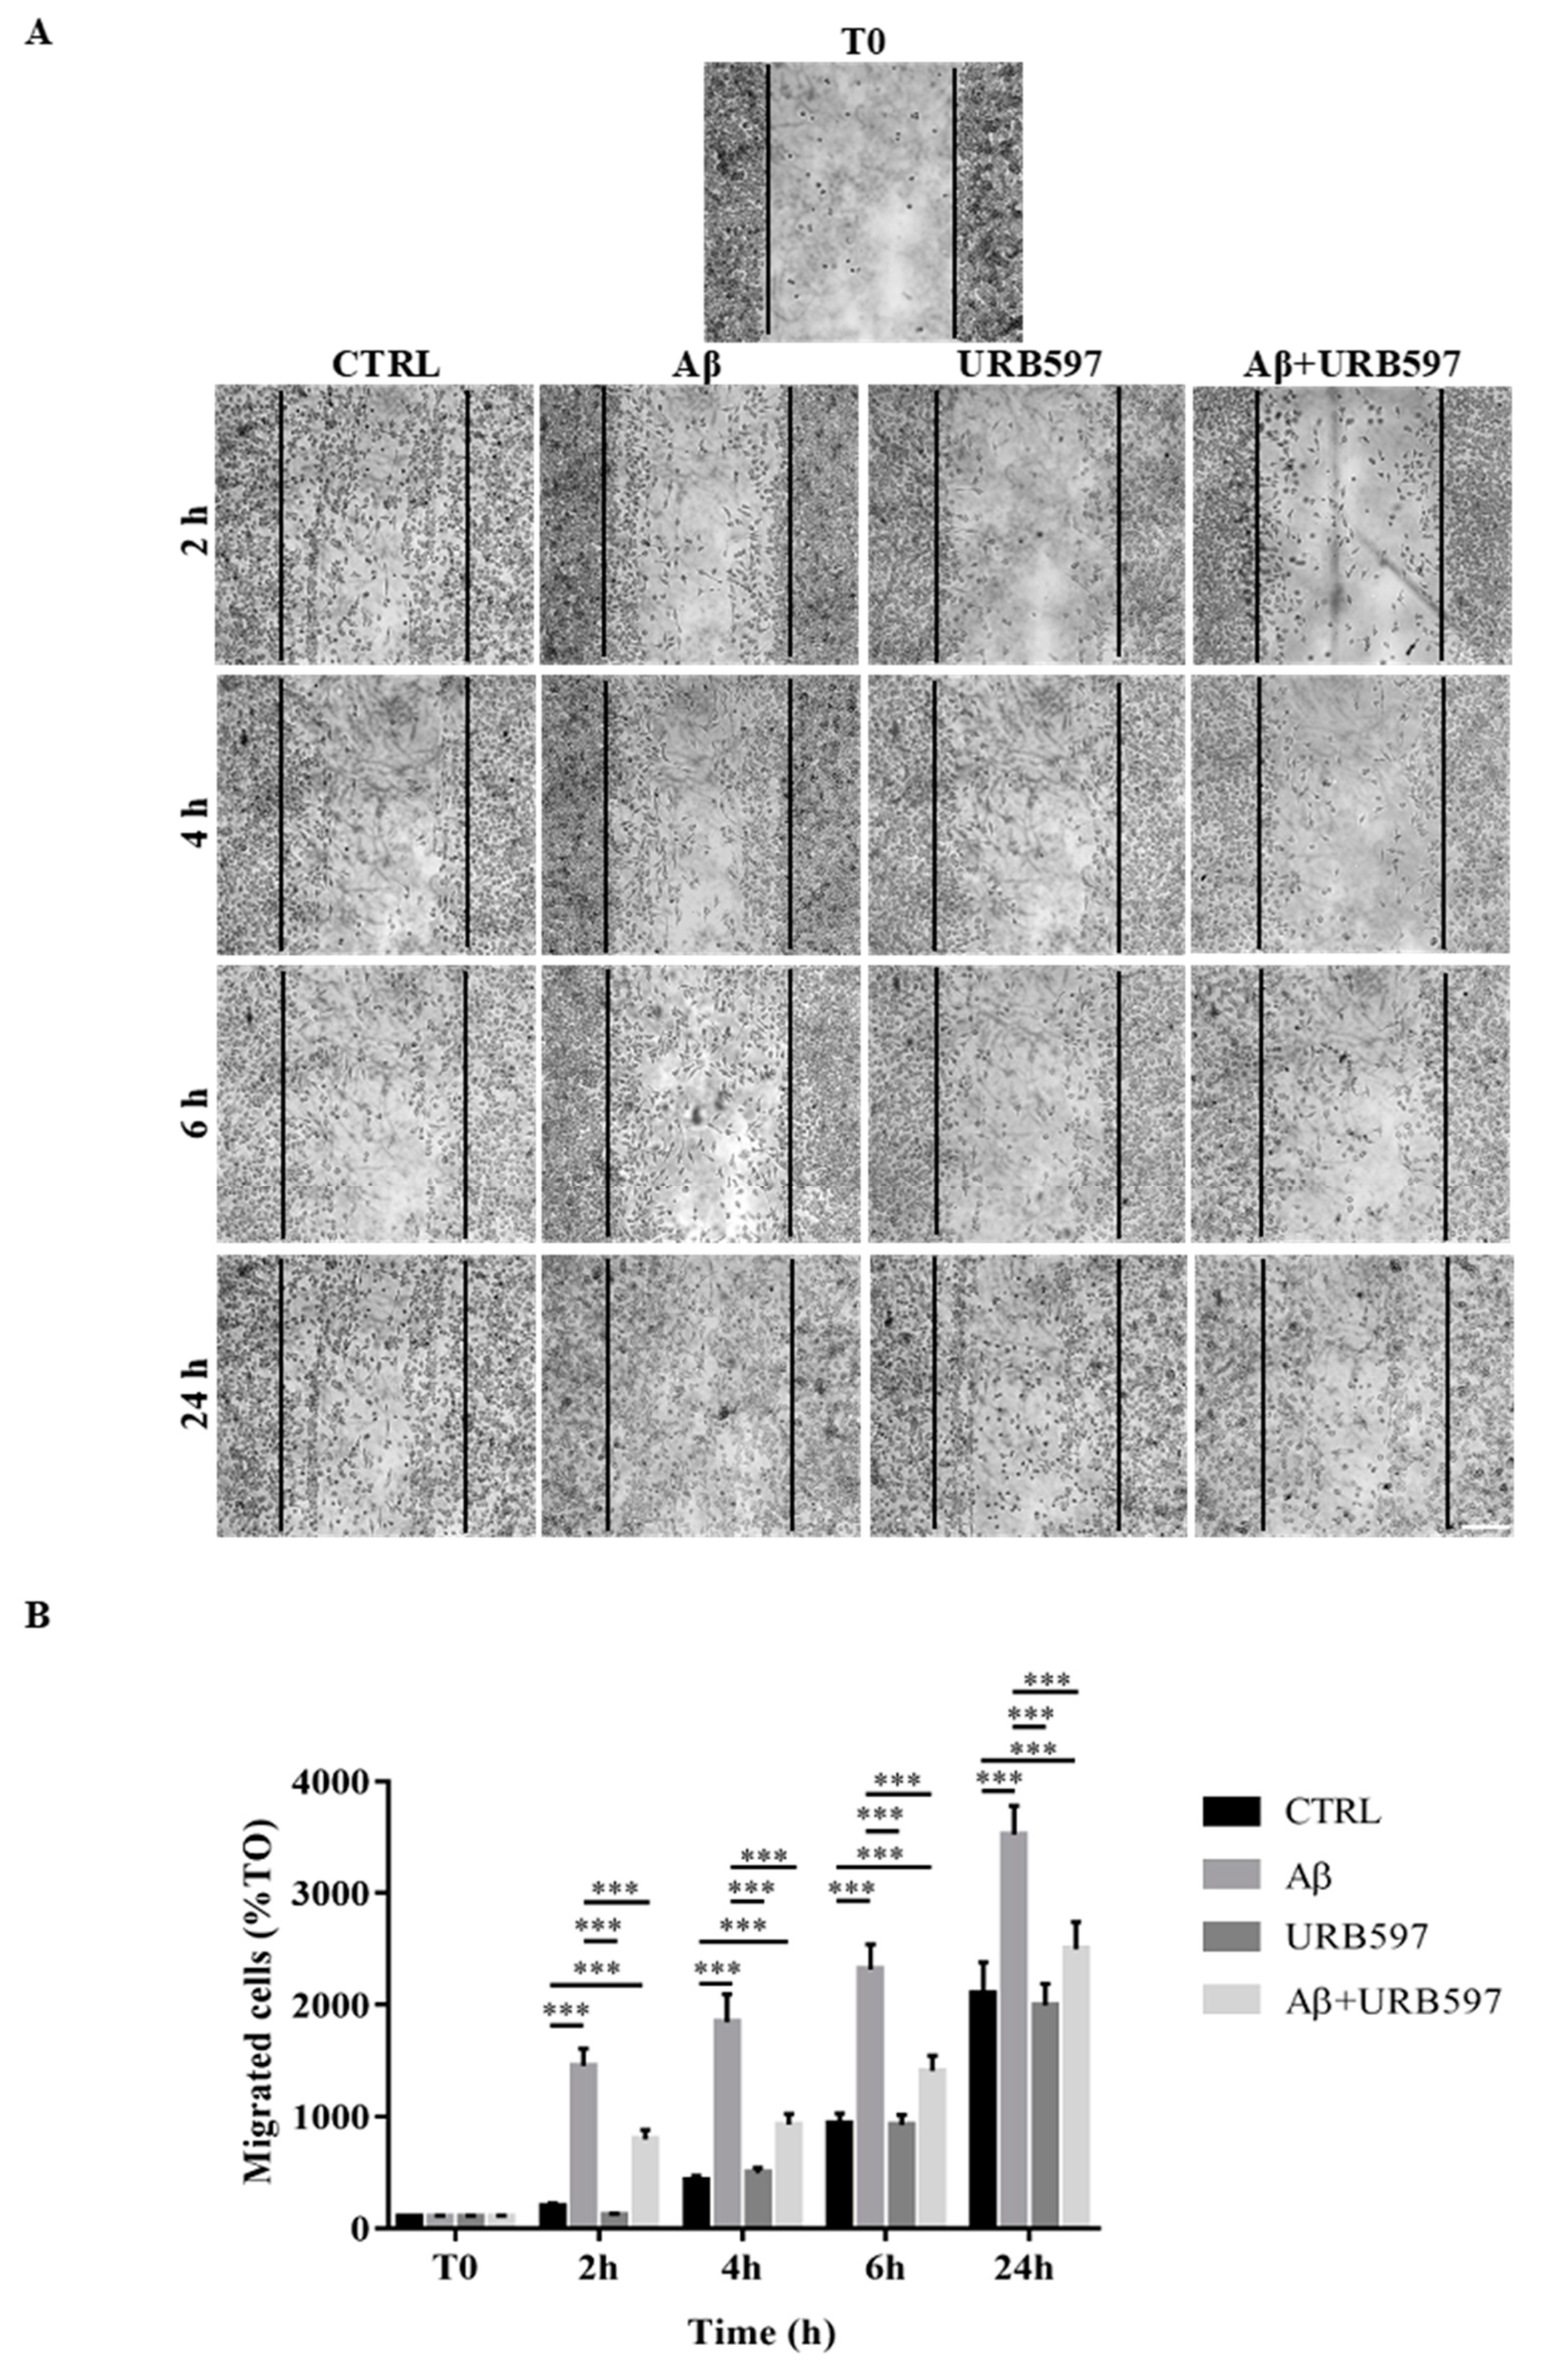
2.5. Effect of URB597 on Cellular Migration

One of the aspects of microglia activation is the acquisition of a migratory phenotype, which is essential for the cells to move towards the insult site. In this study, we performed a scratch assay in order to evaluate URB597-induced migratory capacity. The cells were pre-treated with 5 µM URB597 for 4 h in the presence or absence of 30 µM Aβ25–35 for 2 h, 4 h, 6 h, and 24 h. Migration was quantified by counting the cells that migrated from the border of the scratch to the uncovered areas, and the values obtained were reported on the graph (Figure 5B).
As shown in Figure 5, treatment with Aβ25–35 induced migration just 2 h after stimulation, as compared to the control cells. We demonstrated that URB597 alone did not affect cell migration, and that URB597 pre-treatment reduced BV-2 migration induced by Aβ25–35. The migratory effect was directly proportional to the number of incubation hours.

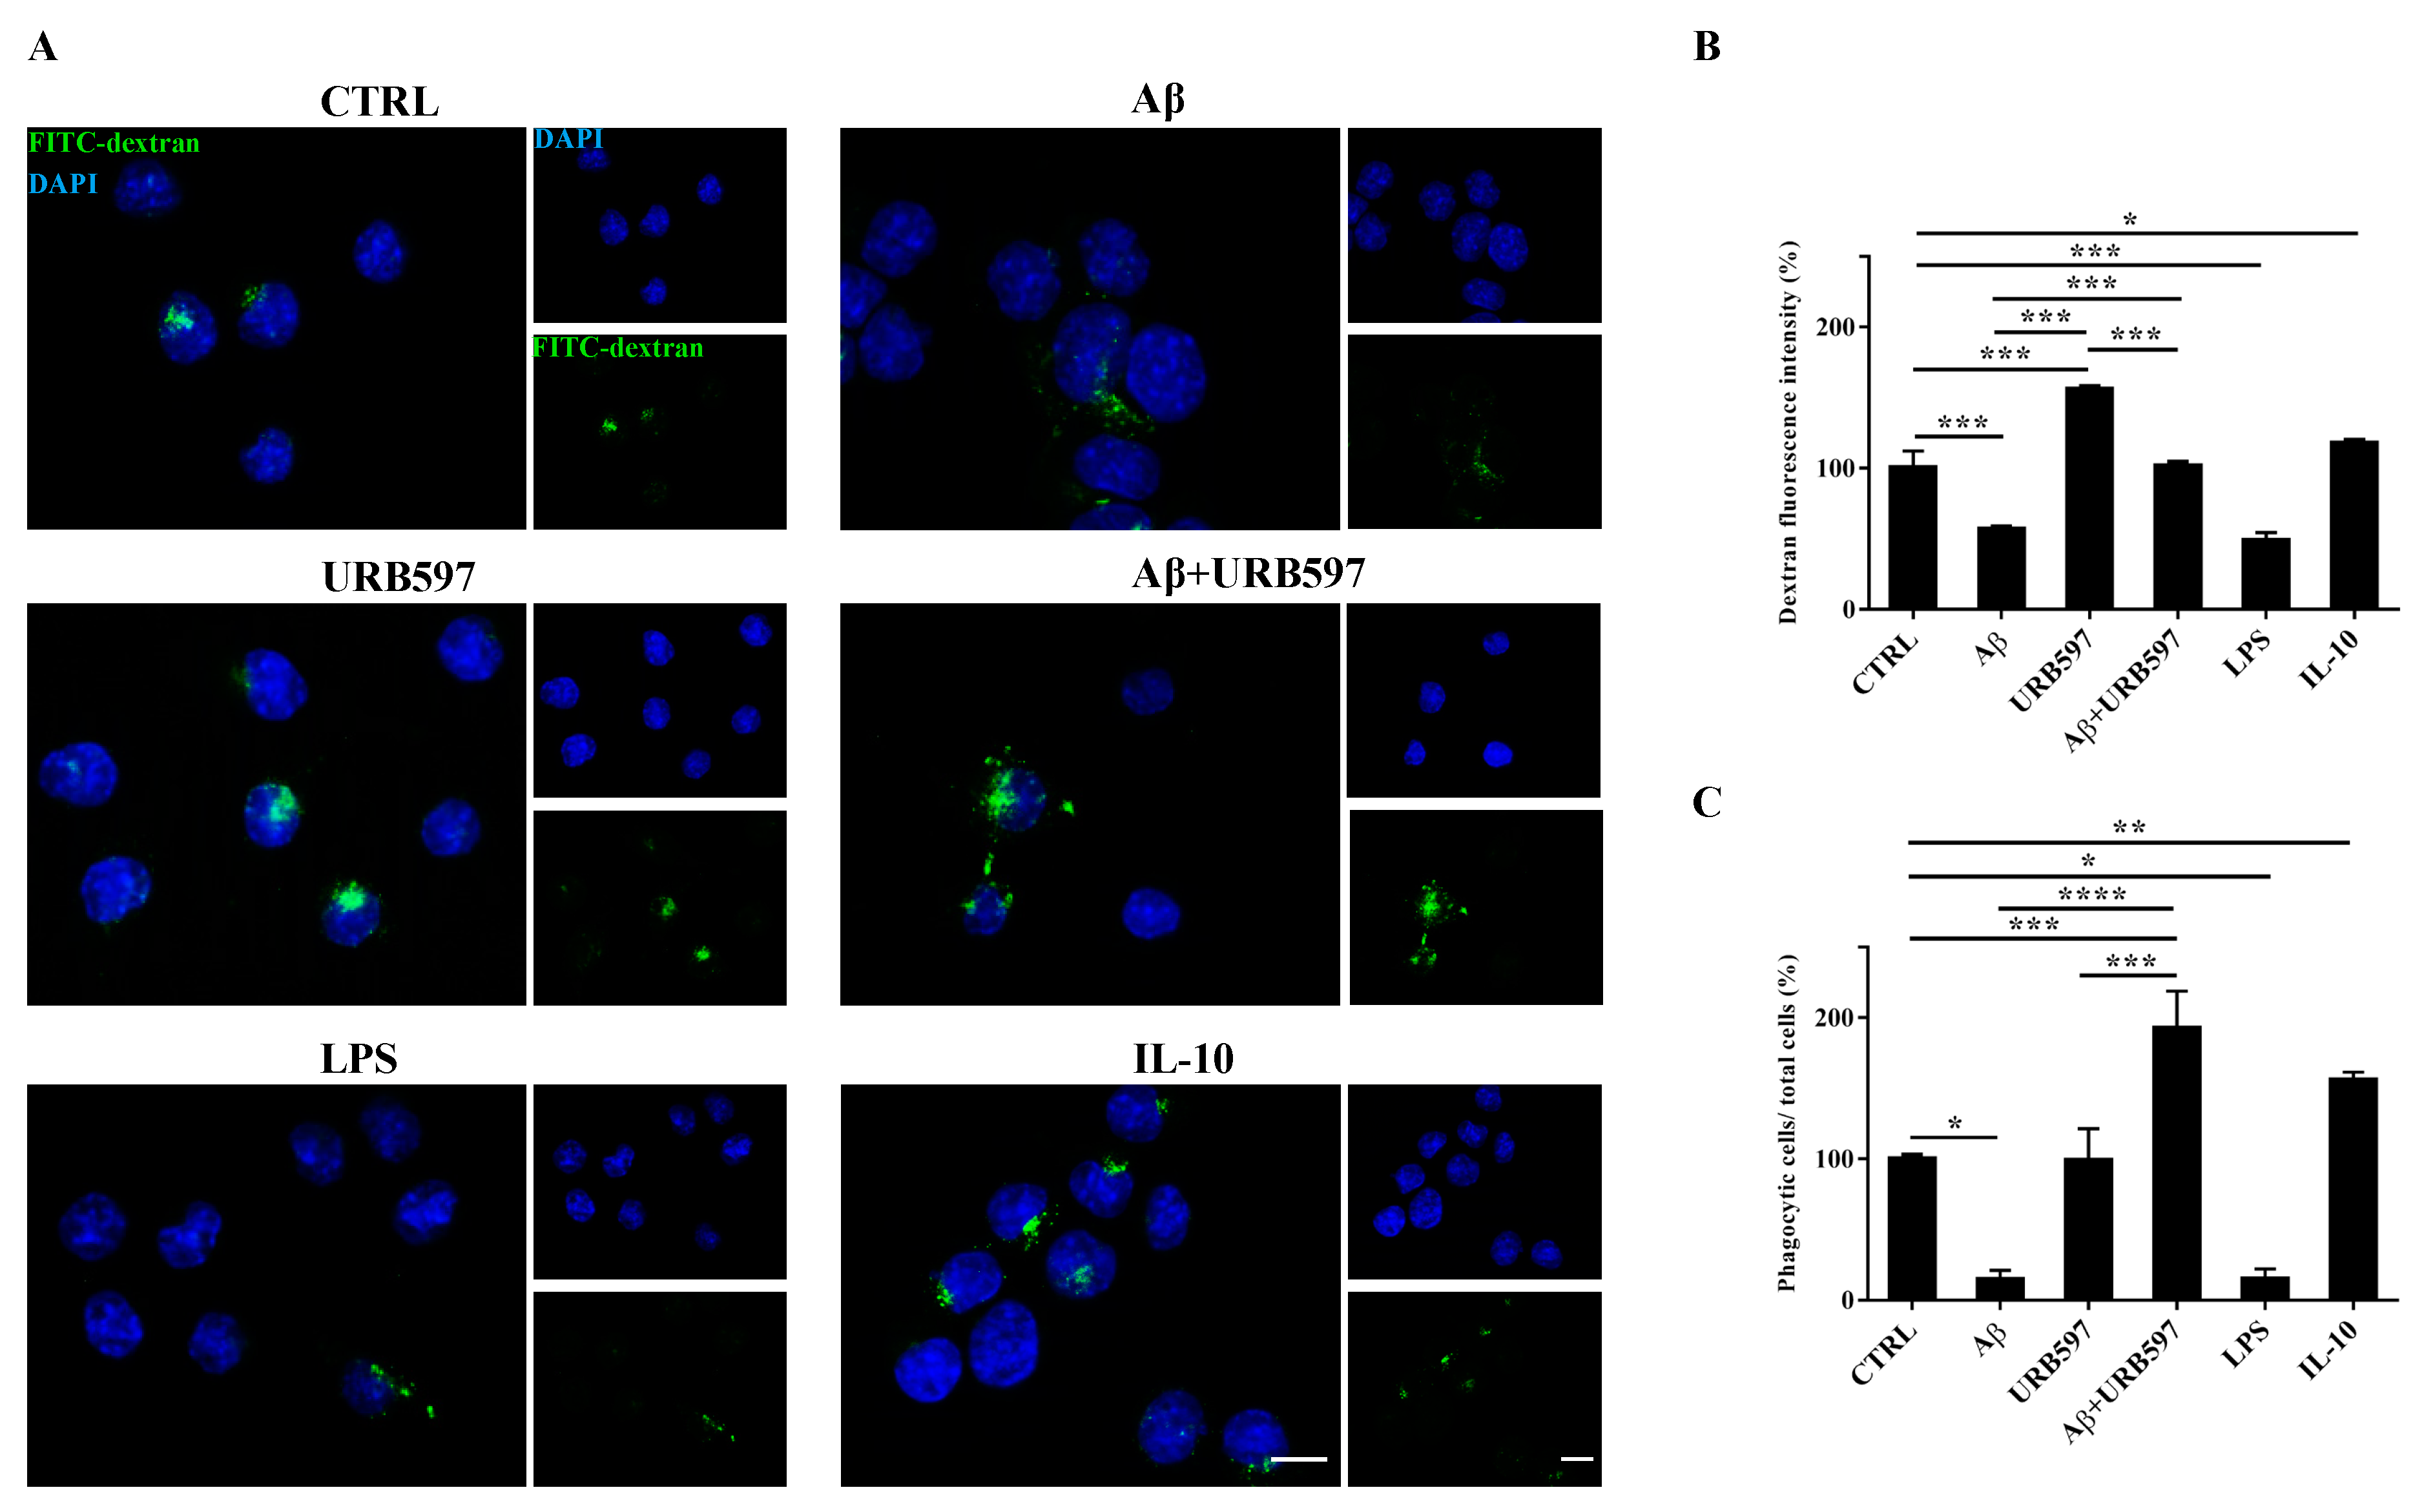
2.6. URB597 Increases Microglia Phagocytic Capacity

To determine whether URB597 has a role in phagocytosis, we assessed FITC-dextran microglial uptake. BV-2 cells pre-treated with 5 µM URB597 for 4 h and incubated with 30 µM Aβ25–35 for 24 h were incubated for 1 h with FITC-dextran and analyzed by a microscope; the fluorescence images are shown in Figure 6A. As shown in Figure 6B, we evaluated the intensity of the fluorescent dextran in the different treatments. BV-2 cells treated with Aβ25–35 showed a reduced ability to absorb dextran compared to untreated cells. The sample treated only with URB597 showed an intensity value comparable to that obtained by IL-10 stimulation. In the combined treatment with Aβ25–35 and URB597, the inhibitor turned out to be capable of increasing the intensity value as compared to the Aβ25–35 sample. LPS and IL-10 were used as reference compounds that could reduce [32] or increase phagocytosis [33,34]. Moreover, the number of dextran-positive cells was quantified on the total cells and the results were reported as percentage (Figure 6C). After stimulation with Aβ25–35 as well as with LPS, the number of dextran-positive cells was reduced by approximately 80% relative to the control cells. On the other hand, treatment with URB597 alone showed values similar as the control but lower if compared to the IL-10 treated sample. In the Aβ25–35 and URB597 combined treatment, the inhibitor improved the number of dextran-positive cells, with higher values of phagocytic cells as compared with the Aβ25–35 treated sample.

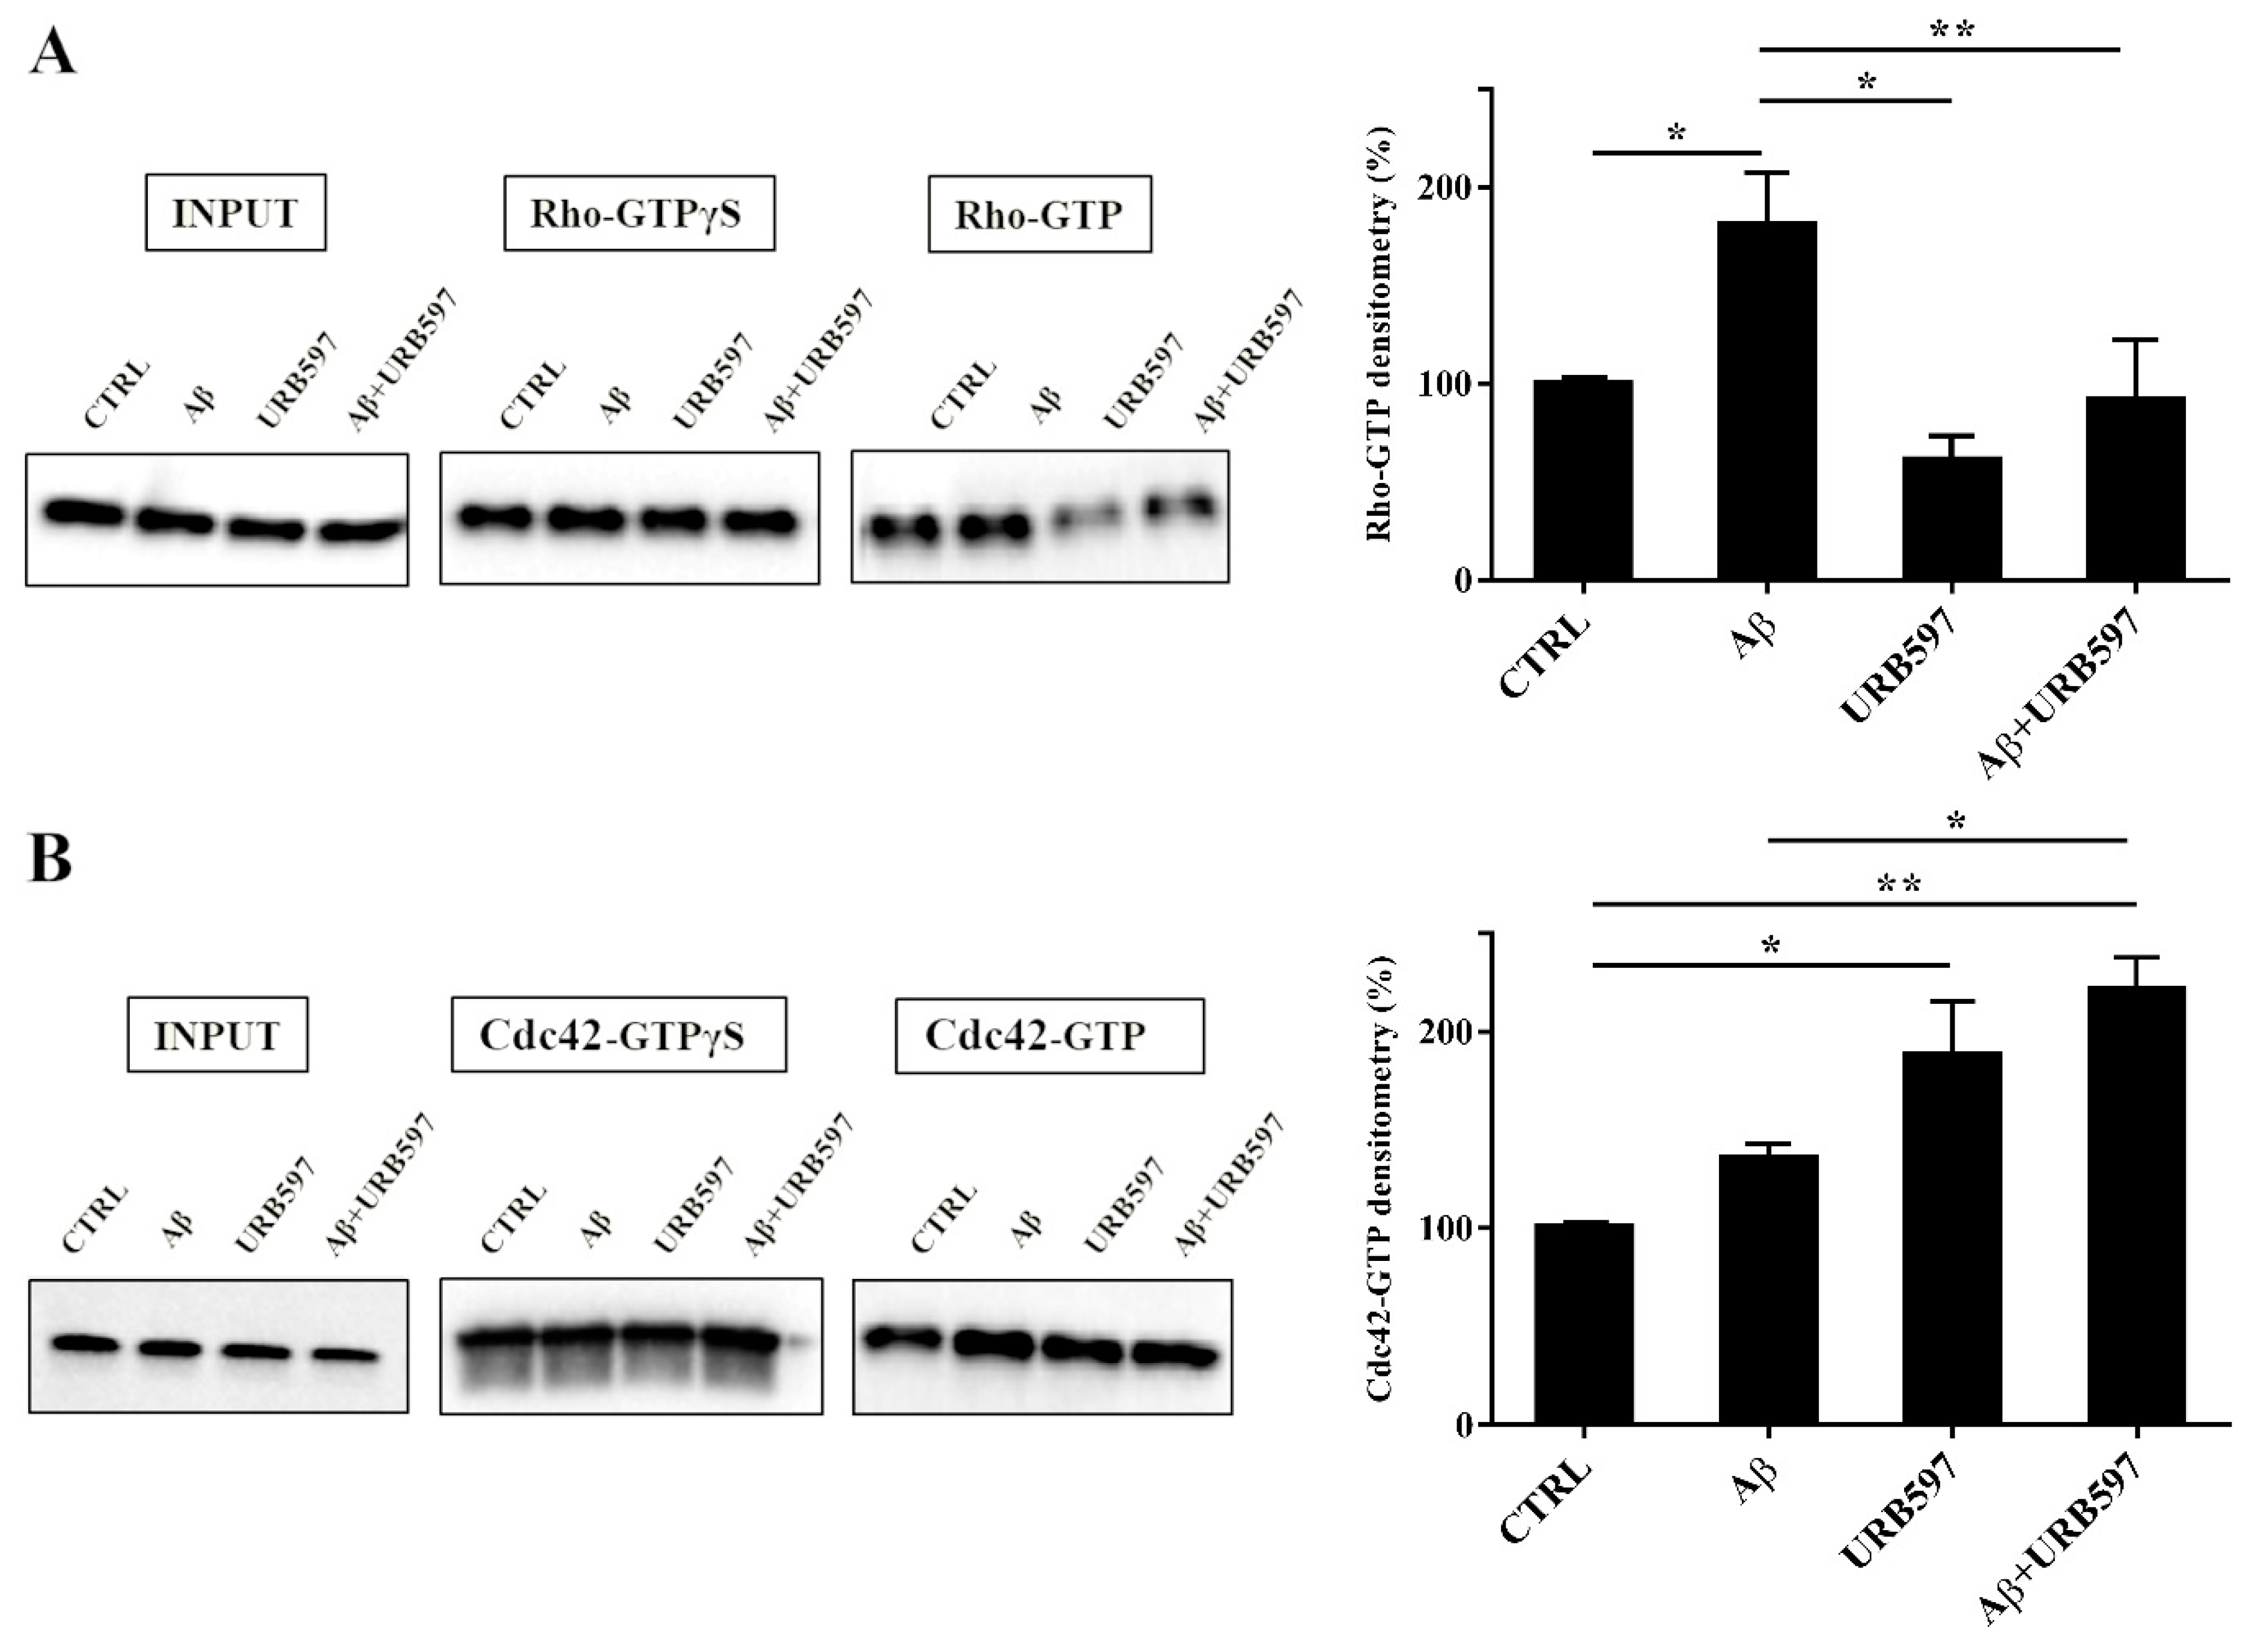
2.7. URB597 Affects Rho GTPases Activity

Cytoskeleton plasticity and the formation of actin-rich structures, with consequent morphological modifications, are regulated by the Rho GTPase protein family. Since the Rho GTPase family is a master regulator of cytoskeletal reorganization and plays an important role in membrane trafficking [35,36], we investigated whether the Rho and Cdc42, components of the Rho GTPase family, were able to regulate the different activated states of microglia cells. To evaluate the influence of the FAAH inhibitor on this class of proteins, we performed pull-down analyses on the total protein extraction from BV-2 cells pre-treated with 5 μM URB597 for 4 h and incubated with 30 μM Aβ25–35 for 24 h. We examined RhoA, which is involved in the assembly of contractile actin, and Cdc42 proteins that is involved in filopodia formation.
This analysis allows for the precipitation of active GTPases proteins through a specific binding protein. Our results show a marked increase of RhoA activity in the samples treated with Aβ25–35 as compared to control cells, whereas a decrease was observed in the URB597-treated samples with respect to Aβ25–35 samples (Figure 7A). As shown in Figure 7B, Cdc42 activity significantly increased in samples treated with URB597, considering both against Aβ25–35 and control cells samples.

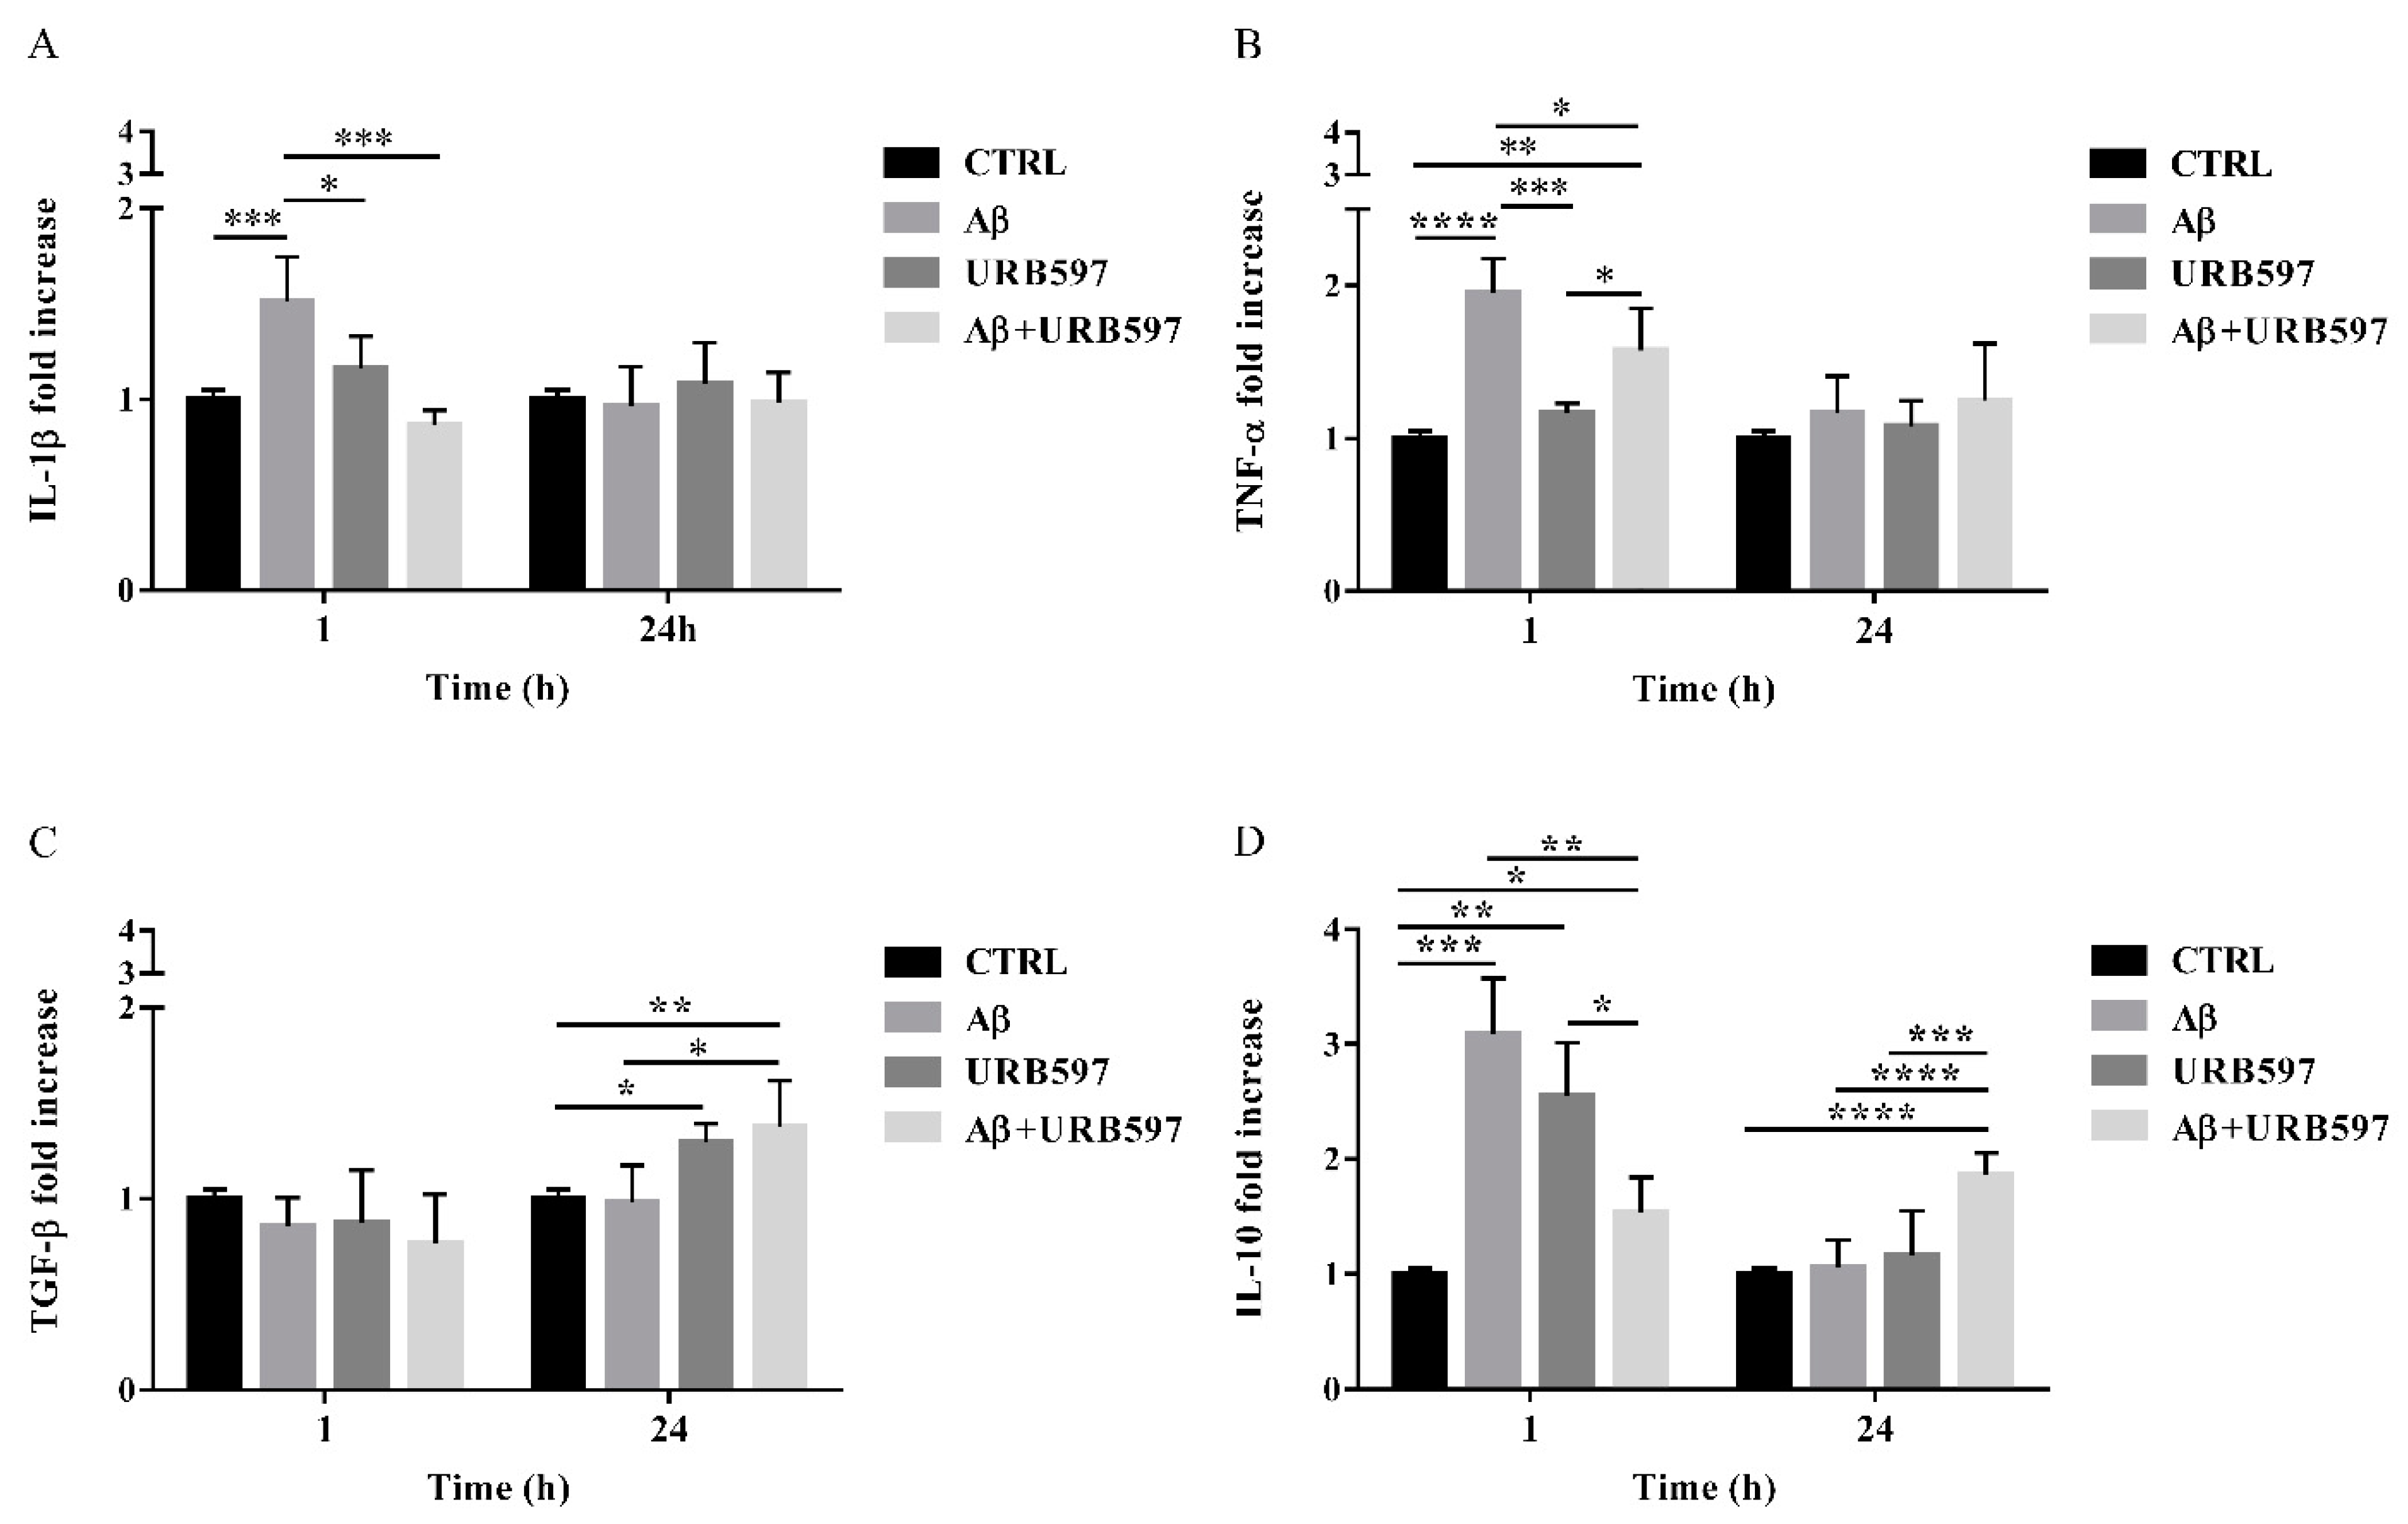
2.8. URB597 Reduces mRNA IL-1β and TNF-α Expression, Increases TGF-β and IL-10 Expression

The activation of Rho GTPases supports the hypothesis of Aβ-driven cytoskeleton rearrangement, ultimately leading to an increase of migration and a reduction of phagocytosis. Since these effects were counteracted by URB597, we aimed at determining the level of inflammation in our BV-2 cell model.
The expression of pro-inflammatory cytokines such as IL-1β and TNF-α as well as anti-inflammatory cytokines such as TGF-β and IL-10, were analyzed by qPCR. BV-2 cells were pre-treated with 5 µM URB597 for 4 h and incubated with 30 µM Aβ25–35 for 1 h and 24 h. The results presented in Figure 8A,B demonstrate that IL-1βand TNF-α expressions increased within 1 h in BV-2 cells treated with Aβ25–35 as compared to the control. On the contrary, a reduction of cytokines was observed in the sample with the combined treatment as compared to Aβ25–35 alone. No changes were detected for IL-1β and TNF-α levels in BV-2 cells incubated with 30 µM Aβ25–35 for 24 h. We also observed that treatment with Aβ25–35 did not modify TGF-β expression, while URB597 alone or in combination with Aβ25–35 upregulated TGF-β at 24 h, as shown in Figure 8C.
Moreover, both Aβ25–35 and URB597 administration, alone or in combination, induced an increase of IL-10 expression within 1 h, while after 24 h of stimulation the effect was persistent only in the Aβ25–35 and URB597 combined treatment (Figure 8D).

2.9. URB597 Modulates Both iNOS and Arg-1 Expression

The activation of microglia is a polarized process that can lead either to the potentially neurotoxic M1-activated phenotype or to the neuroprotective M2-activated phenotype [37]. To evaluate the M1 or M2 states in the treated cells, we performed both immunofluorescence and RT-qPCR analyses and assessed the level of nitric oxide synthase (iNOS) and Arginase-1 (Arg-1), which are markers of the M1 and M2 microglia phenotypes, respectively (Figure 9). BV-2 cells were pre-treated with 5 µM URB597 for 4 h and incubated with 30 µM Aβ25–35 for 24 h. LPS and IL-4 were considered as positive controls for iNOS and Arg-1 markers, respectively. As shown in Figure 9A–D, the stimulation of BV-2 cells with Aβ25–35 induced a significant enhancement of iNOS, whereas a reduction of Arg-1 was observed in comparison to control. The combination of URB597 and Aβ25–35 induced a decrease in iNOS expression and an increase in Arg-1 with respect to Aβ25–35. URB597 alone did not affect the expression of both markers.

3. Discussion

Neuroinflammation, activated microglia, and abnormalities in cytoskeletal organization are a common feature of many neurodegenerative disorders, including AD [38,39]. Although microglia polarization and plasticity are adaptive changes aimed at the surveillance of the surrounding environment to identify possible harmful processes, the mechanism underlying this process is not yet completely understood [40,41].
Several studies demonstrated that eCBs act as immunomodulators by inhibiting cytokine and chemokine production and microglial cell activation [42,43]. To validate our experimental settings, we assessed Aβ25–35 induced microglia activation, which was partially counteracted by URB597, evaluating both the immunofluorescence signal of Iba1-positive cells and the Iba1 protein level, supporting the efficacy of URB597 on FAAH activity in BV-2 cells [27].
In this study, we investigated whether the inflammatory challenge induced by Aβ25–35 on microglia cells might be prevented by FAAH inhibition. Moreover, we reported no differences in FAAH activity in BV-2 cells treated with Aβ25–35 as compared to control cells.
However, it should be noted that while URB597 was able to counteract Aβ25–35 induced cell death, cell viability was not completely restored by the same treatment. One explanation for this potential discrepancy is that cell viability may depend on the MTT assay, which provides different measures of mitochondrial activity. Notably, by enhancing FAAH substrate levels, URB597 can modulate cell proliferation [44,45] and mitochondrial bioenergetics [46,47]. In particular, the mitochondrial cascade hypothesis supports the existence of a reinforcing cycle of mitochondrial dysfunction (including the impairment of oxidative phosphorylation, reactive oxygen species production, and the alteration of mitochondrial dynamics) that, together with Aβ formation, leads to AD pathogenesis and cognitive decline [48,49]. Recently, in an in vivo model of kainic acid-induced epilepticus status in rats, URB597 treatment was shown to revert the ultrastructural alterations in the ER, mitochondria, and hippocampal neurons in a way dependent on both degree of injury and URB597 treatment [50].
Thus, a different response in cell viability might be assessed in microglial cells by using a longer time window for URB597 incubation.
With these parameters established, the first point was focused on cell morphology, which revealed specific changes after Aβ25–35 stimulation—from the resting ramified form to an amoeboid shape, with an enlarged cell body and very few extensions. This shape, typical of activated pro-inflammatory state M1, supports cell migration. By contrast, URB597 was able to affect the rearrangement of morphology in Aβ25–35 challenged BV-2 cells and significantly decreased Aβ25–35 dependent migration. Moreover, our data indicate that URB597 also modulates microglia phagocytosis since it restored the phagocytic capacity of BV-2 cells that was reduced by the Aβ25–35 challenge.
URB597 is reported to have no activity on other cannabinoid-related targets as well as on other serine hydrolase superfamily enzymes, as assessed by the activity-based protein profiling (ABPP) approach [27,51]. By changing eCB levels, URB597 might indirectly activate CB1 and CB2 receptors and contribute to the regulation of microglial migration and phagocytic activity towards an anti-inflammatory microglial phenotype [52,53,54]. It should also be noted that the effects of FAAH inhibition might be mediated by other receptors such as PPAR-α or -γ and TRPV1 [55], or other FAAH substrates such as N-palmitoylethanolamine [53]. Moreover, effects of URB597 on the expression of tyrosine hydroxylase via CB1- and FAAH-independent mechanisms [56] or its interaction with different carboxypeptidases [57] have also been reported. Although our results add another piece of evidence in support of the therapeutic potential of FAAH inhibitors, caution is needed regarding the modulation of phagocytosis. Indeed, during early brain development, microglial phagocytosis mediates synapse removal as part of a physiological process required for proper brain maturation [58]. However, during aging or in several pathological conditions, the process of synaptic pruning becomes reactivated and may contribute to the cognitive decline observed in neurodegenerative diseases [59]. Although phagocytosis increases Aβ clearance, its dysregulation may be detrimental to synapse organization or for the interaction between astrocytes and the blood-brain barrier. In other terms, the duration of microglial response (i.e., transitory vs. chronic) is the distinguishing feature of microglial function [60]. An aberrant pruning process has also been observed in the development of psychiatric [61] and metabolic disorders [62]. The effects depicted so far, i.e., cell shape remodeling, migration reduction, and the stimulation of phagocytosis, are known to depend on the cytoskeletal rearrangement, which plays a crucial role in the maintenance of the cellular structure and for the determination of cell motility [63] and the process of phagocytosis [64]. The activation of migration and phagocytosis through the remodeling of the cytoskeleton is of particular importance in senescence, and therefore for the study of dystrophic and dysfunctional microglial cells [65]. It has been suggested that neurodegeneration may be secondary to aging-related microglial deterioration, which impairs the ability of cells to engage in phagocytosis and eliminate amyloid deposits in lack of changes in cytokine and chemokine secretory activity [66].
Moreover, since the reorganization of the actin cytoskeleton is under the control of several proteins, we evaluated the activity of the Rho GTPases as RhoA and Cdc42, which are involved in the regulation of actin cytoskeletal organization, migratory capacity, and phagocytosis [67]. RhoA and Cdc42 mediate Aβ-stimulated superoxide production in microglia [68] and are involved in the regulation of cell polarization [69,70]. Our results show an increase of RhoA activity in Aβ25–35-treated BV-2 cells, thus favoring cell migration. These data are in agreement with several research reports summarized by Aguilar et al., (2017), in which PC12 cells treated with Aβ1-42 showed an increase of activated RhoA and a reduction of cell survival through the inhibition of protein tyrosine phosphatase 1B (PTP1B) [71]. An increase of activated RhoA, together with a decrease of neuronal growth, are also observed in SHSY5Y cells treated with Aβ1-40 [72]. By reducing RhoA activation, URB597 counteracted Aβ25–35-induced BV-2 cell migration capacity. As reported by Diaz-Alonso et al., (2017) and Kaplan et al., (2017), RhoA expression was reduced in the brain of mice chronically treated with Δ9-THC, while the CB1 receptor knockdown in the pyramidal neurons of newborns caused RhoA protein accumulation and impaired neuronal migration [73,74].
As demonstrated by Mendoza-Naranjo et al., (2007), Aβ-induced actin remodeling and polymerization in rat hippocampal neurons is associated with an increased colocalization of both Cdc42 and Rac-1 with F-actin-rich domains [75]. The assembly and disassembly of peripheral actin filaments promote phagocytosis and localized changes in the structure of the plasma membrane [40]. Our data showed an increase of Cdc42 activity induced by URB597, which is closely related to an enhancement of BV-2 cells performing phagocytosis. These data are also in agreement with studies performed by Kurihara et al., (2006), which reported an increase of activated Cdc42 in promyelocytic HL60 cells stimulated with the CB2 agonist JWH015 [76].
Previous results showed that either LPS or IFN-α can induce the M1 phenotype and an increase of iNOS expression, while the M2 phenotype is induced by immunosuppressive cytokines such as TGF-α and IL-10. CB2 receptor activation is important for the up-regulation of Arg-1 in the M2 state and for the phagocytic function of microglia [77]. Mecha et al., (2015) showed that the stimulation with 2-AG and AEA induces an increase of Arg-1 in rat and human microglia, boosting the expression of the M2 phenotype that is reduced in CB2-/- mice. Moreover, the pro-inflammatory LPS challenge and the transformation in the M1 phenotype are associated with the downregulation of the CB1, CB2, NAPE-PLD, FAAH, and MAGL transcripts [78]. Thus, the development of drugs able to offset or slow down the inflammatory response may add an important therapeutic option for the delay of AD progression as well as attenuate the clinical impact of AD.
Our findings support the view that the URB59-induced increase of eCB availability in the microenvironment of BV-2 microglial cells might directly interfere with the cytokine production elicited by the Aβ25–35 challenge. Indeed, IL-1β and TNF-α were significantly reduced just after the first hour of URB597 infusion. Previous reports showed that microglial TNF-α production after a fibrillar Aβ challenge can be inhibited by CB2 receptor agonist stimulation, further supporting the anti-inflammatory role attributed to the CB2 receptor [18,79].
Moreover, eCBs have been shown to activate anti-inflammatory signaling pathways that are able to modulate immune cell functions [80]. IL-10 was shown to increase in BV-2 one hour after the Aβ25–35 challenge, while after 24 h, the IL-10 gene expression dropped to the values measured in untreated cells. Similarly, an increase of IL-10 expression was observed in macrophage after 1 h in the LPS challenge, with a corresponding decrease at 24 h [81]. A reduction of IL-10 in BV-2 cells challenged with Aβ25–35 has also been reported in a study on the protective effect of the flavonoid genistein [82]. IL-10 production has been considered associated with disease progression; indeed, it has been found elevated in Aβ-stimulated peripheral blood mononuclear cells from patients with slow disease progression [83,84].
In our experimental conditions, URB597 infusion counteracted the Aβ25–35 challenge at 1 h and stimulated an increase of IL-10 production at 24h. Thus, FAAH inhibition seems to drive BV-2 polarization towards the M2 phenotype, with an increased release of the anti-inflammatory cytokines IL-10 and TGF-β. It has recently been underlined that the enhancement of eCB levels via FAAH inhibition can reduce iNOS expression in microglial cells, producing anti-inflammatory effects after stress exposure [24]. In addition, the use of PF-3845 as an irreversible FAAH inhibitor downregulated the expression of iNOS and COX-2 after traumatic brain injury [85].
In a model of ethanol-induced neurodegeneration, FAAH inhibition via a five-day URB597 treatment was shown to be effective in reducing Iba1 mRNA levels, TNF-α, IL-6, iNOS, and the monocyte chemoattractant protein-1 (MCP-1/CCL2) in hippocampal microglial cells [86]. BV-2 cells incubated with Aβ25–35 showed an increase of iNOS expression, reducing Arg-1 at the same time. URB597 had an opposite trend, demonstrating a counteraction of the Aβ25–35-induced pro-inflammatory microglial phenotype. These data are in agreement with Tham et al., (2007), which reported that URB597 treatment reduces the expression of iNOS in LPS-treated primary microglia cultures and BV-2 cells [87]. Moreover, in a mouse model of chronic cerebral hypoperfusion, Su et al., (2017) observed a reduction of the iNOS marker after URB597 treatment [88].
Altogether, our data indicate that by acting on cytoskeleton reorganization, FAAH inhibition regulates phagocytosis and cell migration processes, also promoting microglial polarization towards an anti-inflammatory M2 phenotype.

4. Materials and Methods

4.1. Materials and Chemicals

URB597 3-(3-carbamoylphenyl)-phenyl N-cyclohexylcarbamate was from Selleck Chemicals (Selleck Chemicals, Houston, TX, USA). β-amyloid peptide (Aβ25–35) fragment was synthesized by conventional solid phase chemistry [89]. Tissue culture medium and serum were from Gibco BRL (Life Technologies Inc., Grand Island, NY, USA). The 3-(4,5-dimethylthiazol-2-yl)-2,5 diphenyltetrazolium bromide (MTT), 4′, 6-diamidino-2-phenylindole (DAPI), and TRITC-phalloidin were purchased from Sigma-Aldrich (St. Louis, MO, USA). Fluorescein isothiocyanate (FITC)-dextran was from Sigma-Aldrich (Sigma-Aldrich, St. Louis, MO, USA). Pull-Down and Detection Kits were from Thermo Scientific Pierce, Rockford (Thermo Scientific Pierce, Rockford, IL, USA). The miRNeasy Micro kit was obtained from QIAGEN (Hilden, Germany). The High-Capacity cDNA Reverse Transcription kit and Power SYBR® Green Master Mix was purchased from Applied Biosystems (Foster City, CA, USA).

4.2. Preparation of Aβ25–35 and URB597 Stock Solution

25–35 was dissolved in a sterile phosphate buffered saline (PBS), pH 7.4, at a concentration of 1 mM. To induce the aggregation, the solution was incubated in an ultrasonic bath on ice for 30 min. After treatment, the solution was stored at −20 °C until use. URB597 was dissolved in dimethyl sulfoxide (DMSO) at a final concentration of 1 mM.

4.3. Fatty Acid Amide Hydrolase Assay

FAAH enzymatic activity was studied by using membranes prepared from BV-2 cells treated with vehicle or pre-treated with 5 μM URB597 for 4 h and incubated with 30 μM Aβ25-35 for 24 h. Membrane preparations were then incubated with [14C]-AEA (85.0 mCi/mmol, ARC St. Louis, MO, USA) properly diluted with AEA (Cayman Chemicals, Ann Arbor, MI, USA) in 50 mM Tris-HCl, pH = 9, for 30 min at 37 °C. The [14C]-Ethanolamine produced from [14C]-AEA hydrolysis was measured by scintillation counting of the aqueous phase after the extraction of the incubation mixture, with two volumes of CHCl3/CH3OH (1:1, v/v); the activity was expressed as percentage of the maximum effect observed in the absence of treatments.

4.4. Cell Cultures and Treatment

The mouse microglia cell line (BV-2), kindly provided by Dr. Mangino, Sapienza University of Rome, was grown in DMEM/F-12 medium containing 5% fetal bovine serum, 4 mM L-glutamine, and 1% of penicillin-streptomycin (Gibco BRL Life Technologies Inc., Grand Island, NY, USA), at 37 °C in a humidified atmosphere with 5% CO2. Cells were plated at an appropriate density according to each experimental setting and treated with 30 µM Aβ25–35 in the presence or absence of 5 µM URB597. The cells were pre-treated with URB597 for 4 h before adding the Aβ25–35. The untreated cells were considered as control.

4.5. Cell Viability Assays

Cell viability was evaluated with MTT and Trypan blue assays. Cells were seeded in 96-well plates at a density of 3 × 10³/well. After cell treatments, 20 µL of a 5 mg/mL solution of MTT in PBS was added to the culture medium at a final concentration of 0.5 mg/mL and cells were incubated at 37 °C for 2 h. The supernatant was removed from each well and the formazan crystals were solubilized in 100 µL of DMSO. The optical density (OD) was measured at 570 nm, with a reference at 690 nm, using a microplate reader (Thermo Scientific Appliskan Multimode Microplate Reader). For the Trypan blue exclusion test, BV-2 were seeded onto 24-well plates at a density of 3 × 10³/well. After treatments, cells were detached with 1× Tripsin-EDTA, and 100 µL of the cell suspension were mixed with 100 μL of Trypan blue solution; cell counts were performed using a Neubauer chamber. The results are shown as percent viability of the treated groups relative to the control, which was considered 100%.

4.6. Immunocytochemical Analyses

Cells grown on 12 mm glass coverslips in a 24-well plate at a density of 15 × 103 cells/well, were fixed after treatments with 4% paraformaldehyde for 30 min, followed by treatment with 0.1 M glycine in PBS for 20 min. A total of 0.1% Triton X-100 in PBS was added for 5 min to allow permeabilization. To analyze cytoskeletal actin organization, cells were labeled with rhodamine-conjugated phalloidin (TRITC-phalloidin—Sigma-Aldrich, St. Louis, MO, USA) for 45 min. For the detection of M1/M2 polarization markers, cells were incubated with primary antibodies raised against rabbit polyclonal IgG anti-Iba1 (dil. 1:100—AB-83747, Immunological Sciences, Roma, Italy), rabbit polyclonal IgG anti-iNOS (dil. 1:100—D6B65, Cell Signaling Technology, Danvers, MA, USA), or rabbit polyclonal IgG anti-Arg-1 (dil. 1:50—D4E3M, Cell Signaling Technology, Danvers, Ma, USA), and subsequently with anti-rabbit Alexa Fluor 488 secondary antibodies. Finally, the cells were marked with DAPI to highlight the nucleus. The fluorescence signal was analyzed using an Axio Observer inverted microscope, equipped with the ApoTome System (Carl Zeiss Inc., Ober Kochen, Germany). Cell area was quantified with ImageJ software.

4.7. Migration Assay

To evaluate the migration capacity of the cells following treatments, we performed a Scratch assay. Cells were seeded at 1 × 10⁶ cells onto 35 mm plates and grown until confluence in a DMEM/F-12 medium containing 5% fetal bovine serum. A cell-free area was introduced by scraping the monolayer with a sterile tip. After an intensive wash, the remaining cells were incubated with 30 µM Aβ25–35 in the presence or absence of 5 µM URB597 at different time points. After incubation, images were taken using an Axio Observer inverted microscope (Zeiss, Oberkochen, Germany). Migration was quantified by counting the cells that covered the cell-free areas by Image J, and data obtained were reported as percentage of the cells migrated in the uncovered areas with respect to time 0.

4.8. Fluorescein Isothiocyanate (FITC)-Dextran Uptake Assay

The phagocytic capacity was evaluated by measuring the internalization of the dextran conjugated with FITC into the cells treated with 30 µM Aβ25–35 in the presence or absence of 5 µM URB597. Cells were plated onto 12 mm glass coverslips in a 24-well plate at a density of 17 × 103 cells/well. After treatments, the cells were incubated with dextran, conjugated with FITC in culture medium for 1 h at 37 °C, or at 4 °C for the negative control. The cells were stained with DAPI to detect the nucleus. Cells that were found positive for FITC, detected by the fluorescence signal using an Axio Observer inverted microscope (Zeiss, Oberkochen, Germany), were considered as cells that had successfully engulfed dextran. The quantitative analysis of the fluorescence intensity of the dextran and of the number of dextran-positive cells was carried out using the ImageJ software.

4.9. Western Blotting

Cells treated with 30 µM Aβ25–35 in the presence or absence of 5 µM URB597 were lysed in 100 µL/106 cells of RIPA buffer (50 mM Tris-HCl pH 7.4, 150 mM NaCl, 5 mM NaF, 0.5% NaDOC, 0.1% SDS, 1 mM Na3VO4, 1 mM PMSF, 1% NP-40 and proteases inhibitors). Lysed samples were incubated on ice for 30 min and centrifuged at 14000 rpm for 15 min at 4 °C. Supernatants were collected and the protein amount was quantified using a Bradford Assay. In total, 20 µg of proteins for each sample, added with Laemmli buffer (240 mM Tris-HCl, pH 6.8, 40% glycerol, 5% β-mercaptoetanolo, 8% SDS, 0,04% di Bromophenol blue), were boiled for 3 min at 80 °C and loaded onto the 4–20% Criterion™ TGX Stain-Free™ Protein Gel (BioRad). Proteins were transferred onto PVDF membranes (BioRad) using Turbo Blot system (BioRad). Membranes were blocked with 5% Milk (w/v) in Tris-buffered saline (TBS)-Tween (0.5% (v/v)) for 1 h, and then incubated at 4 °C overnight with the rabbit polyclonal IgG anti-Iba1 (dil. 1:100 AB-81359, Immunological Sciences, Roma, Italy). After the washing steps with TBS-Tween (0.1%), membranes were incubated with Goat Anti-Mouse IgG (H+L)-HRP Conjugate (dil. 1:5000) (BioRad, Segrate Milano, Italy) for 1 h at RT. The protein band intensity was identified with Crescendo (Millipore) using ChemiDoc (MolecularImager® ChemiDoc™mod. MP System—BioRad Laboratories) and densitometric analyses were performed with ImageLab software (Biorad) and normalized to the corresponding β-Actin controls.

4.10. Pull-Down Assay for Activated Rho GTPases

Pull-down assay was performed using the “Active Rho Pull-Down and Detection Kit” (Thermo scientific—n°16116, 16119). Briefly, cells treated with 30 μM Aβ25–35 in the presence or absence of 5 μM URB597 were plated at an appropriate density in order to have at least 500 μg of total protein to add to the column for each sample. The cells were scraped, collected in a tube, and gently rinsed once in ice-cold TBS, 1 mM PMSF, proteases inhibitors cocktail, and 1 mM Na3VO4. After this, 106 cells were lysed in 100 mL of Lysis/Binding/Wash Buffer (25 mM Tris HCl, pH 7.2, 150 mM NaCl, 5 mM MgCl2, 1% NP-40, 5% glycerol, proteases inhibitors cocktail, 1 mM PMSF and 1 mM Na3VO4). Subsequently, the lysates were incubated on ice for 15 min and centrifuged at 16,000× g for 15 min at 4 °C. To ensure the pull-down procedure, with GTPγS and GDP regarded as positive and negative controls, respectively, were incubated with 500 μg of total protein. The samples were left at 30 °C for 15 min under constant stirring and the reaction was ended by mixing the sample with MgCl2 at a final concentration of 60 mM on ice. The supernatant of each sample was passed through a column and incubated with 100 μL Glutathione Resin (50% slurry containing 0.05% sodium azide) and 400 μg of GST-Rhotekin-RBD (5–6 mg/mL) at 4 °C for 1 h, with gentle rocking. The columns were washed three times with Lysis/Binding/Wash Buffer. Each washing step included an intermediate centrifuge at 6000× g for 10–30 s. The bound proteins were eluted with 2X SDS Sample Buffer (125 mM Tris HCl, pH 6.8, 2% glycerol, 4% sodium dodecyl sulfate (SDS) (w/v), 0.05% bromophenol blue and 5% β-mercaptoethanol). The samples were electrophoresed and analyzed by western blot as described above, with a rabbit IgG anti-Rho antibody (dil. 1:670—16116, Thermo Scientific Pierce, Rockford, IL, USA). The same procedure was performed in the Cdc42 pull-down assay using a mouse monoclonal IgG1 anti-Cdc42 antibody (dil. 1:167—16119, Thermo Scientific Pierce, Rockford, IL, USA).

4.11. Real-Time Quantitative PCR Analysis

Total RNA was extracted from control, BV-2 cells were treated using the miRNeasy Micro kit (Qiagen, Hilden, Germany) and quantified using NanoDrop One/One C (Thermo Fisher Scientific, Waltham, MA, USA). The cDNA was generated using the High-Capacity cDNA Reverse Transcription kit (Applied Biosystem, Foster City, CA, USA). Quantitative real-time PCR (qPCR) was performed for each sample in triplicate on an Applied Biosystems 7900HT Fast real-time PCR System (Applied Biosystem, Cheshire, UK) through the program SDS2.1.1 (Applied Biosystem, Foster City, CA, USA) using the Power SYBR® Green PCR Master Mix (Applied Biosystem, Foster City, CA, USA). The primers for real-time PCR amplification were designed with the UCSC GENOME BROWSER (http://genome.cse.ucsc.edu/; University of California, Santa Cruz) (Table 1). The primer pair sequences were matched by BLASTn to the genome sequence to identify the primer locations with respect to the exons. A comparative threshold cycle (CT) method was used to analyze the real-time PCR data. The amount of target, normalized to the endogenous reference of 18S rDNA primers (ΔCT) and relative to the calibrator of untreated control (ΔΔCT), was calculated by the equation 2−ΔΔCT, as previously described [90].

4.12. Statistical Analyses

Data were expressed as the mean values ± standard deviations (SD) or mean values ± SEM from at least three independent experiments. Statistical analyses were performed using one-way analysis of variance (ANOVA) with Tukey’s post hoc test comparison (GraphPad Software Inc., San Diego, CA, USA). All results were considered statistically significant with p < 0.05.

5. Conclusions

Persistent inflammatory responses and chemotaxis of microglia/macrophages in the brain accelerate the progression of AD. Thus, the eCB system might represent a pivotal factor in counteracting neuroinflammation.

Author Contributions

Conceptualization, M.M., T.B., M.D., P.M., R.B.; formal analysis, M.G., M.G.D.C., E.M., F.A.; funding acquisition, M.M.; investigation, M.G., M.G.D.C., T.B., E.M., F.A., R.C.; methodology, M.G., M.D., P.M., R.B.; project administration, M.M., M.D., P.M., R.B.; resources, P.M., R.C., R.B.; supervision, M.D., P.M., R.B.; writing—original draft, M.G., M.M., T.B., R.C., M.D., P.M., R.B. All authors have read and agreed to the published version of the manuscript.

Funding

This research was funded by PRIN n.2015KMMKBN for M. Maccarrone; by Sapienza Ateneo RG11715C7E54539F for M. D’Erme, and Sapienza Ateneo RM120172B745088B for R. Businaro.

Acknowledgments

We are grateful to Fabien Gosselet (Artois University, France), Giuseppe Zardo (Sapienza University, Italy), and Giacomo Giacovazzo (CNR, Italy) for the fruitful discussions, and Adele Preziosi (Sapienza University, Italy) for cell migration analysis, and Alessandra Franco for technical assistance.

Conflicts of Interest

The authors declare no conflict of interest.

References

  1. Mayeux, R.; Sano, M. Treatment of Alzheimer’s disease. N. Engl. J. Med. 1999, 341, 1670–1679. [Google Scholar] [CrossRef]
  2. Walsh, D.M.; Selkoe, D.J. A beta oligomers—A decade of discovery. J. Neurochem. 2007, 101, 1172–1184. [Google Scholar] [CrossRef]
  3. Yankner, B.A. New clues to Alzheimer’s disease: Unraveling the roles of amyloid and tau. Nat. Med. 1996, 2, 850–852. [Google Scholar] [CrossRef] [PubMed]
  4. Eikelenboom, P.; Zhan, S.S.; van Gool, W.A.; Allsop, D. Inflammatory mechanisms in Alzheimer’s disease. Trends Pharmacol. Sci. 1994, 15, 447–450. [Google Scholar] [CrossRef]
  5. McGeer, P.L.; Rogers, J.; McGeer, E.G. Neuroimmune mechanisms in Alzheimer disease pathogenesis. Alzheimer Dis. Assoc. Disord. 1994, 8, 149–158. [Google Scholar] [CrossRef]
  6. Shippy, D.C.; Ulland, T.K. Microglial Immunometabolism in Alzheimer’s Disease. Front. Cell. Neurosci. 2020, 14, 563446. [Google Scholar] [CrossRef] [PubMed]
  7. Akiyama, H.; Arai, T.; Kondo, H.; Tanno, E.; Haga, C.; Ikeda, K. Cell mediators of inflammation in the Alzheimer disease brain. Alzheimer Dis. Assoc. Disord. 2000, 14 (Suppl. 1), S47–S53. [Google Scholar] [CrossRef]
  8. Davalos, D.; Grutzendler, J.; Yang, G.; Kim, J.V.; Zuo, Y.; Jung, S.; Littman, D.R.; Dustin, M.L.; Gan, W.B. ATP mediates rapid microglial response to local brain injury in vivo. Nat. Neurosci. 2005, 8, 752–758. [Google Scholar] [CrossRef] [PubMed]
  9. Kitazawa, M.; Yamasaki, T.R.; LaFerla, F.M. Microglia as a potential bridge between the amyloid beta-peptide and tau. Ann. N. Y. Acad. Sci. 2004, 1035, 85–103. [Google Scholar] [CrossRef] [PubMed]
  10. Rogers, J.; Strohmeyer, R.; Kovelowski, C.J.; Li, R. Microglia and inflammatory mechanisms in the clearance of amyloid beta peptide. Glia 2002, 40, 260–269. [Google Scholar] [CrossRef] [PubMed]
  11. Perry, G.; Cash, A.D.; Smith, M.A. Alzheimer Disease and Oxidative Stress. J. Biomed. Biotechnol. 2002, 2, 120–123. [Google Scholar] [CrossRef]
  12. Friedman, D.; French, J.A.; Maccarrone, M. Safety, efficacy, and mechanisms of action of cannabinoids in neurological disorders. Lancet Neurol. 2019, 18, 504–512. [Google Scholar] [CrossRef]
  13. Cristino, L.; Bisogno, T.; Di Marzo, V. Cannabinoids and the expanded endocannabinoid system in neurological disorders. Nat. Rev. Neurol. 2020, 16, 9–29. [Google Scholar] [CrossRef] [PubMed]
  14. Malorni, W.; Bari, M.; Straface, E.; Battista, N.; Matarrese, P.; Finazzi-Agro, A.; Del Principe, D.; Maccarrone, M. Morphological evidence that 2-arachidonoylglycerol is a true agonist of human platelets. Thromb. Haemost. 2004, 92, 1159–1161. [Google Scholar] [CrossRef] [PubMed]
  15. Fezza, F.; Bari, M.; Florio, R.; Talamonti, E.; Feole, M.; Maccarrone, M. Endocannabinoids, related compounds and their metabolic routes. Molecules 2014, 19, 17078–17106. [Google Scholar] [CrossRef]
  16. Jackson, S.J.; Diemel, L.T.; Pryce, G.; Baker, D. Cannabinoids and neuroprotection in CNS inflammatory disease. J. Neurol. Sci. 2005, 233, 21–25. [Google Scholar] [CrossRef] [PubMed]
  17. Benito, C.; Nunez, E.; Tolon, R.M.; Carrier, E.J.; Rabano, A.; Hillard, C.J.; Romero, J. Cannabinoid CB2 receptors and fatty acid amide hydrolase are selectively overexpressed in neuritic plaque-associated glia in Alzheimer’s disease brains. J. Neurosci. 2003, 23, 11136–11141. [Google Scholar] [CrossRef] [Green Version]
  18. Ramirez, B.G.; Blazquez, C.; Gomez del Pulgar, T.; Guzman, M.; de Ceballos, M.L. Prevention of Alzheimer’s disease pathology by cannabinoids: Neuroprotection mediated by blockade of microglial activation. J. Neurosci. 2005, 25, 1904–1913. [Google Scholar] [CrossRef] [Green Version]
  19. Maccarrone, M.; Totaro, A.; Leuti, A.; Giacovazzo, G.; Scipioni, L.; Mango, D.; Coccurello, R.; Nistico, R.; Oddi, S. Early alteration of distribution and activity of hippocampal type-1 cannabinoid receptor in Alzheimer’s disease-like mice overexpressing the human mutant amyloid precursor protein. Pharmacol. Res. 2018, 130, 366–373. [Google Scholar] [CrossRef] [Green Version]
  20. Aso, E.; Juves, S.; Maldonado, R.; Ferrer, I. CB2 cannabinoid receptor agonist ameliorates Alzheimer-like phenotype in AbetaPP/PS1 mice. J. Alzheimers Dis. 2013, 35, 847–858. [Google Scholar] [CrossRef] [Green Version]
  21. Martin-Moreno, A.M.; Brera, B.; Spuch, C.; Carro, E.; Garcia-Garcia, L.; Delgado, M.; Pozo, M.A.; Innamorato, N.G.; Cuadrado, A.; de Ceballos, M.L. Prolonged oral cannabinoid administration prevents neuroinflammation, lowers beta-amyloid levels and improves cognitive performance in Tg APP 2576 mice. J. Neuroinflamm. 2012, 9, 8. [Google Scholar] [CrossRef] [PubMed] [Green Version]
  22. Walter, L.; Stella, N. Cannabinoids and neuroinflammation. Br. J. Pharmacol. 2004, 141, 775–785. [Google Scholar] [CrossRef] [Green Version]
  23. Jung, K.M.; Astarita, G.; Yasar, S.; Vasilevko, V.; Cribbs, D.H.; Head, E.; Cotman, C.W.; Piomelli, D. An amyloid beta42-dependent deficit in anandamide mobilization is associated with cognitive dysfunction in Alzheimer’s disease. Neurobiol. Aging 2012, 33, 1522–1532. [Google Scholar] [CrossRef] [Green Version]
  24. Chen, H.C.; Spiers, J.G.; Sernia, C.; Lavidis, N.A. Inhibition of Fatty Acid Amide Hydrolase by PF-3845 Alleviates the Nitrergic and Proinflammatory Response in Rat Hippocampus Following Acute Stress. Int. J. Neuropsychopharmacol. 2018, 21, 786–795. [Google Scholar] [CrossRef] [Green Version]
  25. Piro, J.R.; Benjamin, D.I.; Duerr, J.M.; Pi, Y.; Gonzales, C.; Wood, K.M.; Schwartz, J.W.; Nomura, D.K.; Samad, T.A. A dysregulated endocannabinoid-eicosanoid network supports pathogenesis in a mouse model of Alzheimer’s disease. Cell Rep. 2012, 1, 617–623. [Google Scholar] [CrossRef] [Green Version]
  26. Vazquez, C.; Tolon, R.M.; Grande, M.T.; Caraza, M.; Moreno, M.; Koester, E.C.; Villaescusa, B.; Ruiz-Valdepenas, L.; Fernandez-Sanchez, F.J.; Cravatt, B.F.; et al. Endocannabinoid regulation of amyloid-induced neuroinflammation. Neurobiol. Aging 2015, 36, 3008–3019. [Google Scholar] [CrossRef] [PubMed]
  27. Tanaka, M.; Yagyu, K.; Sackett, S.; Zhang, Y. Anti-Inflammatory Effects by Pharmacological Inhibition or Knockdown of Fatty Acid Amide Hydrolase in BV2 Microglial Cells. Cells 2019, 8, 491. [Google Scholar] [CrossRef] [PubMed] [Green Version]
  28. Harry, G.J. Microglia during development and aging. Pharmacol. Ther. 2013, 139, 313–326. [Google Scholar] [CrossRef] [PubMed] [Green Version]
  29. Mori, I.; Imai, Y.; Kohsaka, S.; Kimura, Y. Upregulated expression of Iba1 molecules in the central nervous system of mice in response to neurovirulent influenza A virus infection. Microbiol. Immunol. 2000, 44, 729–735. [Google Scholar] [CrossRef] [PubMed]
  30. Frozza, R.L.; Horn, A.P.; Hoppe, J.B.; Simao, F.; Gerhardt, D.; Comiran, R.A.; Salbego, C.G. A comparative study of beta-amyloid peptides Abeta1-42 and Abeta25-35 toxicity in organotypic hippocampal slice cultures. Neurochem. Res. 2009, 34, 295–303. [Google Scholar] [CrossRef]
  31. Lucin, K.M.; Wyss-Coray, T. Immune activation in brain aging and neurodegeneration: Too much or too little? Neuron 2009, 64, 110–122. [Google Scholar] [CrossRef] [Green Version]
  32. Yunna, C.; Mengru, H.; Lei, W.; Weidong, C. Macrophage M1/M2 polarization. Eur. J. Pharmacol. 2020, 877, 173090. [Google Scholar] [CrossRef]
  33. Francos-Quijorna, I.; Amo-Aparicio, J.; Martinez-Muriana, A.; Lopez-Vales, R. IL-4 drives microglia and macrophages toward a phenotype conducive for tissue repair and functional recovery after spinal cord injury. Glia 2016, 64, 2079–2092. [Google Scholar] [CrossRef] [Green Version]
  34. Gordon, S.; Taylor, P.R. Monocyte and macrophage heterogeneity. Nat. Rev. Immunol. 2005, 5, 953–964. [Google Scholar] [CrossRef]
  35. Ridley, A.J. Rho GTPases and actin dynamics in membrane protrusions and vesicle trafficking. Trends Cell Biol. 2006, 16, 522–529. [Google Scholar] [CrossRef]
  36. Stankiewicz, T.R.; Linseman, D.A. Rho family GTPases: Key players in neuronal development, neuronal survival, and neurodegeneration. Front. Cell. Neurosci. 2014, 8, 314. [Google Scholar] [CrossRef] [Green Version]
  37. Orihuela, R.; McPherson, C.A.; Harry, G.J. Microglial M1/M2 polarization and metabolic states. Br. J. Pharmacol. 2016, 173, 649–665. [Google Scholar] [CrossRef]
  38. Das, R.; Chinnathambi, S. Actin-mediated Microglial Chemotaxis via G-Protein Coupled Purinergic Receptor in Alzheimer’s Disease. Neuroscience 2020, 448, 325–336. [Google Scholar] [CrossRef]
  39. Sferra, A.; Nicita, F.; Bertini, E. Microtubule Dysfunction: A Common Feature of Neurodegenerative Diseases. Int. J. Mol. Sci. 2020, 21, 7354. [Google Scholar] [CrossRef]
  40. Etienne-Manneville, S.; Hall, A. Rho GTPases in cell biology. Nature 2002, 420, 629–635. [Google Scholar] [CrossRef]
  41. Gordon, S. Alternative activation of macrophages. Nat. Rev. Immunol. 2003, 3, 23–35. [Google Scholar] [CrossRef]
  42. Cabral, G.A.; Ferreira, G.A.; Jamerson, M.J. Endocannabinoids and the Immune System in Health and Disease. Handb. Exp. Pharmacol. 2015, 231, 185–211. [Google Scholar] [CrossRef]
  43. Talarico, G.; Trebbastoni, A.; Bruno, G.; de Lena, C. Modulation of the Cannabinoid System: A New Perspective for the Treatment of the Alzheimer’s Disease. Curr. Neuropharmacol. 2019, 17, 176–183. [Google Scholar] [CrossRef]
  44. Laezza, C.; Pagano, C.; Navarra, G.; Pastorino, O.; Proto, M.C.; Fiore, D.; Piscopo, C.; Gazzerro, P.; Bifulco, M. The Endocannabinoid System: A Target for Cancer Treatment. Int. J. Mol. Sci. 2020, 21, 747. [Google Scholar] [CrossRef] [Green Version]
  45. Stella, N. Cannabinoid and cannabinoid-like receptors in microglia, astrocytes, and astrocytomas. Glia 2010, 58, 1017–1030. [Google Scholar] [CrossRef] [PubMed] [Green Version]
  46. Benard, G.; Massa, F.; Puente, N.; Lourenco, J.; Bellocchio, L.; Soria-Gomez, E.; Matias, I.; Delamarre, A.; Metna-Laurent, M.; Cannich, A.; et al. Mitochondrial CB(1) receptors regulate neuronal energy metabolism. Nat. Neurosci. 2012, 15, 558–564. [Google Scholar] [CrossRef]
  47. Zaccagnino, P.; Corcelli, A.; Baronio, M.; Lorusso, M. Anandamide inhibits oxidative phosphorylation in isolated liver mitochondria. FEBS Lett. 2011, 585, 429–434. [Google Scholar] [CrossRef] [Green Version]
  48. Pagani, L.; Eckert, A. Amyloid-Beta interaction with mitochondria. Int. J. Alzheimers Dis. 2011, 2011, 925050. [Google Scholar] [CrossRef] [Green Version]
  49. Sharma, C.; Kim, S.; Nam, Y.; Jung, U.J.; Kim, S.R. Mitochondrial Dysfunction as a Driver of Cognitive Impairment in Alzheimer’s Disease. Int. J. Mol. Sci. 2021, 22, 4850. [Google Scholar] [CrossRef]
  50. Mikheeva, I.B.; Shubina, L.; Matveeva, N.; Pavlik, L.L.; Kitchigina, V.F. Fatty acid amide hydrolase inhibitor URB597 may protect against kainic acid-induced damage to hippocampal neurons: Dependence on the degree of injury. Epilepsy Res. 2017, 137, 84–94. [Google Scholar] [CrossRef]
  51. Piomelli, D.; Tarzia, G.; Duranti, A.; Tontini, A.; Mor, M.; Compton, T.R.; Dasse, O.; Monaghan, E.P.; Parrott, J.A.; Putman, D. Pharmacological profile of the selective FAAH inhibitor KDS-4103 (URB597). CNS Drug Rev. 2006, 12, 21–38. [Google Scholar] [CrossRef] [Green Version]
  52. Ehrhart, J.; Obregon, D.; Mori, T.; Hou, H.; Sun, N.; Bai, Y.; Klein, T.; Fernandez, F.; Tan, J.; Shytle, R.D. Stimulation of cannabinoid receptor 2 (CB2) suppresses microglial activation. J. Neuroinflamm. 2005, 2, 29. [Google Scholar] [CrossRef] [Green Version]
  53. Guida, F.; Luongo, L.; Boccella, S.; Giordano, M.E.; Romano, R.; Bellini, G.; Manzo, I.; Furiano, A.; Rizzo, A.; Imperatore, R.; et al. Palmitoylethanolamide induces microglia changes associated with increased migration and phagocytic activity: Involvement of the CB2 receptor. Sci. Rep. 2017, 7, 375. [Google Scholar] [CrossRef] [PubMed]
  54. Romero-Sandoval, E.A.; Horvath, R.; Landry, R.P.; DeLeo, J.A. Cannabinoid receptor type 2 activation induces a microglial anti-inflammatory phenotype and reduces migration via MKP induction and ERK dephosphorylation. Mol. Pain 2009, 5, 25. [Google Scholar] [CrossRef] [PubMed] [Green Version]
  55. Benito, C.; Tolon, R.M.; Castillo, A.I.; Ruiz-Valdepenas, L.; Martinez-Orgado, J.A.; Fernandez-Sanchez, F.J.; Vazquez, C.; Cravatt, B.F.; Romero, J. beta-Amyloid exacerbates inflammation in astrocytes lacking fatty acid amide hydrolase through a mechanism involving PPAR-alpha, PPAR-gamma and TRPV1, but not CB(1) or CB(2) receptors. Br. J. Pharmacol. 2012, 166, 1474–1489. [Google Scholar] [CrossRef] [Green Version]
  56. Bosier, B.; Muccioli, G.G.; Lambert, D.M. The FAAH inhibitor URB597 efficiently reduces tyrosine hydroxylase expression through CB(1)- and FAAH-independent mechanisms. Br. J. Pharmacol. 2013, 169, 794–807. [Google Scholar] [CrossRef] [Green Version]
  57. Zhang, D.; Saraf, A.; Kolasa, T.; Bhatia, P.; Zheng, G.Z.; Patel, M.; Lannoye, G.S.; Richardson, P.; Stewart, A.; Rogers, J.C.; et al. Fatty acid amide hydrolase inhibitors display broad selectivity and inhibit multiple carboxylesterases as off-targets. Neuropharmacology 2007, 52, 1095–1105. [Google Scholar] [CrossRef]
  58. Paolicelli, R.C.; Bolasco, G.; Pagani, F.; Maggi, L.; Scianni, M.; Panzanelli, P.; Giustetto, M.; Ferreira, T.A.; Guiducci, E.; Dumas, L.; et al. Synaptic pruning by microglia is necessary for normal brain development. Science 2011, 333, 1456–1458. [Google Scholar] [CrossRef] [Green Version]
  59. Rajendran, L.; Paolicelli, R.C. Microglia-Mediated Synapse Loss in Alzheimer’s Disease. J. Neurosci. 2018, 38, 2911–2919. [Google Scholar] [CrossRef] [Green Version]
  60. Lau, S.F.; Fu, A.K.Y.; Ip, N.Y. Cytokine signaling convergence regulates the microglial state transition in Alzheimer’s disease. Cell. Mol. Life Sci. 2021, 78, 4703–4712. [Google Scholar] [CrossRef]
  61. Victor, T.R.; Tsirka, S.E. Microglial contributions to aberrant neurogenesis and pathophysiology of epilepsy. Neuroimmunol. Neuroinflamm. 2020, 7, 234–247. [Google Scholar] [CrossRef]
  62. Hao, S.; Dey, A.; Yu, X.; Stranahan, A.M. Dietary obesity reversibly induces synaptic stripping by microglia and impairs hippocampal plasticity. Brain Behav. Immun. 2016, 51, 230–239. [Google Scholar] [CrossRef] [PubMed] [Green Version]
  63. Das, R.; Balmik, A.A.; Chinnathambi, S. Phagocytosis of full-length Tau oligomers by Actin-remodeling of activated microglia. J. Neuroinflamm. 2020, 17, 10. [Google Scholar] [CrossRef] [Green Version]
  64. Uhlemann, R.; Gertz, K.; Boehmerle, W.; Schwarz, T.; Nolte, C.; Freyer, D.; Kettenmann, H.; Endres, M.; Kronenberg, G. Actin dynamics shape microglia effector functions. Brain Struct. Funct. 2016, 221, 2717–2734. [Google Scholar] [CrossRef] [PubMed]
  65. Streit, W.J.; Khoshbouei, H.; Bechmann, I. Dystrophic microglia in late-onset Alzheimer’s disease. Glia 2020, 68, 845–854. [Google Scholar] [CrossRef]
  66. Streit, W.J. Microglial senescence: Does the brain’s immune system have an expiration date? Trends Neurosci. 2006, 29, 506–510. [Google Scholar] [CrossRef]
  67. Burridge, K.; Wennerberg, K. Rho and Rac take center stage. Cell 2004, 116, 167–179. [Google Scholar] [CrossRef] [Green Version]
  68. Moon, M.Y.; Kim, H.J.; Li, Y.; Kim, J.G.; Jeon, Y.J.; Won, H.Y.; Kim, J.S.; Kwon, H.Y.; Choi, I.G.; Ro, E.; et al. Involvement of small GTPase RhoA in the regulation of superoxide production in BV2 cells in response to fibrillar Abeta peptides. Cell Signal. 2013, 25, 1861–1869. [Google Scholar] [CrossRef]
  69. Johnson, D.I. Cdc42: An essential Rho-type GTPase controlling eukaryotic cell polarity. Microbiol. Mol. Biol. Rev. 1999, 63, 54–105. [Google Scholar] [CrossRef] [PubMed] [Green Version]
  70. Govek, E.E.; Wu, Z.; Acehan, D.; Molina, H.; Rivera, K.; Zhu, X.; Fang, Y.; Tessier-Lavigne, M.; Hatten, M.E. Cdc42 Regulates Neuronal Polarity during Cerebellar Axon Formation and Glial-Guided Migration. iScience 2018, 1, 35–48. [Google Scholar] [CrossRef] [Green Version]
  71. Aguilar, B.J.; Zhu, Y.; Lu, Q. Rho GTPases as therapeutic targets in Alzheimer’s disease. Alzheimers Res. Ther. 2017, 9, 97. [Google Scholar] [CrossRef] [PubMed] [Green Version]
  72. Petratos, S.; Li, Q.X.; George, A.J.; Hou, X.; Kerr, M.L.; Unabia, S.E.; Hatzinisiriou, I.; Maksel, D.; Aguilar, M.I.; Small, D.H. The beta-amyloid protein of Alzheimer’s disease increases neuronal CRMP-2 phosphorylation by a Rho-GTP mechanism. Brain 2008, 131, 90–108. [Google Scholar] [CrossRef] [PubMed] [Green Version]
  73. Diaz-Alonso, J.; de Salas-Quiroga, A.; Paraiso-Luna, J.; Garcia-Rincon, D.; Garcez, P.P.; Parsons, M.; Andradas, C.; Sanchez, C.; Guillemot, F.; Guzman, M.; et al. Loss of Cannabinoid CB1 Receptors Induces Cortical Migration Malformations and Increases Seizure Susceptibility. Cereb. Cortex 2017, 27, 5303–5317. [Google Scholar] [CrossRef] [PubMed] [Green Version]
  74. Kaplan, H.M.; Pazarci, P. Effects of chronic Delta(9)-tetrahydrocannabinol treatment on Rho/Rho-kinase signalization pathway in mouse brain. Saudi Pharm. J. 2017, 25, 1078–1081. [Google Scholar] [CrossRef]
  75. Mendoza-Naranjo, A.; Gonzalez-Billault, C.; Maccioni, R.B. Abeta1-42 stimulates actin polymerization in hippocampal neurons through Rac1 and Cdc42 Rho GTPases. J. Cell Sci. 2007, 120, 279–288. [Google Scholar] [CrossRef] [Green Version]
  76. Kurihara, R.; Tohyama, Y.; Matsusaka, S.; Naruse, H.; Kinoshita, E.; Tsujioka, T.; Katsumata, Y.; Yamamura, H. Effects of peripheral cannabinoid receptor ligands on motility and polarization in neutrophil-like HL60 cells and human neutrophils. J. Biol. Chem. 2006, 281, 12908–12918. [Google Scholar] [CrossRef] [PubMed] [Green Version]
  77. Carlisle, S.J.; Marciano-Cabral, F.; Staab, A.; Ludwick, C.; Cabral, G.A. Differential expression of the CB2 cannabinoid receptor by rodent macrophages and macrophage-like cells in relation to cell activation. Int. Immunopharmacol. 2002, 2, 69–82. [Google Scholar] [CrossRef]
  78. Mecha, M.; Feliu, A.; Carrillo-Salinas, F.J.; Rueda-Zubiaurre, A.; Ortega-Gutierrez, S.; de Sola, R.G.; Guaza, C. Endocannabinoids drive the acquisition of an alternative phenotype in microglia. Brain Behav. Immun. 2015, 49, 233–245. [Google Scholar] [CrossRef]
  79. Luo, X.Q.; Li, A.; Yang, X.; Xiao, X.; Hu, R.; Wang, T.W.; Dou, X.Y.; Yang, D.J.; Dong, Z. Paeoniflorin exerts neuroprotective effects by modulating the M1/M2 subset polarization of microglia/macrophages in the hippocampal CA1 region of vascular dementia rats via cannabinoid receptor 2. Chin. Med. 2018, 13, 14. [Google Scholar] [CrossRef]
  80. Tanaka, M.; Sackett, S.; Zhang, Y. Endocannabinoid Modulation of Microglial Phenotypes in Neuropathology. Front. Neurol. 2020, 11, 87. [Google Scholar] [CrossRef]
  81. Raza, A.; Crothers, J.W.; McGill, M.M.; Mawe, G.M.; Teuscher, C.; Krementsov, D.N. Anti-inflammatory roles of p38alpha MAPK in macrophages are context dependent and require IL-10. J. Leukoc. Biol. 2017, 102, 1219–1227. [Google Scholar] [CrossRef] [PubMed] [Green Version]
  82. Yu, H.L.; Li, X.Y.; Zhou, X.; Yuan, L.H.; Ma, W.W.; Xi, Y.D.; Zhao, X.; Wu, J.; Xiao, R. Beta amyloid peptide (25–35) leading to inflammation through Toll-like receptors and the anti-inflammatory effect of genistein in BV-2 cells. J. Mol. Neurosci. 2013, 51, 771–778. [Google Scholar] [CrossRef]
  83. Guillot-Sestier, M.V.; Doty, K.R.; Gate, D.; Rodriguez, J., Jr.; Leung, B.P.; Rezai-Zadeh, K.; Town, T. Il10 deficiency rebalances innate immunity to mitigate Alzheimer-like pathology. Neuron 2015, 85, 534–548. [Google Scholar] [CrossRef] [Green Version]
  84. Asselineau, D.; Benlhassan, K.; Arosio, B.; Mari, D.; Ferri, E.; Casati, M.; Gussago, C.; Tedone, E.; Annoni, G.; Mazzola, P.; et al. Interleukin-10 Production in Response to Amyloid-beta Differs between Slow and Fast Decliners in Patients with Alzheimer’s Disease. J. Alzheimers Dis. 2015, 46, 837–842. [Google Scholar] [CrossRef] [Green Version]
  85. Tchantchou, F.; Tucker, L.B.; Fu, A.H.; Bluett, R.J.; McCabe, J.T.; Patel, S.; Zhang, Y. The fatty acid amide hydrolase inhibitor PF-3845 promotes neuronal survival, attenuates inflammation and improves functional recovery in mice with traumatic brain injury. Neuropharmacology 2014, 85, 427–439. [Google Scholar] [CrossRef] [Green Version]
  86. Rivera, P.; Fernandez-Arjona, M.D.M.; Silva-Pena, D.; Blanco, E.; Vargas, A.; Lopez-Avalos, M.D.; Grondona, J.M.; Serrano, A.; Pavon, F.J.; Rodriguez de Fonseca, F.; et al. Pharmacological blockade of fatty acid amide hydrolase (FAAH) by URB597 improves memory and changes the phenotype of hippocampal microglia despite ethanol exposure. Biochem. Pharmacol. 2018, 157, 244–257. [Google Scholar] [CrossRef] [PubMed]
  87. Tham, C.S.; Whitaker, J.; Luo, L.; Webb, M. Inhibition of microglial fatty acid amide hydrolase modulates LPS stimulated release of inflammatory mediators. FEBS Lett. 2007, 581, 2899–2904. [Google Scholar] [CrossRef] [Green Version]
  88. Su, S.H.; Wu, Y.F.; Lin, Q.; Hai, J. Cannabinoid receptor agonist WIN55,212-2 and fatty acid amide hydrolase inhibitor URB597 ameliorate neuroinflammatory responses in chronic cerebral hypoperfusion model by blocking NF-kappaB pathways. Naunyn Schmiedebergs Arch. Pharmacol. 2017, 390, 1189–1200. [Google Scholar] [CrossRef]
  89. Colombo, R.; Atherton, E.; Sheppard, R.C.; Woolley, V. 4-Chloromethylphenoxyacetyl polystyrene and polyamide supports for solid-phase peptide synthesis. Int. J. Pept. Protein Res. 1983, 21, 118–126. [Google Scholar] [CrossRef]
  90. Livak, K.J.; Schmittgen, T.D. Analysis of relative gene expression data using real-time quantitative PCR and the 2(-Delta Delta C(T)) Method. Methods 2001, 25, 402–408. [Google Scholar] [CrossRef]
Figure 1. (A) Immunofluorescence analysis of Iba1 in BV-2 cells treated with 30 μM Aβ25–35 for 24 h. Quantization of the intensity of the fluorescence signal was performed using the ImageJ software. The results are expressed as the mean ± SD of three independent experiments. *** p < 0.001. Bar 20 μm; (B) Determination of Iba1 protein levels by western blot. The data were normalized to the β-actin signal, reported as percentage versus control (CTRL). Data are expressed as the mean ± SEM of three independent experiments. * p < 0.05.
Ijms 22 07711 g001
Figure 2. Effects of Aβ25–35 in the presence or absence of URB597 on BV-2 cells. (A) Trypan blue exclusion test. Cell count was determined in BV-2 cells exposed for 24 h to 30 µM of Aβ25–35 in the presence or absence of 5 µM of URB597 and expressed as cell death (cell death/cell death + living cell). Data are reported as percentage versus CTRL. (B) Analysis of cell viability was evaluated by MTT assay. MTT reduction was analyzed in the same samples of treated cells at 24 h and 48 h. Data are expressed as percentage versus CTRL. The values are the mean ± SEM of triplicate determination from independent experiments. * p < 0.05, ** p < 0.01, **** p < 0.0001.
Ijms 22 07711 g002
Figure 3. FAAH activity in BV-2 cells pre-treated with 5 μM URB597 for 4 h and incubated with 30 μM Aβ25–35 for 24 h. Data are reported as mean ± SEM of three independent experiments. * p < 0.05, ** p < 0.01.
Ijms 22 07711 g003
Figure 4. (A) Analysis of BV-2 cell morphology by rhodamine-conjugated phalloidin (TRITC-phalloidin) staining to highlight actin and 4′, 6-diamidino-2-phenylindole (DAPI) to detect the nucleus, after pre-treatment with 5 μM URB597 for 4 h and incubated with 30 μM Aβ25–35 for 1 h, 3 h, 6 h, and 24 h. (B) Cell areas were quantified at 24 h using Image J software. Data were reported as mean ± SD of at least three independent experiments. * p < 0.05. Bar: 20 µm.
Ijms 22 07711 g004
Figure 5. (A) Analysis of cell migration determined by scratch assay. BV-2 were pre-treated with 5 µM URB597 for 4 h in the presence or absence of 30 µM Aβ25–35 for 2 h, 4 h, 6 h, and 24 h. T0 represents the control at time 0, and CTRL the control for each time point. (B) The results were normalized vs. T0 sample and re-ported as percentage. They represent the mean ± SD of three independent experiments. *** p < 0.001. Bar: 200 μm.
Ijms 22 07711 g005
Figure 6. Analysis of the phagocytosis process using FITC-dextran on BV-2 cells pre-treated with 5 μM URB597 and incubated with 30 μM Aβ25–35 for 24 h. (A) Representative immunofluorescence images of FITC-dextran uptake. (B) Quantization of the intensity of FITC-dextran. (C) Quantization of the number of dextran-positive cells on the total cells. The data were normalized to CTRL and reported as a percentage. The results were expressed as the mean ± SD of three independent experiments. Statistical significance was determined using ANOVA analysis by Tukey’s test. * p < 0.05, ** p < 0.01, *** p < 0.001, **** p < 0.0001. Bar: 20 µm.
Ijms 22 07711 g006
Figure 7. Pull-down assay of Rho and Cdc42 proteins (A,B). BV-2 cells were pre-treated with 5 μM URB597 for 4 h and incubated with 30 μM Aβ25–35 for 24 h. The pull-down assay with GTPγS was used as positive control. The results are reported as a percentage versus control (CTRL). Densitometric analyses were performed with ImageLab software (Biorad) and normalized to INPUT. * p < 0.05, ** p < 0.01.
Ijms 22 07711 g007
Figure 8. The mRNA expression of different inflammatory cytokines such as IL-1 β (A), TNF-α (B), TGF-β (C), and IL-10 (D), monitored by qPCR and normalized to 18S ribosome subunit. Data are shown as mean ± SD from three independent experiments performed in triplicate. Expression profiles were determined using the 2−ΔΔCT method. * p < 0.05, ** p < 0.01, *** p < 0.001, **** p < 0.0001.
Ijms 22 07711 g008
Figure 9. BV-2 cells were pre-treated with URB597 5μM for 4 h and incubated with Aβ25–35 30 μM for 24 h. LPS and IL-4 were used as positive controls for iNOS and Arg-1 markers, respectively. Representative immunofluorescence images of iNOS and Arg-1 (A). Quantitative immunofluorescence analysis of iNOS (B) and Arg-1 (D). Quantification of fluorescence signal intensity was analyzed using ImageJ software. The results are expressed as the mean ± SD of three independent experiments. ** p < 0.01. Bar 20 μm. iNOS (C) and Arg-1 (E) mRNA expressions were evaluated by qRT-PCR at 24 h. Data are shown as mean ± SD from three independent experiments performed in triplicate. Expression profiles were determined using the 2−ΔΔCT method. * p < 0.05, ** p < 0.01. *** p < 0.001, **** p < 0.0001.
Ijms 22 07711 g009
Table 1. List of primer couples generated for qPCR.
GENEForward Primer (5′–3′)Reverse Primer (5′–3′)Accession Numbers
mIL-1βGAAATGCCACCTTTTGACAGTGTGGATGCTCTCATCAGGACAGNM_008361.4
mTNF-αCTGAACTTCGGGGTGATCGGGGCTTGTCACTCGAATTTTGAGABC137720.1
mTGF-βCTCCCGTGGCTTCTAGTGCGCCTTAGTTTGGACAGGATCTGNM_011577.2
mIL-10GCCCTTTGCTATGGTGTCCTTTCTCCCTGGTTTCTCTTCCCAAGACNM_010548.2
mR18sAAATCAGTTATGGTTCCTTTGGTCGCTCTAGAATTACCACAGTTATCCAAM27358
mARG1ATGTGCCCTCTGTCTTTTAGGGGGTCTCTCACGTCATACTCTGTNM_007482.3
miNOSGGCAGCCTGTGAGACCTTTGGCATTGGAAGTGAAGCGTTTCAF427516.1
Publisher’s Note: MDPI stays neutral with regard to jurisdictional claims in published maps and institutional affiliations.

