1. Introduction
Inflammation is an important process in the pathogenesis of neurodegenerative diseases such as AD, involving activation of both microglia and astrocytes. Activated microglia includes a range of phenotypes under conditions of chronic inflammation, in which the pro-inflammatory M1 phenotype and the anti-inflammatory, “alternatively activated” M2 phenotype represent the opposite extremes of this spectrum [
1,
2]. The former is characterized by the expression of pro-inflammatory cytokines (IL-1β, IL-6, IL-12, IL-18, and tumor necrosis growth factor α (TNFα)), radical oxygen species (ROS) and nitric oxide synthase 2 (NOS2), and by impaired phagocytic activity, while the latter phenotype is implicated in phagocytosis and Aβ clearance, and secretion of anti-inflammatory cytokines as IL-4, IL-10, IL-13, and TGF-β [
2,
3,
4,
5]. In the same line, in the case of astroglia, some authors refer that this cell type is also able to switch from metabolic support cells to immunological cells, capable of producing pro-inflammatory factors [
6,
7]. Of great interest are several reports indicating that microglial dysfunction in long-term AD may be reversible and that thephagocytic activity of these cells may be modulated to reduce amyloid accumulation [
8,
9,
10].
Recent studies have uncovered that microglia, and in some cases also astrocytes, have the intrinsic ability to respond as innate immune cells to danger signals through the activation of multiprotein complexes termed inflammasomes (IF) [
5,
11]. The molecule ASC is an essential mediator of this activation, which final purpose is to generate potent pro-inflammatory cytokines, i.e., IL-1β, IL-18, and IL-33. In these complexes, ASC bridges activated cytosolic pattern recognition receptors (PRR) sensing danger signals to the effector protein pro-caspase-1. This results in caspase-1 activation, which then cleaves the pro-interleukins intotheir active counterparts. Subsequently, the cells release IL-1β, which is a key initiator of inflammation when sensed by its widely expressed receptor, triggering NF-κB-dependent transcriptional events and further cytokine production [
4,
11,
12]. The cytosolic PRR is frequently a member of the “Nucleotide-binding and Oligomerization Domain (NOD)-like Receptor (NLR) family, which contains either an N-terminal pyrin domain (PYD) (NLR family PYD containing 3: NLRP3, among others), or an N-terminal caspase recruitment domain (CARD) (NLRC4 and NLRP1, among others). ASC itself is also composed of a CARD, a PYD, and a linker between both domains [
13].
Many recent studies have implicated ASC-containing IF in the development of AD [
5,
12,
14]. FibrillarAβ is able to induce in microglial cells primed with lipopolysaccharide (LPS) the activation of NLRP3-ASC IF and of caspase-1, leading to the maturation of IL-1β [
1,
15]. In an AD murine model, the down-regulation of this IF significantly increases microglial phagocytic activity and the expression of the proteolytic insulin-degrading enzyme, thereby increasing Aβ clearance, reducing its load, and ameliorating cognitive impairment [
1]. In the case of rat primary astrocytes, danger signals as palmitate are able to induce the activation of NLRC4-ASC IF [
16]. The down-regulation of this PRR reduces the generation of Aβ levels produced by primary neurons cultured in conditioned media from palmitate-treated astrocytes [
17].Studies conducted in ASC knockout mice reveal that the levels of the component of IF ASC are inversely correlated with the phagocytic activity of glial cells and of the amyloid load [
18].
As a physiological cellular response to inflammasome activation, ASC in macrophages and microglia oligomerizes and forms micrometer-sized aggregates termed ASC specks, which are required for efficient IL-1β processing [
19,
20,
21]. In fact, these specks, which possibly function as a signal amplification mechanism for caspase-1 activation [
22], when released to the extracellular space due to inflammatory cell death, retain the ability to mature pro-IL-1β. Thus, they are sensed as endogenous danger signals and are phagocytosed by neighboring macrophages, which in turn produce IL-1β and release more ASC specks. This sequence of events may be a mechanism of inflammation transmission from cell to cell, resulting in the perpetuation of inflammation in a largely sensor-independent way [
23].
It is important to highlight that ASC is able to regulate inflammation and IL-1β processing independently of the classical caspase-1containing IF. In fact, the protein rather promotes cell-mediated responses in antigen-induced arthritis, and ininfluenza virus infection [
24]. Furthermore, ASC has been implicated in other processes different frominflammation. ASC, which is silenced by DNA methylation in many different types of tumors, acts as a tumor-suppressor agent [
25]. The pro-apoptotic mechanism of the protein is mediated by caspase-9, or caspase-8 and Bax [
24,
26]. ASC is also able to trigger another type of cell death after stimulation of macrophages with pro-inflammatory stimuli as LPS, termed pyroptosis, which is independent of the influence of IF [
27,
28]. This cell death, which is characterized by osmotic lysis, the disintegration of the cell membrane, and passive release of the intracellular pro-inflammatory cytokines, is mediated by the formation of pyroptosomes. These structures are large supramolecular assemblies composed of oligomerized ASC dimers, which rapidly activate caspase-1 [
28].
More relevant tothe present study is an important recent finding in AD patients and AD murine models, which demonstrates that ASC specks released by microglia bind rapidly to Aβand increase the formation of Aβ oligomers and aggregates. As a consequence, extracellular ASC specks act as an inflammation-driven cross-seed, which promotes Aβ pathology spreading [
21].
There are still few studies analyzing in vivo ASC expression in AD models of aged mice. AD is an age-related neurodegenerative disease, and, in the same way, neuroinflammation is notably dependent on age [
4,
5]. IL-1β is increased in the central nervous system of mice and rats with age, and fibrillar Aβ induces significantly more IL-1β in microglia prepared from aged versus young mice [
4]. Thus, age-related microglial and possibly also astrocytic changes have the potential to promote AD pathology, suggesting that age influences AD progression via modulation of glial immune responses [
5]. The Tg2576 transgenic mouse line is especially interesting for analyzing the influence of age in Aβ pathology since the development of this pathology is directly dependent on age in these mice. At 11–13 months of age, their brains show a five-fold increase in Aβ
1-40 and a fourteen-fold increase in Aβ
1-42, in addition to initial Aβ plaques which continue spreading, so that in elderly animals the plaque load is far greater and more widespread [
29,
30]. Aβ deposits in thesemice begin in the cortex and HP but then spread throughout the brain [
31].
In the present study, our aim was to analyze the expression and distribution of ASC in the HP of 20 to 22 month-old Tg2576 transgenic mice. We find herein that, in these old-aged mice, microglia, and several astrocytes surrounding Aβ plaques in the HP, expressed ASC in their soma and in most prolongations in contact with plaques. Microglia also expressed the protein in their nuclei. Apparently, in these locations, this protein was not associated either with NLRP3, NLRP1, or NLRC4. In addition, we reveal along several hippocampal strata, a not previously reported distribution of ASC in extracellular granules grouped in different foci, each of which contains one specific hippocampal astrocyte expressing cytoplasmic ASC and intimately associated with these granules. In order to analyze some aspects of the function of ASC in these locations, we give a detailed description of the relation of ASC with surrounding cells and tissue components.
3. Discussion
Among the HP of the 27 old-aged APP herein analyzed, we have found 7 HP characterized by the presence of both compact Aβ plaques and diffuse Aβ deposits (APP/P), versus 20 HP which developed mainly diffuse Aβ deposits and scarce, if any, plaques (APP/D). The 8 old-aged WT did not exhibit any type of Aβ deposits. Both types of amyloid deposits have been previously described in Tg2576 transgenic mice [
29,
31], and there does not appear to be a temporal or spatial relationship between diffuse and compact forms, since the former seem not to be a precursor of the latter [
31,
34]. We used the 6E10 antibody, recognizing specifically the amino acid residues 1–16 of human Aβ and, thereby, the isoforms Aβ
1-40, Aβ
1-42,and the precursor form APP, to detect both Aβ plaques and diffuse amyloid deposits in HP. The latter showed a characteristic fibrillar appearance in immersion-fixed brains, as has also been described by some authors [
34,
35], but not by others, who observed a more amorphous structure [
36]. Since these deposits consist only of Aβ [
34,
36], these differences may be related to the fixation procedure. In fact, in our hands, the morphological features of diffuse deposits were not accurately visualized in perfusion-fixed APP brains but required immersion fixation of the tissue.
The high number of APP with diffuse deposits and relatively few or without plaques (<10 plaques/mm2) (APP/D) could be very likely due to a low expression level of the mutated APP transgene in this group of mice versus the APP/P. In fact, the mice used in the present study originated after many crosses between animals lacking the APP transgene and those expressing it, so that the dose of the transgene in APP was probably diluted since it is a function of the number of crosses between animals.
Similar to previous reports [
34,
36,
37], in our study both microglia and astroglia displayed a different function, depending on the type of amyloid deposit to which they were associated. The microglia of APP/D HP did not respond to diffuse amyloid deposits with activation, as also referred by other authors [
37], so that APP/D HP showed similar microglial density and microglial and astroglial morphological features to the WT HP. Therefore, we questioned if these old-aged APP/D had indeed any other alteration in the HP. In this study, we show a significant reduction in the density of astrocytes and interneurons in APP/D HP when compared to those in WT HP. In addition, the percentage of animals developing ASC foci in the HP was higher in APP/D than in their APP/P counterparts (64.7% versus 42.85%), and the highest number of ASC foci/section corresponded to APP/D, but not to APP/P.Thus, although we did not analyze their behavior, old-aged APP/D exhibit hippocampal alterations that may influence the cognitive performance of this group of mice. In fact, another APP murine model developing only diffuse amyloid deposits acquires specific spatial learning deficits with age [
38].
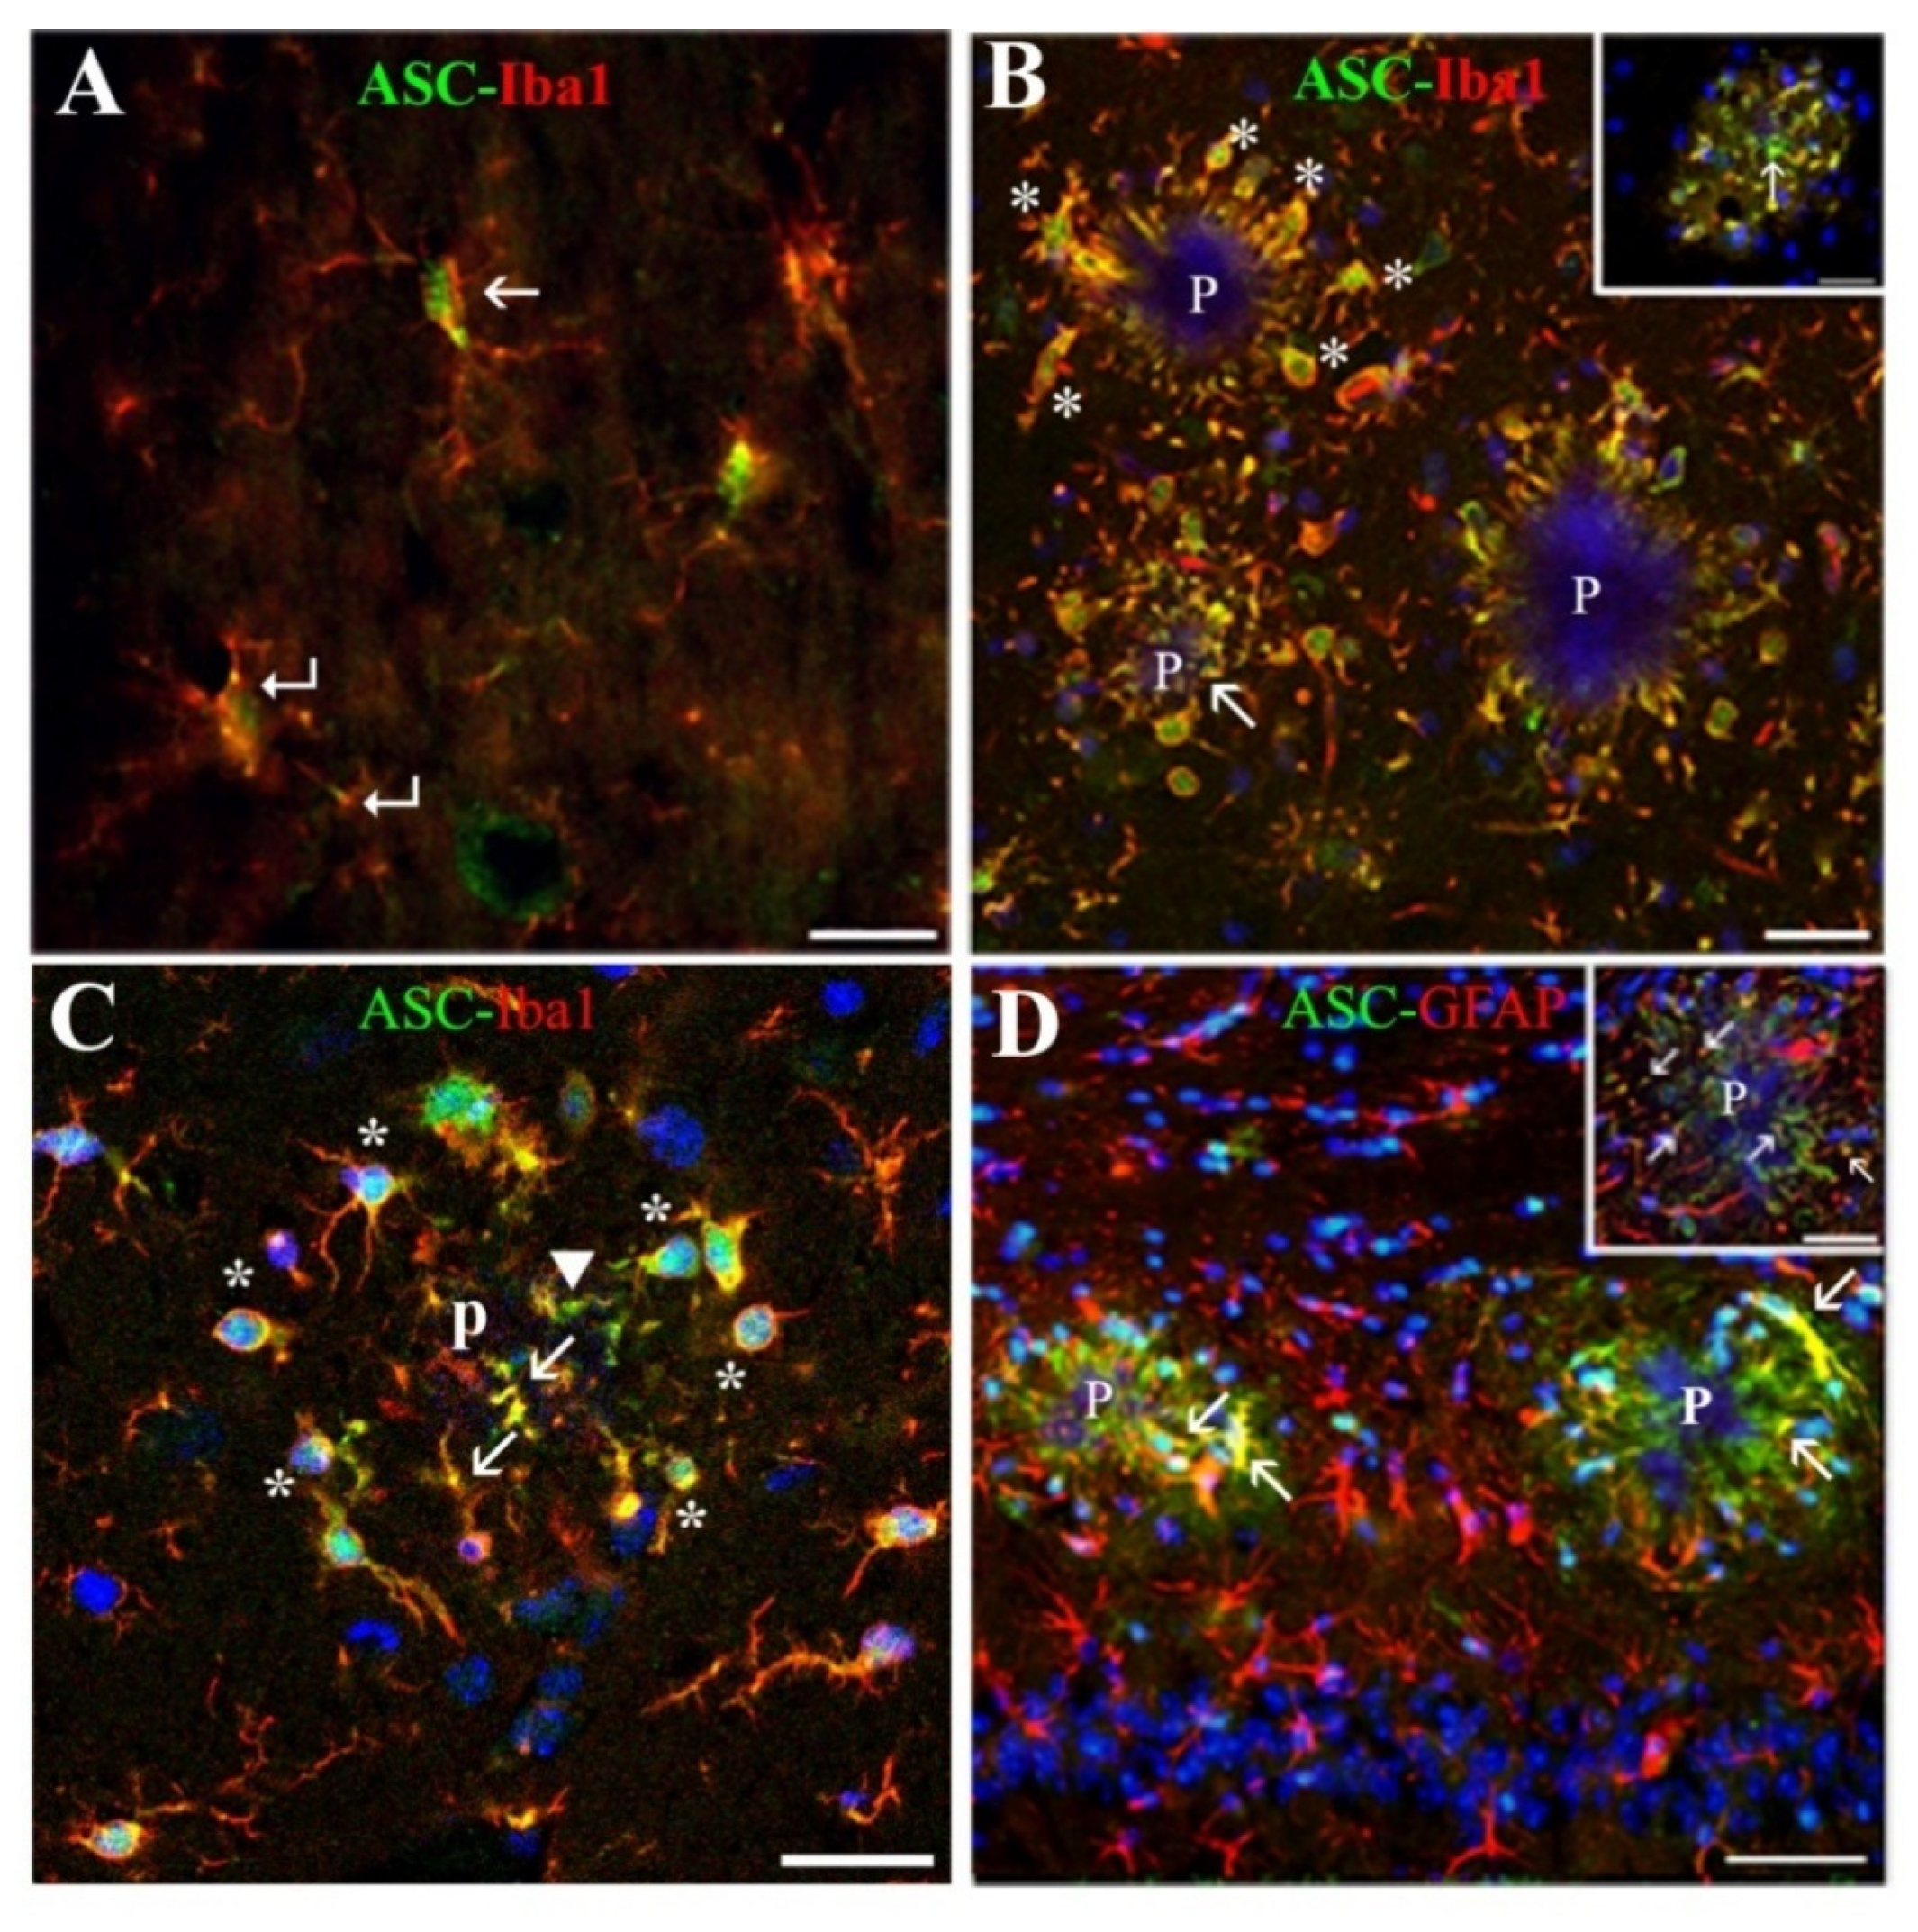
Microglial cells of APP/P HP associated with Aβ plaques, showed a polarized orientation of their processes, which could penetrate into or partially encapsulate the plaque, exhibiting very probably a phagocytic or plaque compaction activity, respectively, as has been referred in other mouse AD models [
39]. In this location, the ASC protein was expressed by all microglial cells in their nuclei, and by these cells and some astrocytes in their soma, prolongations entering the plaques and process terminals, as evaluated in confocal z-series optical sections. Therefore, a relatively high amount of ASC was seen inside the plaques. Our results are in line with other studies referring that microglia, which expresses ASC constitutively, responds to certain danger signals as Aβ with cytoplasmic aggregates of activated ASC [
15,
40]. In the case of astrocytes, the induction of ASC in these cells has also been recently reported in mice primary cultures primed with LPS and incubated with Aβ [
18], but, to our knowledge, has not been described before in in vivo AD models. Interestingly, an elevated expression of ASC has been recently reported in AD human HP using Western blot techniques [
41].
Regarding the function of this increase in ASC, some authors have referred that the amount of this molecule in microglial cells is inversely correlated with their Aβ phagocytic activity and production of proteolytic enzymes for Aβ clearance [
1,
18]. This could be the case in the present old-aged APP/P HP. The anti-phagocytic effect of ASC is associated withthe activation of IF, where the molecule recruits procaspase-1, generating active caspase-1 [
4,
11,
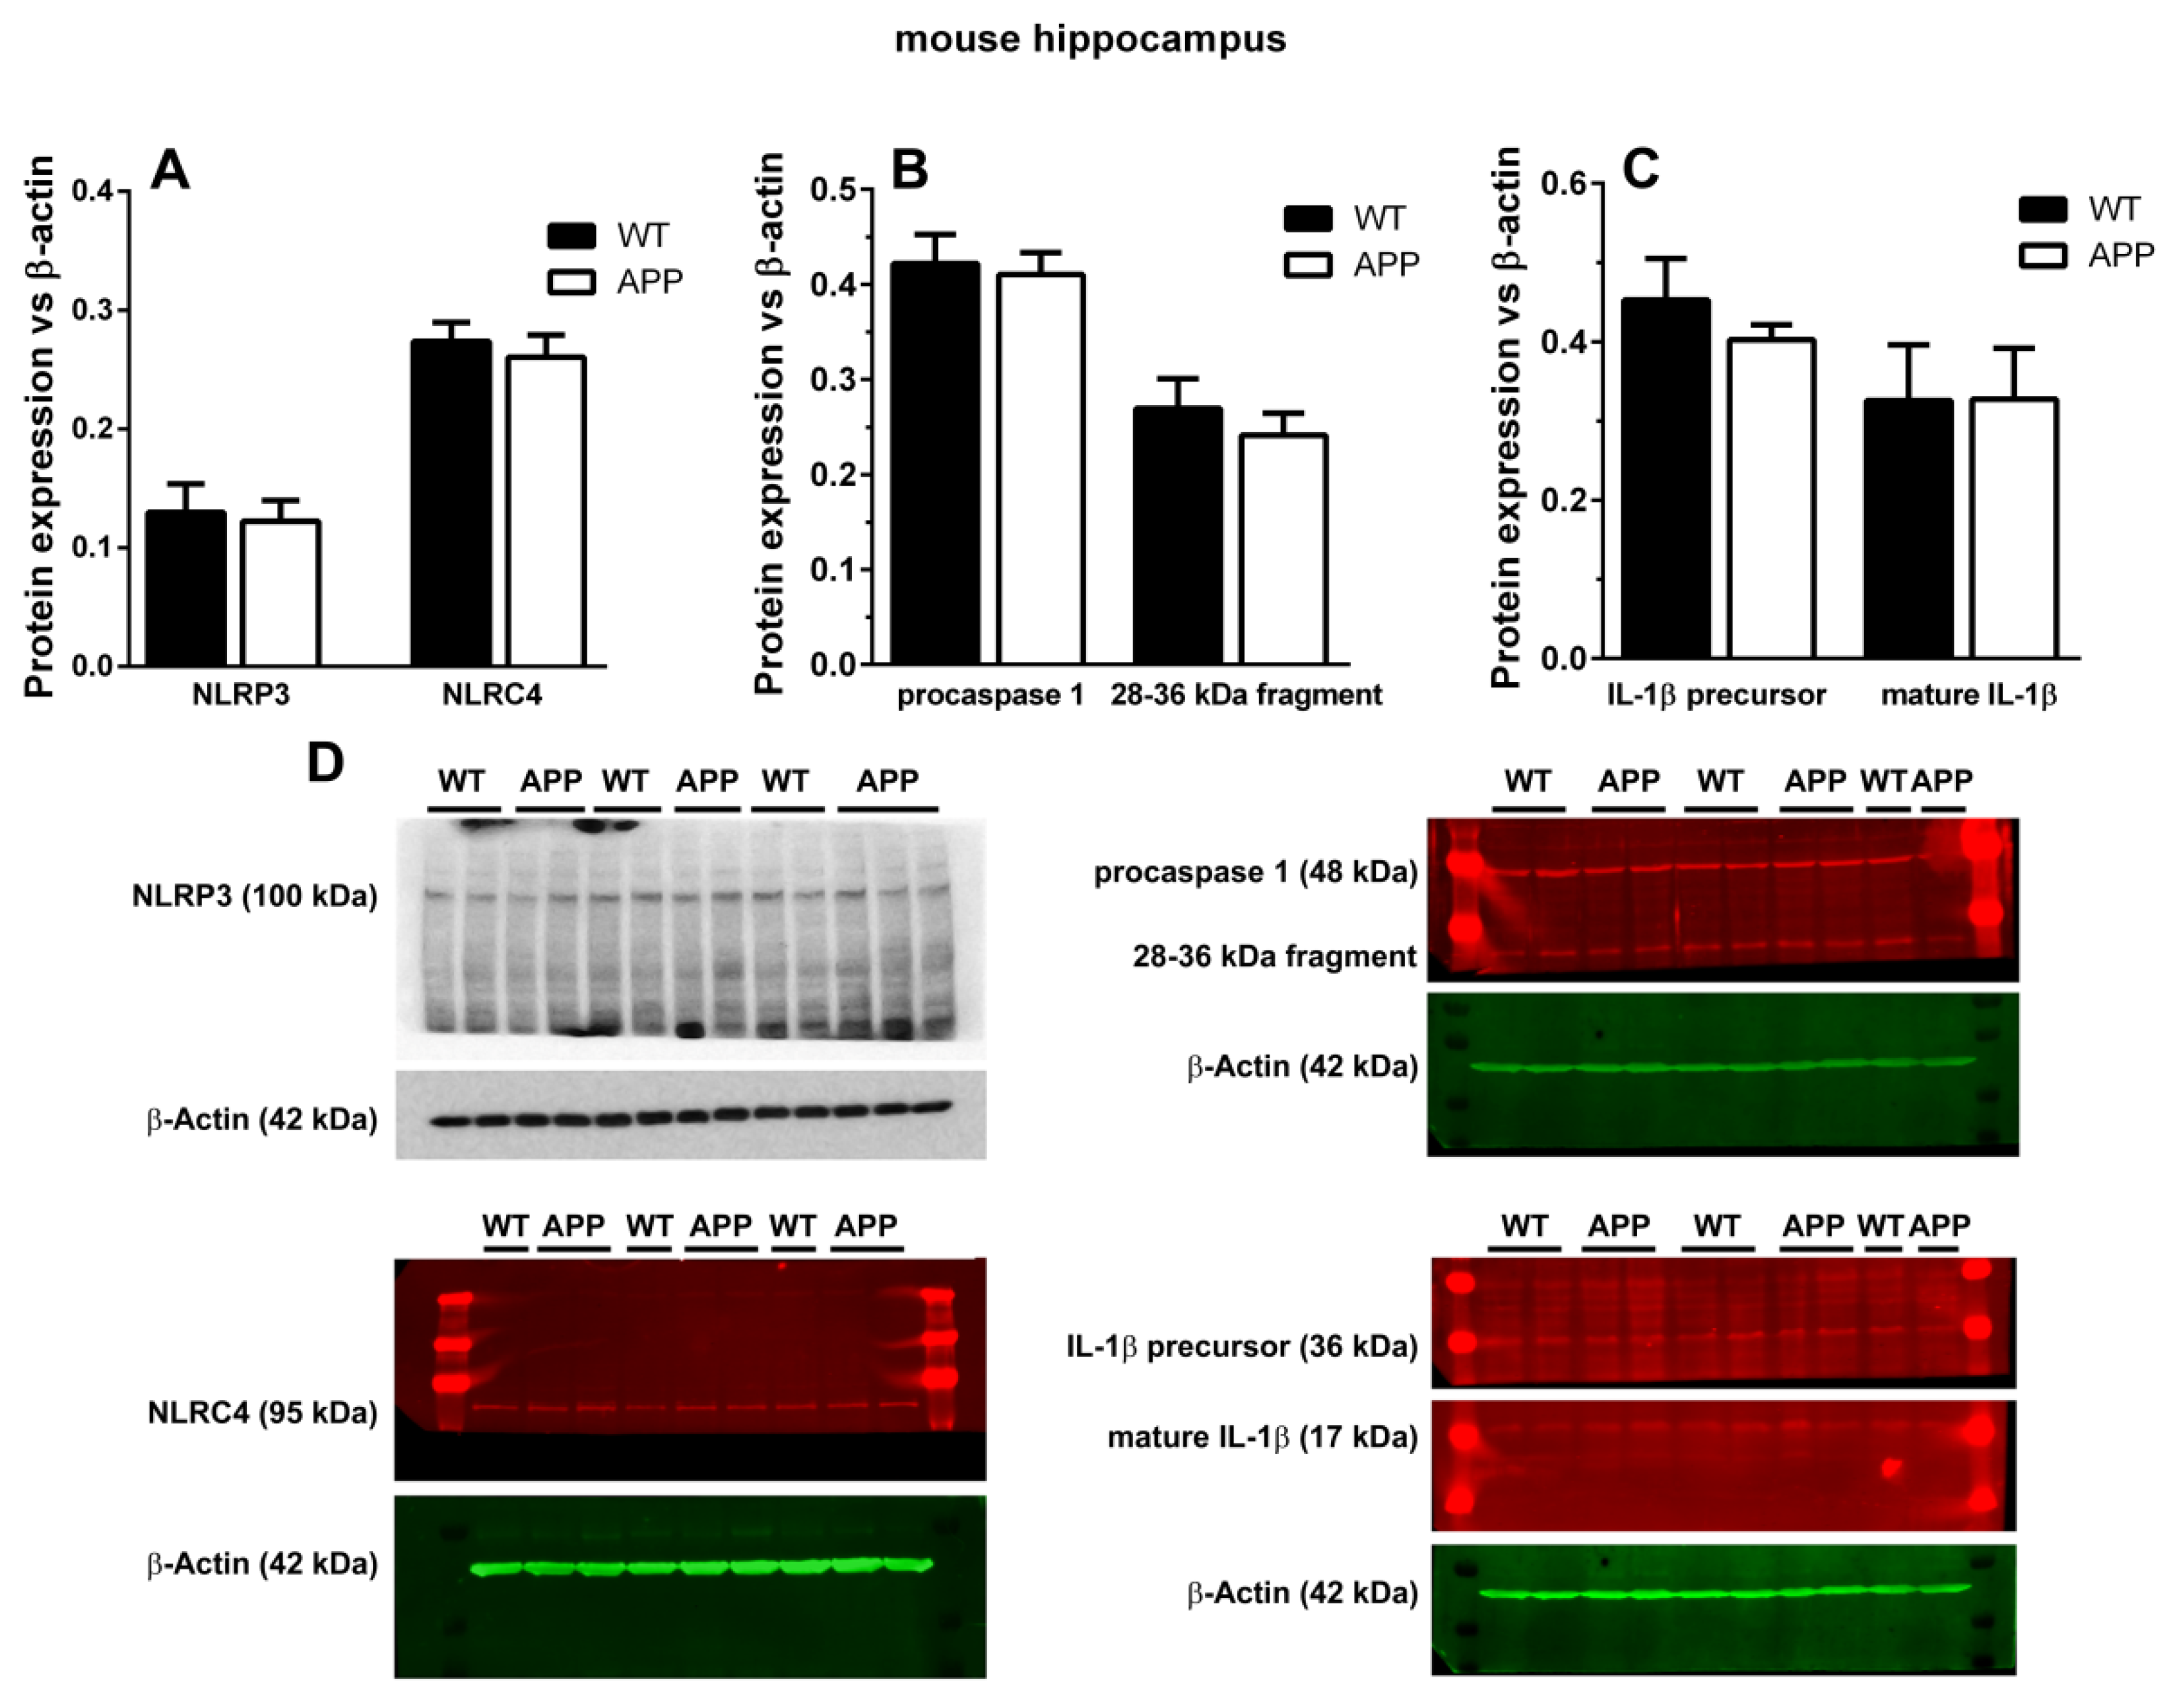
13]. However, when we analyzed the possible presence of cytosolic NOD-like receptors of danger signals in microglial cells surrounding plaques, we could not detect any specific staining for NLRP1, NLRP3, or NLRC4 in these cells, nor in astroglial cells associated with plaques. Since these results were unexpected, we complemented them with Western blot analyses, but we could not find any change in the expression levels of NLRP3 and NLRC4 between APP/P and WT, though these old-aged transgenic mice were characterized by an important increase in ASC when the same Western blot technique was applied [
10]. There were no differences in the relative optical densities of caspase-1 and IL-1β proforms and in mature IL-1β between both experimental groups. Despite performing several Western blots, we did not visualize the ~18 kDa cleaved caspase-1, but, instead, we found a 28–36 kDa fragment that could match with the 33–35 kDa caspase-1 subunit observed in human monocytes [
32] and mouse macrophages and neutrophils [
33]. In fact, it has been demonstrated that this subunit corresponds to an active caspase-1 species [
33]. We also found no differences in the levels of this protein between WT and APP mice.
These results seem to be in contradiction with previous in vivo studies, where the authors immunohistochemically detect NLRP3 in microglia surrounding Aβ plaques in the HP of 16 month-old APP
swePSEN1
dE9 mice, using the same anti-NLRP3 antibody as us [
1]. Since the authors infer from this result and other experiments the presence of NLRP3 IF in microglial cells associated with plaques, we do not include in the manuscript a confocal image exhibiting the co-localization of ASC and NLRP3 in these cells. On the other hand, the differences in the immunodetection of NLRP3 in their results versus ours may be due, not only to different tissue processing and immunohistochemical procedures but, more importantly, to the use of a different animal model of AD, since our results were obtained from 22 month-old single-mutated APP
swe mice, while Heneka et al., 2013, analyzed 16 month-old double-mutated APP
swePSEN1
dE9 mice. We do not know which is the function of ASC present in microglia and astrocytes associated with plaques in the old-aged APP herein studied. However, we can predict that, if this protein is released into the extracellular space, for example through microglial death, it could promote new Aβ deposition and Aβ cross-seeding, as has been shownin an important recent contribution in double mutant APPswePSEN1dE9 [
21].We did not analyze if glial cells containing ASC in Aβ plaques died, but, since ASC is implicated both in apoptotic and in pyroptotic cell death [
13,
25,
26], further studies, as TUNEL analysis or Gasdermin D immunodetection, would be of interest.
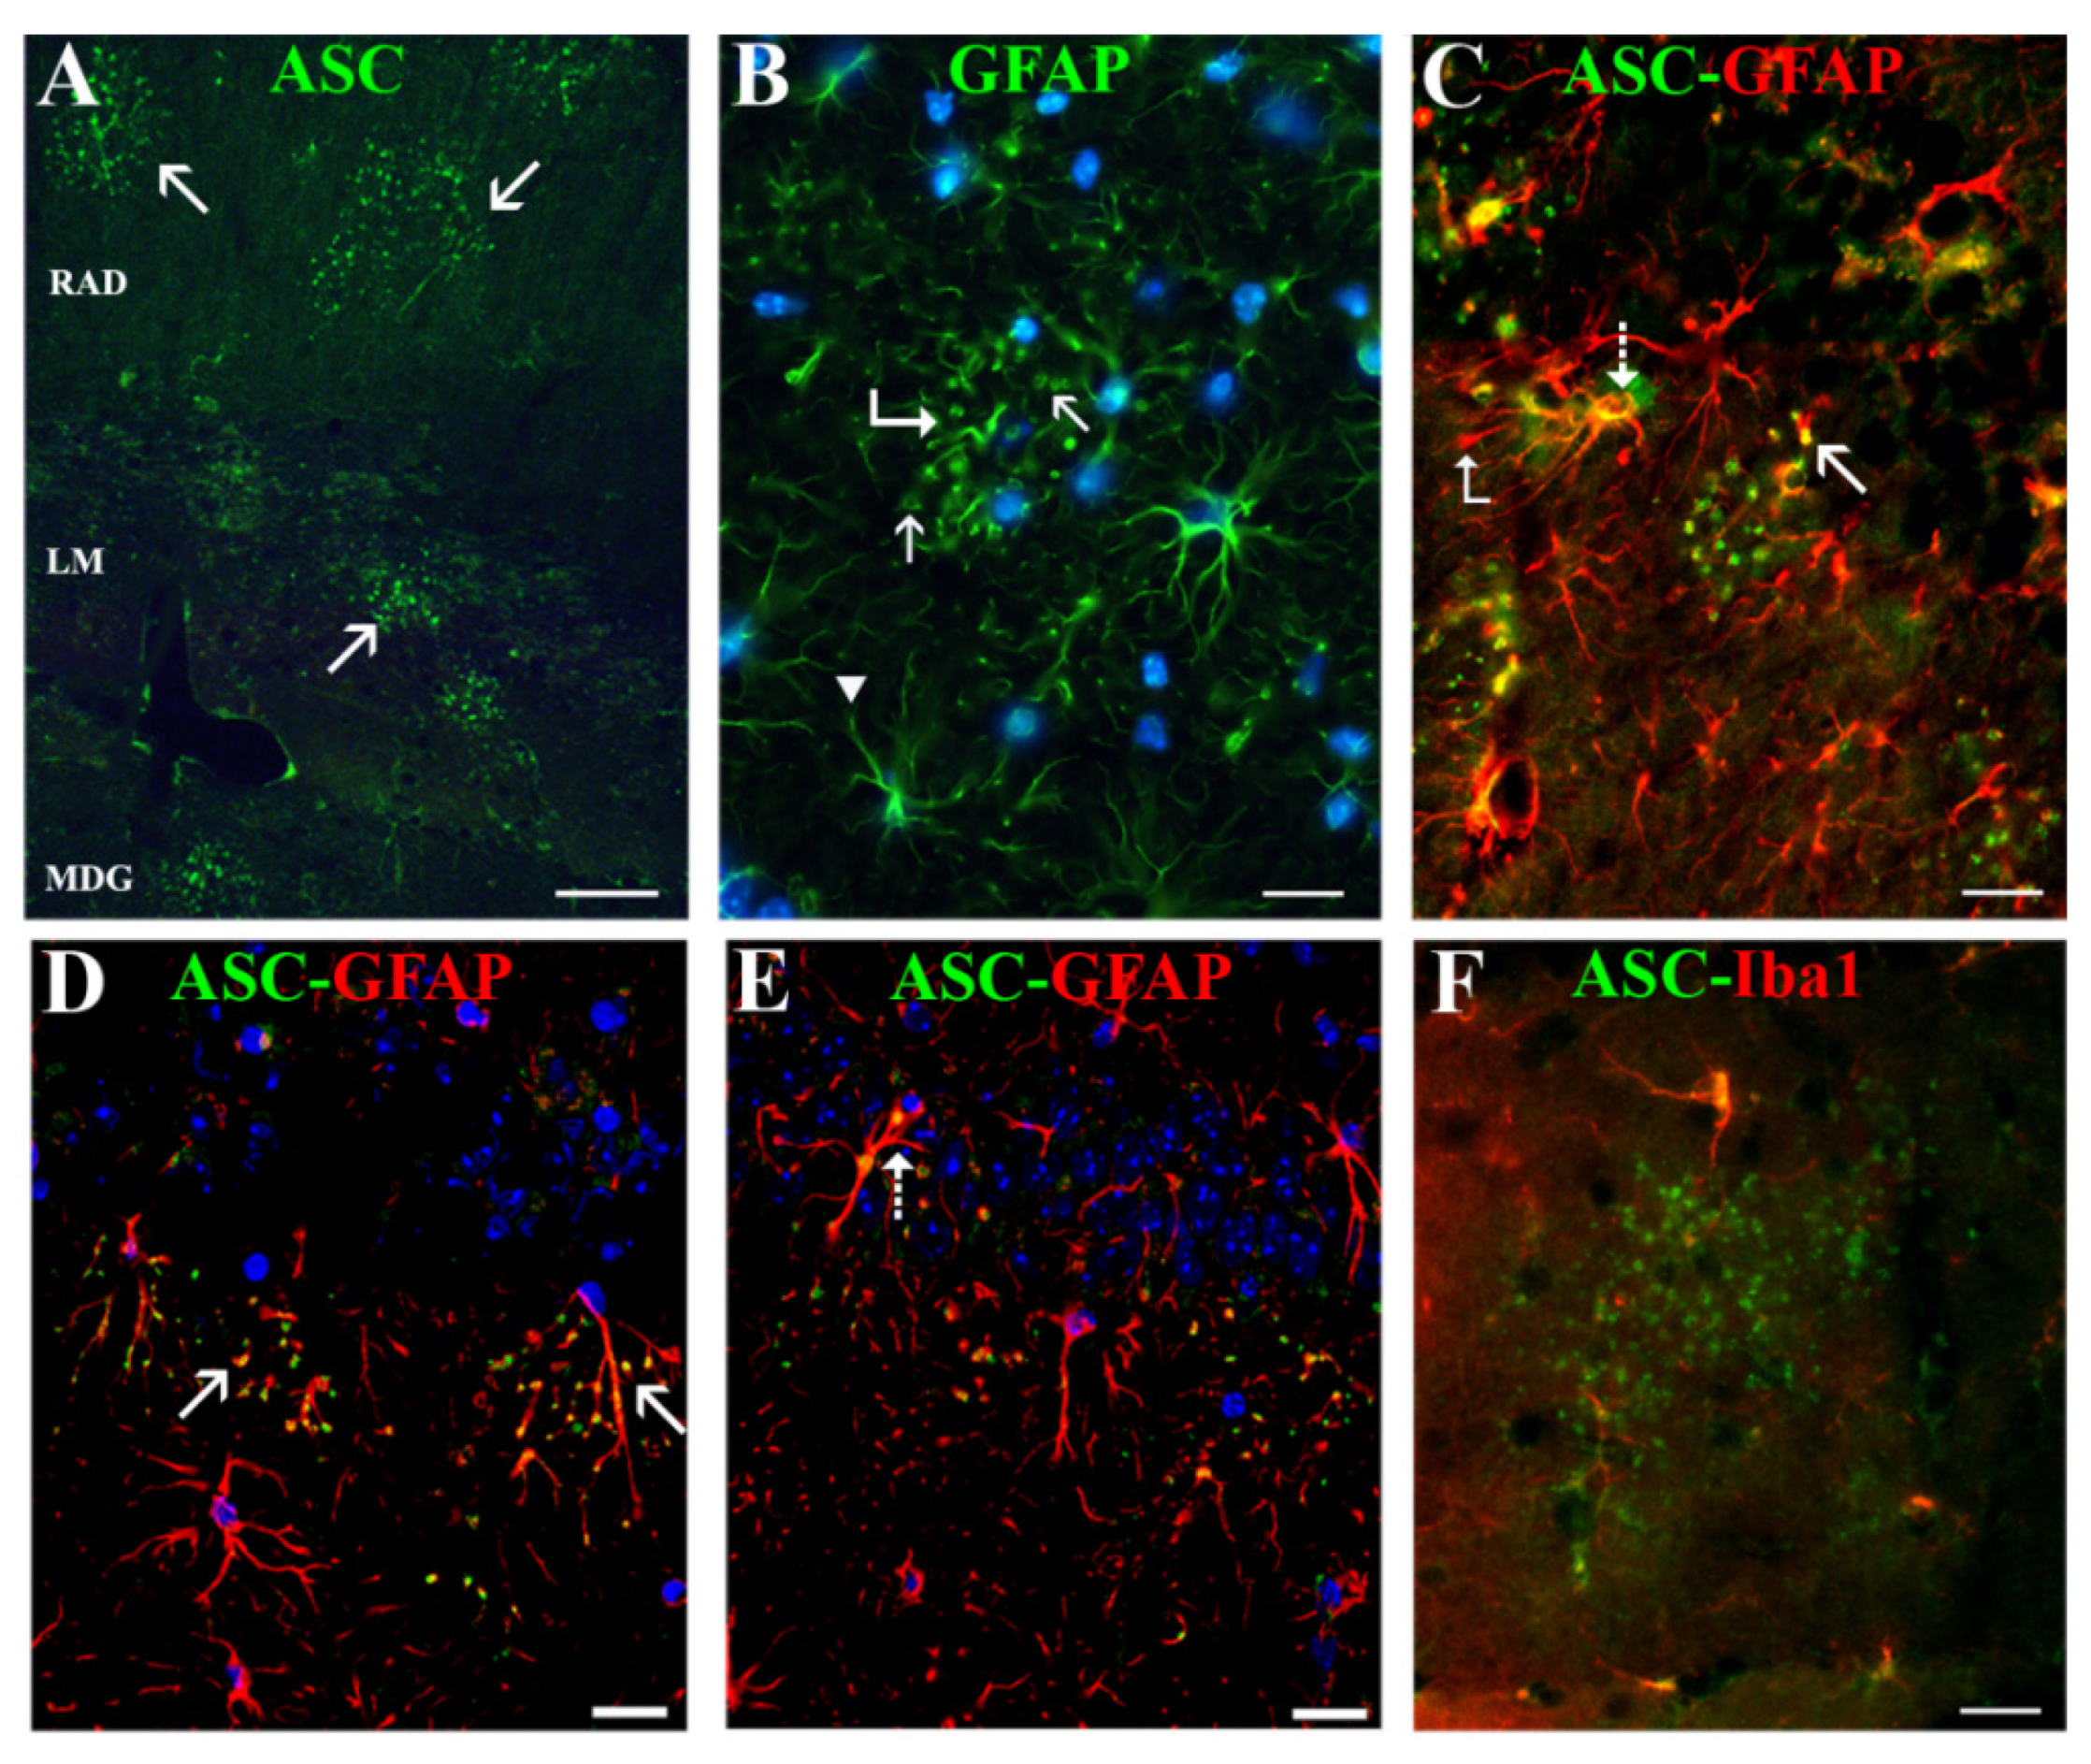
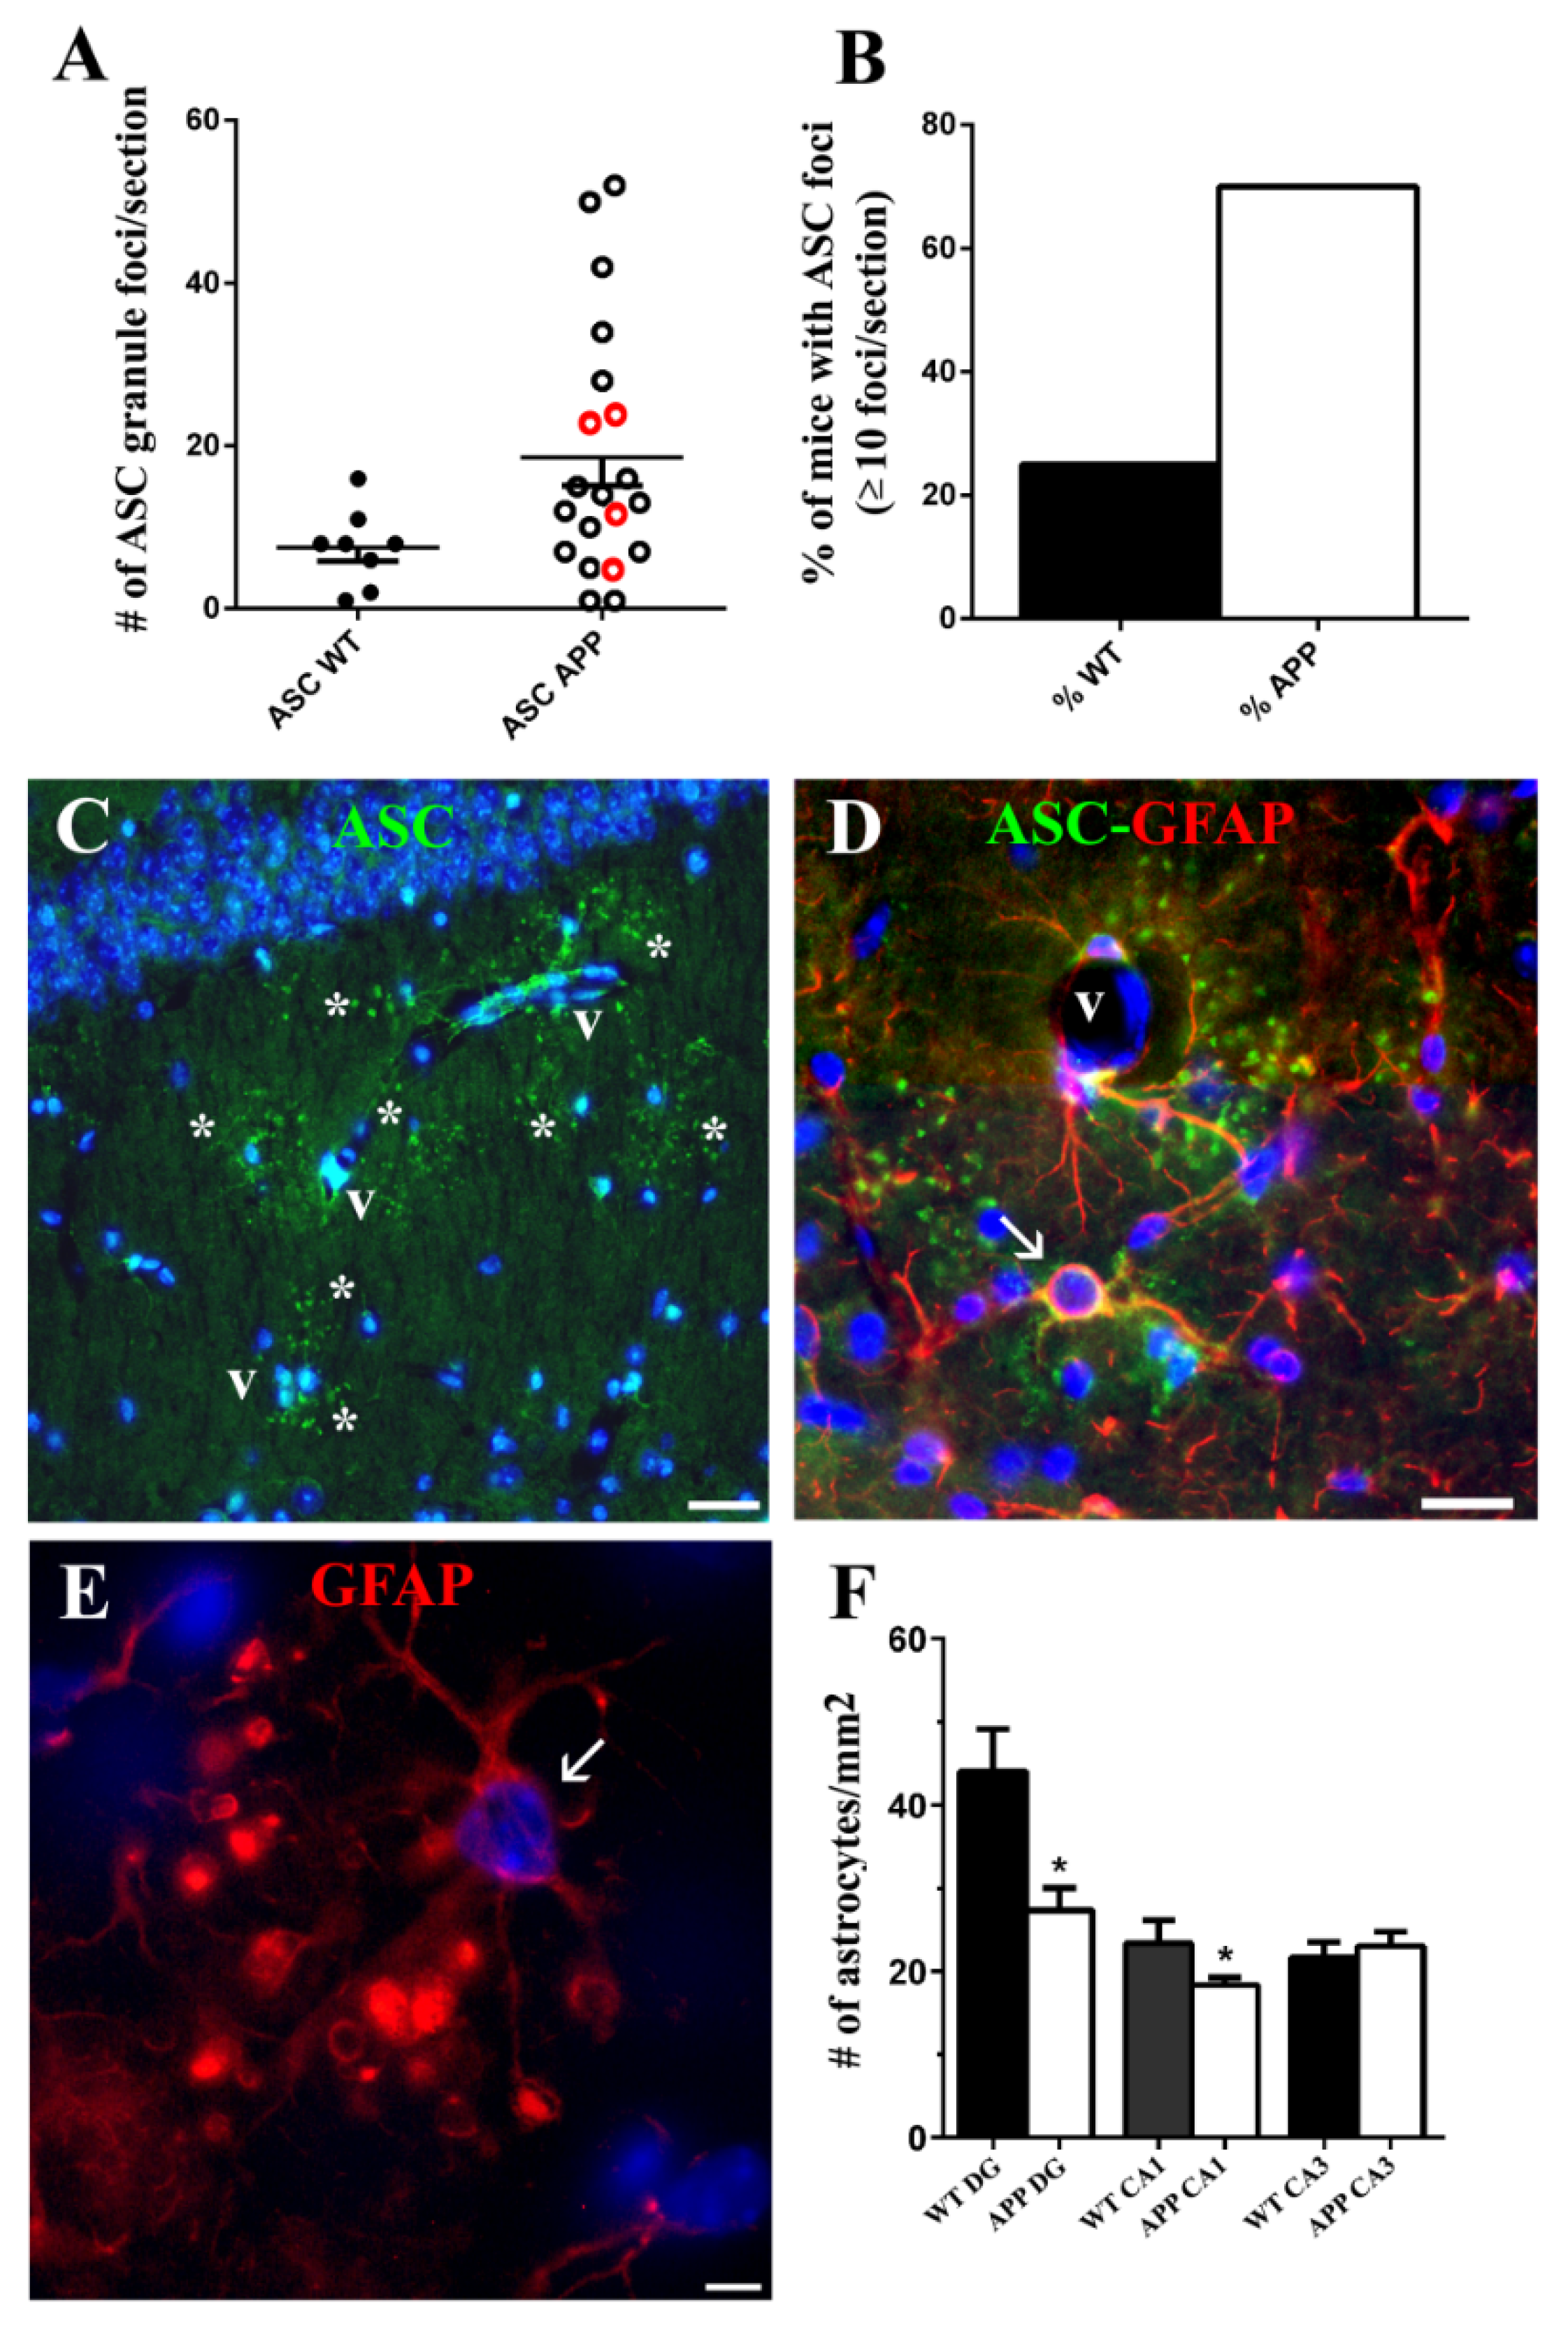
We discovered a new, not previously reported, ASC distribution not related to Aβ plaques in the cytoplasm of a specific type of hippocampal astrocyte associated with extracellular granules containing also this protein. The granules, which resembled ASC specks described by other authors [
23,
42], were visualized with the anti-ASC antibodies from Santa Cruz Biotechnology Inc., and with those from Acris Antibodies GmbH, but not with the specific antibody from Adipogen Corp. Since different ASC isoforms have been discovered [
43], the possibility exists that the two former antibodies reacted with an ASC isoform which was not recognized by the latter antibody. ASC-positive granules were grouped in discrete clusters or foci dispersed throughout the strata RLM and were absent in the extra-hippocampal regions present in the coronal sections herein analyzed (cortex, thalamus, hypothalamus). Serial optical sections obtained through confocal microscopy confirmed that the ASC granules were extracellular and surrounded specific astrocytes, or were contained inside their secondary processes or process terminals. This latter disposition gave the astrocytes a special morphology characterized by process varicosities and ring-shaped or spherical terminals. With the exception of some astrocytes surrounding amyloid plaques, from all the hippocampal astroglial population herein analyzed only these specific astrocytes associated withASC granules expressed ASC in their cytoplasm
The foci of ASC granules were related to the advanced age of mice, since they developed also in 20-month-old WT, but were not present in 10-month-old APP and WT nor in 3-month-old WT (data not shown). However, the incidence of animals developing ≥10 ASC granule foci per coronal section was nearly three times higher in old-aged APP than in old-aged WT. In spite of this correlation, ASC granule foci were not spatially related to Aβ plaques and were also present in WT, which had no amyloid deposits. In fact, the incidence of foci was especially remarkable in the APP/D group with few or no plaques, which included HP exhibiting the highest number of ASC foci. Therefore, we cannot consider that these ASC foci might be the origin of Aβ plaques.
Several studies have revealed that brain aging in mice leads to a progressive appearance and expansion of extracellular granular structures containing high levels of polysaccharides, which have a complex chemical and ultrastructural composition [
44]. Their arrangement in clusters, hippocampal distribution, and association to astrocytes are very similar to those of ASC granules described in the present study. Since the authors demonstrate that IgM antibodies, which are contaminants in numerous commercial preparations of IgG antibodies, tend to bind to these granules showing false immunohistochemical positive staining, we analyzed if the ASC immunostaining detected by us, in granules, was true and not due to the presence of these contaminants. From our results, we conclude that the granular structures described by others, and observed by us in our study, in fact contain ASC. It is possible that the complex chemical nature of these granules might be due to the non-specific but stable co-aggregating properties of diverse cytosolic proteins on ASC specks [
45]. By contrast, the NLRC4 immunopositive staining that we also detected in ASC granules was unspecific, since it was due to an IgM contaminant in the primary antibody that bound to the granules. We also did not detect NLRP1 or NLRP3.
The pathogenesis of ASC granules in the hippocampus of old-aged mice and the exacerbation of these structures in APP mice is for us unknown, but they might be a result of inflammatory events and pyroptotic cell death in this area of the central nervous system. There was a remarkable association of foci of ASC granules with some blood vessels of the HP. It has been demonstrated that the paravascular system for cerebrospinal and interstitial exchange of waste products slows down with age and possibly in AD [
46,
47]. Since this pathway, which is probably the physiological way of clearance of ASC granules from the HP, is very likely impaired in the old-aged APP mice of this study, ASC granules might accumulate extracellularly, next to perivascular astrocytes, as we in fact observed. In this location, they might be sensed as a danger signal by these astrocytes, which might capture them in order to remove them from the extracellular space, similarly to the described behavior of macrophages [
23,
48]. This clearance process might damage or even kill these ASC-associated astrocytes through pyroptosis, and, in turn, these damaged cells might release ASC specks to the extracellular parenchyma, thereby propagating this pathology in a prion-like manner. In fact, in some strata radiatum of APP/D HP herein analyzed these specific astrocytes represented as much as 20% of all astrocytes, strongly suggesting an outcome of chronic inflammation. Especially in those cases where these astrocytes were abundant, some of them showed features compatible with damage, as aberrant enlargement of the ring-shaped process terminals containing inclusions. It is possible that these features do not reflect death but rather an atrophy, which is, together with reactivity, the reported astrocyte damage associated with AD [
49]. However, since we have found a significant decrease versus WT of astrocyte density in the stratum radiatum of the HP in APP/D, the possibility exists that ASC-associated astrocytes ultimately die. The decrease inastrocytes with AD progression over age has also been detected by others in the HP and prefrontal cortex of experimental AD transgenic mice [
50]. Age in itself does not seem to vary the number of astrocytes in neocortices of the human brain or in the HP of 21-month-old rats, though the volume of astroglial domains increases about 2 times [
50].
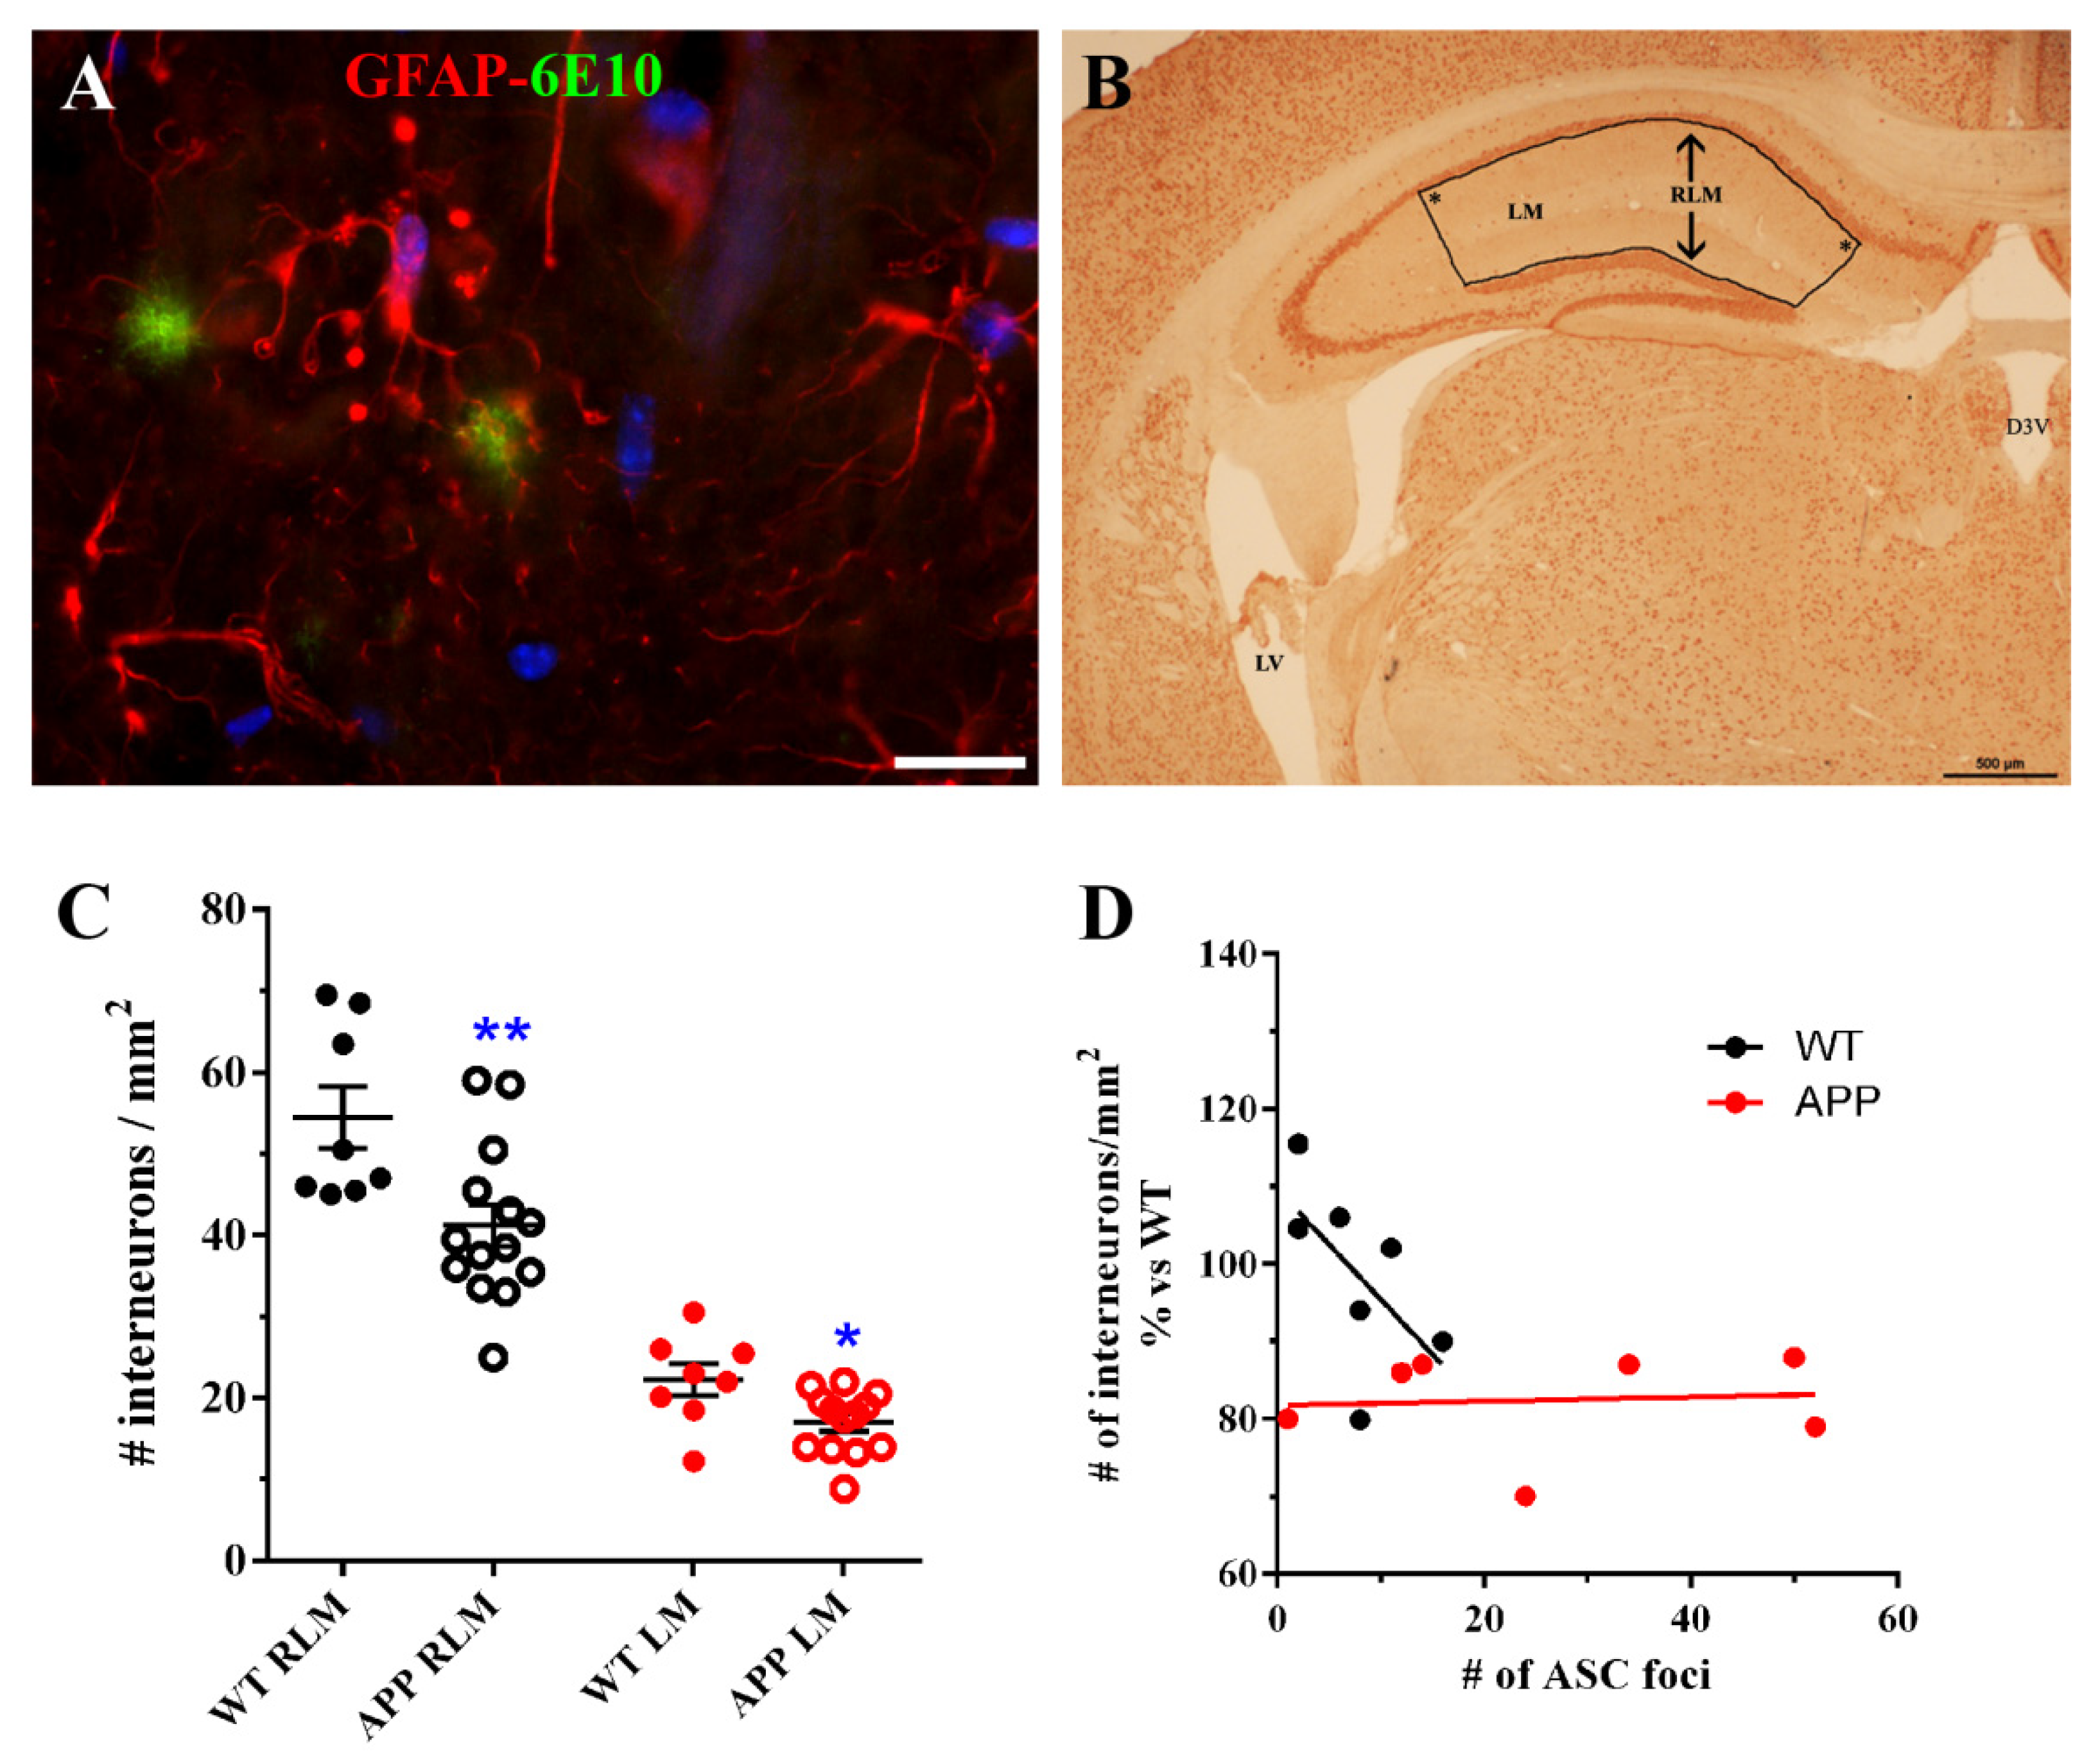
In an effort to know which implications our findings could have on the neuronal population, we quantified hippocampal interneurons present in strata RLM of old-aged APP/D and WT HP. Surprisingly, we found that the number of these neurons was significantly reduced in APP versus WT. We found also a reduction when only interneurons in which soma was located in the LM were quantified. To our knowledge, our data on the reduction of interneurons in HP inmurine models of AD, have not been reported previously. Nevertheless, our results should be considered with caution since we were unable to use a stereological approach in the neuronal quantification method (see Materials and Methods) due to a small amount of sample at the time we designed these experiments. Thus, the present results must be further verified in a more accurate future study. It is known that neurons of the human entorhinal cortex that send projections to the CA1 HP are the first degenerating cells in AD [
51,
52]. The LM is an area of integration and serves as a relay between the entorhinal cortex and the CA1 HP. Since interneurons in this layer are likely to modulate the strength and temporal structure of entorhinal-CA1 hippocampal dynamics, influencing distinct aspects of spatial and episodic memory [
53], the partial lack of these cells must influence the HP circuitry and the behavior of old-age APP. On the other hand, we reasoned that the reduction ininterneurons in strata RLM could be related to the presence of deleterious ASC granules associated to astrocytes in the same strata of HP. However, our results indicated that there was no correlation between number of ASC foci and the density of interneurons in these APPs.
In conclusion, our results in the HP of old-aged APP mice showed a relatively large amount of ASC in Aβ plaques, which was of microglial and astrocytic origin and apparently not associated with PRR commonly described in glial cells. In addition, we revealed that the development of foci of ASC granules dispersed throughout the HP, which incidence was higher in old-aged APP than in their WT counterparts, and which were not spatially related with Aβ plaques but to a specific type of astrocyte. Our results suggest the implication of these astrocytes in ASC clearance, and in the propagation of the inflammation mediated by this protein
4. Material and Methods
4.1. Ethics Statement
The Ethics Committee of the Hospital Ramón y Cajal, Madrid (animal facilities ES280790002001) approved all the protocols related to the use of laboratory animals. All procedures associated with animal experiments were in accordance with Spanish legislation (RD 53/2013) and the European Union Council Directive (2010/63/EU).
4.2. Transgenic Mice
The Tg2576 line over-expressing human APP695 was used as a model of AD in this study. This line, generously donated by Dr. Carro [
54], contained the human mutated APPswe that included the double mutation M671L and K670N under the control of the prion protein promoter [
29]. Mice developed age-dependent AD-type neuropathology [
29]. An intercross between APP Tg2576 and wild-type (WT) C57BL6 was performed in order to obtain WT littermate controls. Transgenic animals were generated by breeding the mice according to the following diagram (Equation (1)):
(the numbers in brackets show the expected/found genotype frequencies of the offspring expressed in percentage). For the present study, 13 WT and 38 transgenic mice (APP) of 20 to 22 months of age were used.
4.3. Genotype by PCR
The genotype of each animal was confirmed as described by Carro et al. [
54]. Genomic DNA was extracted from the mouse tail using the High Pure PCR template preparation kit (Roche, Barcelona, Spain) according to the manufacturer’s instructions. Briefly, 150 ng of DNA was amplified by polymerase chain reaction (PCR) using the specific primers described in [
54] to detect mutant human APP sequence.
4.4. Antibodies and Immunochemicals
The primary antibodies used were: three different rabbit polyclonal anti-ASC antibodies: (1:50, sc-22514-R, Santa Cruz Biotechnology Inc., Dallas, TX, USA), (1:50, AP06792PU-N, Acris Antibodies GmbH, Herford, Germany), (1:50, AG-25B-0006, Adipogen Corp., San Diego, CA, USA); mouse monoclonal anti-Aβ antibody (6E10, 1:100, SIG-39320, Covance, Emeryville, CA, USA); two anti-Iba1 antibodies: rabbit polyclonal (1:100; Wako Chemicals USA, Inc., Los Angeles, CA, USA), mouse monoclonal (1:200, MABN92, Millipore Corp., Massachusetts, MA, USA); mouse monoclonal anti-NLRP3 antibody (1:200, AG-20B-0014, Cryo-2, Adipogen San Diego, CA, USA); two different anti-NLRC4 antibodies: goat polyclonal (1:25, sc-49395, Santa Cruz Biotechnology Inc., Dallas, TX, USA), rabbit polyclonal (1:50, AVARP00019-P050, Aviva Systems Biology, San Diego, CA, USA) two anti-glial fibrillary acidic protein (GFAP) antibodies: rabbit polyclonal (1:200, 20334, DakoCytomation, Glostrup, Denmark), mouse monoclonal (1:400,Mab360, Millipore Corp., Massachusetts, MA, USA); mouse anti-neuronal nuclei (NeuN) (1:100, Mab377, Chemicon International Inc., Temecula, CA, USA).
The secondary antibodies used were: Alexa Fluor-568 goat anti-mouse IgG, Alexa Fluor-488 goat anti-rabbit IgG, and Alexa Fluor-568 donkey anti-goat IgG (1:400, Molecular Probes, Eugene, OR, USA); fluorescein-conjugated goat anti-mouse IgG (1:25, Jackson Immuno Research Laboratories Inc., West Grove, PA, USA); rhodamine-conjugated goat anti-rabbit IgG (1:100, Chemicon International Inc., Temecula, CA, USA); fluorescein-conjugated goat anti-rabbit IgM mu chain (1:50, ab98458, Abcam, Cambridge, MA, USA), fluorescein-conjugated rabbit anti-goat IgM (1:200, ab112861, Abcam, Cambridge, MA, USA).
4.5. Tissue Processing and Immunohistochemistry
The brains of 8 WT and 27 transgenic APP mice were fixed through intracardial perfusion under deep anesthesia with 10 mL of heparinized isotonic saline, followed by 40 mL of 4% paraformaldehyde (PFA). Brains were post-fixed in the same solution for 24 h at 4 °C, cryoprotected and frozen, before sectioning into 20 µm-thick coronal sections in a cryostat. In addition, we processed the brains of 5 WT and 11 APP through fixation immersion with 4% PFA, since with this procedure we noticed that the visualization of diffuse Aβ deposits was more accurate. Fixed brains were subsequently cryoprotected, frozen, and sectioned as above. For quantitative studies of immunostained cells, structures, or molecules in the dorsal HP, only coronal sections of the perfusion-fixed brains were analyzed, located at similar antero-posterior levels, i.e., −1.7 to −2 mm from Bregma [
55].
Tissue sections were mounted on coated FLEX IHC microscope slides (DakoCytomation, Glostrup, Denmark), treated with sodium acetate 10 mM, pH 6.0, at 95°C for 4 min, and blocked with 5% normal goat serum (NGS) (or 5% normal donkey serum (NDS) in the case of goat anti-NLRC4 antibody) in 0.1% Triton-X 100 in phosphate buffer saline (PBS), pH 7.4, for 30 min. Primary antibodies diluted in 0.5% NGS or NDS in 0.01% Triton X-100 in PBS were applied for 24 h at 4°C, and were visualized using appropriate fluorescent secondary anti-rabbit, anti-mouse or anti-goat antibodies diluted in 0.5% NGS or NDS in 0.01% Triton X-100 in PBS, during 1 h at room temperature. In order to stain cell nuclei, tissue sections were incubated in 30μM bisbenzimide (Hoechst 33342; Sigma-Aldrich, Saint Louis, MO, USA) in PBS for 5 min, and were thereafter washed in PBS and coverslipped in a medium containing p-phenylenediamine. For double immunolabeling, both primary antibodies directed to two different species were applied at the same time to the sections after the pretreatment steps, followed by incubation of the sections with the appropriate secondary antibodies. Care was taken when selecting secondary antibodies for double immunostainings in order to avoid cross reactions. Since our secondary antibodies were mostly made in goats, goat polyclonal anti-NLRC4 antibody was not used for double immunostainings. In the case of Aβ immunodetection in plaques, sections were pretreated with 70% formic acid for 20 min at RT, followed by the blocking step. In double immunolabeling experiments, Aβ detection was performed after the immunohistochemical procedure for visualization of the other antigen was completed.
An immunoperoxidase technique was used for NeuN detection. The treatment steps previous to primary antibody incubation were as above, but a step for endogenous peroxidase quenching was added before the blocking step (incubation in 1% hydrogen peroxide in PBS for30 min). For the secondary antibody incubation, a biotinylated goat anti-mouse IgG (BA-9200, 1:300, Vector Labs, Burlingame, CA, USA) was used during 1 h at room temperature, followed by a Peroxidase-Streptavidin Conjugate (1:200, 43-4323, Life Technologies, Carlsbad, CA, USA) treatment during a similar period. Finally, the reaction product was detected with diaminobenzidine (DAB) + substrate–chromogen system (DakoCytomation, Glostrup, Denmark). In these sections, nuclei were also visualized with bisbenzimide, as described above.
Immunohistochemical staining was analyzed with a standard fluorescence microscope, but for several analyses, a Nikon ECLIPSE Ti-e C1 confocal microscope (Nikon Instruments Inc., Tokyo, Japan) was used and z-stack series were performed.
4.6. Quantitative Analysis
For quantification of hippocampal Aβ 6E10-positive plaques, microglial Iba-1-positive cells, and astroglial GFAP-positive cells, a panoramic view of each hemisphere was obtained from one representative coronal section for each immunohistochemical technique and for each brain. In these panoramic views, obtained by using the stitching tool coupled to the Nikon ECLIPSE Ti-e microscope and the 10x objective, the transversal surface of the dorsal hippocampus and dorsal cortex of each cerebral hemisphere could be visualized. We quantified: (a) the number of 6E10-positive Aβ plaques/mm
2 given as the mean ± SEM obtained from the data of both hippocampal hemispheres in 5 APP mice; (b) the number of Iba-1-positive microglial cells/mm
2 in 2 different hippocampal areas of each cerebral hemisphere, one of them localized in the polymorphic layer of the dentate gyrus (DG) (hilus), and the other in the strata radiatum and lacunosum-molecularis of the HP, and the stratum molecularis of the DG (RLM). The data in the graph represent the mean obtained from the data of both hippocampal hemispheres in 3 WT, 4 APP with Aβ plaques (APP/P), and 3 APP with diffuse amyloid deposits (APP/D) (
Figure 1E); (c) the total number of foci of ASC granules per coronal section of HP and DG, given as the sum of ASC foci of both hemispheres in 8 WT and 20 APP (4 APP/P and 16 APP/D). Animals with no ASC foci were not included (
Figure 5A); (d) the number of astrocytes/mm
2 in 3 hippocampal regions: hilus of DG, radiatum of CA1 and radiatum of CA3 in 3 WT and 3 APP/D (
Figure 5F). The number of NeuN-positive interneurons/mm
2 present in strata RLM or only in LM were quantified in the bounded area (
Figure 6B) of hippocampal coronal sections at ~−2mm from Bregma (
Figure 6B), in 6 WT and 13 APP/D with ≥10 ASC foci per section. Care was taken when delineating the bounded area, which always had right angles in the locations marked by an asterisk in
Figure 6B, in order to assure similar surfaces between different sections where interneurons were quantified. Each data entered in the graph (
Figure 6C) represent the mean ± SEM of interneuronal densities from both hippocampal hemispheres of each analyzed coronal section. For the correlation studies between the interneuron density in RLM and the total number of foci of ASC granules per section, 6 WT and 7 APP were selected, including in both groups those animals with the highest number of ASC foci (
Figure 6D).
4.7. Brain Regions and Tissue Preparation for Biochemical Analysis
The HP of 5 WT and 5 APP/P were used for Western blot procedures. In order to select for this study, only those APP that developed a significant number of plaques in their HP, brains were sagitally sectioned through their midline, so that the right part of the HP was dissected and rapidly frozen for Western blot and the left part of the brain was fixed by immersion in 4% PFA for histological analysis of plaques. Those brains with few or without plaques were discarded.
After decapitation, the brain was extracted and HP was free-hand dissected, then the samples were frozen on dry ice. For protein extraction, dried tissue samples were weighed and placed in six volumes (W/V) of PBS with protease inhibitor cocktail 1× (Calbiochem) and 20 mM N-ethylmaleimide to inactivate deubiquitinating enzymes and subjected to two 30-srounds of sonication. The lysates were immediately boiled for 5 minand centrifuged at 12.000× g at 4 °C for 30 min. The supernatant-PBS-inhibitors was defined as the soluble fraction and was used for protein analysis by Western blot. To obtain the total (soluble plus insoluble) fractions, the initial homogenate (200 μL) was extracted with 5 M guanidine in 6 mM Tris–HCl, pH 8.0 by rotating the sample at room temperature overnight. The sample obtained after guanidine extraction represented the total fraction. Soluble and total fractions were used for protein analysis by Western blot.
4.8. Western Blot
Samples (20–40 μg) were added to sodium dodecyl sulfate (SDS) sample loading buffer 2× (10% glycerol, 2% SDS, 0.1% bromophenol blue, 50 mM Tris, pH 6.8 and 5% β-mercaptoethanol), electrophoresed in 10–15% SDS-polyacrilamide gels and then electro blotted to 0.45 μm nitrocellulose membranes. For immunolabeling, the blots were blocked with TTBS solution (20 mM Tris-HCl, pH 7.6, 137 mM NaCl plus 0.1% Tween 20, and 5% dry skimmed milk) for 2 h at room temperature. After blocking non-specific binding, the membranes were incubated overnight with specific antibodies in blocking solution at 4 °C. Later, the blots were washed twice with blocking solution for 10 min followed by another two washes with TTBS for 5 min each. To detect the infrared fluorescence of the membranes the ODYSSEY Infrared Imaging System (LI-COR Biosciences) was used. Besides, some membranes were developed by chemiluminescence detection using a commercial kit (Bio-Rad) and images were captured with ChemiDoc Imaging System (Bio-Rad). The density of stained bands was scanned and quantified with the Image QuantTL 1-D software package (GE Healthcare Life Sciences, Uppsala, Sweden) and the data were normalized with respect to β-actin levels.
The primary antibodies used in this study were: goat polyclonal anti-IL-1β (1:250, AF-401-SP, Bio-Techne R&D Systems, SL, Barcelona, Spain); rabbit polyclonal anti-Caspase-1 (1:300, 3019-100 BioVision, Milpitas, CA, USA); mouse monoclonal anti-NLRP3 (1:400, AG-20B-0014-C100, AdipoGen Life Science, San Diego, CA, USA). The secondary antibodies were: IRDye 680RD donkey anti-goat 925-68074 (1:10,000); IRDye 680RD goat anti-rabbit 925-68071 (1:10,000); IRDye 800RD goat anti-mouse 925-32210 (1:10,000) (the three from Li-Cor, Lincoln, NE, USA) and anti-mouse IgG-peroxidase (1:10,000) (Sigma-Aldrich, San Louis, MO, USA).
To correct and quantify the protein load, mouse monoclonal anti-β-actin antibody (diluted 1:10,000) was used from Sigma. The data of the proteins of interest analyzed in the study were normalized with respect to β-actin levels.
4.9. Statistical Analysis
Results were expressed as the mean ± SEM of (n) independent animals. Statistical analysis was performed with the GraphPad Prism software (La Jolla, CA, USA). A one-way ANOVA followed by the Newman–Keuls multiple comparisons test were performed. Differences were considered significant when p ≤ 0.05.


 and
and 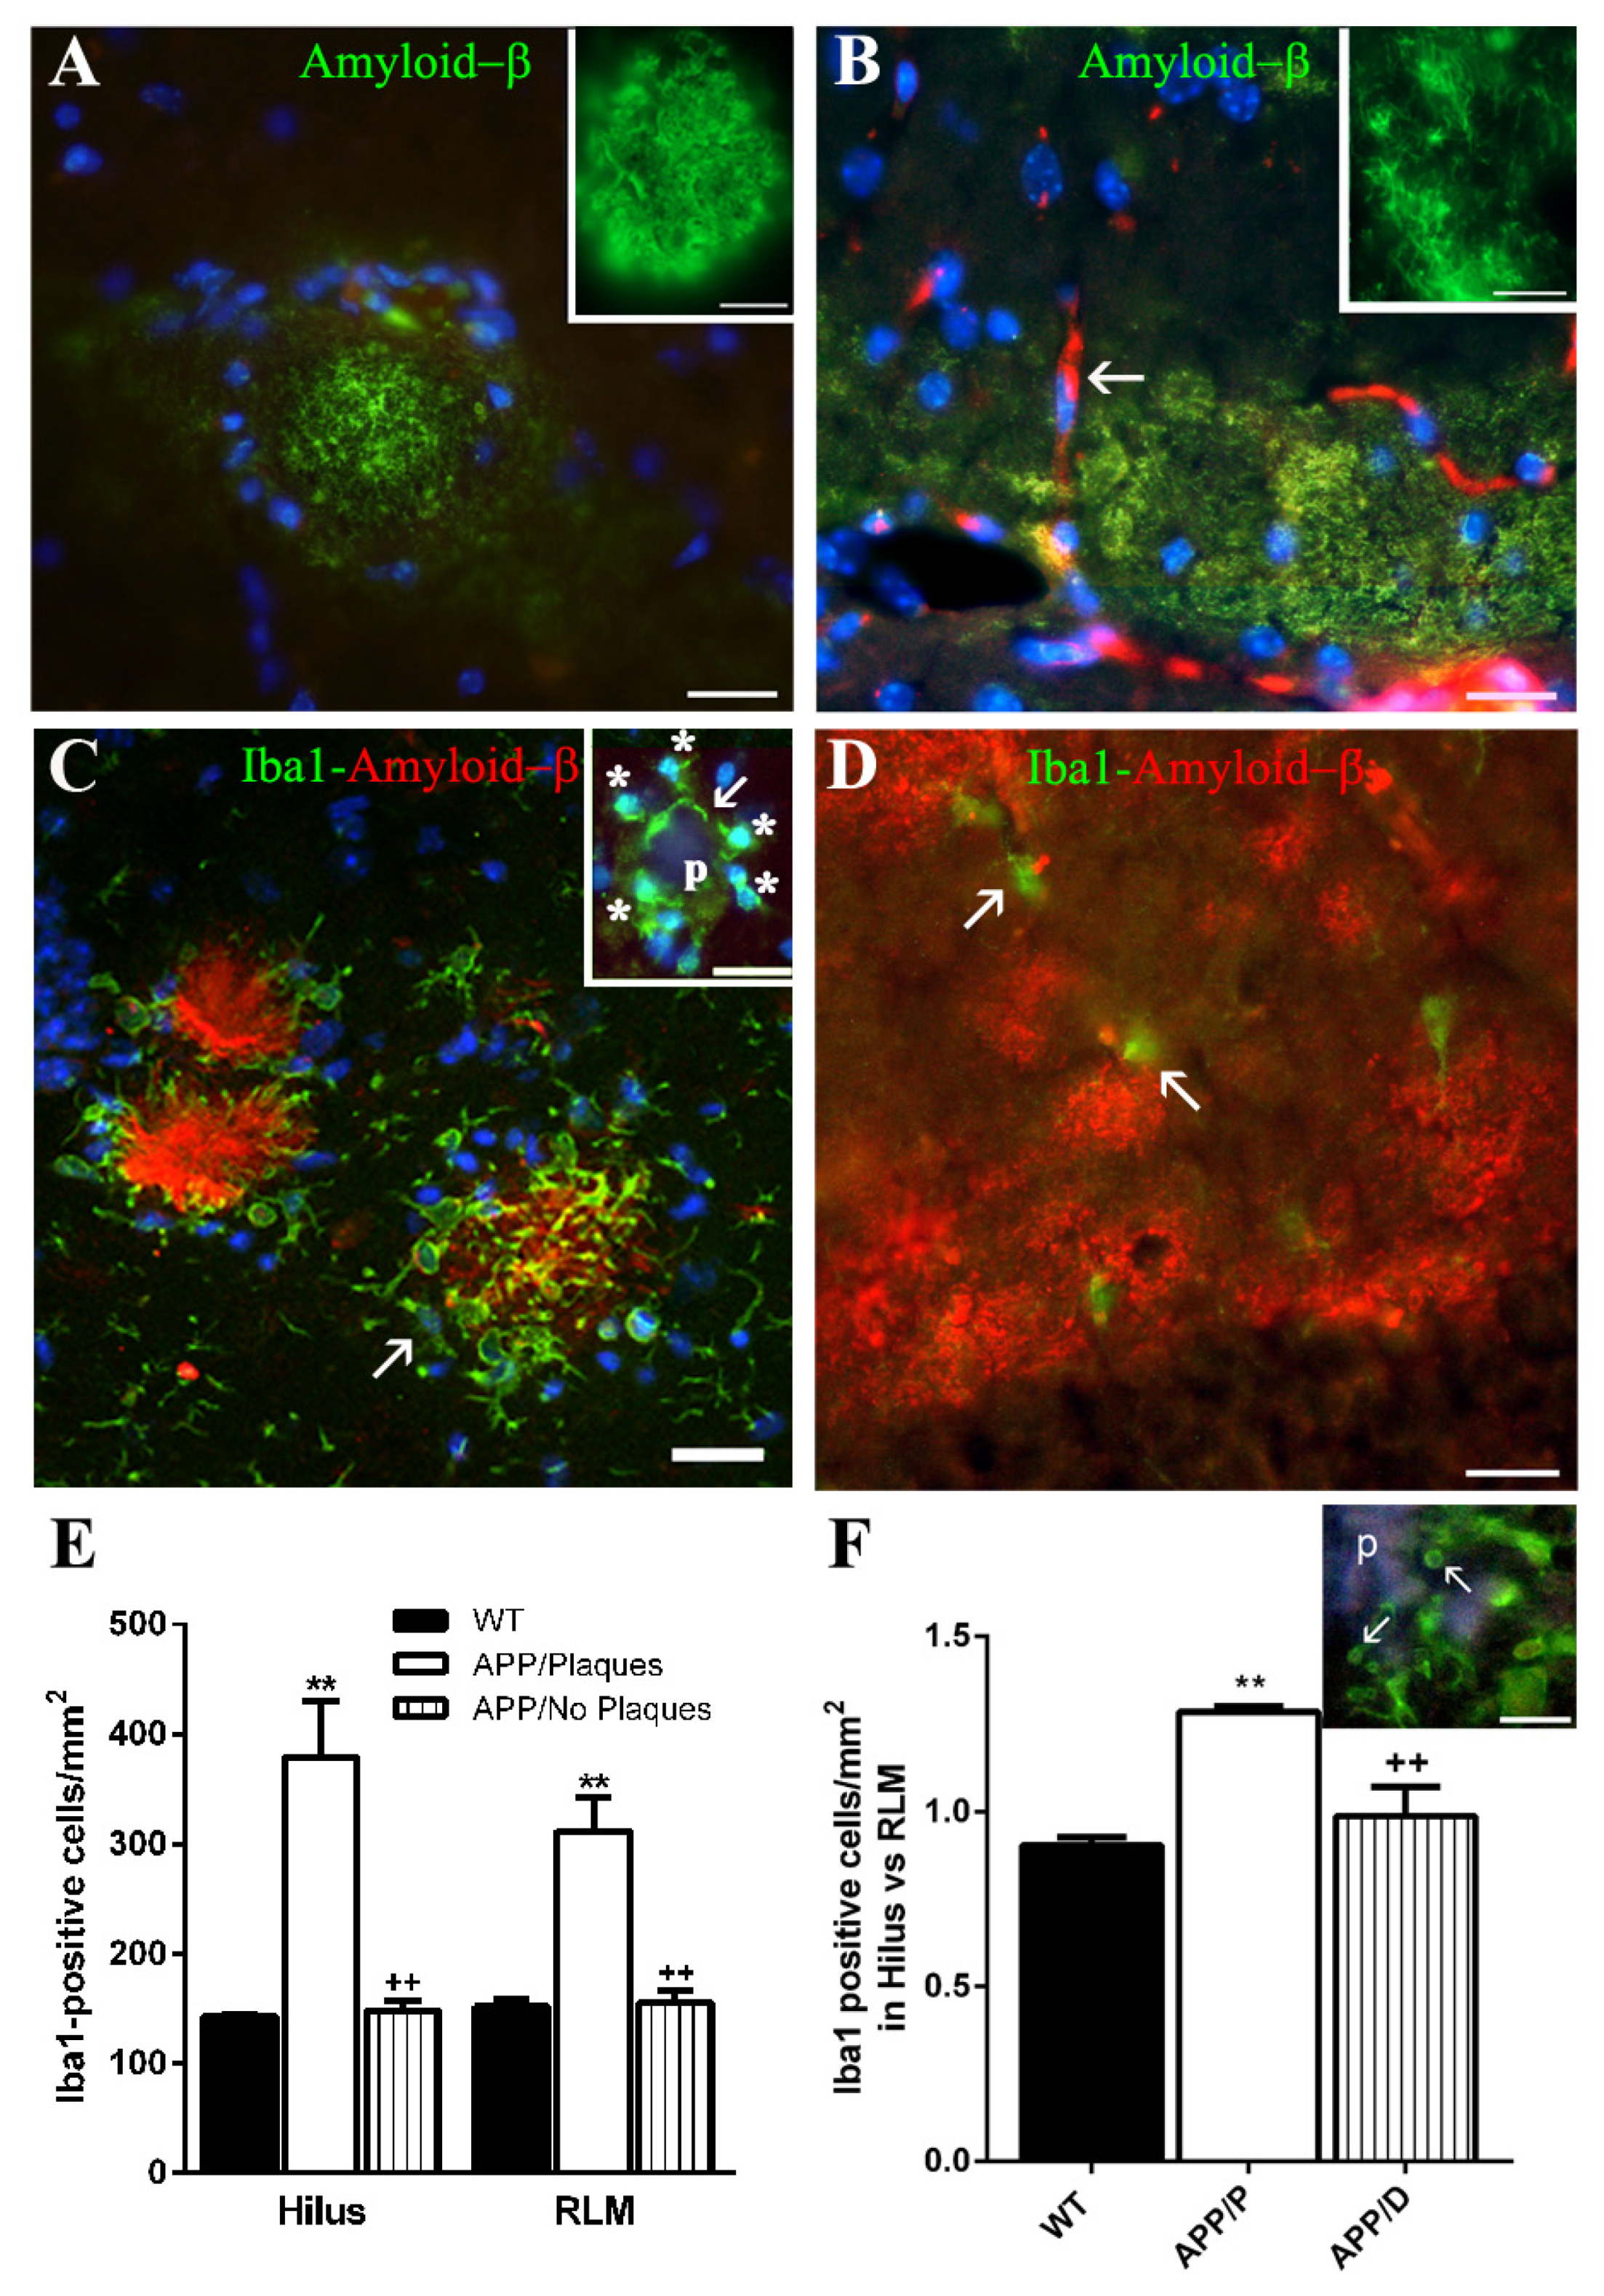