Article

Genome-Wide Identification of Aquaporin Gene Family in Pitaya Reveals an HuNIP6;1 Involved in Flowering Process

1
Guangdong Provincial Key Laboratory of Postharvest Science of Fruits and Vegetables/Key Laboratory of Biology and Genetic Improvement of Horticultural Crops (South China), Ministry of Agriculture and Rural Affairs, College of Horticulture, South China Agricultural University, Guangzhou 510642, China
2
Guangxi Academy of Agricultural Sciences, Nanning 530007, China
3
Institute of Forestry and Pomology, Beijing Academy of Agriculture and Forestry Sciences, Beijing 100097, China
*
Author to whom correspondence should be addressed.
Int. J. Mol. Sci. 2021, 22(14), 7689; https://doi.org/10.3390/ijms22147689
Submission received: 24 June 2021 / Revised: 11 July 2021 / Accepted: 14 July 2021 / Published: 19 July 2021
(This article belongs to the Collection Feature Papers in Molecular Genetics and Genomics)

Abstract

:
Aquaporins (AQPs) are essential membrane proteins involved in seed maturation and germination, stomata movement, photosynthesis, and regulation of plant flowering processes. Pitaya flowers are open at night and wither at daybreak, which shows an obvious circadian rhythm. In this study, a comprehensive genome-wide analysis of AQPs in Hylocereus undantus was conducted to screen key genes associated with flowering processes. A total of 33 HuAQP genes were identified from the H. undantus genome. The 33 HuAQPs were grouped into four subfamilies: 10 PIPs, 13 TIPs, 8 NIPs, and 2 SIPs, which were distributed on 9 out of 11 pitaya chromosomes (Chr) (except for Chr7 and Chr10). Results from expression profiles showed that HuNIP6;1 may be involved in pitaya’s floral opening. HuNIP6;1 was localized exclusively in the cell membrane. Overexpression of HuNIP6;1 in Arabidopsis thaliana significantly promoted early flowering through regulating negative flowering regulators of MJM30, COL9, and PRR5, suggesting that HuNIP6;1 plays key roles in regulating flowering time. The present study provides the first genome-wide analysis of the AQP gene family in pitaya and valuable information for utilization of HuAQPs.

1. Introduction

Aquaporins (AQPs) belonging to the major intrinsic protein (MIP) superfamily have been found in all types of organisms, including bacteria, fungi, animals, and plants. In 1988, a new intact membrane protein named CHIP28 was purified from erythrocyte and renal cell membrane [1]. Then, CHIP28 was termed as Aquaporin-1 (AQP1), since it showed the function of water transportation [2]. With the rapid increase in available whole genomic sequences in recent years, AQPs have been identified in various plant species, including 35 from Arabidopsis thaliana [3], 35 from Zea mays [4], 28 from Beta vulgaris [5], and 35 from Citrullus lanatus [6]. According to the homology of amino acids and subcellular location, plant AQPs are classified into five subfamilies: plasma membrane intrinsic proteins (PIPs), tonoplast intrinsic proteins (TIPs), nodulin 26-like intrinsic proteins (NIPs), uncategorized (X) intrinsic proteins (XIPs), and small basic intrinsic proteins (SIPs) [7].
Each AQP contains six transmembrane (TM) domains (TM1–TM6) connected by five loops (Loops A–E), as well as the two signature asparagine–proline–alanine (NPA) motifs located at the N-terminus of the two half-helices (HB and HE) in LB and LE [8]. The NPA motifs (signature motifs) are located inside the pore responsible for electrostatic repulsion and charge selectivity [9]. The NPA motifs make the size and hydrophobicity of the pore contraction site different, which determines the specificity of the substrate. The structural characteristics of AQPs are particularly essential to the accuracy of their functions [10].
AQPs are a kind of multifunctional membrane protein that plays an indispensable role in plant development [11]. In addition to water transport, AQPs can also transport some small solutes, gases, and metal ions across the membrane [12,13,14,15]. AQPs are involved in leaf stomatal movement [16,17], photosynthesis [18], stress-resistance effectiveness [19,20,21,22,23], and floral opening [24,25,26,27,28,29].
Pitaya, also known as pitahaya or dragon fruit, is a perennial climbing fruit crop belonging to Hylocereus or Selenicereus in the Cactaceae family. There are mainly two species of dragon fruits; i.e., white-flesh dragon fruit (H. undatus) and red-flesh dragon fruit (H. monacanthus) that have been commercially produced at a large scale as a new types of fruit crops in many countries. Their differences mainly lie in flesh color and self-pollination ability. Many species of H. monacanthus are self-incompatible [30]. Thus, artificial cross-pollination is essential to increase fruit setting and fruit weight [31]. Pitaya flowers, also called Moonflower, the Queen of the Night, and the Lady of the Night, only open at night and close at daybreak, with each flower lasting only one night [32,33]. At night, it is very inefficient, labor-intensive, and time-consuming for pitaya hand-pollination. Therefore, identification and characterization of key genes related to control of the process of floral opening in pitaya is of great significant to the pitaya industry. Although the AQP genes play multiple roles in various plants, the function of the AQP family in pitaya remains unknown. In this study, the genome-wide identification and characterization of pitaya AQP genes (HuAPQs) related to the floral opening process was performed using available pitaya genomic information [34]. The aim of the present study was to identify and validate the candidate AQPs genes involved in pitaya flower opening that can be used for genetic improvement of cultivated pitaya.

2. Results

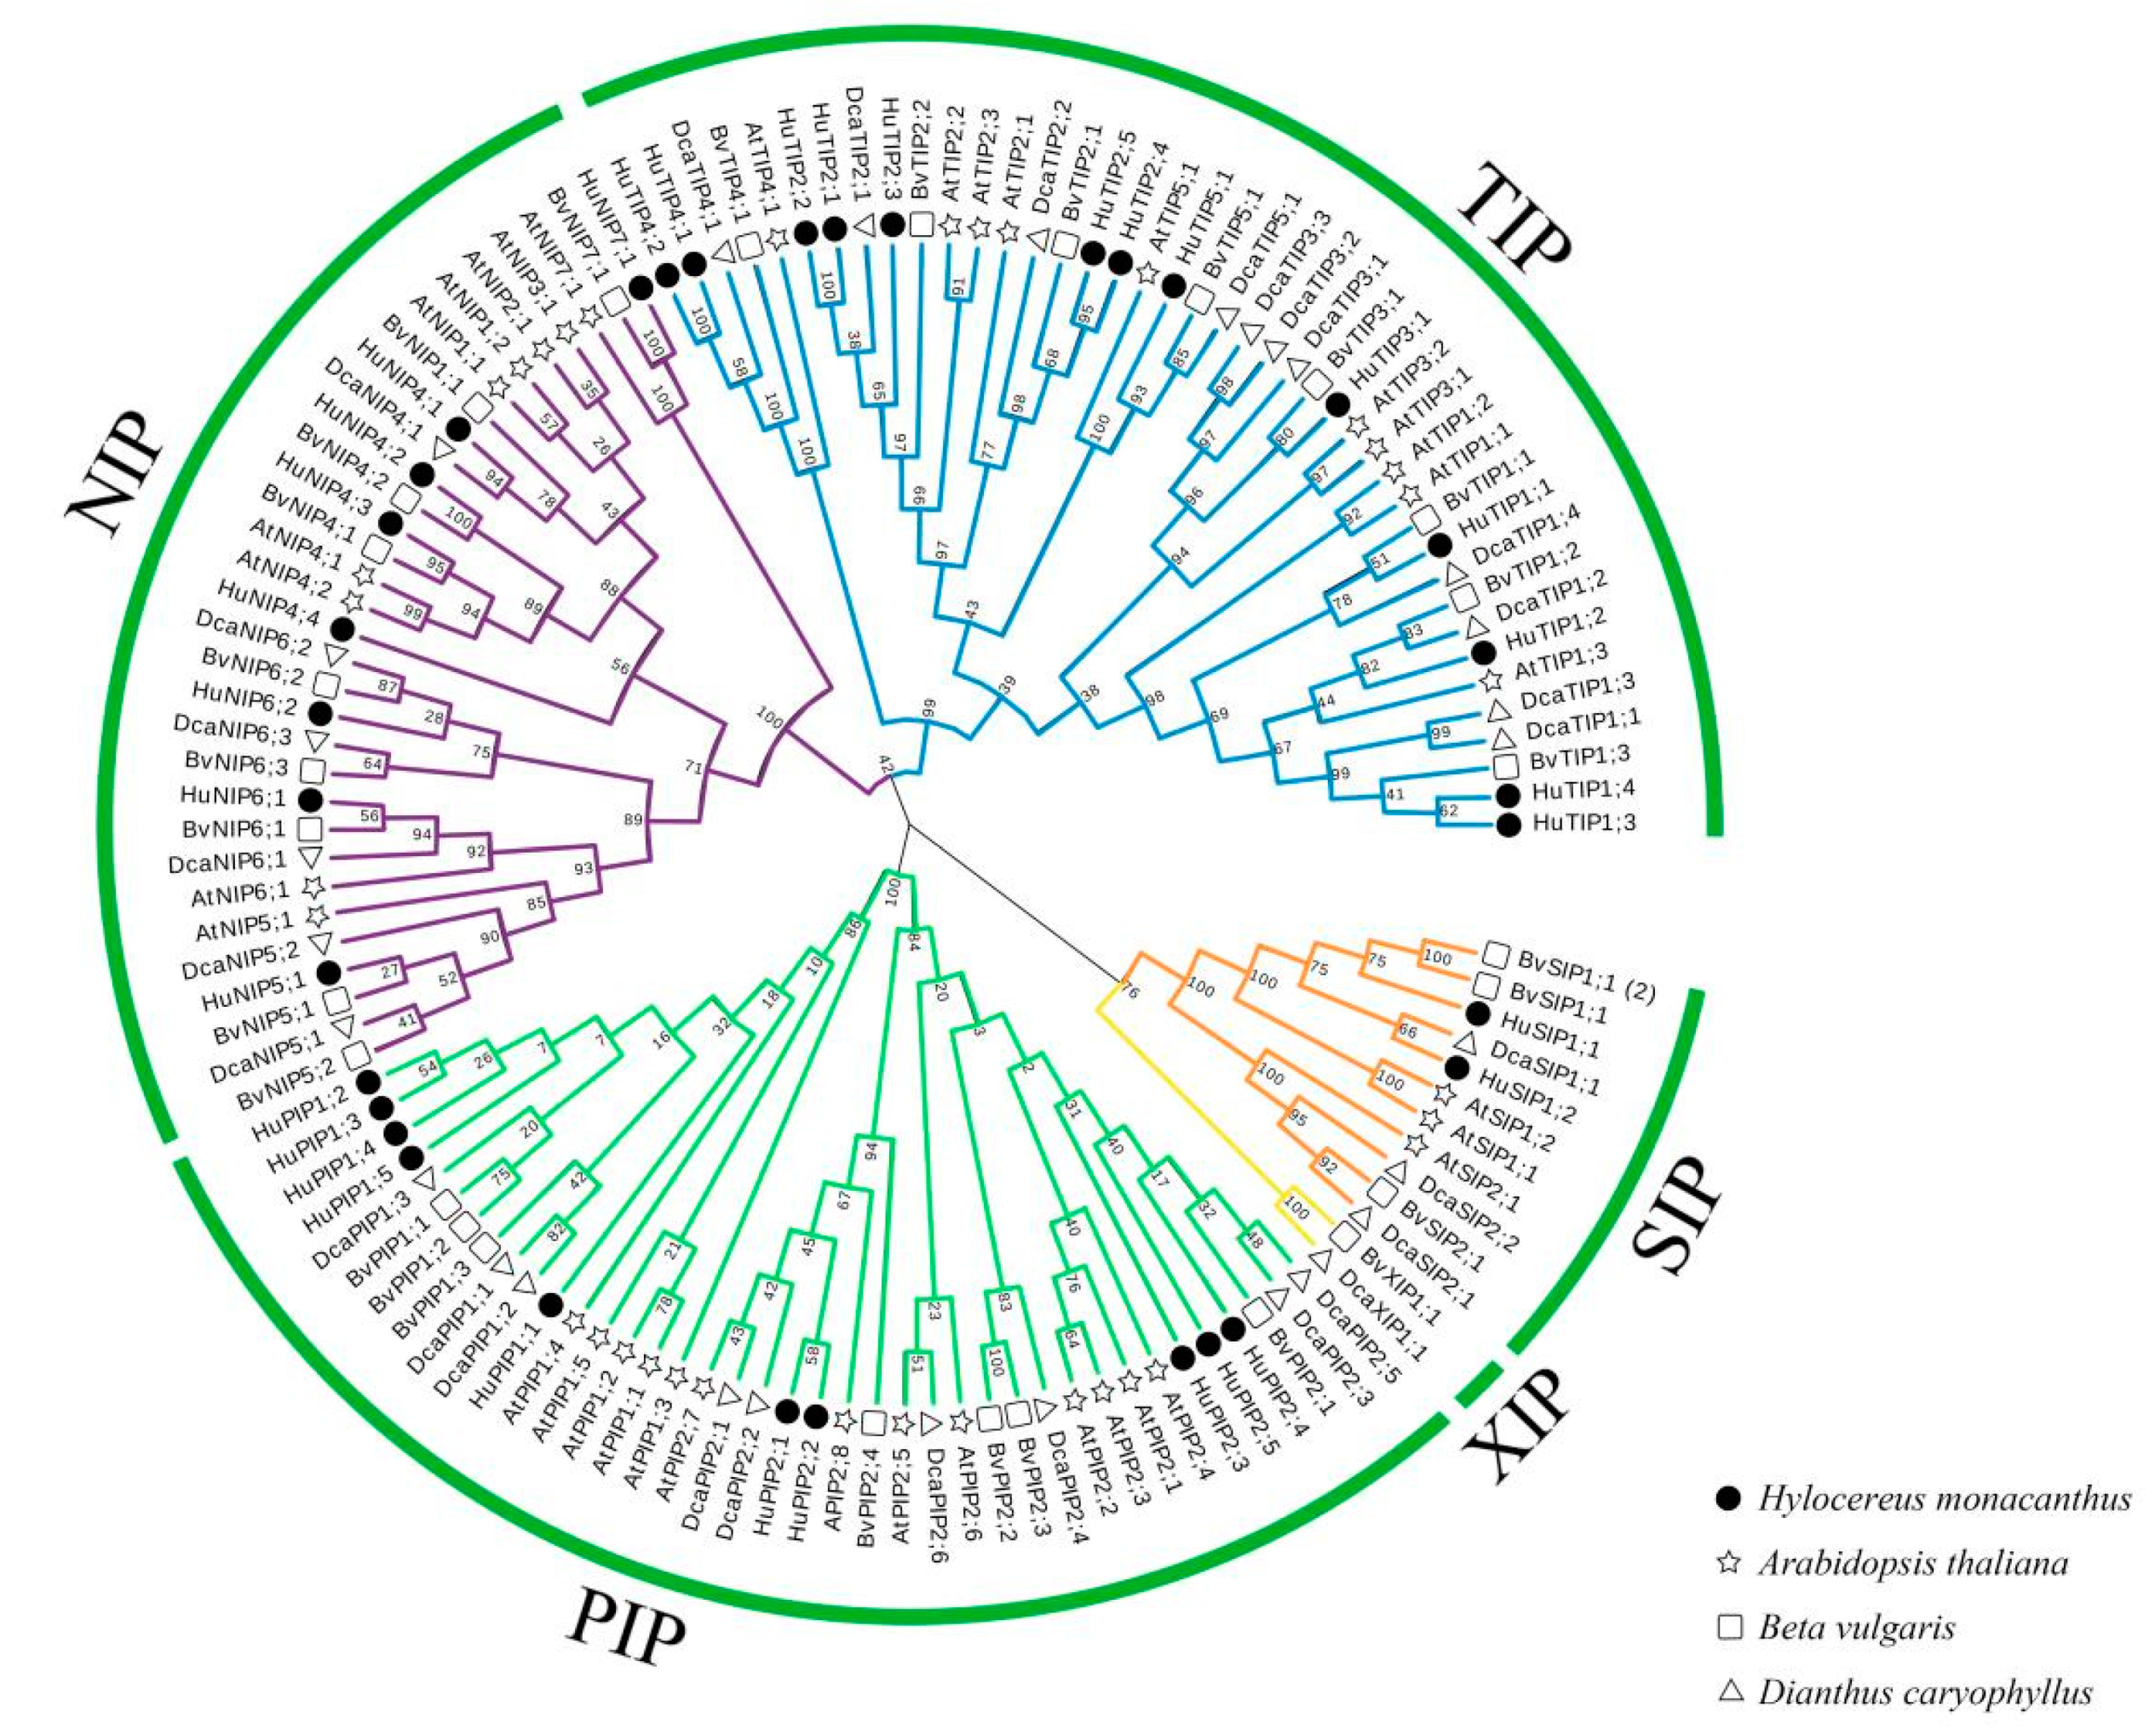
2.1. Identification, Classification, Nomenclature, and Properties of HuAQPs

A total of 43 gene sequences were obtained in the pitaya genome database (http://www.pitayagenomic.com/) using the keyword ‘aquaporin’, and 33 AQP genes (HuAQPs) had one complete MIP domain and two NPA motifs (Table 1). Based on sequence cluster analyses of H. undantus, A. thaliana, D. caryophyllus, and B. vulgaris, those HuAQPs were classified into four subfamilies: 10 PIPs, 13 TIPs, 8 NIPs, and 2 SIPs (Figure 1). The PIPs subfamily included PIP1s and PIP2s subgroups, with five PIP1s and five PIP2s. The TIPs subfamily was divided into five subgroups: four TIP1s, five TIP2s, one TIP3s, two TIP4s and one TIP5. The NIPs subfamily contained four subgroups; i.e., four NIP4s, one NIP5, two NIP6, and one NIP7. HuAQPs were named according to their percentage of identity to the 35 AQP proteins from A. thaliana [3]. Among the 33 predicted HuAQP proteins, the largest one was HuNIP5;1, with 310 amino acids (AAs), while the smallest protein was HuNIP6;2 with 217 AAs (Table 1).

2.2. Gene Structure and Conserved Motif Analyses of HuAQPs

The exon–intron structures play vital roles in plant evolution. The exon–intron structures and conserved motifs of HuAQPs were analyzed. Most PIP subfamilies had four exons, except for HuPIP2;1 and HuPIP2;2 containing three exons. TIP subfamilies had three exons, except for HuTIP1;1 with two exons. NIP subfamilies contained five exons, while HuNIP5;1 and HuNIP6;2 had four exons and three exons, respectively. All SIP subfamilies contained three exons (Figure 2B). As shown in Figure 2C, Motif 1 and Motif 3 were found in all HuAQPs, except HuTIP1;3 without Motif 3. Both PIP and TIP subfamilies contained seven motifs, suggesting that they were highly conserved in pitaya. Motif 5 and Motif 9 were unique to the PIP subfamilies, while Motif 10 specifically existed in the TIP subfamilies. NIP subfamilies had Motif 1, Motif 2, Motif 5, Motif 6, and Motif 7, except for NIP6;2.

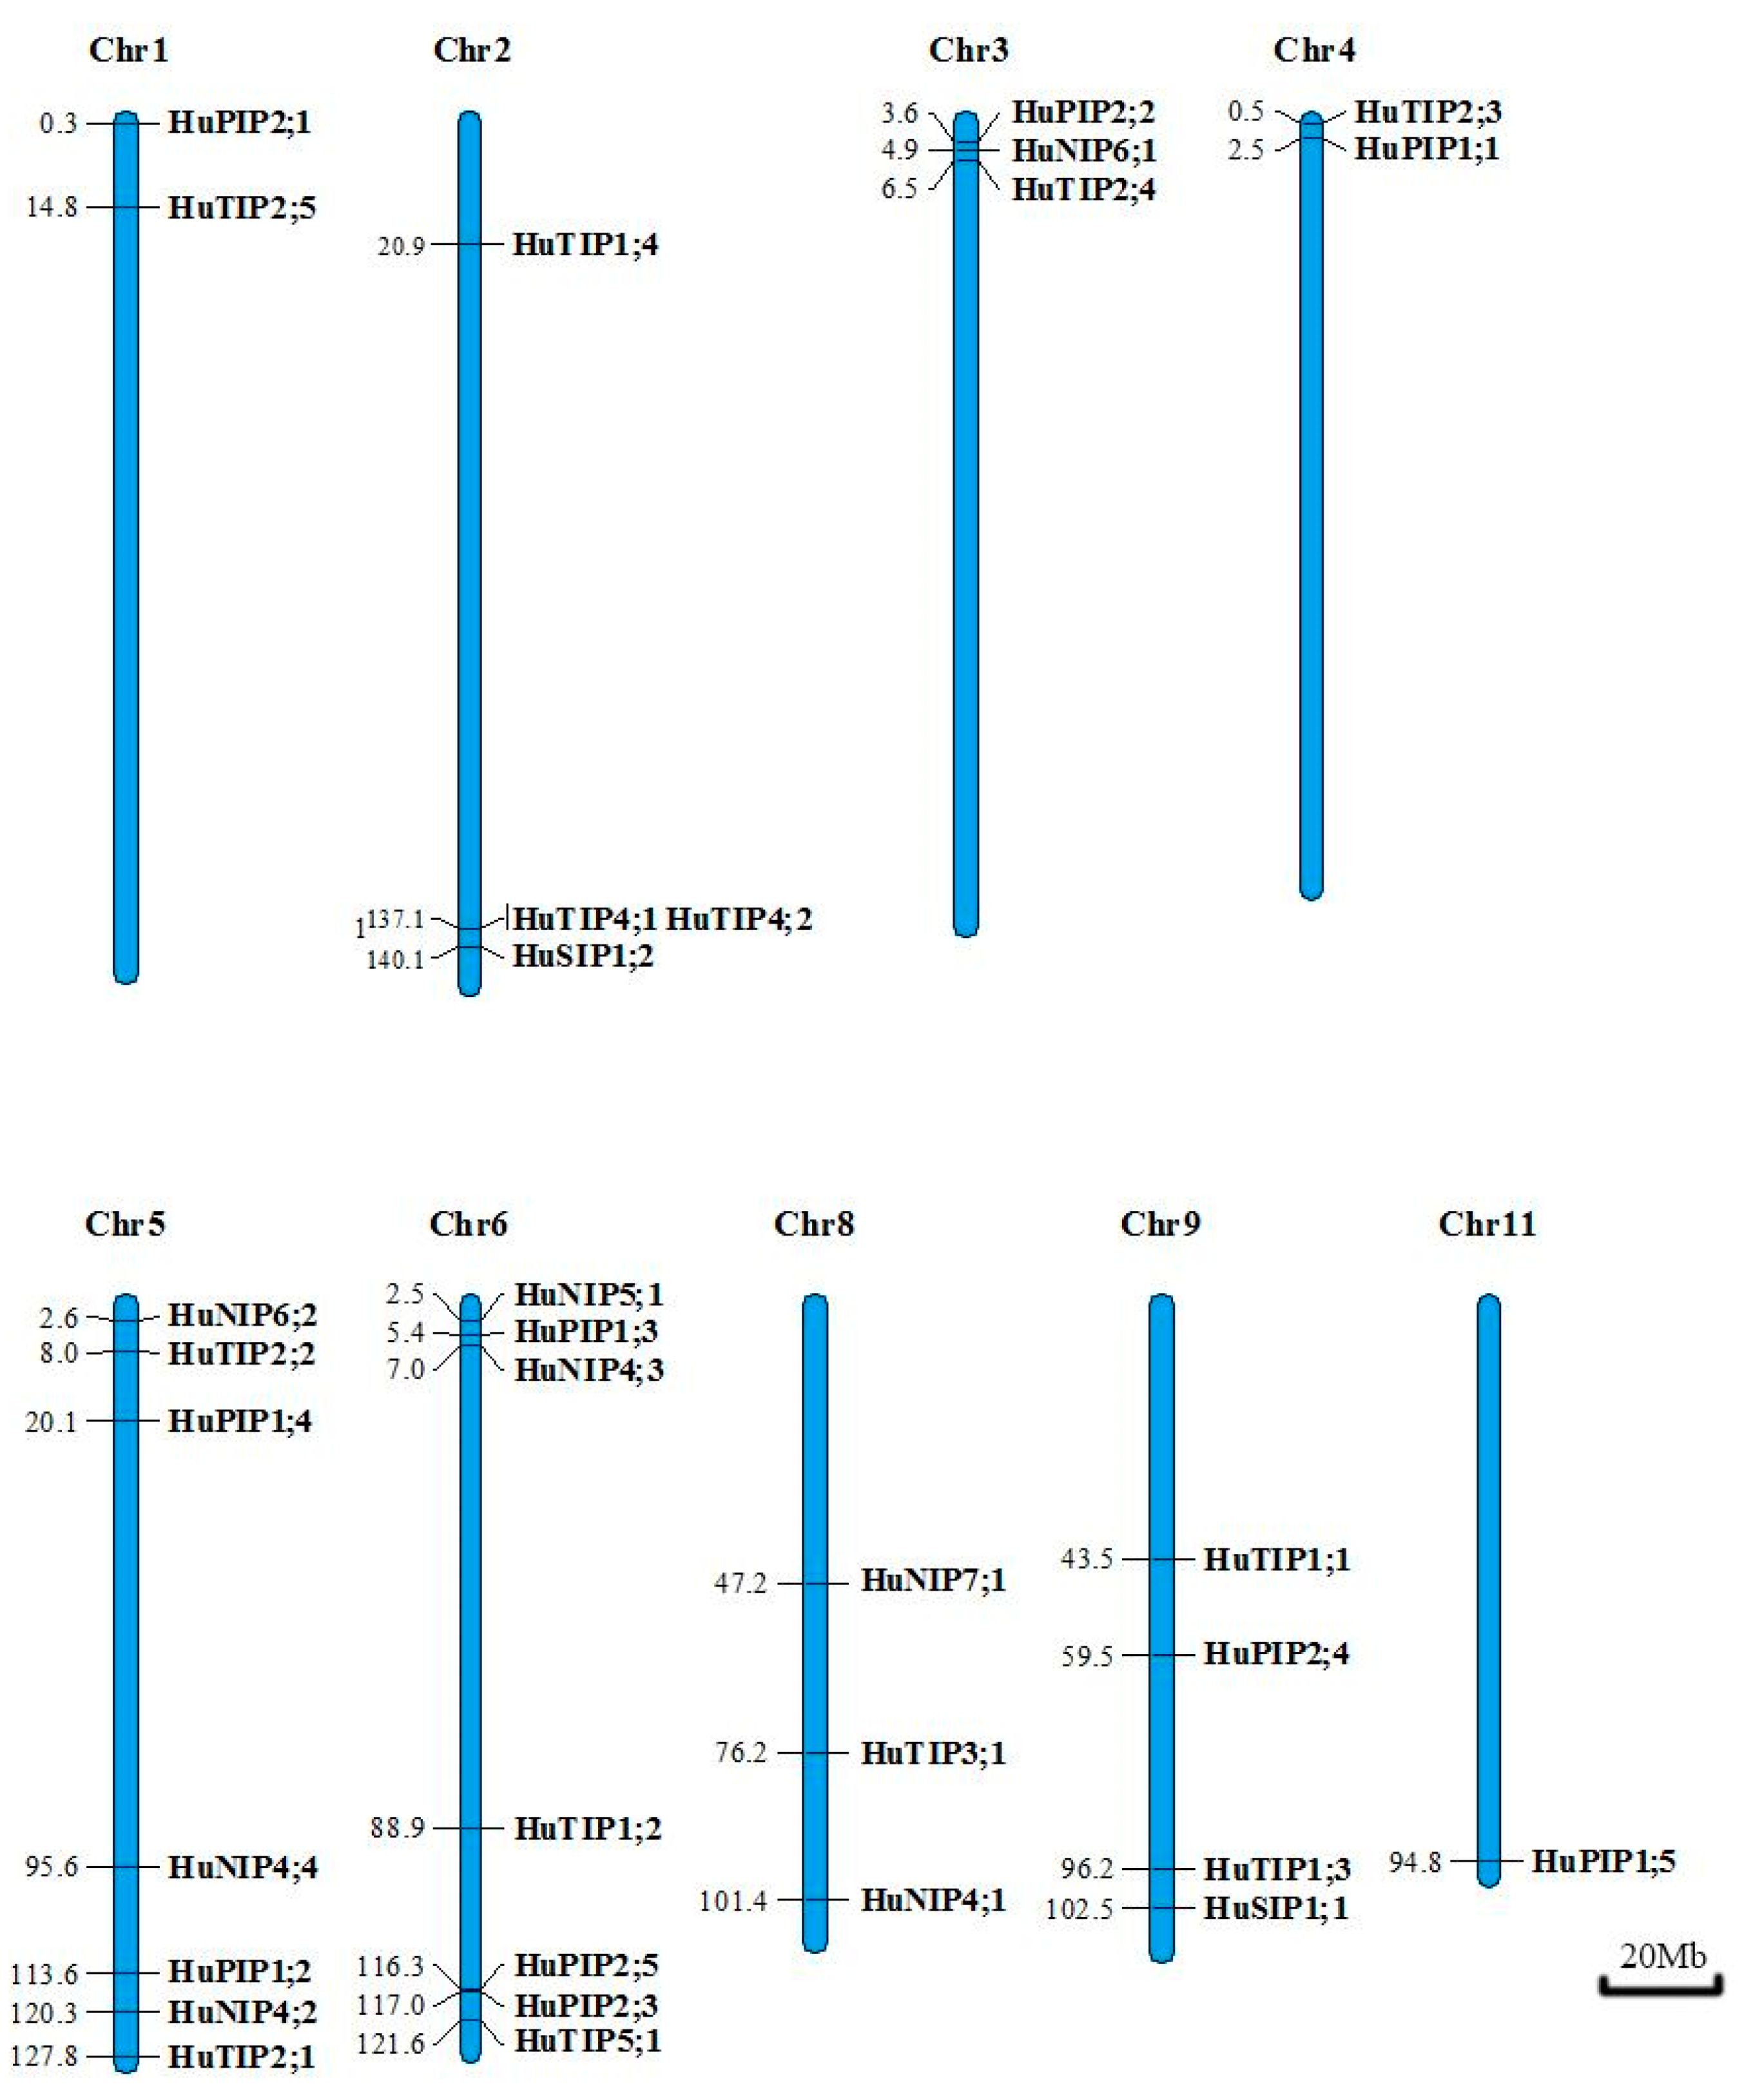
2.3. Gene Mapping on the Pitaya Chromosomes

According to the gene loci information, the 33 HuAQP genes were unevenly distributed in nine chromosomes. HuAQPs were mainly distributed at both ends of chromosomes, and density of HuAQPs varied on individual chromosomes. Most of the HuAQPs were located on Chr 5 (seven genes; 21.2%) and Chr 6 (seven genes; 21.2%). However, there was only one HuAQP on Chr 11 (Figure 3).

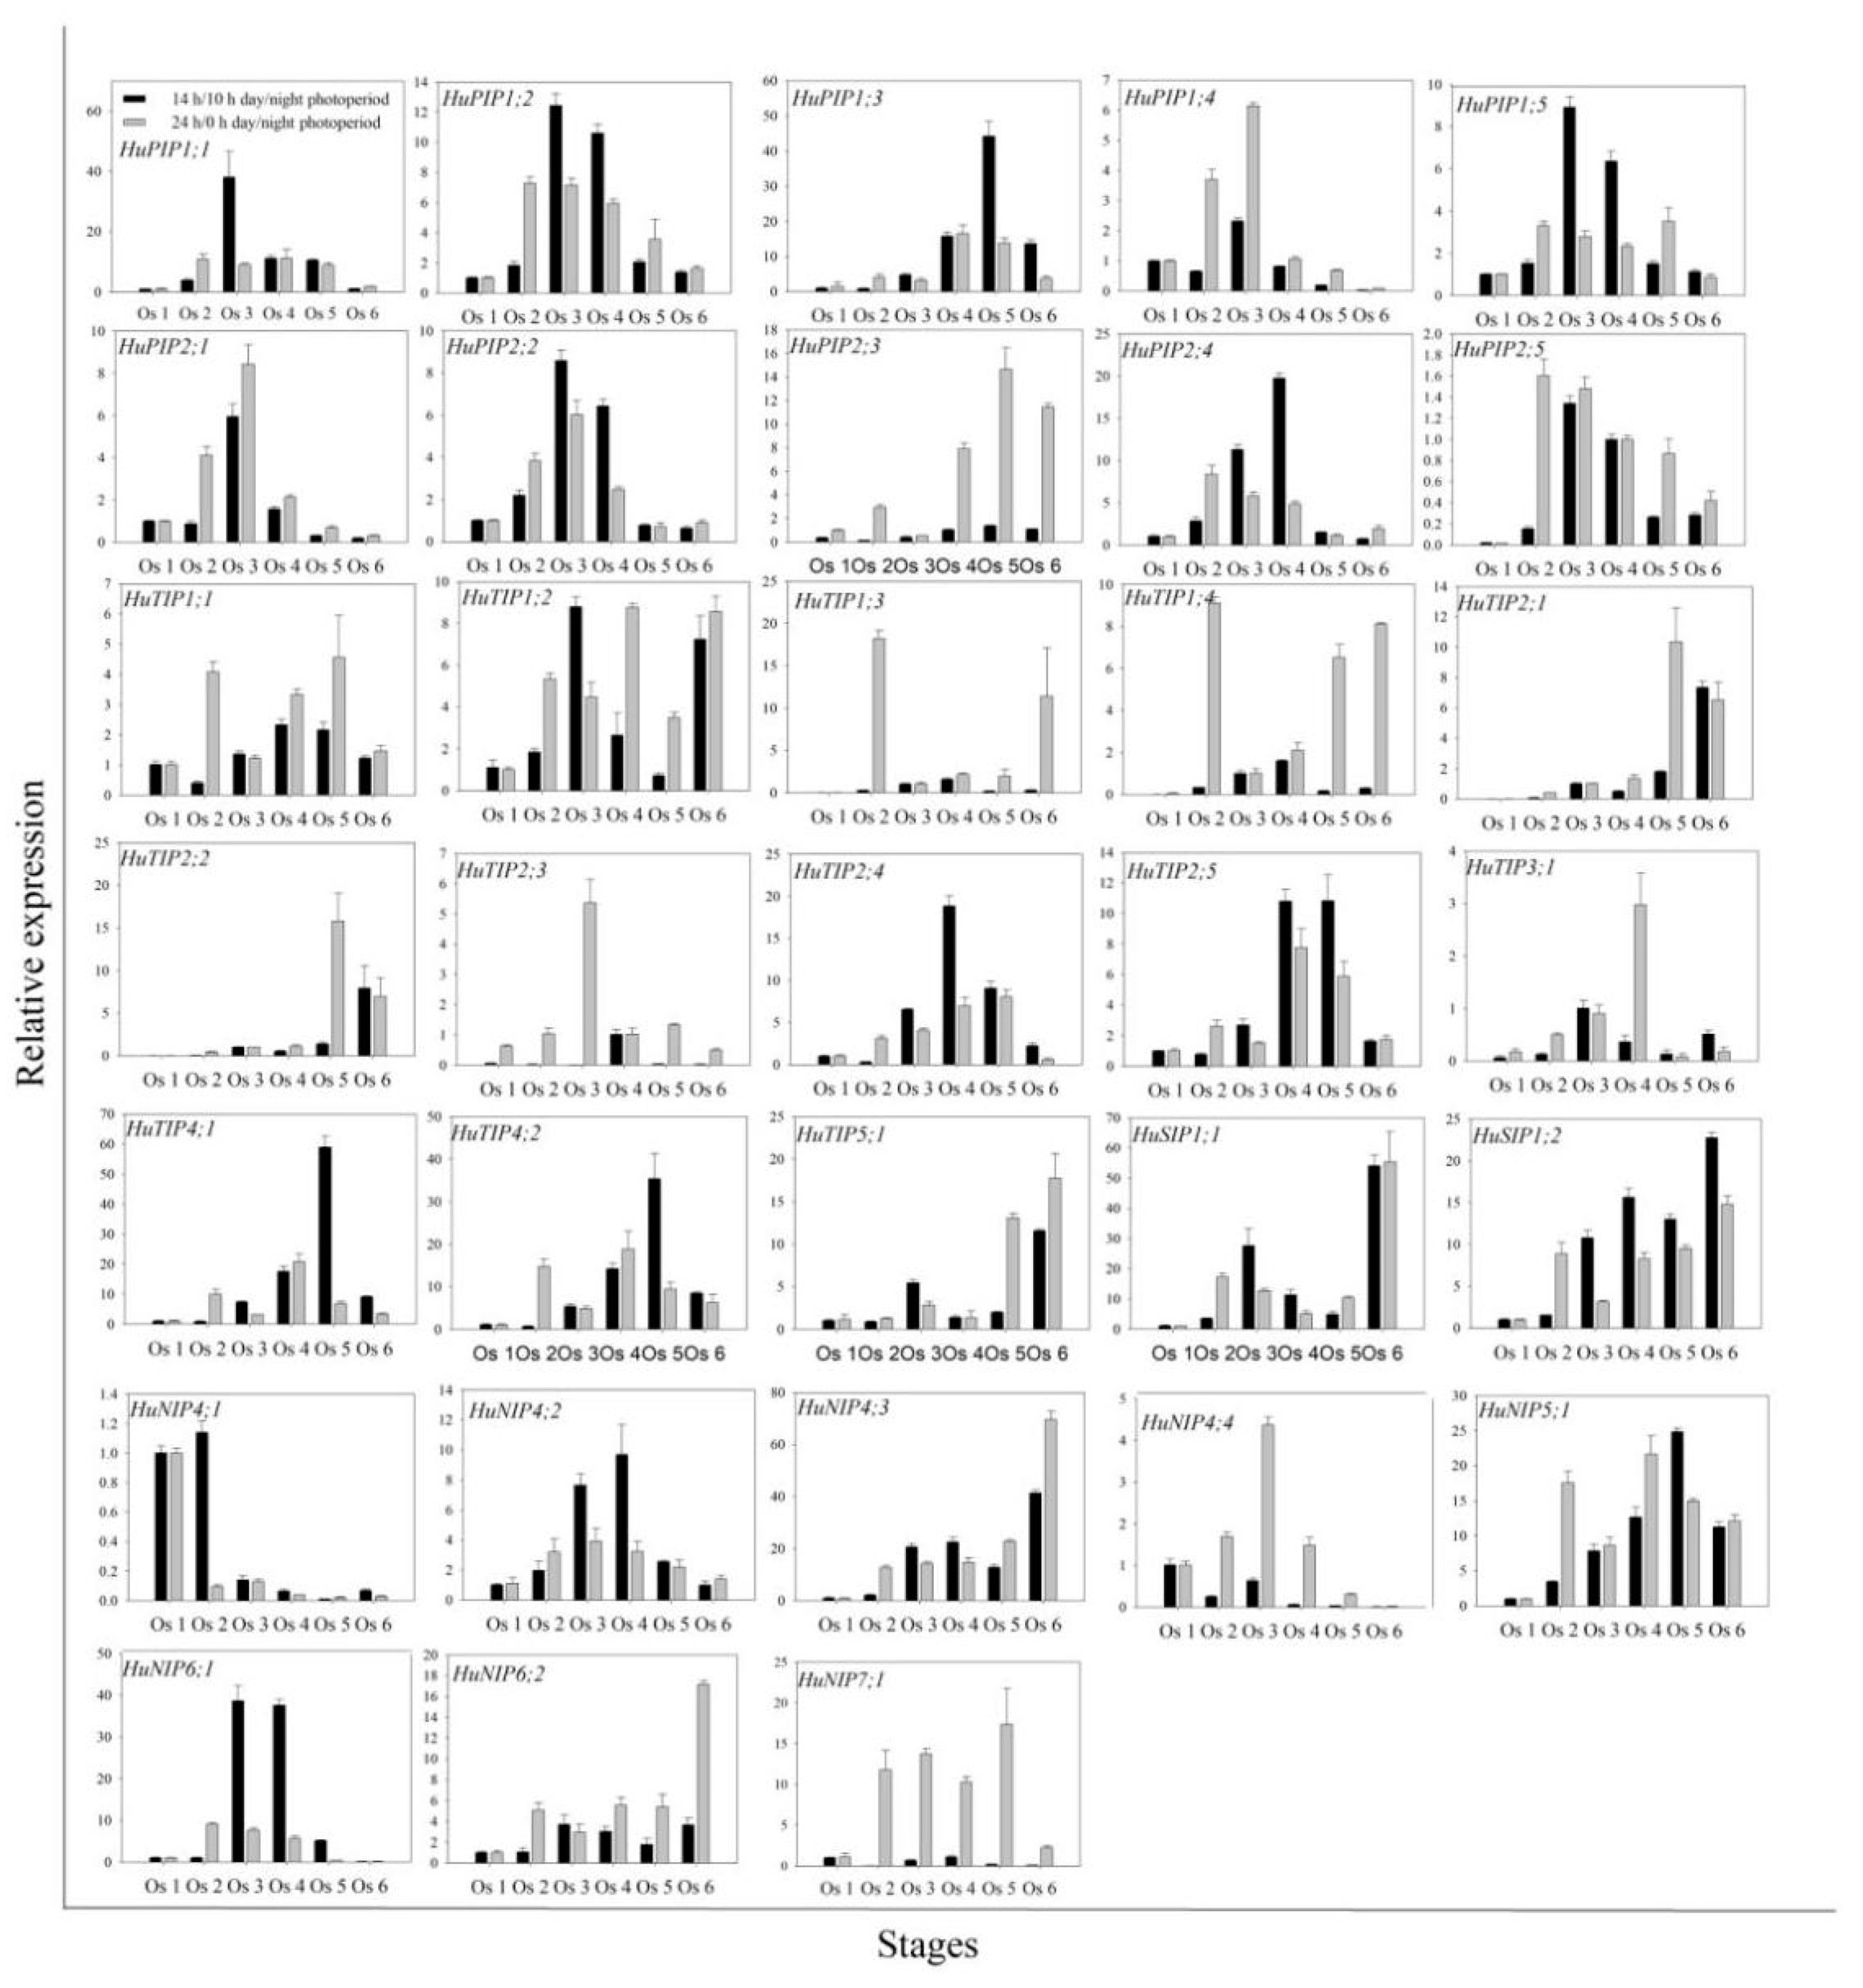
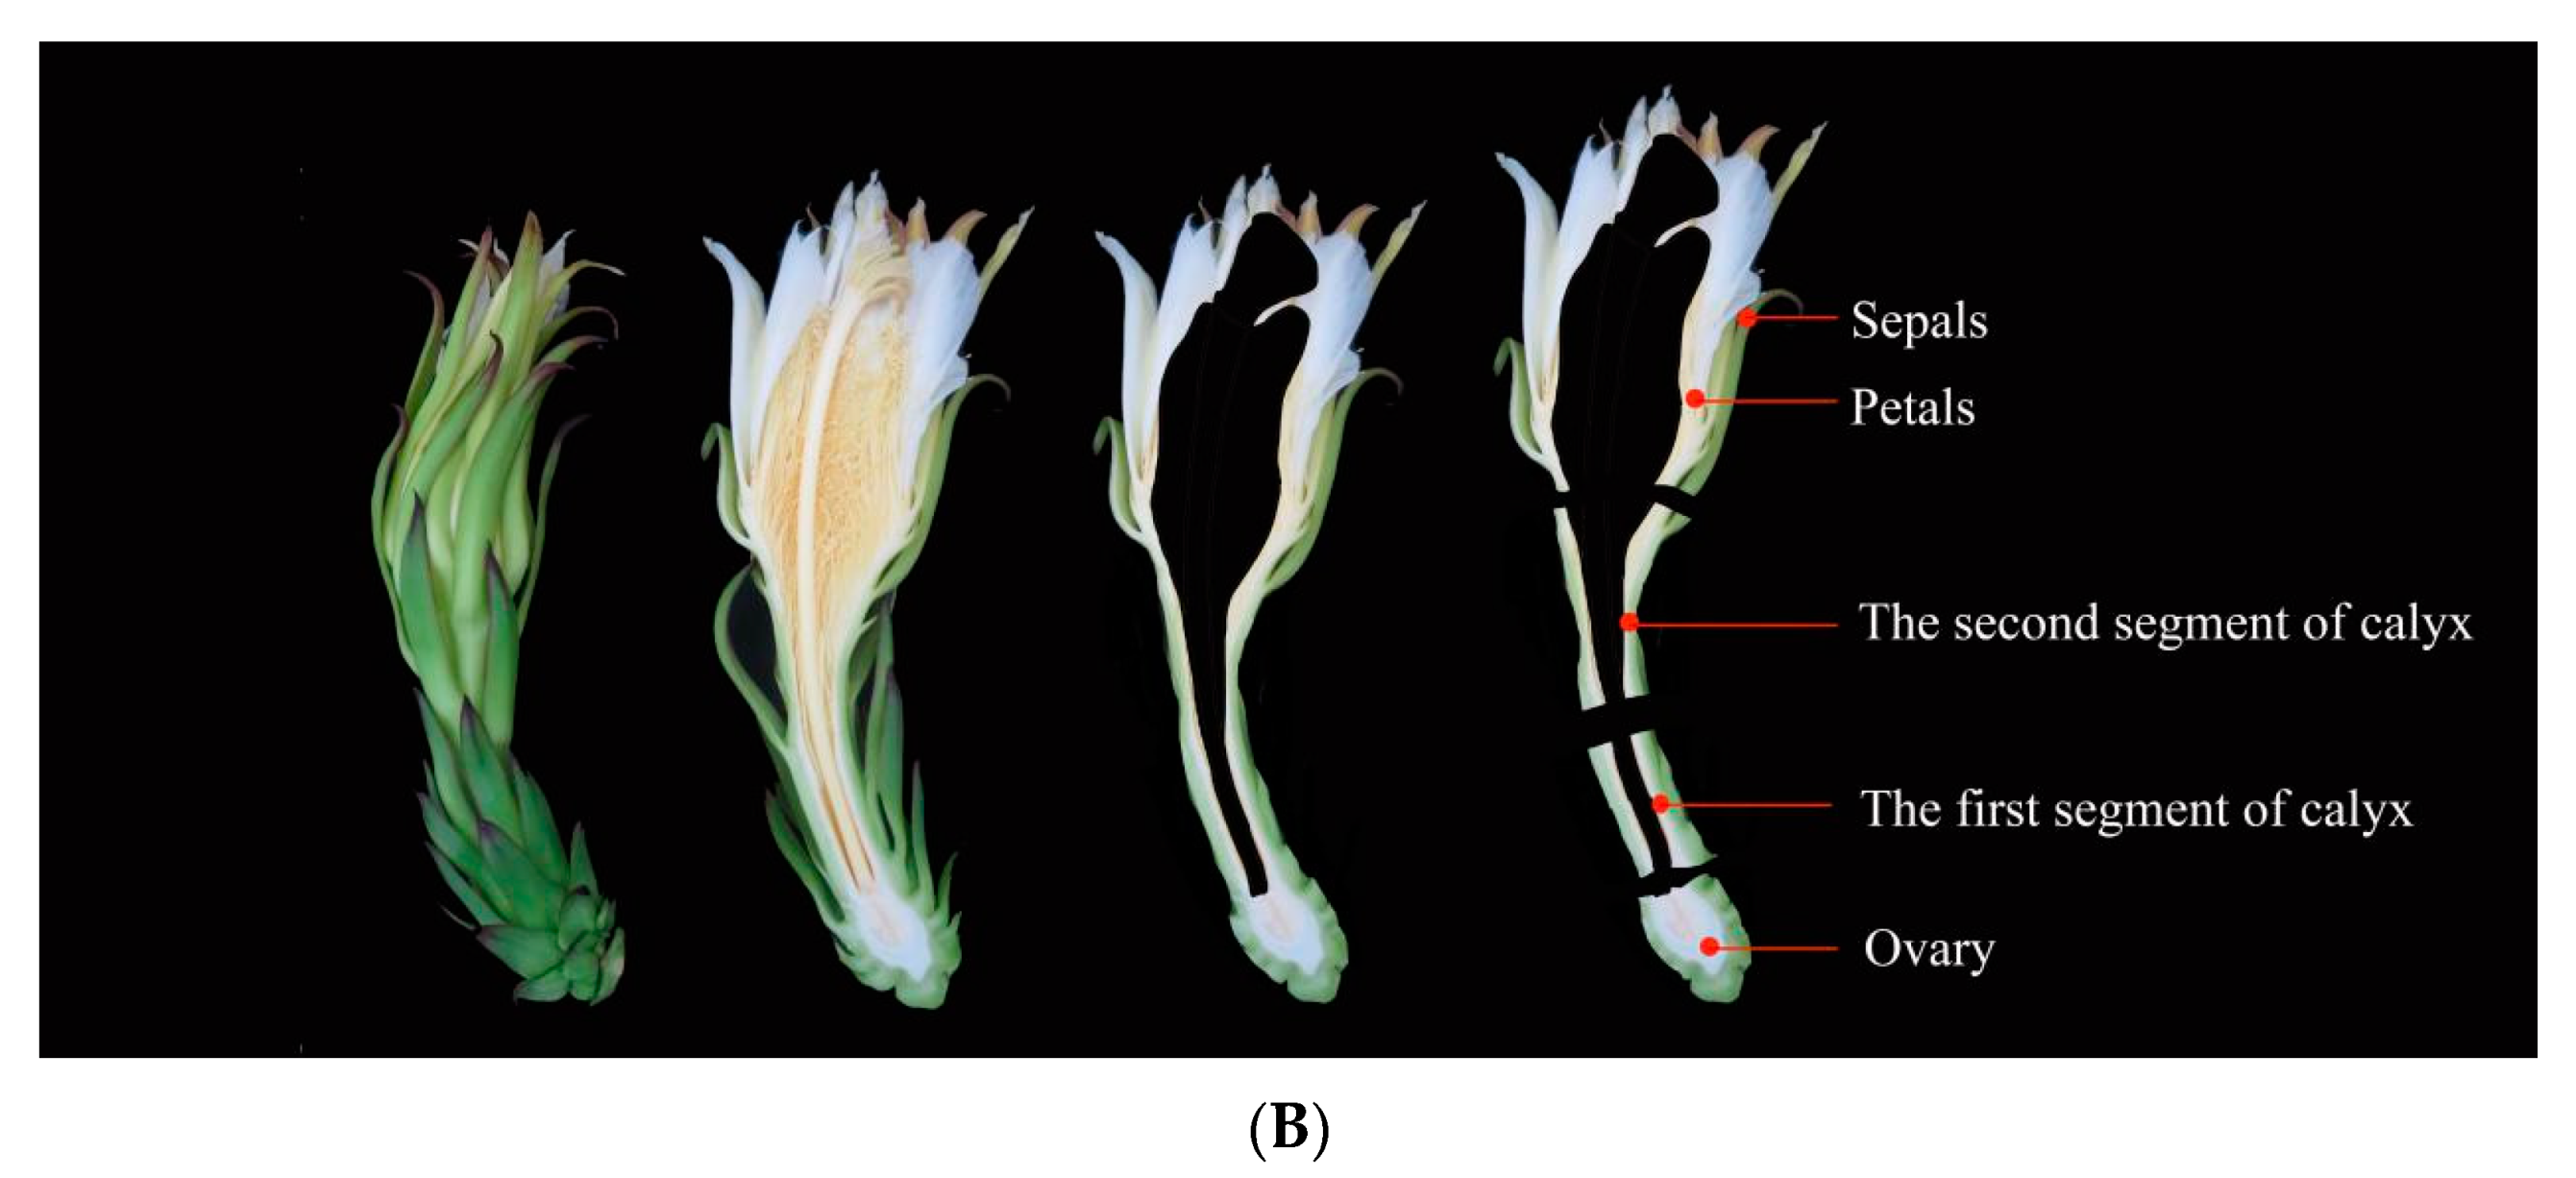
2.4. Expression Patterns of HuAQPs during the Flower-Opening Process in Pitaya

The expression differences of HuAQP genes were analyzed in petals at six flower-opening stages under 14 h/10 h day/night and 24 h/0 h day/night (Figure 4). Expression levels of HuPIP1;1, HuPIP1;2, HuPIP1;4, HuPIP1;5, HuPIP2;1, HuPIP2;2, and HuPIP2;5 showed increasing patterns from Os 1 to Os 3, and then decreased thereafter under 14 h/10 h day/night. Similar expression patterns were also observed in HuPIP1;4, HuPIP2;1, HuPIP2;2, HuTIP2;3, HuNIP4;2, and HuNIP4;4 under 24 h/0 h day/night. The highest expression levels of HuPIP2;4, HuTIP1;1, HuTIP1;4, HuTIP2;3, HuTIP2;4, HuTIP2;5, and HuNIP4;2 were detected at Os 4 under 14 h/10 h day/night, compared to the highest expression levels of HuPIP1;3 and HuTIP3;1 at Os 4 under 24 h/0 h day/night. The expression of HuTIP4;1, HuTIP4;2, and HuNIP5;1 reached their maximums at Os 5 under 14 h/10 h day/night, while the expression of HuTIP2;1, HuTIP2;2, and HuTIP2;4 peaked at Os 5 under 24 h/0 h day/night. The highest expression levels of HuTIP5;1, HuSIP1;1, HuSIP1;2, HuNIP4;3, and HuNIP6;2 were observed in Os 6 under both of the two conditions. Under 24 h/0 h day/night, HuNIP4;1 at Os 1, HuTIP1;3 at Os 2, HuPIP2;3, and HuNIP7;1 showed different expression patterns at different stages at Os 5. HuTIP1;2 achieved its highest expression in Os 3 under 14 h/10 h day/night. The expression of HuNIP6;1 increased from Os 1 to Os 3 and then decreased. Expression levels of HuNIP6;1 in Os 3 and Os 4 were significantly higher than that of the other stages under 14 h/10 h day/night, suggesting that the Os 3 and Os 4 were the important periods for the flower-opening process of pitaya. However, no significant difference was detected in expression profiles of the HuNIP6;1 under 24 h/0 h day/night. Results from expression analyses suggested that HuNIP6;1 may be involved in the flowering-opening process of pitaya.

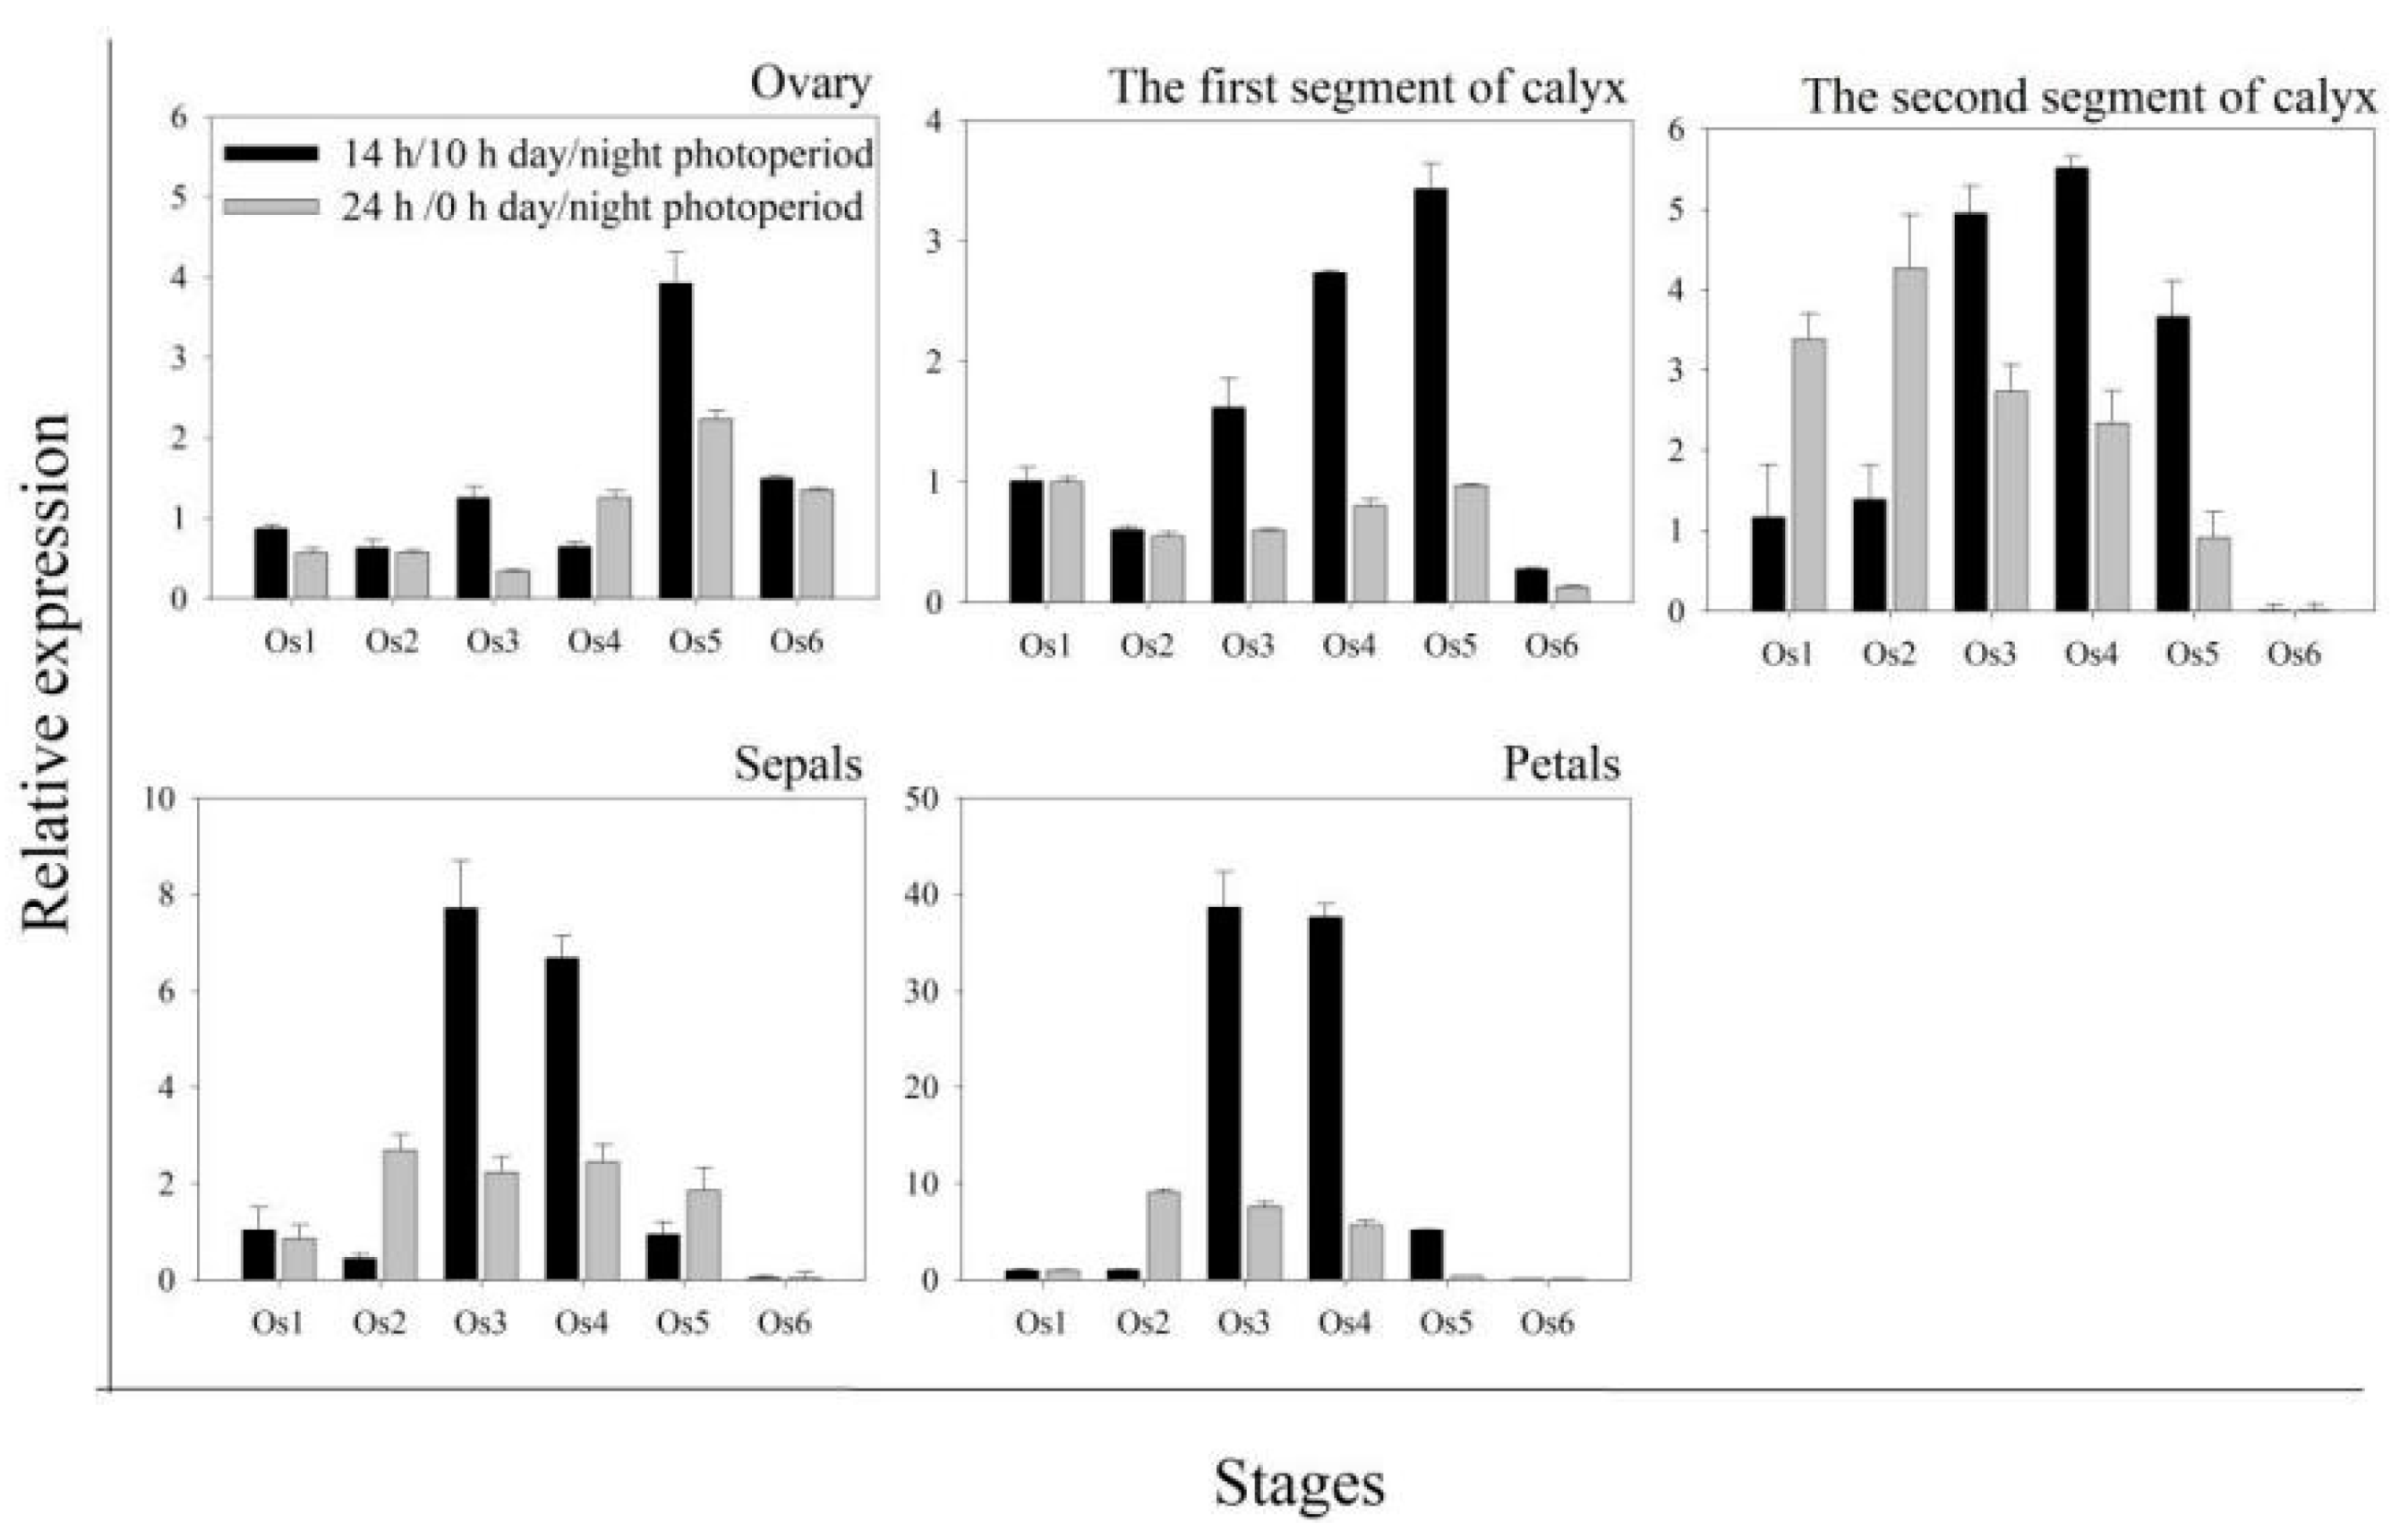
2.5. Expression Patterns of HuNIP6;1 during Flower Opening in Pitaya

The expression patterns of HuNIP6;1 were further analyzed in various tissues (ovaries, petals sepals, and the first and second segments of calyx) by RT-qPCR (Figure 5). Higher expression levels of HuNIP6;1 were detected at Os 3 in the petals and sepals, Os 5 in ovary, and the first segment of calyx under 14 h/10 h day/night. However, HuNIP6;1 showed higher expression levels at Os 2 in the second segment of calyx, petals, and sepals under 24 h/0 h day/night. HuNIP6;1 was upregulated from Os 3 to Os 4 in all tissues except for the sepals under 14 h/10 h day/night, compared to down-regulation from Os 5 to Os 6 in all tissues at the two conditions.

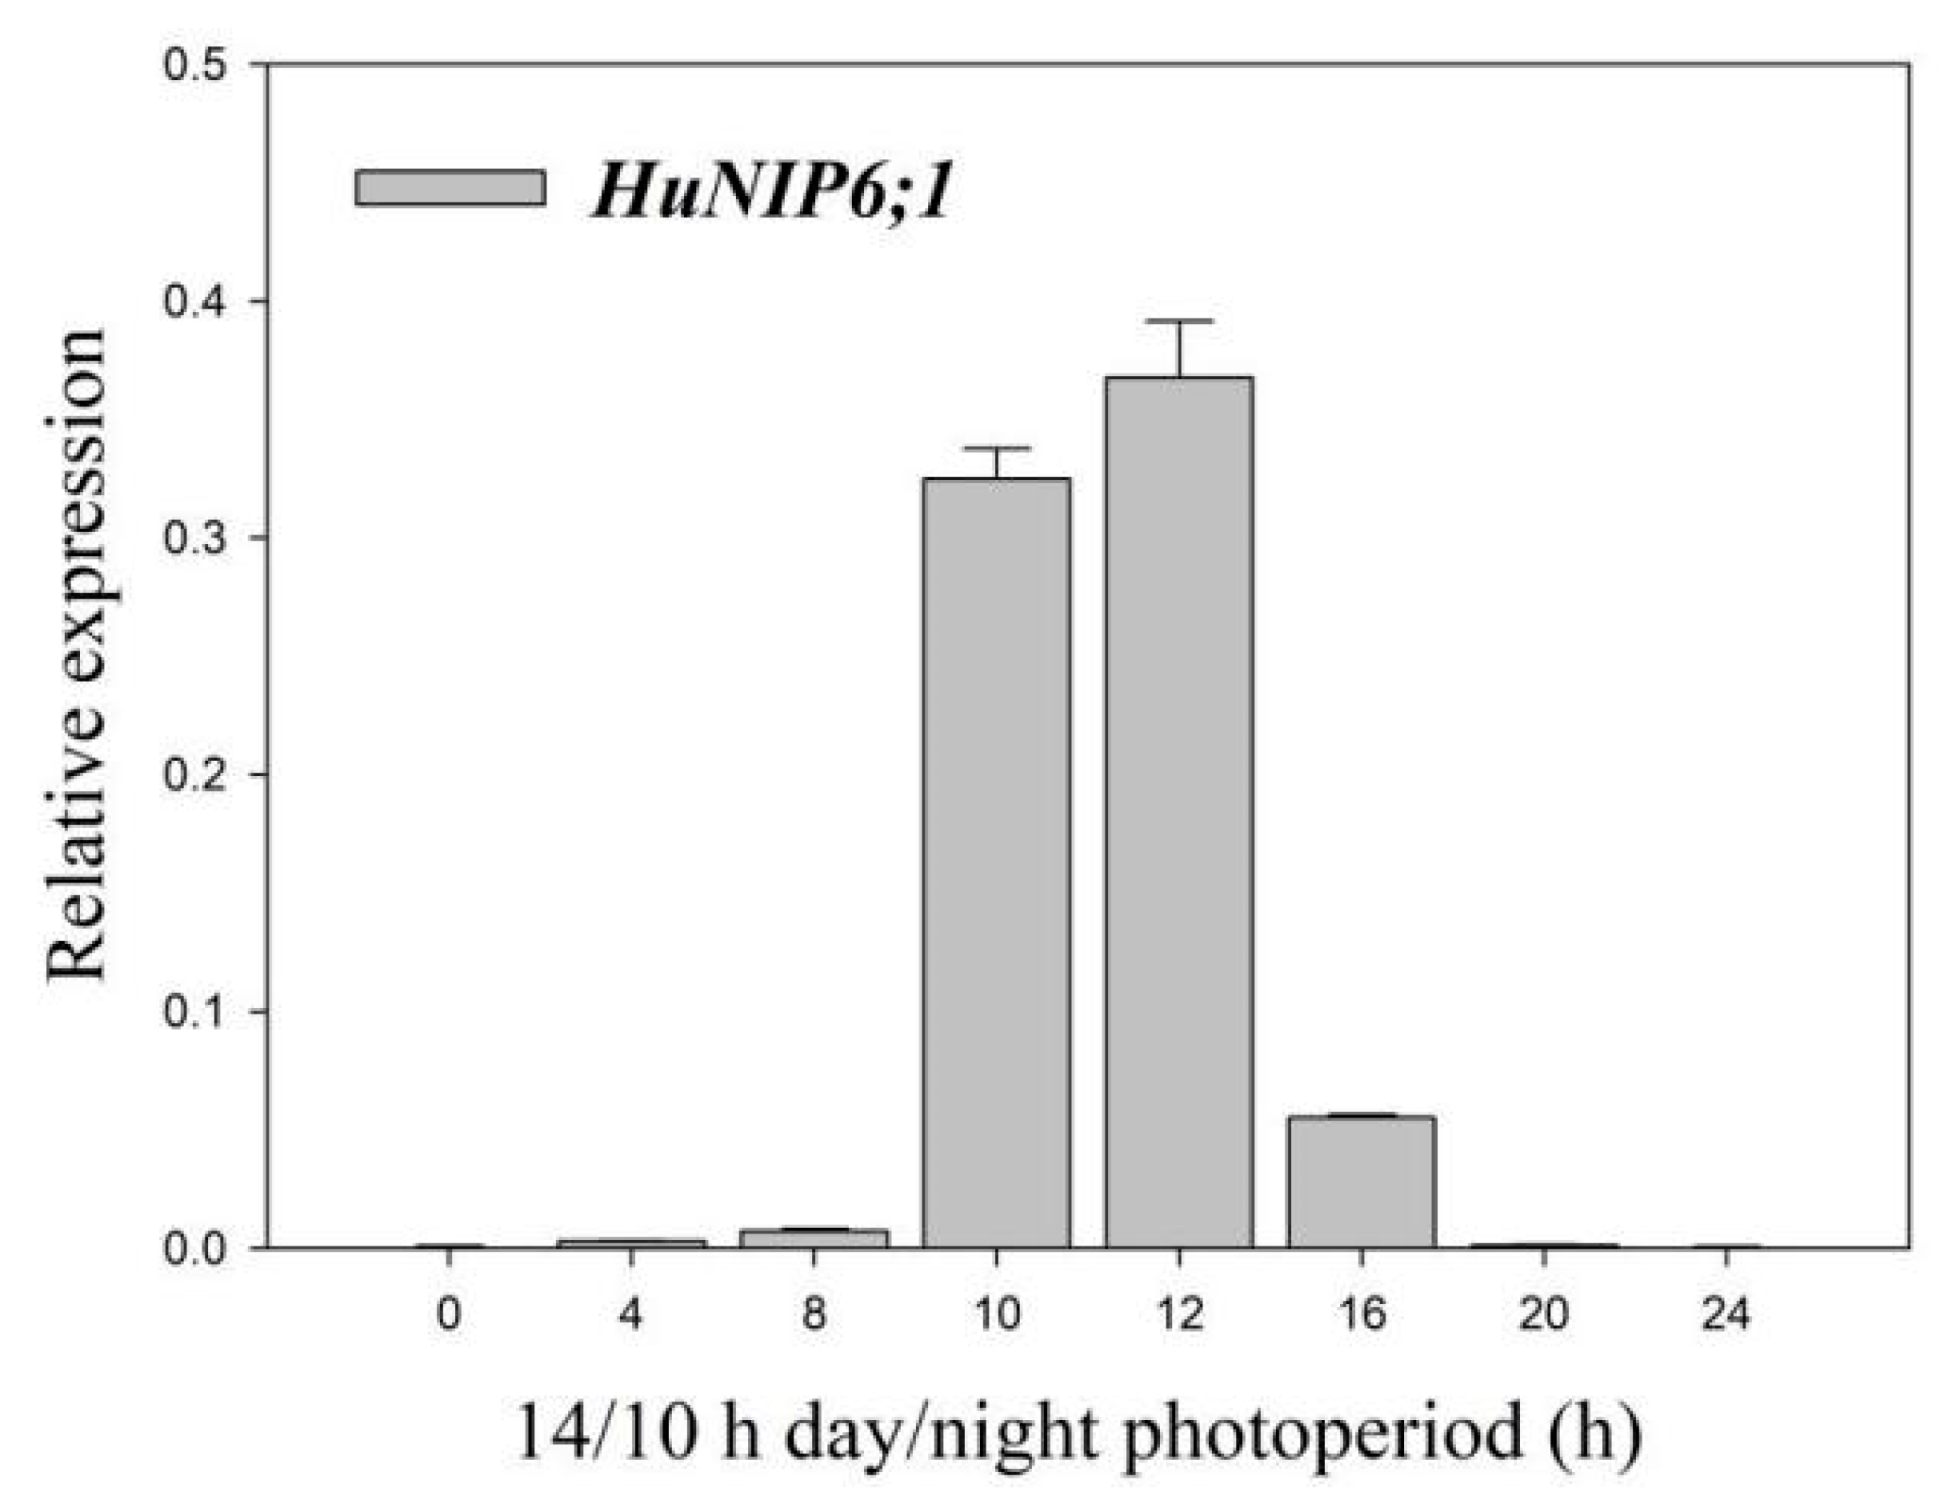
2.6. Expression Pattern of HuNIP6;1 in Diurnal Cycle in Pitaya under 14 h/10 h Day/Night

Circadian rhythm is synchronized with the circadian cycle, and plants contain a circadian clock that can coordinate internal and external cues to adapt to the environment. The expression patterns of HuNIP6;1 in the diurnal cycle were analyzed in petals by RT-qPCR (Figure 6). During the flower opening of pitaya, the expression levels of HuNIP6;1 increased from 0 h and reached its maximum at 12 h, and decreased thereafter. The results were consistent with the process of pitaya flower opening.

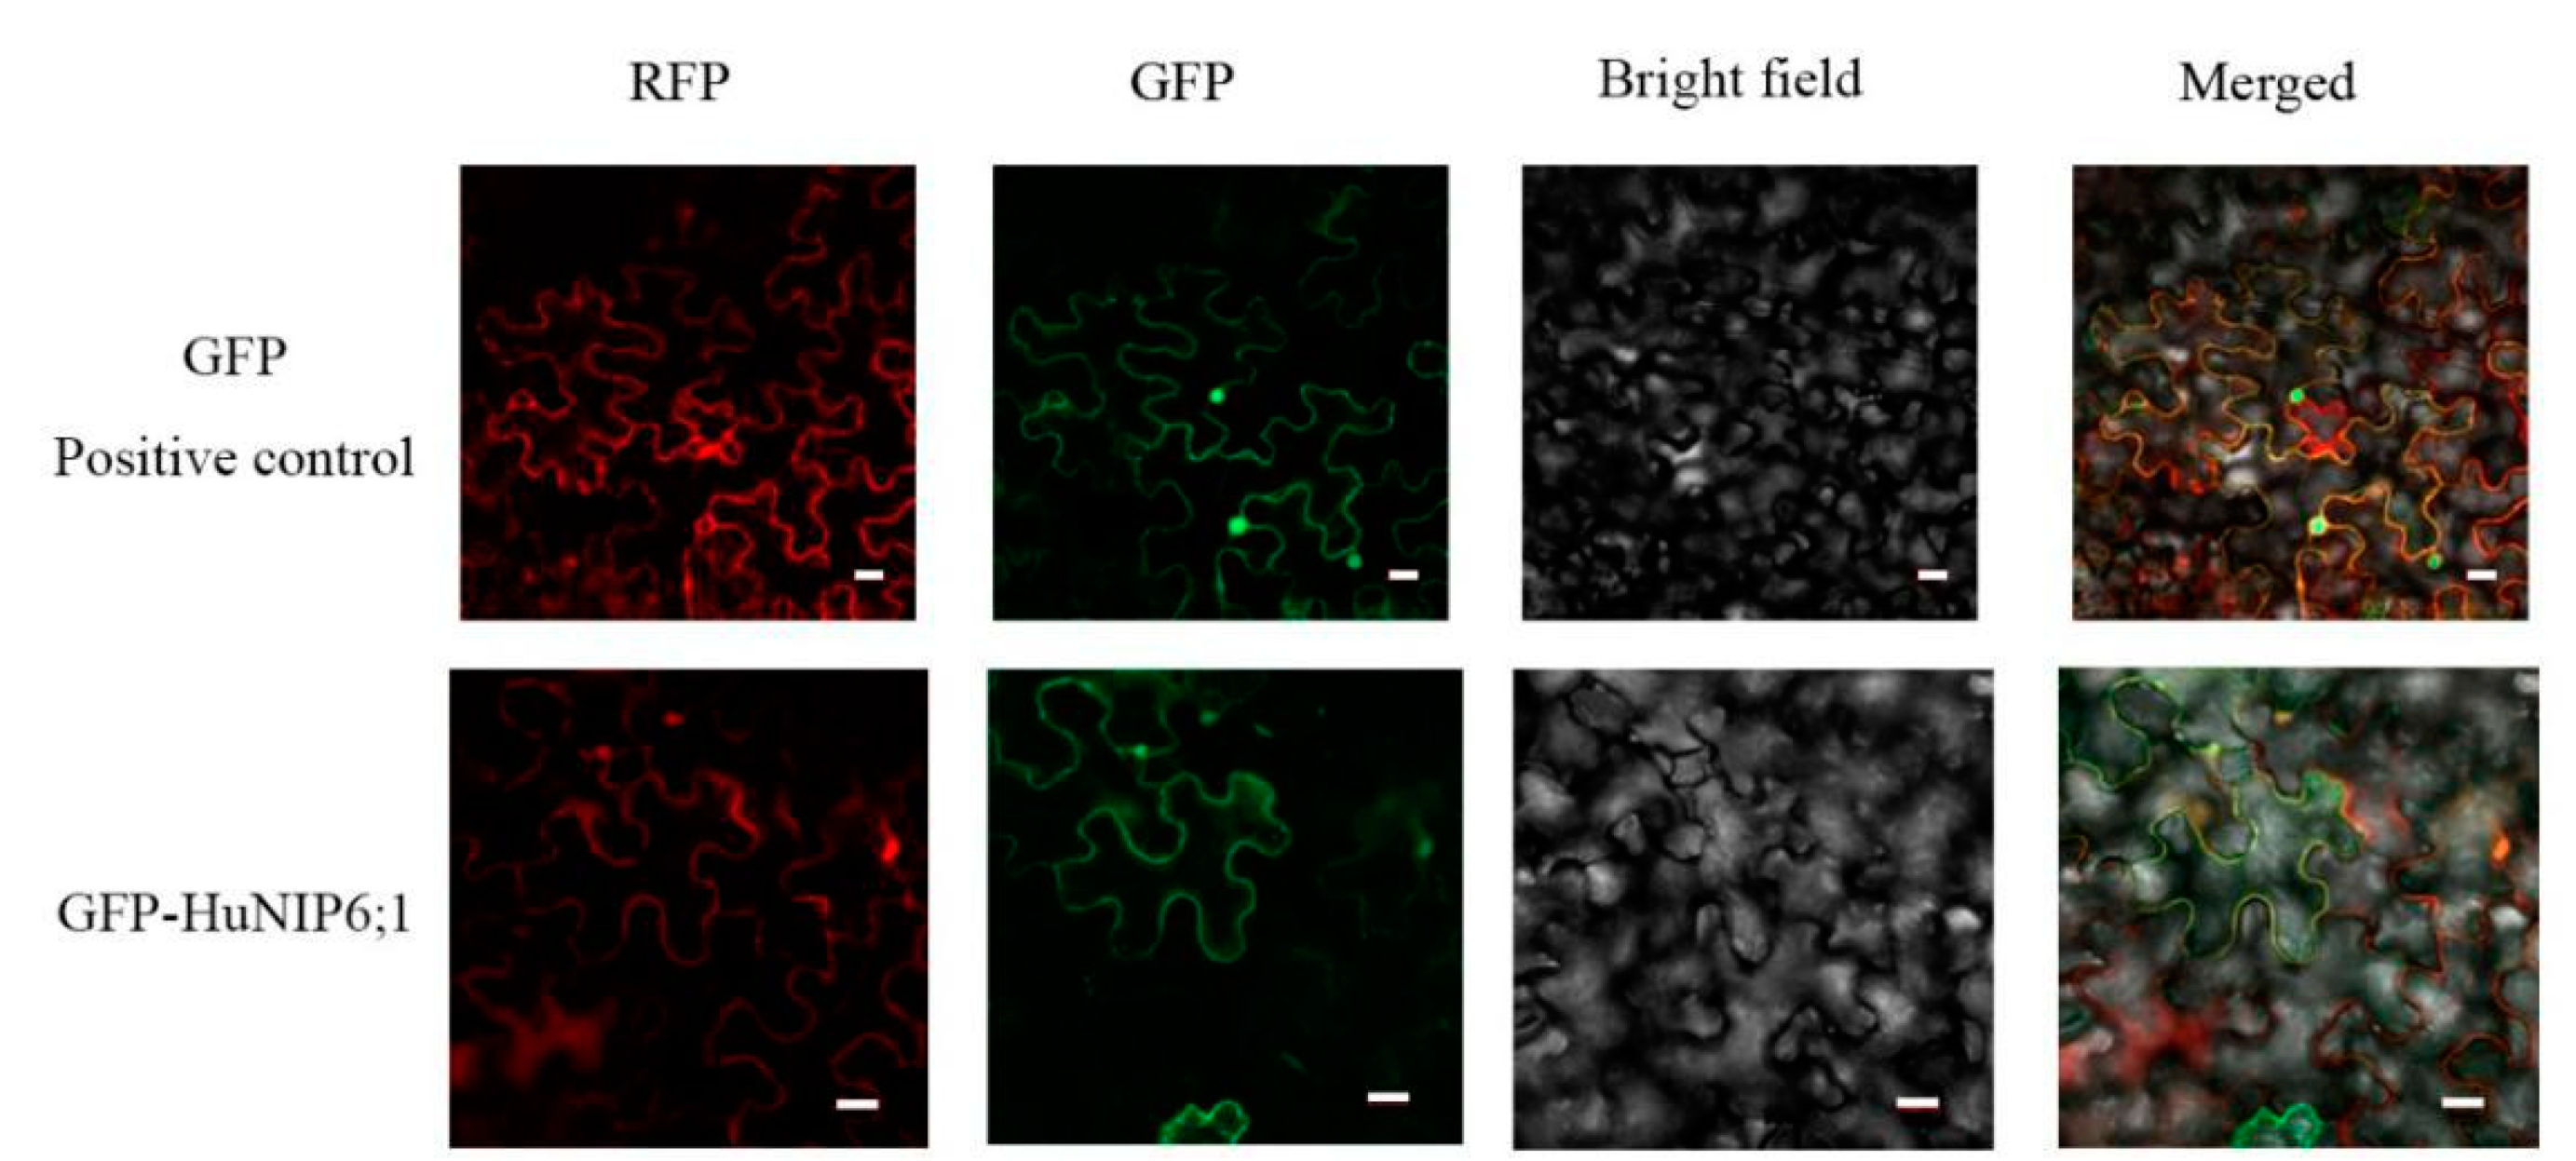
2.7. Subcellular Localization of HuNIP6;1

Subcellular localization of HuNIP6;1 was analyzed using transient expression of constructs in epidermal cells of N. benthamiana. The fluorescence for HuNIP6;1 was apparently localized in the cell membrane, while the GFP signal for the positive control was observed in both the cell membrane and nucleus (Figure 7).

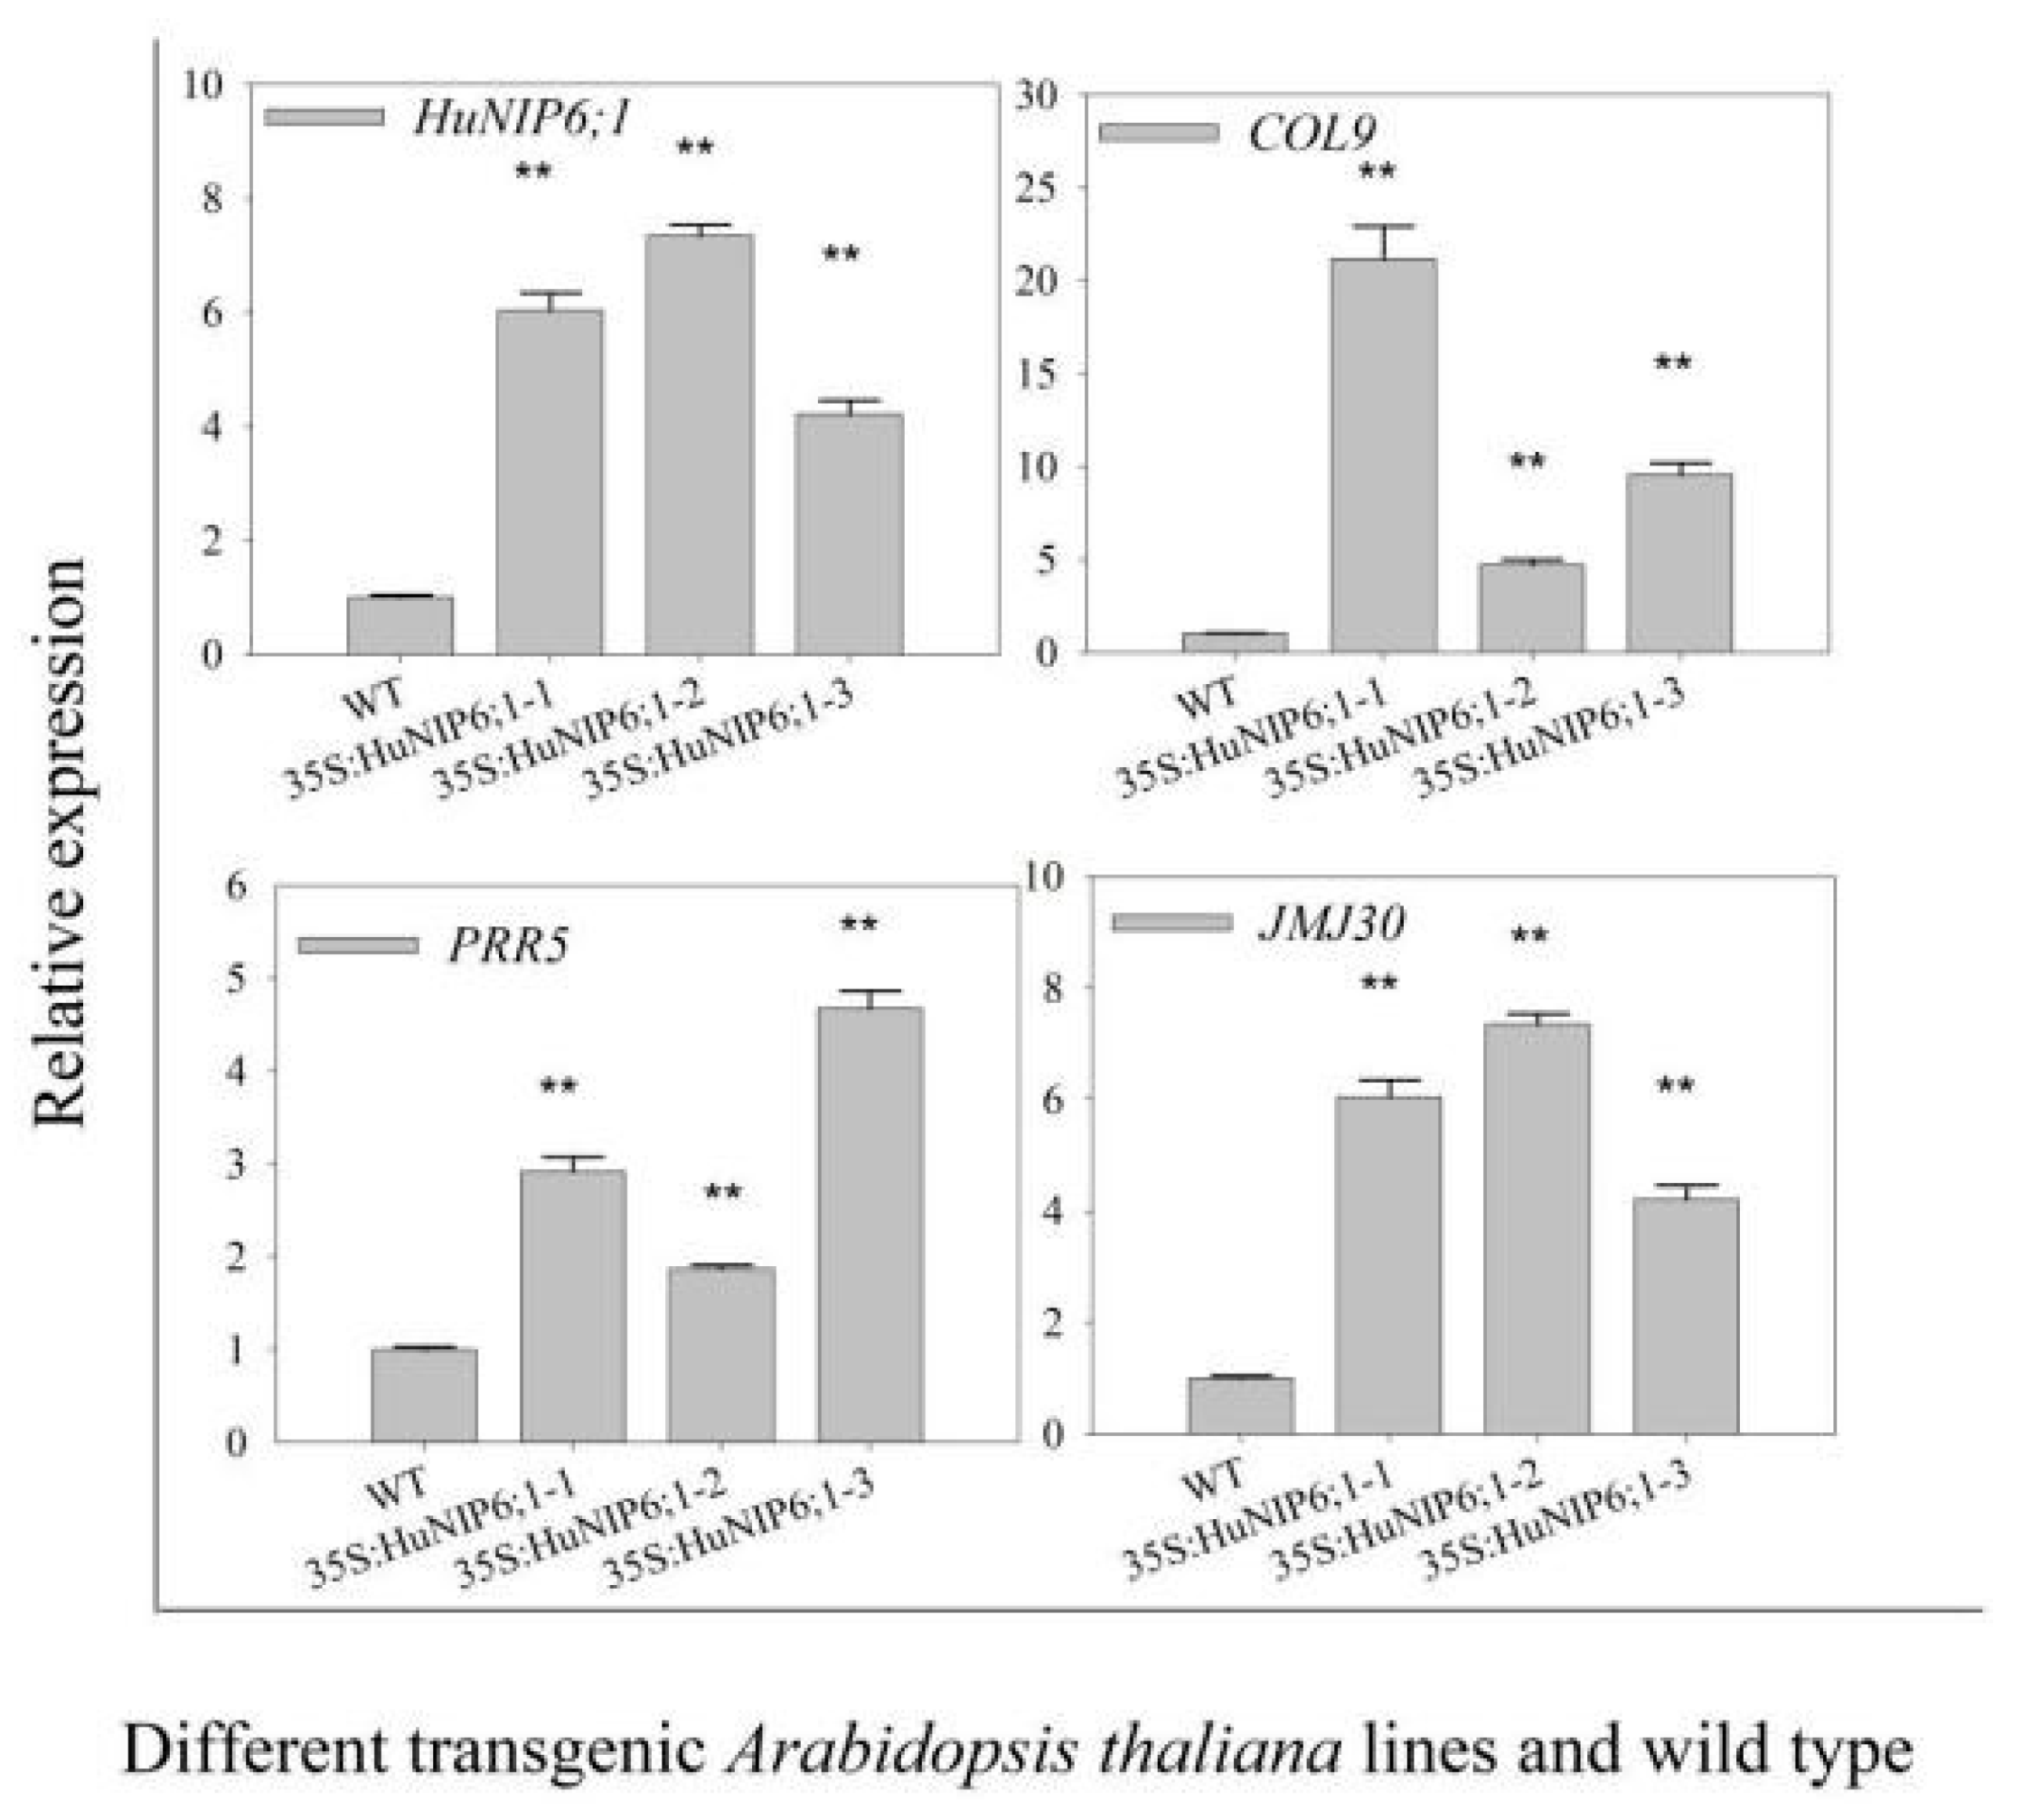
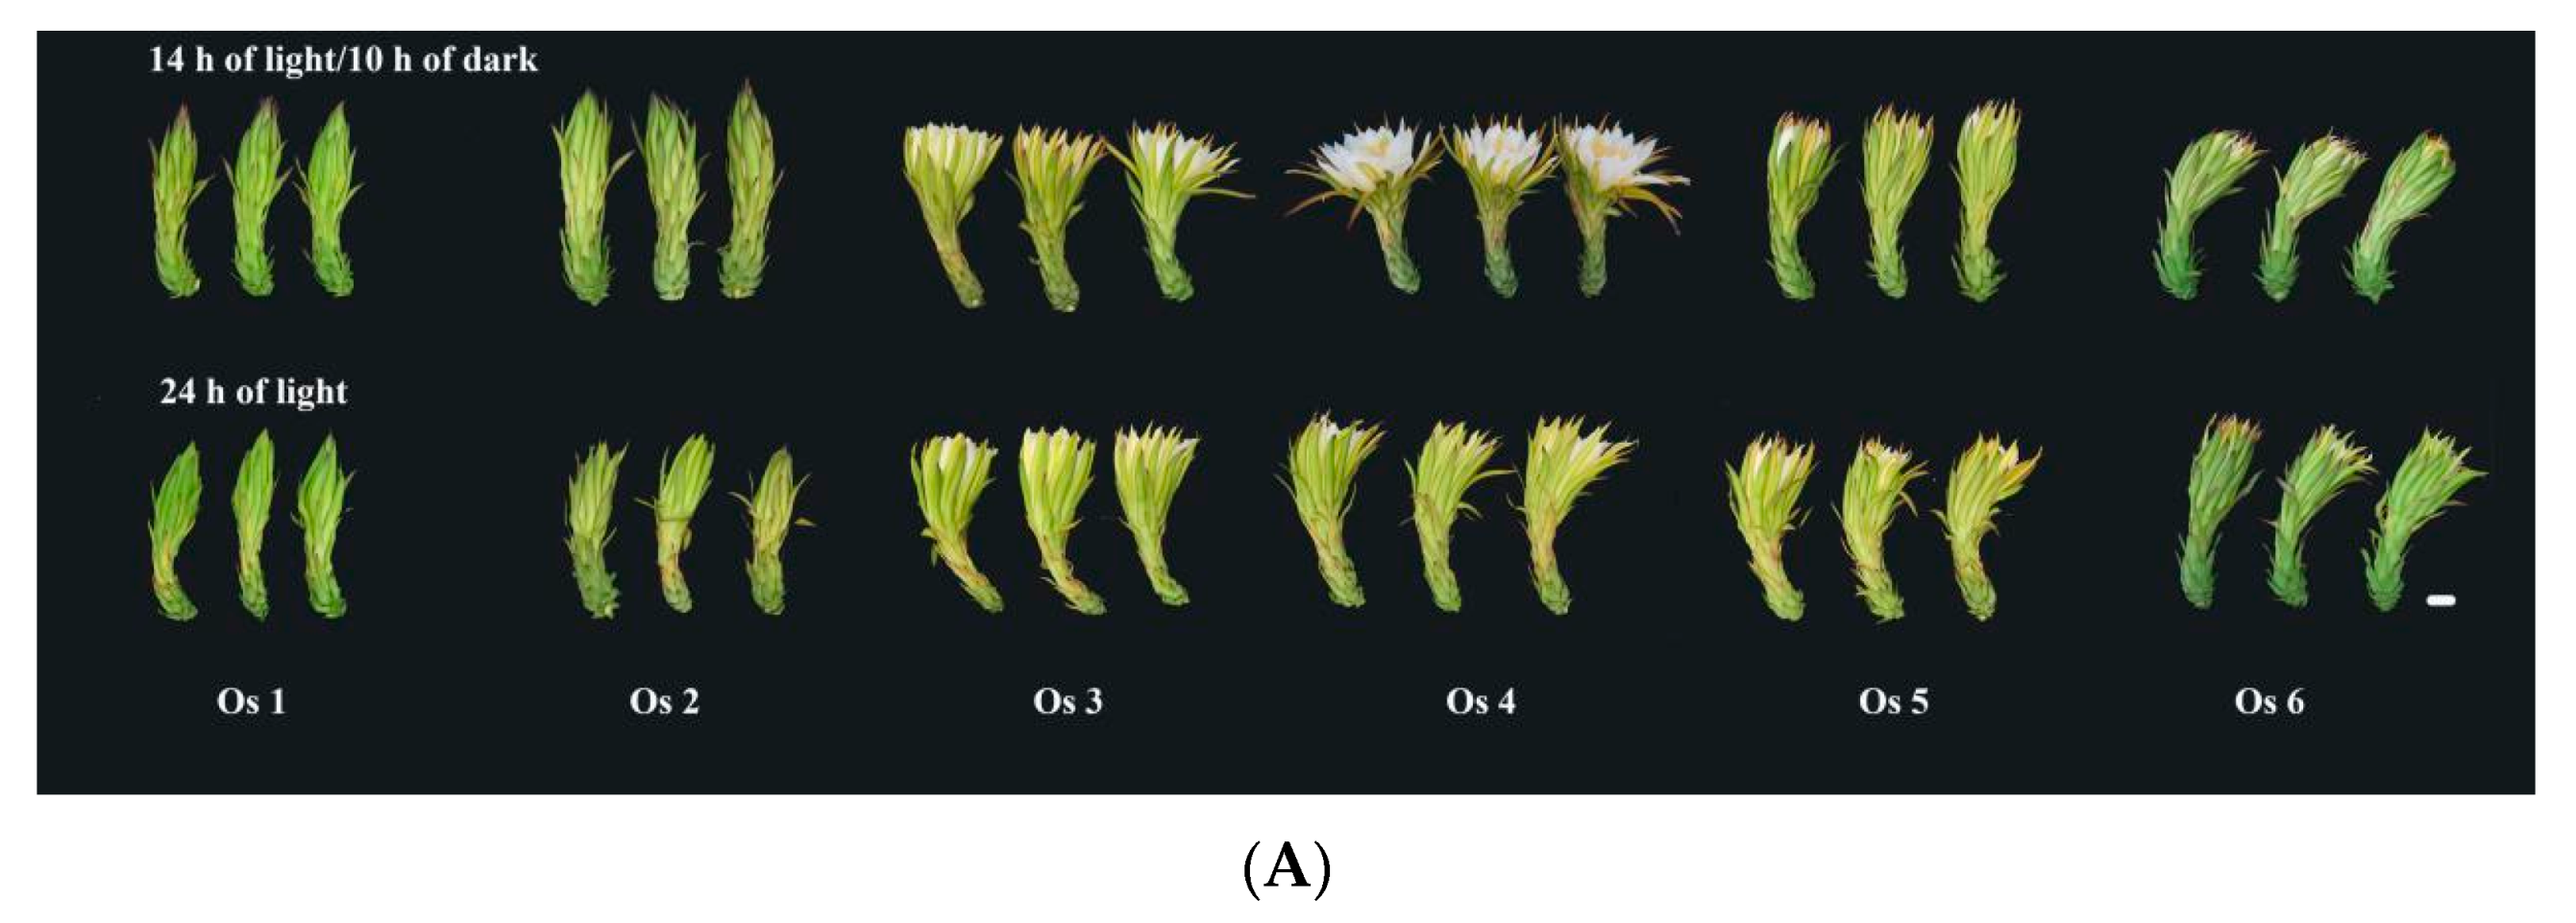
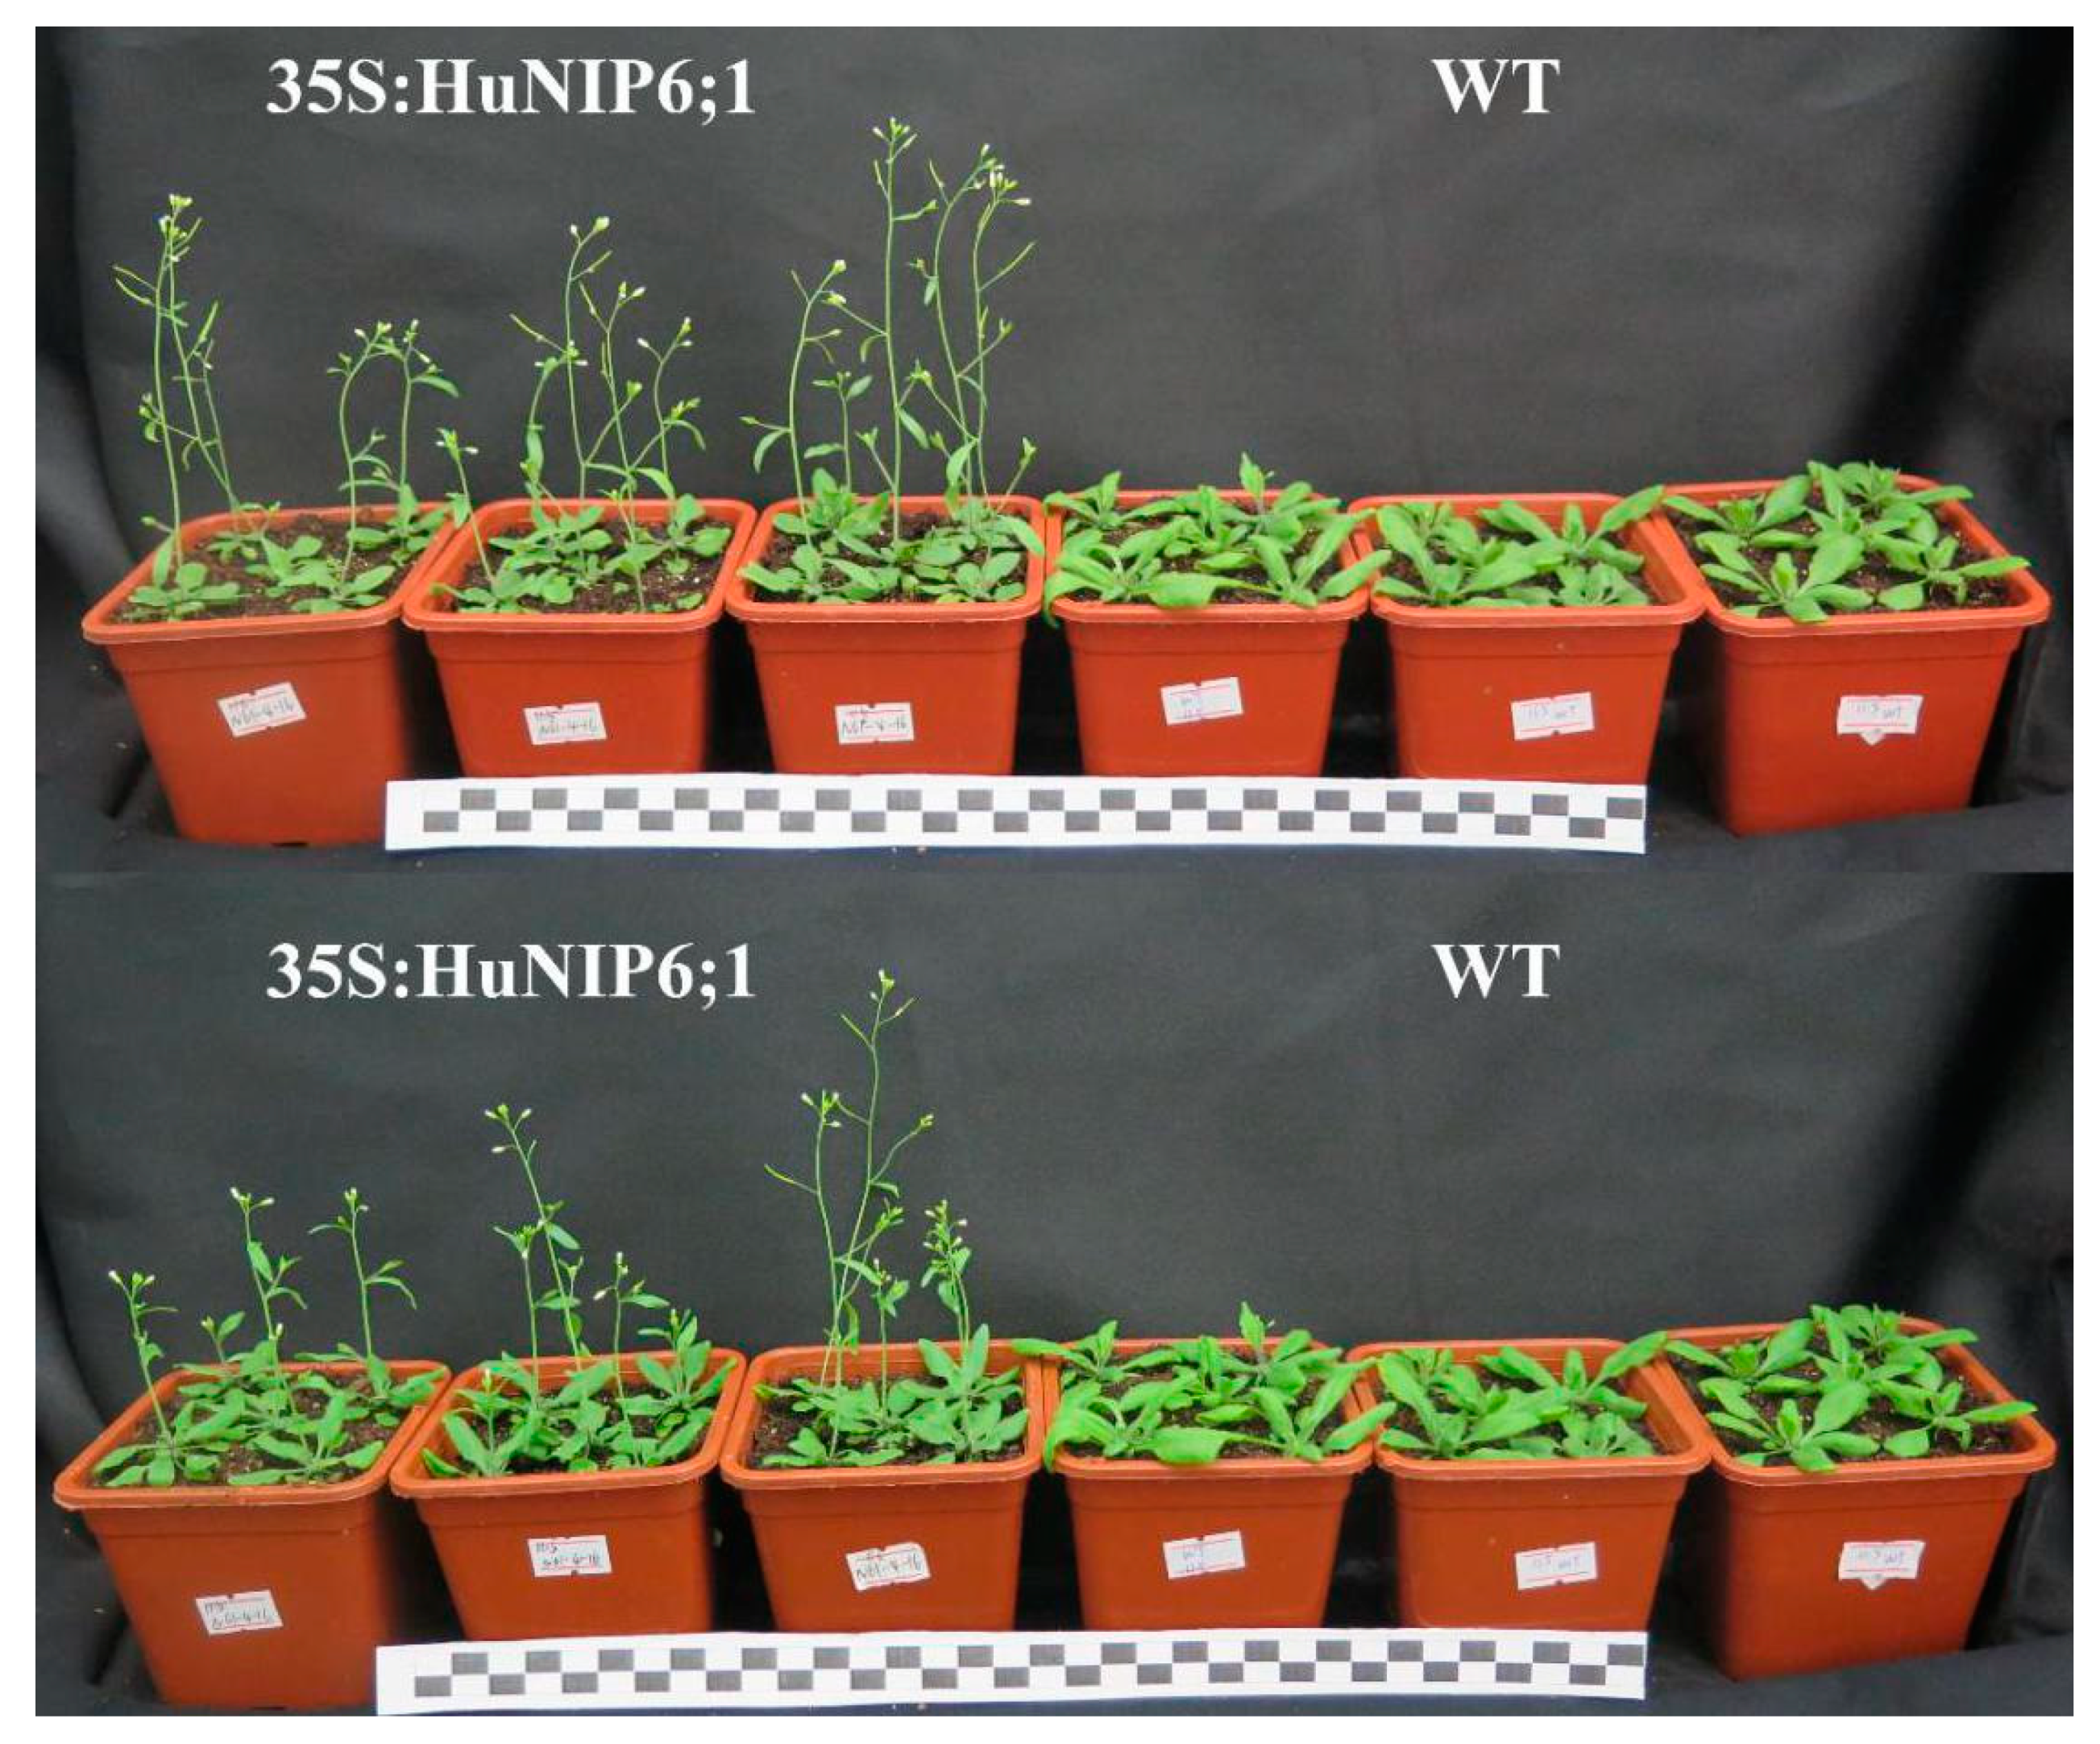
2.8. Over-Expression of HuNIP6;1 in Arabidopsis thaliana

To further confirm the role of HuNIP6;1, we generated transgenic A. thaliana plants constitutively expressing HuNIP6;1 driven by the 35S promoter (Figure 8 and Figure 9). Six different transgenic lines were obtained. Over-expression of HuNIP6;1 in A. thaliana plants resulted in early flowering. The flowering time of 35S::HuNIP6;1 transgenic plants was significantly earlier than that of wild-type. The transgenic lines had higher bolting height, as well as more flower buds, fruit pods, rosette leaves, and bolting (Table 2). The expression levels of HuNIP6;1, MJM30, COL9, and PRR5 in the transgenic lines were significantly higher than that of wild-type. However, no significant changes of positive flowering regulators such as FT, FD, CO, LFY, and SCO1 were detected in transgenic HuNIP6;1 Arabidopsis (data not shown). Those results suggested that HuNIP6;1 has significant functions in flowering of transgenic A. thaliana through regulating the other flowering-related genes.

3. Discussion and Conclusions

AQPs are crucial membrane transport proteins participating in the transport of water and/or small neutral solutes in plants. AQPs family members have been identified in plant species such as A. thaliana [3], Brassica oleracea [35], Zea mays [4], B. vulgaris [5], and C. lanatus [6]. In this study, the genome-wide identification and characterization of pitaya AQPs (HuAQPs) was performed using available genomic sequence data (http://www.pitayagenomic.com/) (Accessed on 15, July, 2021). The evolutionary relationships, gene structures, exon–intron distribution, conserved motifs, chromosomal distribution, and expression patterns of HuAQPs were analyzed. After excluding incomplete ORFs without MIP domain and NPA motifs, a total of 33 HuAQP genes (10 PIPs, 13 TIPs, 8 NIPs, and 2 SIPs) distributed in 9 chromosomes were identified. All groups contained HuAQP genes, except for XIP group. The XIP group contained one gene from D. caryophyllus and B. vulgaris [5,29]. Similar results were reported in chickpea, Medicago, and Lotus japonicus [36,37]. The number of exons in most HuAQP genes within PIP, TIP, NIP, and SIP was four, three, five, and three, respectively, suggesting that HuAQPs were highly conserved. A similar exon–intron structure is found in the other plants such as sweet orange [38], M. truncatula [39], watermelon [6], and longan [40].
Petals were the crucial to the flower opening and closure of Nymphaea caerulea [41]. The growth of carnation petals is controlled by coordinated gene expression during the progress of flower opening [42,43]. AQPs play an important role in the expansion of petal cells [17,26,42]. Rh-PIP2;1, a rose AQP gene, is involved in ethylene-regulated petal expansion. After silencing of Rh-PIP2;1 in rose flowers, petal expansion was greatly inhibited [26]. DcaPIP1;3, DcaPIP2;2, DcaPIP2;5, DcaTIP1;4, and DcaTIP2;2 are considered to be involved in flower-opening stages in carnation [29]. In this study, the similar gene structure and the conserved motif were found in the same subfamilies; however, their expression patterns were different (Figure 4), suggesting that different members of the same subfamily played different roles during pitaya flowering. The expression of HuPIP1;1, HuPIP1;2, HuPIP1;4, HuPIP1;5, HuPIP2;1, HuPIP2;2, and HuPIP2;5 showed increasing patterns, and then decreased during pitaya flower opening under 14 h/10 h day/night, indicating they may play roles in flower opening. HuTIP5;1, HuSIP1;1, HuSIP1;2, HuNIP4;3, and HuNIP6;2 had preferential expressions in the Os 6 (periods after flowering) under the two conditions, indicating that they may be involved in flower withering.
HuNIP6;1, a novel AQP gene located in Chr 3, was obtained from the genome data of pitaya. The length of the HuNIP6;1 protein was 304 AAs, which is similar to other plants, such as 306 AAs in B. vulgaris [5] and 307 AAs in D. caryophyllus [29]. Results from expression analyses suggested that HuNIP6;1 may be involved in the process of pitaya flowering. The subcellular localization showed that HuNIP6;1 is located at the cell membrane. Over-expression of HuNIP6;1 in A. thaliana significantly resulted in early flowering (Figure 8 and Figure 9). MJM30, COL9, and PRR5 were negative flowering regulators [44,45,46]. In the present study, over-expression of HuNIP6;1 in Arabidopsis significantly prompted expression of MJM30, COL9, and PRR5. Those results suggested that the over-expression of HuNIP6;1 broke the original cycle by regulating the expression of MJM30, COL9, and PRR5 to a normal rhythm in Arabidopsis. However, the mechanism of interaction between HuNIP6;1 and the other flowering-related genes is unknown, and further study is necessary to elucidate it.
In summary, our study provides the first genome-wide analysis of the AQP family in pitaya. A total of 33 HuAQP genes were identified and divided into four subfamilies. A novel AQP gene; i.e., HuNIP6;1, belonging to a member of the Group NIP family, was obtained, and was located at the cell membrane. Over-expression of the HuNIP6;1 gene in A. thaliana resulted in a significant early flowering, suggesting that HuNIP6;1 plays a significant role in pitaya flowering. The results of the present study provide valuable information for a better understanding of AQPs during the flower-opening process of pitaya.

4. Materials and Methods

4.1. Sequence Analysis

Multiple sequence alignment of the amino acid sequences was performed using DNAMAN software (LynnonBiosoft, San Ramon, CA, USA) and TMHMM (server version 2.0, http://www.cbs.dtu.dk/services/TMHMM/). Amino acid number, molecular weights, and theoretical pI were analyzed on the ExPASy website (http://web.expasy.org/potparam/).

4.2. Phylogenetic Analysis

The full-length amino acid sequences of AQPs were downloaded from TAIR (https://www.arabidopsis.org/), sugar beet genome RefBeet-1.2 (http://bvseq.molgen.mpg.de/Genome/Download/index.shtml), and Carnation DB (http://carnation.kazusa.or.jp/index.html). A maximum-likelihood phylogenetic tree was constructed using MEGAX software with a bootstrap test conducted 1000 times [47]. The phylogenetic tree was annotated with EVOLVIEW (http://120.202.110.254:8280/evolview).

4.3. Gene-Structure Analysis and Identification of Conserved Motifs

TBtools software (http://www.tbtools.com/) was used for the exon–intron structure analysis, and the conserved protein motifs were analyzed using the MEME (http://meme-suite.org/) website.

4.4. Chromosomal Distribution

The location information of the AQPs was obtained from the pitaya genome database (http://www.pitayagenomic.com/) (Accessed on 15 July 2021). The gene-location map was constructed using MapChart [48].

4.5. Plant Materials

The flowers of ‘Hongguan No. 1′ pitaya (H. monacanthus) were collected from Baiyun District, Guangzhou City, Guangdong Province, China. Flowers with 25 cm stems were picked on the 15th day after the flower bud formation in July and cultured at two different conditions: 14 h/10 h day/night and 24 h/0 h day/night at 25 °C. Samples were collected every 4 h from 20:00 on the same day (supposed as the 0 h). The flower-opening process was separated into six stages, including opening stage 1 (Os 1), 12 h after culture (periods before flowering); Os 2, 24 h after culture (periods before flowering); Os 3, 28 h after culture (periods during flowering); Os4, 32 h after culture (periods during flowering); Os 5, 36 h after culture (periods after flowering); and Os 6, 40 h after culture (periods after flowering) (Figure 10A). Ovaries, petals, sepals, and the first and second segments of calyx were collected for gene cloning and expression analyses (Figure 10B). To analyze the rhythmic expression of HuNIP6;1 in pitaya petal, the samples were collected every 4 h from 12:00 on the day of flowering (supposed as the 0 h). Three uniformly sized flowers from every period were sampled as three replicates. All samples were immediately frozen in liquid nitrogen and stored at –80 °C until use.

4.6. RNA Isolation, cDNA Synthesis and RT-qPCR Analyses

RNA was isolated using the EASYspin Plus Plant Quick RNA isolation Kit (RN38) (Aidlab Biotechnology, Beijing, China) according to the manufacturer’s instructions. The first strand cDNA was synthesized using the PrimeScript™ RT Reagent Kit with gDNA Eraser (TaKaRa, Shiga, Japan). The primers of RT-qPCR were designed by BatchPrimer3v1.0 (http://batchprimer3.bioinformatics.ucdavis.edu/index.html) and the Actin (1) reference gene was used as the internal control [49]. The primers used for RT-qPCR are listed in Table S1. RT-qPCR was carried out using a LightCycler 480Ⅱ real-time PCR system (Roche, Switzerland) using the RealUniversal Color PreMix (SYBR Green) (TIANGEN, Beijing, China) according to the manufacturer’s instructions. Three biological replicates were performed for each sample. The relative expression levels were calculated using the comparative 2−△△CT method [50].

4.7. Cloning of HuNIP6;1 Gene

HuNIP6;1 was cloned using specific primers of ATGGATGCTGAGGATCCCGG and TCATCTCCGGAAGCTTGGTG following the procedure of Xie et al. [51].

4.8. Subcellular Localization of HuNIP6;1

The full-length coding sequence of HuNIP6;1 was inserted into the pCAMBIAL1300-eGFP vector. Agrobacterium tumefaciens GV3101 cells carrying 35S-HuNIP6;1-eGFP or GFP-positive control were infiltrated into tobacco (Nicotiana benthamiana) leaves, respectively. Imagines were viewed with a confocal laser microscope (ZEISS LCM-800, Oberkochen, Germany).

4.9. Arabidopsis thaliana Transformation and Phenotypic Analysis

The full-length of HuNIP6;1 was subcloned into the pPZP6k90 vector under the control of the 35S promoter and transformed into A. thaliana by the Agrobacterium tumefaciens-mediated method. The 35S:HuNIP6;1 transformed lines were identified by PCR detection, and the expression levels of HuNIP6;1 were analyzed by RT-qPCR. The phenotypes of T4 homozygous transgenic plants were analyzed and photographed with a digital camera (G16, Canon).

Supplementary Materials

The following are available online at https://www.mdpi.com/article/10.3390/ijms22147689/s1.

Author Contributions

Conception and design of the experiments, X.Y., Y.G. and Y.Q.; performance of the experiments, X.Y.; analysis of data, X.Y., Y.G., C.C., F.X. and Q.H.; contribution of reagents/materials/analysis tools, Z.Z., R.Z., J.Z. and G.H.; writing and revision of the paper, X.Y. and Y.Q. All authors have read and agreed to the published version of the manuscript.

Funding

This work was supported by the Key Science and Technology Planning Project of Guangzhou (grant no. 201904020015), Science and Technology Program of Zhanjiang (grant no. 2019A01003), Science and Technology Program of Guangzhou (grant nos. 202002020060, 201704020003, and 2014Y2-00164), and the Key Realm R&D Program of Guangdong Province (grant no. 2018B020202011).

Institutional Review Board Statement

Not applicable.

Informed Consent Statement

Not applicable.

Data Availability Statement

Data is contained within the article and Supplementary Material.

Conflicts of Interest

The authors declare no conflict of interest.

Abbreviations

AAAmino acid
AQPAquaporin
CCA1Circadian clock associated 1
cDNAComplementary DNA
COConstans
COL9Constans-like 9
FDFlowering locus D
LFYLEAFY
FTFlowering locus T
GFPGreen fluorescent protein
eGFPEnhance green fluorescent protein
kDaKilodaltons
LHYLate elongated hypocotyl
MJMJumonji-C domain-containing protein
NCBINational Center for Biotechnology Information
ORFOpen reading frame
pITheoretical isoelectric
PRRPseudo response regulator
RT-qPCRReverse transcription quantitative real-time polymerase chain reaction
SOC1Suppressor of overexpression of constans 1
TOC1Timing of CAB expression 1

References

  1. Denker, B.M.; Smith, B.L.; Kuhajda, F.P.; Agre, P. Identification, purification, and partial characterization of a novel Mr 28,000 integral membrane protein from erythrocytes and renal tubules. J. Biol. Chem. 1988, 263, 34–42. [Google Scholar] [CrossRef]
  2. Preston, G.M.; Carroll, T.P.; Guggino, P.; Agre, P. Appearance of water channels in Xenopus oocytes expressing red cell CHIP28 Protein. Science 1992, 358, 385–387. [Google Scholar] [CrossRef] [Green Version]
  3. Johanson, U.; Karlsson, M.; Johansson, I.; Gustavsson, S.; Sjövall, S.; Fraysse, L.; Weig, A.R.; Kjellbom, P. The complete set of genes encoding major intrinsic proteins in Arabidopsis provides a framework for a new nomenclature for major intrinsic proteins in plants. Plant Physiol. 2001, 126, 1358–1369. [Google Scholar] [CrossRef] [PubMed] [Green Version]
  4. François, C.; François, B.; Eva, W.; Maarten, J.; Chrispeels, R.J. Aquaporins constitute a large and highly divergent protein family in maize. Plant Physiol. 2001, 125, 1206–1215. [Google Scholar] [CrossRef] [Green Version]
  5. Kong, W.L.; Yang, S.Z.; Wang, Y.L.; Mohammed, B.; Fu, X.P. Genome-wide identification and characterization of aquaporin gene family in Beta vulgaris. PeerJ 2017, 5, e3747. [Google Scholar] [CrossRef] [Green Version]
  6. Zhou, Y.; Tao, J.J.; Golam, J.A.; Li, J.W.; Yang, Y.X. Genome-wide identification and expression analysis of aquaporin gene family related to abiotic stress in watermelon. Genome 2019, 62, 643–656. [Google Scholar] [CrossRef] [PubMed]
  7. Zhu, Y.X.; Yang, L.; Liu, N.; Yang, J.; Zhou, X.K.; Xia, Y.C.; He, Y.; He, Y.Q.; Gong, H.J.; Dong, F.; et al. Genome-wide identification structure characterization, and expression pattern profiling of aquaporin gene family in cucumber. BMC Plant Biol. 2019, 1, 345. [Google Scholar] [CrossRef] [PubMed] [Green Version]
  8. Sui, H.; Han, B.G.; Lee, J.K.; Walian, P.; Jap, B.K. Structural basis of water-specific transport through the AQP1 water channel. Nature 2001, 414, 872–878. [Google Scholar] [CrossRef] [PubMed] [Green Version]
  9. Fu, D.; Libson, A.; Miercke, L.J.; Weitzman, C.; Nollert, P.; Krucinski, J. Structure of a glycerol-conducting channel and the basis for its selectivity. Science 2000, 290, 481–486. [Google Scholar] [CrossRef] [Green Version]
  10. Zou, Z.; Gong, J.; Huang, Q.X.; Mo, Y.Y.; Yang, L.F.; Xie, G.S. Structure of a glycerol-conducting channel and the basis for its selectivity. PLoS ONE 2015, 10, e0141022. [Google Scholar] [CrossRef]
  11. Maurel, C.; Boursiac, Y.; Luu, D.-T.; Santoni, V.; Shahzad, Z.; Verdoucq, L. Aquaporins in plants. Physiol. Rev. 2015, 95, 1321–1358. [Google Scholar] [CrossRef]
  12. Ma, J.F.; Kazunori, T.; Naoki, Y.; Namiki, M.; Saeko, K.; Maki, K.; Ishiguro, M.; Murata, Y.; Yano, M. A silicon transporter in rice. Nature 2006, 440, 688–691. [Google Scholar] [CrossRef]
  13. Paul, R.H.; Christian, P.C.; Sara, D.B.; Lynne, M.R.; Lorenzo, F. Fluorescent reporter proteins for the tonoplast and the vacuolar lumen identify a single vacuolar compartment in Arabidopsis cells. Plant Physiol. 2007, 145, 1371–1382. [Google Scholar] [CrossRef] [Green Version]
  14. Azeez, B.; Dominique, T.; Christophe, D.; Lisa, S.; Nathalie, L.C.; Francis, M.; Schoefs, B.; Bouhidel, K. Life with and without AtTIP1;1, an Arabidopsis aquaporin preferentially localized in the apposing tonoplasts of adjacent vacuoles. Plant Mol. Biol. 2009, 70, 193–209. [Google Scholar] [CrossRef]
  15. Christopher, E.; Gea, G.; Xabier, L. How is silicic acid transported in plants? Silicon 2020, 12, 2641–2645. [Google Scholar] [CrossRef] [Green Version]
  16. Sarda, X.; Tousch, D.; Ferrare, K.; Legrand, E.; Dupuis, J.M.; Casse-Delbart, F.; Lamaze, T. Two TIP-like genes encoding aquaporins are expressed in sunflower guard cells. Plant J. 1997, 12, 1103–1111. [Google Scholar] [CrossRef] [PubMed] [Green Version]
  17. Heinen, R.B.; Qing, Y.; François, C. Role of aquaporins in leaf physiology. J. Exp. Bot. 2009, 60, 2971–2985. [Google Scholar] [CrossRef] [Green Version]
  18. Norbert, U.; Beate, O.; David, T.H.; Matthias, F.; Nate, M.; Ralf, K. Function of Nicotiana tabacum aquaporins as chloroplast gas pores challenges the concept of membrane CO2 permeability. Plant Cell 2008, 20, 648–657. [Google Scholar] [CrossRef] [Green Version]
  19. Gao, Z.X.; He, X.L.; Zhao, B.C.; Zhou, C.J.; Liang, Y.Z.; Ge, R.C.; Shen, Y.Z.; Huang, Z.J. Overexpressing a putative aquaporin gene from wheat, TaNIP, enhances salt tolerance in transgenic Arabidopsis. Plant Cell Physiol. 2010, 51, 767–775. [Google Scholar] [CrossRef] [Green Version]
  20. Gerd, P.B.; Robert, B.; Marie, C.; Berny, F.C.; Gerd, P.; Bienert, R.B.; Heinen, M.C.; Berny, F.C. Maize plasma membrane aquaporin ZmPIP2;5, but not ZmPIP1;2, facilitates transmembrane diffusion of hydrogen peroxide. Biochim. Biophys. Acta 2014, 1838, 216–222. [Google Scholar] [CrossRef] [Green Version]
  21. Jiang, C.; Song, X.Q.; He, H.; Chu, L.W.; Zhou, H.J.; Zhao, Y.Q.; Xu, Y.K.; Zeng, W.; Lin, X.C.; Lu, M.Z. Genome-wide identification of plasma membrane aquaporin gene family in Populus and functional identification of PIP1;1 involved in osmotic stress. Environ. Exp. Bot. 2020, 179. [Google Scholar] [CrossRef]
  22. Mott, I.W.; Wang, R.R.C. Comparative transcriptome analysis of salt-tolerant wheat germplasm lines using wheat genome arrays. Plant Sci. 2007, 173, 327–339. [Google Scholar] [CrossRef]
  23. Kapilan, R.; Vaziri, M.; Zwiazek, J.J. Regulation of aquaporins in plants under stress. Biol. Res. 2018, 51, 4. [Google Scholar] [CrossRef] [PubMed]
  24. Martin, O.B.; Charles, B.; Matton, D.P. Characterization of a fertilization-induced and developmentally regulated plasma-membrane aquaporin expressed in reproductive tissues, in the wild potato Solanum chacoense Bitt. Planta 2002, 3, 485–493. [Google Scholar] [CrossRef]
  25. Marc, B.; Frank, V.; Mieke, W.A.; Koen, W.; Henk, V.; Celestina, M. Aquaporins of the PIP2 class are required for efficient anther dehiscence in tobacco. Plant Physiol. 2005, 137, 1049–1056. [Google Scholar] [CrossRef] [Green Version]
  26. Ma, N.; Xue, J.Q.; Li, Y.H.; Liu, X.J.; Dai, F.W.; Jia, W.S.; Luo, Y.B.; Gao, J.P. Rh-PIP2;1, a rose aquaporin gene, is involved in ethylene-regulated petal expansion. Plant Physiol. 2008, 148, 894–907. [Google Scholar] [CrossRef] [PubMed] [Green Version]
  27. Hajime, S.; Takehiro, S.; Ichiro, T. Expression analysis of genes encoding plasma membrane aquaporins during seed and fruit development in tomato. Plant Sci. 2006, 171, 277–285. [Google Scholar] [CrossRef]
  28. Paula, M.; Claudia, B.; Gustavo, M.; Karina, A.; Moira, S.; Marcos, C.; Gabriela, A. A fruit-specific plasma membrane aquaporin subtype PIP1;1 is regulated during strawberry (Fragaria×ananassa) fruit ripening. Physiol. Plant 2008, 132, 538–551. [Google Scholar] [CrossRef]
  29. Kong, W.L.; Mohammed, B.; Fu, X.P. Genome-wide identification and characterization of aquaporins and their role in the flower opening processes in Carnation (Dianthus caryophyllus). Molecules 2018, 23, 1895. [Google Scholar] [CrossRef] [Green Version]
  30. Lichtenzveig, J.S.; Abbo, A.; Nerd, N.; Tel-Zur Mizrahi, Y. Cytology and mating systems in the climbing cacti Hylocereus and Selenicereus. Am. J. Bot. 2000, 87, 1058–1065. [Google Scholar] [CrossRef]
  31. Mizrahi, Y.; Mouyal, J.; Nerd, A.; Sitrit, Y. Metaxenia in the vine cacti Hylocereus polyrhizus and Selenicereus spp. Ann. Bot. 2004, 93, 469–472. [Google Scholar] [CrossRef] [PubMed] [Green Version]
  32. Weiss, J.; Nerd, A.; Mizrahi, Y. Flowering behavior and pollination requirements in climbing Cacti with fruit crop potential. HortScience 1994, 29, 1487–1492. [Google Scholar] [CrossRef] [Green Version]
  33. Pushpakumara, D.K.N.G.; Gunasena, H.P.M.; Karyawasam, M. Flowering and fruiting phenology, pollination vectors and breeding system of dragon fruit (Hylocereus spp.). Sri Lankan J. Agric. Sci. 2005, 42, 81–91. [Google Scholar]
  34. Chen, J.Y.; Xie, F.F.; Cui, Y.Z.; Chen, C.B.; Lu, W.J.; Hu, X.D.; Hua, Q.Z.; Zhao, J.; Wu, Z.J.; Gao, D.; et al. A chromosome-scale genome sequence of pitaya (Hylocereus undatus) provides novel insights into the genome evolution and regulation of betalain biosynthesis. Hortic. Res. 2021, 8, 164. [Google Scholar] [CrossRef]
  35. Till, A.D.; Benjamin, P.; Nadine, B.; Anja, H.; Gerd, P.B. Genome-wide identification of aquaporin encoding genes in Brassica oleracea and their phylogenetic sequence comparison to Brassica crops and Arabidopsis. Front. Plant Sci. 2015, 6, 1–20. [Google Scholar] [CrossRef] [Green Version]
  36. Deokar, A.A.; Tar’an, B. Genome-wide analysis of the aquaporin gene family in Chickpea (Cicer arietinum L.). Front. Plant. Sci. 2016, 7, 1–18. [Google Scholar] [CrossRef] [PubMed] [Green Version]
  37. Deshmukh, R.; Bélanger, R.R. Molecular evolution of aquaporins and silicon influx in plants. Funct. Ecol. 2016, 30, 1277–1285. [Google Scholar] [CrossRef]
  38. Wei, Q.J.; Ma, Q.L.; Ma, Z.Z.; Zhou, G.F.; Feng, F.F.; Le, S.; Le, C.; Gu, Q. Genome-wide identification and characterization of sweet orange (Citrus sinensis) aquaporin genes and their expression in two citrus cultivars differing in drought tolerance. Tree Genet. Genomes 2019, 15, 17. [Google Scholar] [CrossRef]
  39. Min, X.; Wu, H.; Zhang, Z.; Wei, X.; Jin, X.; Ndayambaza, B.; Wang, Y.; Liu, W. Genome-wide identification and characterization of the aquaporin gene family in Medicago truncatula. J. Plant Biochem. Biot. 2019, 28. [Google Scholar] [CrossRef]
  40. Zhao, P.C.; Xu, X.P.; Zhang, C.Y.; Chen, X.H.; Xu, S.; Lin, Y.L.; Lai, Z.X. Genome-wide identification of Aquaporin family and expression during early somatic embryogenesis in Dimocarpus longan Lour. Appl. Environ. Microb. 2020. [Google Scholar] [CrossRef]
  41. Zhang, K.; Chen, X. The regulation of light on flowering biological clock in Nymphaeaceae. Chin. Horticulture Abstr. 2018, 5, 21–25. [Google Scholar]
  42. Taro, H.; Yuka, T.; Shigeto, M.; Takehiro, M.; Shigeru, S. Differential expression of genes identified by suppression subtractive hybridization in petals of opening carnation flowers. J. Exp. Bot. 2010, 61, 2345–2354. [Google Scholar] [CrossRef]
  43. van Doorn, W.G.; van Meeteren, U. Flower opening and closure: A review. J. Exp. Bot. 2003, 54, 1801–1812. [Google Scholar] [CrossRef]
  44. Barbara, A.M.P.; Rawan, Q.; Andrea, M.M.; Laura, T.; Andrea, S. TRANSPARENT TESTA GLABRA 1 participates in flowering time regulation in Arabidopsis thaliana. PeerJ 2020, 8, e8303. [Google Scholar] [CrossRef] [Green Version]
  45. Gan, E.S.; Xu, Y.F.; Wong, J.Y.; Jessamine, G.G.; Bo, S.; Wan, Y.W.; Huang, J.B.; Ito, T. Jumonji demethylases moderate precocious flowering at elevated temperature via regulation of FLC in Arabidopsis. Nat. Commun. 2014, 5. [Google Scholar] [CrossRef] [Green Version]
  46. Xiao, F.C.; Zeng, Y.W. Overexpression of COL9, a CONSTANS-LIKE gene, delays flowering by reducing expression of CO and FT in Arabidopsis thaliana. Plant J. 2005, 43, 758–768. [Google Scholar] [CrossRef]
  47. Kumar, S.; Stecher, G.; Tamura, K. MEGA7: Molecular evolutionary genetics analysis version 7.0 for bigger datasets. Mol. Biol. Evol. 2016, 33, 1870–1874. [Google Scholar] [CrossRef] [Green Version]
  48. Voorrips, R.E. MapChart: Software for the graphical presentation of linkage maps and QTLs. J. Hered. 2002, 93, 77–78. [Google Scholar] [CrossRef] [Green Version]
  49. Chen, C.B.; Wu, J.Y.; Hua, Q.Z.; Tel-Zur, N.; Xie, F.F.; Zhang, Z.K.; Chen, J.Y.; Zhang, R.; Hu, G.B.; Zhao, J.T. Identification of reliable reference genes for quantitative real-time PCR normalization in pitaya. Plant Methods. 2019, 15, 70. [Google Scholar] [CrossRef] [PubMed] [Green Version]
  50. Livak, K.J.; Schmittgen, T.D. Analysis of relative gene expression data using real-time quantitative PCR and the 2−∆∆CT method. Methods 2001, 25, 402–408. [Google Scholar] [CrossRef] [PubMed]
  51. Xie, F.F.; Hua, Q.Z.; Chen, C.B.; Zhang, L.L.; Zhang, Z.K.; Chen, J.Y.; Zhang, R.; Zhao, J.T.; Hu, G.B. Transcriptomics-based identification and characterization of glucosyltransferases involved in betalain biosynthesis in Hylocereus megalanthus. Plant Physiol. Bioch. 2020, 152, 112–124. [Google Scholar] [CrossRef] [PubMed]
Figure 1. Neighbor-joining phylogenetic tree of aquaporin proteins from Hylocereus undantus, Arabidopsis thaliana, Dianthus caryophyllus, and Beta vulgaris. The phylogenetic tree was constructed using MEGAX software with a bootstrap test conducted 1000 times. AQPs were divided into five subfamilies labeled with various colors to indicate different subfamilies.
Ijms 22 07689 g001
Figure 2. Phylogenetic relationship, gene structure, and conserved motif analyses of HuAQP genes. (A) A neighbor-joining phylogenetic tree constructed by MEGAX with 1000 bootstrap replicates using amino acid sequences of HuAQPs. (B) The motif compositions of HuAQP proteins. Ten motifs are displayed in different-colored rectangles. (C) Exon–intron structure of 33 HuAQP genes. Green rectangles represent exons, and black lines with the same length represent introns. Yellow rectangles indicate the UTR region. (D) The amino acid sequences of 10 motifs of HuAQP proteins.
Ijms 22 07689 g002
Figure 3. Schematic representations of the chromosomal locations of the HuAQP genes. The chromosome number is indicated on the top of each chromosome. Bars = 20 Mb.
Ijms 22 07689 g003
Figure 4. RT-qPCR analyses of HuAQP genes in petals during flower opening under 14 h/10 h day/night and 24 h/0 h day/night at 25 °C. The flower-opening process was separated into 6 stages, including opening stage 1 (Os 1), 12 h after culture (periods before flowering); Os 2, 24 h after culture (periods before flowering); Os 3, 28 h after culture (periods during flowering); Os 4, 32 h after culture (periods during flowering); Os 5, 36 h after culture (periods after flowering); Os 6, 40 h after culture (periods after flowering). Data represent average values from three biological replicates (±S.D.).
Ijms 22 07689 g004
Figure 5. RT-qPCR analyses of HuNIP6;1 gene in different pitaya flower sections during floral opening under 14 h/10 h day/night and 24 h/0 h day/night at 25 °C. Data represent average values from three biological replicates (±S.D.).
Ijms 22 07689 g005
Figure 6. Expression levels of HuNIP6;1 in the diurnal cycle in the pitaya petal under 14 h/10 h day/night. Data represent average values from three biological replicates (±S.D.). 12:00 on the day of flowering was supposed as the 0 h.
Ijms 22 07689 g006
Figure 7. Subcellular localization of HuNIP6;1 in epidermal cells of Nicotiana benthamiana. Bars = 20 μm.
Ijms 22 07689 g007
Figure 8. Overexpression of HuNIP6;1 in Arabidopsis thaliana caused significant early flowering.
Ijms 22 07689 g008
Figure 9. Expression levels of HuNIP6;1 in different transgenic Arabidopsis thaliana lines and wild-type. Data represent average values from three biological replicates (±S.D.). Asterisks indicate significant differences (** p < 0.01) between the transgenic lines and wild type.
Ijms 22 07689 g009
Figure 10. Different flower opening stages and sections of ‘Hongguan No. 1′ pitaya. (A) Different flower-opening stages of ‘Hongguan No. 1′ pitaya under 14 h/10 h day/night and 24 h/0 h day/night at 25 °C (n = 9, bars = 4 cm). The flower-opening process was separated into 6 stages, including opening stage 1 (Os 1), 12 h after culture (periods before flowering); Os 2, 24 h after culture (periods before flowering); Os 3, 28 h after culture (periods during flowering); Os4, 32 h after culture (periods during flowering); Os 5, 36 h after culture (periods after flowering); and Os 6, 40 h after culture (periods after flowering). (B) Different sections of ‘Hongguan No. 1′ pitaya flower. Bar = 4 cm.
Ijms 22 07689 g010aIjms 22 07689 g010b
Table 1. Characteristics of the 33 HuAQP genes in pitaya.
FamilyGene NamesGenBank No.Chromosomal DistributionORF (bp)Length (AA)pIMolecular Weight (kDa)
PIPHuPIP1;1HU04G00221.148582859.1330.51
HuPIP1;2HU05G01480.158552849.1630.40
HuPIP1;3HU06G00483.168582859.1130.48
HuPIP1;4HU05G00658.158582858.8430.62
HuPIP1;5HU11G01779.1118582859.1930.75
HuPIP2;1HU01G00026.118582859.130.41
HuPIP2;2HU03G00407.138522838.9830.20
HuPIP2;3HU06G02121.168612869.0830.58
HuPIP2;4HU09G00753.198612868.5930.53
HuPIP2;5HU06G02083.168612867.6630.72
TIPHuTIP1;1HU09G00676.197682555.8426.22
HuTIP1;2HU06G01671.167562516.0926.03
HuTIP1;3HU09G01283.197262417.6924.54
HuTIP1;4HU02G01483.127532505.3525.74
HuTIP2;1HU05G02336.15732243624.42
HuTIP2;2HU05G00450.15732243624.42
HuTIP2;3HU04G00025.147022335.123.45
HuTIP2;4HU03G00687.137502495.7625.29
HuTIP2;5HU01G00787.117442475.5925.28
HuTIP3;1HU08G00860.187742577.127.27
HuTIP4;1HU02G02913.127622536.3626.28
HuTIP4;2HU02G02914.127622536.5726.30
HuTIP5;1HU06G02398.167712568.7426.25
NIPHuNIP4;1HU08G01901.188822939.5131.12
HuNIP4;2HU05G01754.159063017.732.23
HuNIP4;3HU06G00624.168402796.8229.64
HuNIP4;4HU05G01185.158672889.4830.34
HuNIP5;1HU06G00253.169333108.7131.98
HuNIP6;1HU03G00523.139153046.0731.43
HuNIP6;2HU05G00189.156542177.1122.72
HuNIP7;1HU08G00592.188642878.329.78
SIPHuSIP1;1HU09G01607.197802599.3327.16
HuSIP1;2HU02G03098.127442479.6326.20
Table 2. Phenotype of wild-type and 35S:HuNIP6;1 transgenic lines.
Bolting Height (cm)No. of Flower BudsNo. of Fruit PodsNo. of Rosette LeavesNo. of Bolting
Wild-type0.90 d4.0 e0 c8.0 d0 e
35S:HuNIP6;1 transgenic line 112.57 a19.0 ab3.0 a8.0 cd2.0 bcd
35S:HuNIP6;1 transgenic line 28.74 b18.0 b1.0 c10.0 a2.0 cd
35S:HuNIP6;1 transgenic line 39.27 b21.0 a2.0 b9.0 ab3.0 a
35S:HuNIP6;1 transgenic line 46.30 c12.0 d0 c9.0 bcd2.0 d
35S:HuNIP6;1 transgenic line 55.21 c14.0 cd0 c9.0 bc3.0 b
35S:HuNIP6;1 transgenic line 68.27 b15.0 c0 c9.0 cd3.0 bc
The data are presented as means (n = 20). Different letters within the same column indicate a significant difference at the 5% level according to Duncan’s multiple range test.
Publisher’s Note: MDPI stays neutral with regard to jurisdictional claims in published maps and institutional affiliations.

