Abstract
Glucose-induced oxidative stress is associated with the overproduction of reactive oxygen species (ROS), which may dysregulate the expression of genes controlling insulin secretion leading to β-cell dysfunction, a hallmark of type 2 diabetes mellitus (T2DM). This study investigated the impact of coloured rice phenolic extracts (CRPEs) on the expression of key genes associated with β-cell function in pancreatic β-cells (INS-1E). These genes included glucose transporter 2 (Glut2), silent mating type information regulation 2 homolog 1 (Sirt1), mitochondrial transcription factor A (Tfam), pancreatic/duodenal homeobox protein 1 (Pdx-1) and insulin 1 (Ins1). INS-1E cells were cultured in high glucose (25 mM) to induce glucotoxic stress conditions (HGSC) and in normal glucose conditions (NGC-11.1 mM) to represent normal β-cell function. Cells were treated with CRPEs derived from two coloured rice cultivars, Purple and Yunlu29-red varieties at concentrations ranged from 50 to 250 µg/mL. CRPEs upregulated the expression of Glut2, Sirt1 and Pdx-1 significantly at 250 µg/mL under HGSC. CRPEs from both cultivars also upregulated Glut2, Sirt1, Tfam, Pdx-1 and Ins1 markedly at 250 µg/mL under NGC with Yunlu29 having the greatest effect. These data suggest that CRPEs may reduce β-cell dysfunction in T2DM by upregulating the expression of genes involved in insulin secretion pathways.
1. Introduction
Pancreatic β-cells are the major sites for synthesis, storage and secretion of insulin and amylin, hormones that regulate blood glucose levels. Correct β-cell function is indispensable for blood glucohomeostasis and the management of type 1 and type 2 diabetes [1]. However, pancreatic β-cell dysfunction is believed to be a major contributing factor to the pathogenesis of diabetes. Chronic high glucose levels (hyperglycaemia) have been associated with oxidative stress leading to the overproduction of reactive oxygen species (ROS) including superoxide (O2−), hydroxyl radical (.OH), hydroxyl ion (OH−) and hydrogen peroxide (H2O2) [2]. High glucose-induced oxidative stress has been linked with significant damage to cellular molecules including DNA and proteins thereby disrupting cellular signalling and resulting in dysregulation of various genes associated with insulin secretion and β-cell function [3].
The processes leading to insulin release involve the initial glucose entry into β-cells followed by mitochondrial adenosine triphosphate (ATP) generation and K+/Ca2+ membrane depolarisation leading to exocytosis events. These pathways are regulated by some key genes such as Glut2, Sirt1, Tfam, Pdx-1 and Ins1. Glucose is transported into pancreatic β-cells via Glut2, a high-Km glucose transporter serving as a “gatekeeper” for β-cells metabolic signalling, and converted to pyruvate [4]. High glucose-induced stress has been shown to reduce the expression of Glut2, severely compromising glucose sensing mechanisms which leads to β-cell dysfunction.
In mitochondria, Sirt1, a member of nicotinamide adenine dinucleotide (NAD)-dependent histone deacetylases, serves as a key energy redox sensor which regulates the NAD+/NADH ratio to generate ATP [5]. Thus, an important function of Sirt1 is associated with glucose homeostasis and mitochondrial metabolism in glucose sensitive tissues such as β-cells [6]. Previous studies have demonstrated that Sirt1 was down regulated in diabetic subjects, which was concomitantly linked to the reduction in mitochondrial membrane hyperpolarisation and oxygen consumption leading to an impaired β-cell function [7,8].
Tfam is a nuclear-encoded transcription factor that controls the stability and transcriptional activity of mitochondrial DNA (mtDNA). Coupled with electron transport chain regulation, Tfam is also involved in insulin exocytosis events by maintaining the ADP/ATP ratio [9]. The resulting K+ channel inactivation and Ca2+ influx triggers insulin secretion, thereby enhancing β-cell function. It has been reported that the expression of Tfam was downregulated under HGSC in human islets, which reduced mtDNA stability and β-cell function [10].
Pdx-1 is considered to be a master β-cell regulatory gene that controls major transcriptional β-cell insulin secretion mechanisms, thus playing an important role in mitochondrial embryonic development and β-cell differentiation [11]. Upregulation of Pdx-1 has been shown to enhance metabolic pathways driving glucose stimulated insulin secretion (GSIS) and β-cell function [12]. A study revealed that high glucose-induced oxidative stress downregulated Pdx-1, which correlated with β-cell failure and the development of T2DM in animal models [13]. Ins1 encodes the hormone insulin and plays a vital role in insulin biosynthesis and insulin secretion. An early investigation demonstrated that prolonged exposure of β-cells to high glucose levels is linked to decreased proinsulin biosynthesis and the downregulation of Ins1 [14].
Plant-based diets possess antioxidant properties and recent attention has focused on their activities to alleviate the pathogenesis of many diseases including T2DM. Several studies have demonstrated that consumption of polyphenolic-rich food may protect β-cells from oxidative damage and ameliorate β-cells dysfunction by modulating the expression of genes involved in insulin secretion pathways [15,16]. Coloured rice varieties, including Purple and Yunlu29, have antioxidant properties [17] which have been associated with blood glucose lowering effects in diabetic models [18,19]. Phenolic extracts, from various dietary sources, containing phenolic compounds cynidin-3-0-glucoside, catechins and gallic acids upregulate β-cell function genes which are correlated with improved insulin secretion and reduced high blood glucose levels [20,21,22,23,24,25]. These phenolic compounds are also present in varying amounts in coloured rice varieties. However, it is yet to be elucidated whether CRPEs can modulate the expression of genes involved in insulin secretion pathways. Therefore, this study aimed to investigate the gene expression profiles and the antioxidant signalling pathways in response to CRPE in rat INS-1E cells.
2. Results
2.1. Cytotoxicity of Coloured-Rice Phenolic Extracts (CRPE) on INS-1E Cells
The cytotoxic effect of coloured rice extracts on INS-1E cells was determined using resazurin red cytotoxic assay. Figure 1A demonstrates the purple variety extracts did not have any cytotoxic effect on INS-1E cells across all the tested concentrations. However, a significant (p < 0.0001) cytotoxic effect on INS-1E cells was observed at 500 and 1000 μg/mL for the Yunlu29 extracts (Figure 1B), reducing cell viability to 66% and 58% respectively post CRPE treatment when compared to the DMSO control group. There was no significant cytotoxic effect observed for the Yunlu29 extracts at 20, 50, 100, and 250 μg/mL. Therefore, CRPE concentrations of 50, 100 and 250 μg/mL were chosen for further experiments in this study.
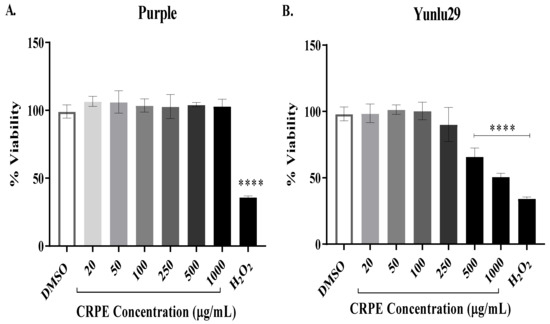
Figure 1.
Cytotoxicity of coloured rice phenolic extracts (CRPE) on INS-1E cells. The cells were exposed to coloured rice extracts (purple [A] and Yunlu29 [B]) at various concentrations for 6 h, followed by resazurin red assay (n = 5). Asterisks indicate significant differences to the control group (DMSO), where, ****p < 0.0001; one-way ANOVA with turkey’s multiple comparison post hoc test. Data is presented as mean ± SEM. DMSO–-dimethyl sulfoxide; H2O2 –-Hydrogen peroxide.
2.2. Coloured Rice Phenolic Extracts Modulate the Expression of Genes Associated with β-cell Function
To assess the gene modulating effects of CRPE on INS-1E cells under high (HGSC) and normal (NGC) glucose conditions, several β-cell function gene candidates (Glut2, Sirt1, Tfam, Pdx-1 and Ins1) were selected. These genes regulate major pathways including glucose transport (Glut2), electron transport chain and mitochondrial ATP pathway (Sirt1), mitochondrial ATP/ADP ratio and mitochondrial DNA stability (Tfam), regulation of β-cell transcription factors (Pdx-1) and insulin biogenesis and exocytosis (Ins1).
2.3. Expression of Glucose Transporter 2 (Glut2) Gene
For the HGSC, purple rice phenolic-rich extract significantly increased the expression of Glut2 post CRPE treatment, when compared to the DMSO control (Figure 2A). Higher expression of Glut2 was observed at 250 µg/mL compared to other doses of CRPE. Yunlu29 also significantly increased the expression of Glut2 when compared to the control at 250 µg/mL. On comparing the two extracts, Purple extract displayed a more prominent (p < 0.0001) expression of Glut2 than Yunlu29.
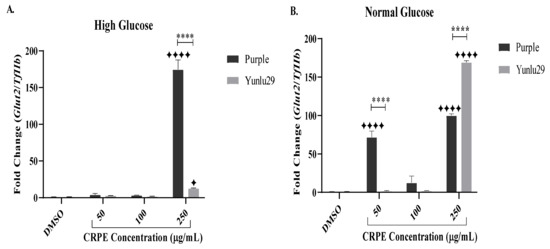
Figure 2.
Expression of Glut2 in INS-1E cells. A) high glucose (25 mM). B) normal glucose (11.1 mM). n = 3. Stars indicate significant differences between extracts and DMSO, where ✦ p < 0.05, ✦✦✦✦p < 0.0001. Asterisks indicate significant differences between the CRPE extracts, where, ****p < 0.0001; two-way ANOVA with Turkey’s multiple comparison post hoc test. Data is presented as mean ± SEM. Glut2–glucose transporter 1; TfIIβ–transcription factor II β; INS-1E—Insulinoma cells; DMSO—dimethyl sulfoxide; CRPE—coloured rice phenolic extract.
Under NGC, a significant upregulation of Glut2 was observed in purple rice extract when compared to control at 50 µg/mL and 250 µg/mL (Figure 2B). The red variety, Yunlu29, at 250 µg/mL significantly increased the expression of Glut2, when compared to the control. On comparing the two extracts, Purple exhibited a 65-fold change increase (p < 0.0001) in the expression of Glut2 at 50 μg/mL than Yunlu29 extracts. However, at 250 μg/mL, Yunlu29 significantly (0.0001) upregulated the expression of Glut2 by 70-fold compared to purple.
2.4. Expression of Silent Mating Type Information Regulation 2 Homolog 1 (Sirt1) Gene
Purple phenolic-rich extract markedly increased the expression of Sirt1, only at 250 µg/mL, compared to the control under HGSC (Figure 3A). Yunlu29 phenolic-rich extract significantly upregulated the expression of Sirt1 across all the CRPE concentrations. Upregulation of Sirt1 was greatest at 250 µg/mL when compared to the other doses of Yunlu29 phenolic extract. Comparing the two extracts, Yunlu29 increased the expression of Sirt1 significantly at 50 (p < 0.05) and 250 µg/mL (p < 0.0001), respectively.
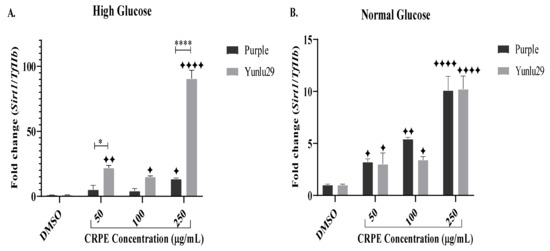
Figure 3.
Expression of Sirt1 in INS-1E cells. A) high glucose (25 mM). B) normal glucose (11.1 mM). n = 3. Stars indicate significant differences between extracts and DMSO, where ✦ p < 0.05, ✦ ✦p < 0.01, ✦✦✦✦p < 0.0001. Asterisks indicate significant differences between the extracts, where *p < 0.05, ****p < 0.0001; two-way ANOVA with Turkey’s multiple comparison post hoc test. Data is presented as mean ± SEM. Sirt1—silent mating type information regulation 2 homolog 1; TfIIβ—transcription factor II β; INS-1E—Insulinoma cells; DMSO—dimethyl sulfoxide; CRPE—coloured rice phenolic extract.
Under NGC, a significant upregulation of Sirt1 was observed post purple CRPE treatments compared to the control (Figure 3B). Yunlu29 displayed a similar upregulation of Sirt1 at 50 and 100 µg/mL phenolic concentrations. To a similar extent, both phenolic-rich extracts displayed significant upregulation of Sirt1 at 250 µg/mL.
2.5. Expression of Mitochondrial Transcription Factor A (Tfam) Gene
Both purple and Yunlu29 CRPE displayed no significant effects on Tfam under HGSC (Figure 4A). Under NGC, however, both extracts significantly increased the expression of Tfam at 250 µg/mL when compared to the control group (Figure 4B). On comparing the two extracts, treatment with Yunlu29 phenolic-rich extract at 250 µg/mL displayed a three-fold increase in the expression of Tfam relative to purple.
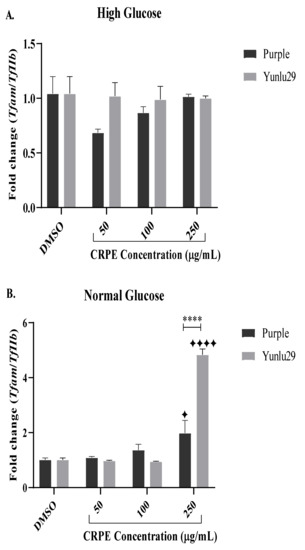
Figure 4.
Expression of Tfam in INS-1E cells. A) high glucose (25 mM). B) normal glucose (11.1 mM). n = 3. Stars indicate significant differences between extracts and DMSO, where ✦ p < 0.05, ✦✦✦✦p < 0.0001. Asterisks indicate significant differences between the extracts, where ****p < 0.0001; two-way ANOVA with Turkey’s multiple comparison post hoc test. Data is presented as mean ± SEM. Tfam—mitochondrial transcription factor A; TfIIβ—transcription factor II β; INS-1E – Insulinoma cells; DMSO—dimethyl sulfoxide; CRPE—coloured rice phenolic extract.
2.6. Expression of Pancreatic and Duodenal Homeobox-1 (Pdx-1) Gene
Post treatment, both extracts exhibited significant upregulation of Pdx-1 across all CRPE concentrations, when compared to the control under high glucose conditions (Figure 5A). Purple extract significantly increased the expression of Pdx-1, only at 250 µg/mL, compared to the control. Yunlu29 extract significantly upregulated the expression of Pdx-1 at 50, 100 and 250 µg/mL. When comparing the two extracts, expression of Pdx-1 was higher (p < 0.001) with Yunlu29 extract than the purple variety.
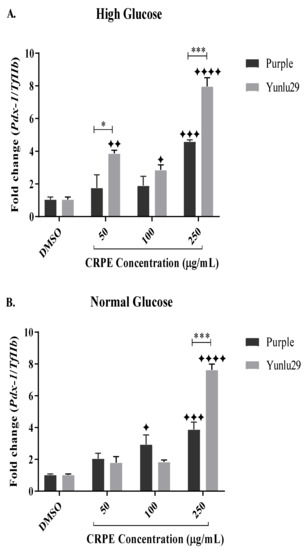
Figure 5.
Expression of Pdx-1 in INS-1E cells. A) high glucose (25 mM). B) normal glucose (11.1 mM). n = 3. Stars indicate significant differences between extracts and DMSO, where ✦ p < 0.05, ✦ ✦p < 0.01, ✦✦✦p < 0.001, ✦✦✦✦p < 0.0001. Asterisks indicate significant differences between the extracts, where *p < 0.05, ***p < 0.001;two-way ANOVA with Turkey’s multiple comparison post hoc test. Data is presented as mean ± SEM. Pdx-1—pancreatic and duodenal homeobox-1; TfIIβ —transcription factor II β; INS-1E—Insulinoma cells; DMSO—dimethyl sulfoxide; CRPE—coloured rice phenolic extract.
In NGC (Figure 5B), purple extract significantly increased the expression of Pdx-1 at 100 and 250 µg/mL when compared to the control. For Yunlu29, an increased expression of Pdx-1 was displayed only at 250 µg/mL compared to the control. On comparing the two extracts, a significantly (p < 0.001) higher upregulation of Pdx-1 was observed in Yunlu29 than purple at 250 µg/mL only.
2.7. Expression of Insulin 1 (Ins1) Gene
Following 48 h exposure to HGSC, treatment with Purple rice extract exhibited a significant upregulation of Ins1 across all the CRPE test concentrations when compared to the high glucose only treated cells (Figure 6A). When compared to Yunlu29, purple significantly (p < 0.01, p < 0.001, p < 0.001) upregulated the expression of Ins1 at 50, 100 and 250 µg/mL, respectively.
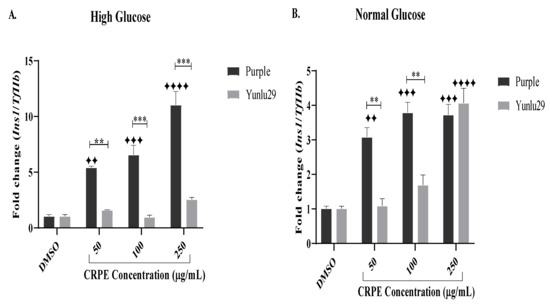
Figure 6.
Expression of Ins1 gene on INS-1E cells. A) high glucose (25 mM). B) normal glucose (11.1 mM). n = 3. Stars indicate significant differences between extracts and DMSO, where ✦✦p < 0.01, ✦✦✦p < 0.001, ✦✦✦✦p < 0.0001. Asterisks indicate significant differences between the extracts, where **p < 0.01, ***p < 0.001; two-way ANOVA with Turkey’s multiple comparison post hoc test. Data is presented as mean ± SEM. Ins1—insulin 1; TfIIβ—transcription factor II β; INS-1E—Insulinoma cells; DMSO—dimethyl sulfoxide; CRPE—coloured rice phenolic extract.
Under NGC, a significant upregulation of Ins1 was observed with all concentrations of purple CRPE treatments when compared to the control (Figure 6B). Yunlu29 generated a significant increase in Ins1 expression at 250 µg/mL. When comparing the two extracts, purple significantly (p < 0.01) upregulated the expression of Ins1 relative to Yunlu29 at 50 and 100 µg/mL.
3. Discussion
Pancreatic β-cell dysfunction, a major cause of T2DM, is strongly associated with chronic high blood glucose levels. Chronic exposure of pancreatic β-cells to high glucose induces oxidative stress and decreases expression of β-cell function genes leading to an impaired insulin secretion [26]. The current investigation demonstrated that treatment of INS-1E cells with phenolic extracts from purple and Yunlu29 rice varieties increased the expression of key genes associated with β-cell function under both HGSC and NGC.
Under HGSC, purple phenolic extracts significantly increased the expression of Glut2 and Ins1, whereas Yunlu29 extracts significantly increased the expression of Sirt1 and Pdx-1, however, neither variety affected Tfam expression. Under NGC, the purple variety had the greatest impact on expression of Glut2 and Ins1 at lower phenolic extract concentrations of 50 and, 50 and 100 µg/mL respectively. Yunlu29 variety markedly increased expression of Glut2, Tfam and Pxd-1 at 250 µg/mL when compared to the purple variety. Both extracts increased the expression of Ins1 and Sirt1 to a similar degree (at 250 µg/mL) under NGC.
The gene expression trends exhibited in this study are interesting when considering the phenolic composition of these rice varieties. The purple rice variety contained the highest total anthocyanin and proanthocyanidin content compared to the other varieties including Yunlu 29, with cyanidin-3-glucoside and peonidin-3-glucoside the most abundant anthocyanins with the highest antioxidant activities [27]. In contrast, Yunlu29 had the highest total phenolic content (235.50 ± 22.51 mg 100 g−1 gallic acid equivalent [GAE]) compared to the purple (172.40 ± 20.06 mg 100 g−1 GAE). The predominant phenolic acids were ferulic acid, o-coumaric acid, GA, syringic acid, flavanols, catechins and proanthocyanins [27,28]. Additionally, crude CRPEs were shown to contain various unidentified compounds that may have arrays of effects from antagonist to null to synergistic effects on expression of various genes and other cell processes [29]. The presence of these compounds in Yunlu29 extract was correlated with higher antioxidant activity [27], suggesting that the gene expression effects observed following treatment with Yunlu29 phenolic extracts may be due to synergistic effects of the mixture of these compounds. Although physiological concentrations of these compounds have not been determined, consumption of purple and Yulnu29 varieties increased antioxidant activities within 30 min and 1 h respectively in the obese cohort [30].
Addition of 250 µg/mL of purple rice extract to INS-1E cells significantly increased the expression of Glut2 under HGSC. A previous study reported that treatment of INS-1 cells with 100 µM cyanidins, a major anthocyanin, upregulated the expression of Glut2 and this correlated with increased insulin secretion and improved β-cell function [31]. In light of this finding, it is suggested that the increased expression of Glut2 observed in this investigation may be associated with the high total anthocyanin content in the purple rice extracts, affecting some upstream glucose sensing pathways, which may inhibit the expression of Glut2 under HGSC.
The present study also showed that supplementation of INS-1E with phenolic extract (250 µg/mL) from the red variety Yunlu29 increased the expression of Glut2 ten-fold when compared to the control. In accordance with this result, treatment of diabetic rats with 50 mg/kg body weight (BW) ferulic acid, an abundant compound in Yunlu29, increased Glut2 expression in hepatic tissues, thereby improving insulin sensitivity and glucose levels [32]. These findings indicate CRPE may increase Glut2 expression by mitigating high glucose-induced oxidative stress on pancreatic β-cells, which may lead to increased insulin secretion and β-cell function.
When considering the NGC, purple rice phenolic-rich extracts substantially increased Glut2 expression at 50 and 250 µg/mL, however, there was a discontinuity of dose response in Glut2 expression at 100 µg/mL (Figure 4B). An early study reported that polyphenols often display non-linear bioactivities by exhibiting a low dose stimulation and a high dose inhibition, creating a biphasic dose response [33]. This supports the notion that some polyphenols may have optimal concentrations where they structurally interact better with other cellular proteins, thereby increasing their efficacy [34]. Whether the results presented here reflect a biphasic effect is a question for further investigation. The Yunlu29 extract displayed a significant increase in Glut2 expression 250 µg/mL when compared to the untreated control. A 70-fold change increase in Glut2 expression by the Yunlu29 extract may indicate a synergistic effect relative to the higher total phenolic content in Yunlu29, when compared to Purple extracts [27].
Although studies focusing on the modulating effects of CRPEs on β-cell function genes, especially genes associated with mitochondrial function, are not available, other phenolic compounds found in coloured rice varieties have been shown to modulate β-cell function genes. A study involving diabetic rats revealed that treatment with 50 mg/kg BW of proanthocyanidins, which were a major component in purple extracts increased expression of Sirt1 dose-dependently and was correlated with elevated NAD+ in hepatic tissues thereby increasing mitochondrial ATP synthesis and β-cell function [35]. In the present study, we observed a significant decrease in Sirt1 expression under HGSC, but pre-treatment with CRPE (purple) significantly increased the expression of Sirt1 in INS-1E cells, which is suggestive of free radical scavenging properties.
Sirt1 gene expression increases elicited by the addition of phenolic flavanols has been linked to improved β-cell function [25]. Studies of mitochondrial function in pancreatic β-cell-derived INS-1 832/13 demonstrated supplementation with 25 µg/mL catechin extract, a major compound in Yunlu29, increased the expression of Sirt1 down-stream genes concomitantly improving mitochondrial ATP production, reduced oxidative stress and high glucose levels, and improved β-cell function [25,36]. Our study has shown that exposure of INS-1E cells to Yunlu29 extracts (250 µg/mL) significantly upregulated Sirt1 post HGSC. These results propose antioxidant mechanisms of the Yunlu29 CRPE evoking gene upregulation and may potentially restore β-cell function.
It is interesting to note that post HGSC, treatment with Yunlu29 extract increased the expression of Sirt1 60-fold when compared to the Purple extract. The distinct expression pattern changes in response to each extract addition may indicate structural aspects play a role in their bioactivities. Catechins, a major constituent of Yulun29, possess hydroxyl (3-OH) groups, which render them capable of scavenging free radicals by terminating the cycle of new free radical formation during oxidative stress conditions [37]. Based on this, it was postulated that supplementation with a monomeric catechin-rich cocoa fraction preserved mitochondrial membrane integrity, reduced ROS production and improved β-cell function [37].
Furthermore, we observed that treatment with CRPEs increased Sirt1 expression under NGC. As previously reported, supplementation with phenolic-rich resveratrol (30 mg/kg BW) increased Sirt1 expression in male rats, which increased insulin secretion and β-cell function [38]. As such, the current study indicates that exposure to CRPEs may increase insulin secretion and thus enhance normal β-cell function making CRPEs potential dietary supplements to prevent the development of β-cell dysfunction.
Tfam is a transcription factor that maintains mitochondrial DNA stability, and regulates the electron transport chain and insulin exocytosis events. Dietary polyphenols have been shown to increase expression of this gene through their antioxidant capability. In the current investigation, however, CRPEs from both varieties exhibited no modulating effects on Tfam under HGSC, suggesting that the expression of Tfam might be affected by different mechanisms under oxidative stress and that CRPEs perhaps modulate a different pathway. Further, crude CRPEs contain unidentified compounds, and these unknown compounds may have some antagonistic activities under HGSC making further studies warranted.
In contrast, CRPEs from both varieties significantly increased Tfam expression under NGC. This is consistent with other reports where treatment of INS-1E with resveratrol increased Tfam expression under NGC. The resulting increased ATP/ADP ratio and mtDNA stability was correlated with improved insulin secretion and β-cell function in INS-1E cells [20]. As a multi-functional DNA binding protein, Tfam may have similar transcriptional activities with Sirt1 and Pdx-1 in insulin secretion pathways [39]. Therefore, the three-fold change in Tfam expression by Yunlu29 extract compared to purple perhaps relates to the catechin activities, which may maintain β-cell function, thus preventing the development of T2DM.
Pancreatic and duodenal homeobox-1 plays diverse transcription roles in β-cell function, but its deficiency has been associated with mitochondrial dysfunction and educed insulin secretion, some of the defining factors of β-cell dysfunction [40]. The current study demonstrated that purple CRPE increased the expression of Pdx-1 markedly at concentrations of 250 μg/mL under HGSC. Treatment of INS-1 cells with C3G-rich extract (5 μM) significantly increased the expression of Pdx-1 post exposure to H2O2 (1,200 μM), which consequently reduced mitochondrial ROS, enhanced antioxidant capacity and elevated insulin secretion; collectively leading to an improved β-cell function [23]. These results are suggestive of a cytoprotective effect of purple CRPE on pancreatic β-cells under oxidative stress.
Yunlu29 CRPE increased the expression of Pdx-1 under HGSC. Consistent with previous reports, treatment of pancreatic β-cells (RINm5F) with gallic acid (10µM) increased the expression of Pdx-1 under high glucose (25 mM) conditions by decreasing Caspase-3 and Nf-kB signalling, which consequently increased insulin secretion and β-cell function [24]. This suggests the eight-fold change of Pdx-1 expression by the Yunlu29 CRPE observed in the current study may relate to a higher gallic acid content in the Yunlu29 extracts inhibiting the activation of some apoptotic and inflammatory pathways under HGSC.
Yunlu29 potentiated a 3.5-fold change upregulation of Pdx-1 relative to purple. Raoet al. [27] found Yunlu29 possessed the highest total phenolic content and argued this was directly proportional to its higher antioxidant activities compared to purple. As such it is possible that the increased expression of Pdx-1 in response to Yunlu29 phenolic extract addition may be due to the presence of various phenolic compounds affecting a synergistic antioxidant response.
Under low glucose conditions, it is believed that Pdx-1 is mainly localised in the nuclear periphery, where it’s linked with histone deacetylase-1 and −2, thus reducing its influence via transcriptional events on insulin secretion mechanisms [41]. This study showed that CRPEs significantly increased Pdx-1 expression under NGC. Supplementation of INS-1E cells with anthocyanin extracts (0.125–1 mg/mL) elevated the expression of free fatty acid receptor 1 (FFAR1), a Pdx-1-like gene that stimulates glucose-dependent insulin secretion response in pancreatic β-cells, at baseline glucose conditions [42]. Additionally, ferulic acid (0.5 g/kg BW) addition reduced blood glucose levels, increased insulin secretion and improved β-cell function in male mice [43]. These results suggest a key role for CRPEs in enhancing β-cell function under NGC. Therefore, Pdx-1 expression increases in response to CRPEs under NGC may indicate glucose stimulating-like insulin secreting properties.
To ensure proper pancreatic β-cells function, regulation of Ins1 is crucial for the synthesis and secretion of insulin to maintain normal blood glucose concentrations. The present study showed that Ins1 was severely reduced in HGSC, however, pre-treatment with purple CRPE dose-dependently increased the expression of Ins1. It was previously demonstrated that treatment of INS-1E with anthocyanin extracts restored the insulin pool and influenced the opening of voltage gated Ca2+ channels, which led to an increased insulin-membrane fusion and exocytosis [44]. This suggests that the purple CRPE may be targeting voltage gated Ca2+ channel pathways to increase the expression of Ins1. The inactivity observed in response to Yunlu29 indicates that the phenolic compounds in the Yunlu29 extracts may be affecting different pathways from insulin biosynthesis and exocytosis mechanisms.
An early study showed that treatment of pancreatic β-cells under 4 mM glucose with Cornus fruit extract containing various anthocyanins compounds including pelargonidin, pelargonidin/peonidin-3-glucoside and delphinidin-3-glucoside exhibited a 1.4-fold increase in insulin secretion in the increasing order of delphinidin-3-glucoside, cyanidin-3-glucoside and pelargonidin-3-galactoside [45]. This indicates that the insulin secretion enhancing activity of anthocyanins may be attributed to the number of hydroxyl groups on the B-ring. Our investigation revealed that supplementation with purple CRPE upregulated Ins1 under NGC. A similar finding reported pre-treatment of INS-1E with anthocyanin-rich berry mix extracts (50 µM) increased the expression of Ins1, which improved insulin secretion and β-cell function even in the absence of glucose [46]. Taken together, these results suggest that the glycosidic side chains of anthocyanins in the purple extract may assume glucose structural activity, thereby constituting a glucose mimetic effect. This may support the notion that CRPEs may promote insulin secretion through nuclear activation required for the upregulation of β-cells function genes under NGC.
Purple CRPE exhibited a significant impact on Ins1 expression at lower concentrations while Yunlu29 exhibited no modulatory effect under these concentrations. This may be explained by the presence of more hydroxyl groups coupled with the higher total anthocyanin content in the purple CRPE. However, both extracts increased the expression of Ins1 to a similar degree at 250 µg/mL, suggesting that the higher total phenolic content in the Yunlu29 extracts may have been equalised by the higher number of hydroxyl groups in the Purple CRPE. Pancreatic β-cell function is defined by the amount of insulin secreted. Therefore, GSIS, an assay not performed in this study, is required to determine the level of insulin secreted in relation to these gene expression changes. Further, protein content, gene translocation and protein phosphorylation studies are warranted to ascertain whether these gene expression changes are manifested in downstream biological events.
4. Materials and Methods
4.1. Materials
Unless otherwise stated, reagents and chemicals were purchased from Sigma-Aldrich (St Louis, Missouri, USA), Chem Supply Pty Ltd (Port Adelaide, South Australia, Australia), Promega Corporation (Madison, WI, USA) and Bio-Rad (Hercules, CA, USA.)
4.2. Coloured Rice Sampling and Phenolic Extraction
Coloured rice (Oryza sativa) cultivars, Purple and Yunlu29 used in this study were obtained as part of the field trials performed in Mackay, Queensland by the New South Wales Department of Primary Industries and Rice Research Australia Pty Ltd. The samples were subjected to the same routine growing and post-harvest conditions before storing at 4 °C. The two varieties purple and red Yunlu29 were selected for this study based on their antioxidant activities, and phenolic extraction as previously described [27]. Purple extract contains mainly cyanidin-3-glucoside and peonidin-3-glucoside, and has the highest anthocyanins and proanthocyanins content. Yunlu29 predominantly possesses catechins and other phenolic acids, and has the highest total phenolic content associated with the highest antioxidant activities [27].
4.3. Cells and Cell Culture Conditions
The clonal rat β-cell line (INS-1E) was a kind gift from Dr Kathryn Aston-Mourney, Head of Islet Biology Laboratory at Deakin University. INS-1E cells were grown in RPMI1640 complete media supplemented with 2 mM L-glutamine, 1 mM sodium pyruvate, 10 mM HEPES, 0.05 mM β-mercaptoethanol, 10% FBS and 10,000 U/mL penicillin and 10 mg/mL streptomycin. The cells were maintained in a humidified atmosphere containing 5% CO2 at 37 °C, with the complete growth media changed every 48 h until confluence. All experiments were carried out using INS-1E passages between 37 and 40.
4.4. Cytotoxicity Assay
The cytotoxic effect of CRPE on INS-1E cells was performed using resazurin red cytotoxicity assay. INS-1E cells were seeded at a density of 4 x 10⁴ cells per well into 96-well plates and incubated for 24 h in the complete growth media. After reaching confluence, the cells were treated with CRPE supplemented to the complete growth media at varying concentrations of 20, 50, 100, 250, 500 and 1000 μg/mL for 6 h. After treatment, CRPE supplemented media was removed and 200 µL of 14 mg/mL resazurin dye supplemented media was added to each well, followed by 4 h incubation at 37 °C in 5% CO2. Subsequently, 150 μl of the resazurin dye supplemented media was removed from each well and transferred to a new 96-well plate. The absorbance was measured at dual wavelengths (570 and 600 nm) using a microplate reader (FLUOstar Omega microplate reader, BMG Labtech, Offenburg, Germany). CRPE supplemented expansion media was used as the blank for each tested concentration. A media containing 0.25% dimethyl sulfoxide (DMSO) was used as the negative control. The percentage of cell viability in relation to the reduction of the dye was calculated as previously described [47].
4.5. Experimental Design and High Glucose Stress Induction
Two different glucose conditions were used; 1) high glucose (25 mM)-induced stress condition (HGSC) to induce glucotoxic stress and; 2) normal glucose (11.1 mM) condition (NGC) to represent a normal β-cell function [48,49]. INS-1E cells were seeded onto six-well plates at a density of 4 x 10⁵ cells per well and expanded in culture media and conditions as described in Section 4.3. After 24 h incubation, the media was removed, and the cells were washed with phosphate buffered saline (PBS). For the high glucose conditions, INS-1E cells were further subjected to 48 h incubation in 25 mM glucose supplemented growth media. The cells were then supplemented with CRPE at 50, 100 and 250 µg/mL, for 6 h. The wells treated with 0.25% DMSO served as the negative controls. All experiments were performed in triplicates.
4.6. Ribonucleic Acid (RNA) Extraction
Post CRPE treatment, INS-1E cells were washed with ice-cold PBS. Total RNA extraction was performed using SV Total RNA Isolation System (Promega, Madison, WI, USA) following the manufacturer’s instructions with slight modifications. Briefly, 175 µL lysis buffer containing β-mercaptoethanol was used to lyse the cells. The lysate was then mixed with 350 µL RNA dilution buffer and incubated at 70 °C for 3 min. After centrifugation, the supernatant was mixed with 200 µL 95% ethanol and placed into the spin column assembly for DNase digestion. Following washing steps using RNA wash buffer, RNA was eluted in 35 µL nuclease-free water and stored at −80 °C until further use.
4.7. Complementary Deoxyribonucleic Acid (cDNA) Synthesis
The quality of RNA was analysed using a NanoDrop™ 2000c Spectrophotometer (Thermo Fisher Scientific, Waltham, MA, USA). Five hundred nanograms of total RNA template was used to generate cDNA using GoScript™ Reverse Transcription system (Promega, Madison, WI, USA) according to the manufacturer’s instructions. Briefly, cDNA synthesis was initiated by incubating the RNA with 1 µL of oligo (dT)15 at 70 °C for 5 min. The reverse transcription reaction mix containing GoScript™ 5× reaction buffer, MgCl2 (final concentration 1.5 mM), PCR nucleotide mix (final concentration 0.5 mM each dNTP), recombinant RNAsin® ribonuclease inhibitor (optional), GoScript™ reverse transcriptase was then added. Nuclease-free water was added to bring the final volume to 20 µL. The amplification cycles involved a 5 min annealing step at 25 °C followed by extension at 42 °C for 1 h. The cDNA synthesis was completed by the inactivation of reverse transcriptase at 70 °C for 15 min and the samples were stored at −20 °C until further use.
4.8. Quantitative Polymerase Chain Reaction (qPCR)
Quantification of gene expression was performed on CFX96 Touch™ Real-Time PCR Detection System (Bio-Rad) using SSoAdvanced Universal SYBR Green Supermix (Bio-Rad Laboratories, CA, USA) following the manufacturer’s instructions. Briefly, a single reaction mix consisted of 5 µL of Supermix (Bio-rad, CA, USA), 1 µM of forward and reverse primers and 1 µL of 1:5 diluted cDNA. The primers used for qPCR study (Table 1) were adopted from previous work by Vetterliet al. [20]. Transcription factor II β (TfIIb) was used as the house keeping gene for gene expression normalisation. Gene expression analysis was performed using Q-gene software as described by Muller et al. [50].

Table 1.
List of the genes and primers used for qPCR.
4.9. Statistical Analysis
Data analysis were performed using GraphPad Prism 8 software (Graphpad Software Inc, San Diago, CA, USA). The data for cytotoxicity assay were analysed using one-way analysis of variance (ANOVA). The fold change differences in gene expression were analysed using two-way ANOVA followed by Tukey’s multiple comparisons test. Statistically significant difference was determined at the level of p < 0.05. Data are presented as mean ± standard error of mean (SEM) of three independent experiments.
5. Conclusions
This study demonstrated that coloured rice phenolic extracts derived from purple and Yunlu29 varieties, increased the expression of β-cells function genes (Glut2, Sirt1, Pdx-1 and Ins1) under both high glucose and normal glucose conditions. Purple phenolic-rich extract exhibited greater increases in Glut2 and Ins1 expression under HGSC, possibly due to the high content of anthocyanin and proanthocyanin compounds. Overall, Yunlu29 CRPE displayed the greatest increase in expression of the β-cell function genes, potentially due to its high content of total phenolic compounds linked to high antioxidant activities. Further in vitro and in vivo studies involving GSIS assays and post-transcriptional analysis are warranted to investigate the insulin secretion mechanisms in relation to the gene expression profiles of CRPE. Future studies may also involve antioxidant signaling mechanisms in relation to pancreatic β-cell insulin secretion. If the results of the current study translate into insulin secretion and possibly clinical relevance, it may mean that CRPE can stimulate insulin secretion both in low and chronic glucose conditions, and thus may provide a therapeutic capability.
Author Contributions
G.G.K. performed the experiments outlined in this study and drafted the manuscript. N.F., R.H., D.L.W., C.L.B., and A.B.S. were involved in the experimental design and critical review of this manuscript. All authors have read and agreed to the published version of the manuscript.
Funding
This research received no external funding.
Acknowledgments
We acknowledgeKathryn Aston-Mourney from Deakin University for providing the INS-1 E cells. We also acknowledge the financial support provided by the Graham Centre for Agricultural Innovation, Australia to cover the publication costs.
Conflicts of Interest
The authors declare no conflicts of interest.
Abbreviations
| ATP | Adenosine triphosphate |
| CRPE | Coloured rice phenolic extract |
| DMSO | Dimethyl sulfoxide |
| Glut2 | Glucose transporter 2 |
| GSIS | Glucose stimulated insulin secretion |
| HGSC | High glucose-induced stress condition |
| mtDNA | Mitochondrial DNA |
| NAD | Nicotinamide adenine dinucleotide |
| NF-kB | Nuclear factor kappa light chain enhancer of activated B cells |
| NGC | Normal glucose condition |
| Pdx-1 | Pancreatic and duodenal homeobox-1 |
| RNA | Ribonucleic acid |
| ROS | Reactive oxygen species |
| Sirt1 | Silent mating type information regulation 2 homolog 1 |
| T2DM | Type 2 diabetes mellitus |
| Tfam | Mitochondrial transcription factor A |
References
- Martin, C. The physiology of amylin and insulin: Maintaining the balance between glucose secretion and glucose uptake. Diabetes Educ. 2006, 32 (Suppl. 3), 101s. [Google Scholar] [CrossRef]
- Rösen, P.; Nawroth, P.P.; King, G.; Möller, W.; Tritschler, H.-J.; Packer, L. The role of oxidative stress in the onset and progression of diabetes and its complications: Asummary of a Congress Series sponsored byUNESCO-MCBN, the American Diabetes Association and the German Diabetes Society. Diabetes/Metab. Res. Rev. 2001, 17, 189. [Google Scholar] [CrossRef] [PubMed]
- Migdal, C.; Serres, M. Reactive oxygen species and oxidative stress. Med. Sci. 2011, 27, 405. [Google Scholar]
- Wiederkehr, A.; Wollheim, C.B. Minireview: Implication of mitochondria in insulin secretion and action. Endocrinology 2006, 147, 2643. [Google Scholar] [CrossRef] [PubMed]
- Ighodaro, O.M. Molecular pathways associated with oxidative stress in diabetes mellitus. Biomed. Pharmacother. 2018, 108, 656. [Google Scholar] [CrossRef]
- Rodgers, J.T.; Lerin, C.; Haas, W.; Gygi, S.P.; Spiegelman, B.M.; Puigserver, P. Nutrient control of glucose homeostasis through a complex of PGC-1alpha and SIRT1. Nature 2005, 434, 113. [Google Scholar] [CrossRef]
- Luu, L.; Dai, F.F.; Prentice, K.J.; Huang, X.; Hardy, A.B.; Hansen, J.B.; Liu, Y.; Joseph, J.W.; Wheeler, M.B. The loss of Sirt1 in mouse pancreatic beta cells impairs insulin secretion by disrupting glucose sensing. Diabetologia 2013, 56, 2010. [Google Scholar] [CrossRef]
- Bartoli-Leonard, F.; Wilkinson, F.L.; Schiro, A.; Inglott, F.S.; Alexander, M.Y.; Weston, R. Suppression of SIRT1 in diabetic conditions induces osteogenic differentiation of human vascular smooth muscle cells via RUNX2 signalling. Sci. Rep. 2019, 9, 878. [Google Scholar] [CrossRef]
- Campbell, C.T.; Kolesar, J.E.; Kaufman, B.A. Mitochondrial transcription factor A regulates mitochondrial transcription initiation, DNA packaging, and genome copy number. Biochim. Biophys. Acta Gene Regul. Mech. 2012, 1819, 921. [Google Scholar] [CrossRef]
- Brun, T.; Li, N.; Jourdain, A.A.; Gaudet, P.; Duhamel, D.; Meyer, J.; Bosco, D.; Maechler, P. Diabetogenic milieus induce specific changes in mitochondrial transcriptome and differentiation of human pancreatic islets. Hum. Mol. Genet. 2015, 24, 5270. [Google Scholar] [CrossRef]
- Scarpulla, R.C. Transcriptional paradigms in mammalian mitochondrial biogenesis and function. Physiol. Rev. 2008, 88, 611. [Google Scholar] [CrossRef] [PubMed]
- Chakrabarti, S.K.; James, J.C.; Mirmira, R.G. Quantitative assessment of gene targeting in vitroand in vivo by the pancreatic transcription factor, Pdx1 importance of chromatin structure in directing promoter binding. J. Biol. Chem. 2002, 277, 13286. [Google Scholar] [CrossRef] [PubMed]
- Ahn, Y.; Xu, G.; Marselli, L.; Toschi, E.; Sharma, A.; Bonner-Weir, S.; Sgroi, D.; Weir, G. Changes in gene expression in beta cells after islet isolation and transplantation using laser-capture microdissection. Diabetologia 2007, 50, 334. [Google Scholar] [CrossRef] [PubMed]
- Roche, E.; Maestre, I.; Martin, F.; Fuentes, E.; Casero, J.; Reig, J.A.; Soria, B. Nutrient toxicity in pancreatic beta-cell dysfunction. .J Physiol. Biochem. 2000, 56, 119. [Google Scholar] [CrossRef]
- Kang, G.G.; Francis, N.; Hill, R.; Waters, D.; Blanchard, C.; Santhakumar, A.B. Dietary polyphenols and gene expression in molecular pathways associated with Type 2 diabetes mellitus: A Review. Int. J. Mol. Sci. 2020, 21, 140. [Google Scholar] [CrossRef]
- Dragan, S.; Andrica, F.; Serban, M.-C.; Timar, R. Polyphenols-rich natural products for treatment of diabetes. Curr. Med. Chem. 2015, 22, 14. [Google Scholar] [CrossRef]
- Callcott, E.T.; Blanchard, C.L.; Oli, P.; Santhakumar, A.B. Pigmented rice-derived phenolic compounds reduce biomarkers of oxidative stress and inflammation in human umbilical vein endothelial cells. Mol. Nutr. Food Res. 2018, 62, 1800840. [Google Scholar] [CrossRef]
- Watanabe, M. Effects of black rice containing anthocyanins on plasma and hepatic parameters in type 2 diabetic db/db mice. Food Sci. Technol. Res. 2016, 22, 719. [Google Scholar] [CrossRef][Green Version]
- Imam, M.U.; Musa, S.N.A.; Azmi, N.H.; Ismail, M. Effects of white rice, brown rice and germinated brown rice on antioxidant status of type 2 diabetic rats. Int. J. Mol. Sci. 2012, 13. [Google Scholar] [CrossRef]
- Vetterli, L.; Brun, T.; Giovannoni, L.; Bosco, D.; Maechler, P. Resveratrol potentiates glucose-stimulated insulin secretion in INS-1E beta-cells and human islets through a SIRT1-dependent mechanism. J. Biol. Chem. 2011, 286, 6049. [Google Scholar] [CrossRef]
- Cai, E.P.; Lin, J.-K. Epigallocatechin Gallate (EGCG) and rutin suppress the glucotoxicity through activating IRS2 and AMPK signaling in rat pancreatic β cells. J. Agric. Food Chem. 2009, 57, 9817. [Google Scholar] [CrossRef] [PubMed]
- Bhattacharya, S.; Oksbjerg, N.; Young, J.F.; Jeppesen, P.B. Caffeic acid, naringenin and quercetin enhance glucose-stimulated insulin secretion and glucose sensitivity in INS-1E cells. Diabetes Obes. Metab. 2014, 16, 602. [Google Scholar] [CrossRef] [PubMed]
- Sun, C.D.; Zhang, B.; Zhang, J.K.; Xu, C.J.; Wu, Y.L.; Li, X.; Chen, K.S. Cyanidin-3-glucoside-rich extract from Chinese bayberry fruit protects pancreatic beta cells and ameliorates hyperglycemia in streptozotocin-induced diabetic mice. J. Med. Food 2012, 15, 288. [Google Scholar] [CrossRef] [PubMed]
- Sameermahmood, Z.; Raji, L.; Saravanan, T.; Vaidya, A.; Mohan, V.; Balasubramanyam, M. Gallic acid protects RINm5F β-cells from glucolipotoxicity by its antiapoptotic and insulin-secretagogue actions. Phytother. Res. 2010, 24, S83. [Google Scholar] [CrossRef]
- Rowley, T.J.; Bitner, B.F.; Ray, J.D.; Lathen, D.R.; Smithson, A.T.; Dallon, B.W.; Plowman, C.J.; Bikman, B.T.; Hansen, J.M.; Dorenkott, M.R.; et al. Monomeric cocoa catechins enhance β-cell function by increasing mitochondrial respiration. J. Nutr. Biochem. 2017, 49, 30. [Google Scholar] [CrossRef]
- Zhang, Z.; Li, J.; Yang, L.; Chen, R.; Yang, R.; Zhang, H.; Cai, D.; Chen, H. The cytotoxic role of intermittent high glucose on apoptosis and cell viability in pancreatic beta cells. J. Diabetes Res. 2014, 2014, 712781. [Google Scholar] [CrossRef]
- Rao, S.; Callcott, E.T.; Santhakumar, A.B.; Chinkwo, K.A.; Vanniasinkam, T.; Luo, J.; Blanchard, C.L. Profiling polyphenol composition and antioxidant activity in Australian-grown rice using UHPLC Online-ABTS system. J. Cereal Sci. 2018, 80, 174. [Google Scholar] [CrossRef]
- Chen, K.; Zhou, Y.-X.; Li, K.; Qi, L.-X.; Zhang, Q.-F.; Wang, M.-C.; Xiao, J.-H. A novel three-round multiplex PCR for SNP genotyping with next generation sequencing. Anal. Bioanal. Chem. 2016, 408, 4371. [Google Scholar] [CrossRef]
- Mennen, L.I.; Walker, R.; Bennetau-Pelissero, C.; Scalbert, A. Risks and safety of polyphenol consumption. Am. J. Clin. Nutr. 2005, 81, 326S. [Google Scholar] [CrossRef]
- Callcott, E.T.; Blanchard, C.L.; Snell, P.; Santhakumar, A.B. The anti-inflammatory and antioxidant effects of pigmented rice consumption in an obese cohort. Food Funct. 2019, 10, 8016. [Google Scholar] [CrossRef]
- Suantawee, T.; Elazab, S.T.; Hsu, W.H.; Yao, S.; Cheng, H.; Adisakwattana, S. Cyanidin Stimulates Insulin Secretion and Pancreatic β-Cell Gene Expression through Activation of l-type Voltage-Dependent Ca(2+) Channels. Nutrients 2017, 9, 814. [Google Scholar] [CrossRef] [PubMed]
- Narasimhan, A.; Chinnaiyan, M.; Karundevi, B. Ferulic acid regulates hepatic GLUT2 gene expression in high fat and fructose-induced type-2 diabetic adult male rat. Eur. J. Pharmacol. 2015, 761, 391. [Google Scholar] [CrossRef] [PubMed]
- Calabrese, E.J.; Baldwin, L.A. The hormetic dose-response model is more common than the threshold model in toxicology. Toxicol. Sci. 2003, 71, 246. [Google Scholar] [CrossRef] [PubMed]
- Renaud, J.; Martinoli, M.-G. Considerations for the use of polyphenols as therapies in neurodegenerative diseases. Int. J. Mol. Sci. 2019, 20, 1883. [Google Scholar] [CrossRef]
- Aragonès, G.; Suárez, M.; Ardid-Ruiz, A.; Vinaixa, M.; Rodríguez, M.A.; Correig, X.; Arola, L.; Bladé, C. Dietary proanthocyanidins boost hepatic NAD+ metabolism and SIRT1 expression and activity in a dose-dependent manner in healthy rats. Sci. Rep. 2016, 6, 24977. [Google Scholar] [CrossRef]
- Kim, M.-J.; Ryu, G.R.; Chung, J.-S.; Sim, S.S.; Min, D.S.; Rhie, D.-J.; Yoon, S.H.; Hahn, S.J.; Kim, M.-S.; Jo, Y.-H. Protective effects of epicatechin against the toxic effects of streptozotocin on rat pancreatic islets: in vivo and in vitro. Pancreas 2003, 26, 292. [Google Scholar] [CrossRef]
- Bernatoniene, J.; Kopustinskiene, D.M. The role of catechins in cellular responses to oxidative stress. Molecules 2018, 23, 965. [Google Scholar] [CrossRef]
- Cao, M.-M.; Lu, X.; Liu, G.-D.; Su, Y.; Li, Y.-B.; Zhou, J. Resveratrol attenuates type 2 diabetes mellitus by mediating mitochondrial biogenesis and lipid metabolism via Sirtuin type 1. Exp. Ther. Med. 2018, 15, 576. [Google Scholar] [CrossRef]
- Rutanen, J.; Yaluri, N.; Modi, S.; Pihlajamäki, J.; Vänttinen, M.; Itkonen, P.; Kainulainen, S.; Yamamoto, H.; Lagouge, M.; Sinclair, D.A.; et al. SIRT1 mRNA expression may be associated with energy expenditure and insulin sensitivity. Diabetes 2010, 59, 829. [Google Scholar] [CrossRef]
- Gauthier, B.R.; Wiederkehr, A.; Baquié, M.; Dai, C.; Powers, A.C.; Kerr-Conte, J.; Pattou, F.; MacDonald, R.J.; Ferrer, J.; Wollheim, C.B. PDX1 Deficiency Causes Mitochondrial Dysfunction and Defective Insulin Secretion through TFAM Suppression. Cell Metab. 2009, 10, 110. [Google Scholar] [CrossRef]
- Puddu, A.; Sanguineti, R.; Mach, F.; Dallegri, F.; Viviani, G.L.; Montecucco, F. Update on the protective molecular pathways improving pancreatic beta-cell dysfunction. Mediat. Inflamm. 2013, 2013, 14. [Google Scholar] [CrossRef] [PubMed]
- Luna-Vital, D.A.; Gonzalez de Mejia, E. Anthocyanins from purple corn activate free fatty acid-receptor 1 and glucokinase enhancing in vitro insulin secretion and hepatic glucose uptake. PLoS ONE 2018, 13, e0200449. [Google Scholar] [CrossRef] [PubMed]
- Jung, E.H.; Sung, R.K.; Hwang, I.K.; Tae, Y.H. Hypoglycemic effects of a phenolic acid fraction of rice bran and ferulic acid in C57BL/KsJ-db/db mice. J. Agric. Food Chem. 2007, 55, 9800. [Google Scholar] [CrossRef] [PubMed]
- Rugina, D.; Diaconeasa, Z.; Coman, C.; Bunea, A.; Socaciu, C.; Pintea, A. Chokeberry anthocyanin extract as pancreatic b-Cell protectors in two models of induced oxidative stress. Oxid. Med. Cell. Longev. 2015, 2015, 10. [Google Scholar] [CrossRef] [PubMed]
- Jayaprakasam, B.; Vareed, S.K.; Olson, L.K.; Nair, M.G. Insulin secretion by bioactive anthocyanins and anthocyanidins present in fruits. J. Agric. Food Chem. 2005, 53, 28. [Google Scholar] [CrossRef]
- Johnson, M.H.; de Mejia, E.G. phenolic compounds from fermented berry beverages modulated gene and protein expression to increase insulin secretion from pancreatic β-cells in vitro. J. Agric. Food Chem. 2016, 64, 2569. [Google Scholar] [CrossRef]
- Francis, N.; Rao, S.; Blanchard, C.; Santhakumar, A.J.M. Black sorghum phenolic extract regulates expression of genes associated with oxidative stress and inflammation in human endothelial cells. Molecules 2019, 24, 3321. [Google Scholar] [CrossRef]
- Bei, W.; Wang, Y.; Chen, J.; Zhang, J.; Wang, L.; Gu, Z.; Hu, Y.; Huang, Y.; Xu, W.; Lei, Z.; et al. Chinese medicine FTZ recipe protects against high-glucose-induced beta cell injury through alleviating oxidative stress. J. Evid. Based Complement. Altern. Med. 2019, 2019, 14. [Google Scholar] [CrossRef]
- Hohmeier, H.E.; Mulder, H.; Chen, G.; Henkel-Rieger, R.; Prentki, M.; Newgard, C.B. Isolation of INS-1-derived cell lines with robust ATP-sensitive K+ channel-dependent and -independent glucose-stimulated insulin secretion. Diabetes 2000, 49, 424. [Google Scholar] [CrossRef]
- Muller, P.Y.; Janovjak, H.; Miserez, A.R.; Dobbie, Z. Processing of gene expression data generated by quantitative real-time RT-PCR. Biotechniques 2002, 32, 1372. [Google Scholar]
© 2020 by the authors. Licensee MDPI, Basel, Switzerland. This article is an open access article distributed under the terms and conditions of the Creative Commons Attribution (CC BY) license (http://creativecommons.org/licenses/by/4.0/).