Red Chinese Cabbage Transcriptome Analysis Reveals Structural Genes and Multiple Transcription Factors Regulating Reddish Purple Color

 , ,
, ,  , ,
, , 

Abstract

1. Introduction
2. Results
2.1. Estimation of Anthocyanin Content in RPCC and GCC Leaf Samples
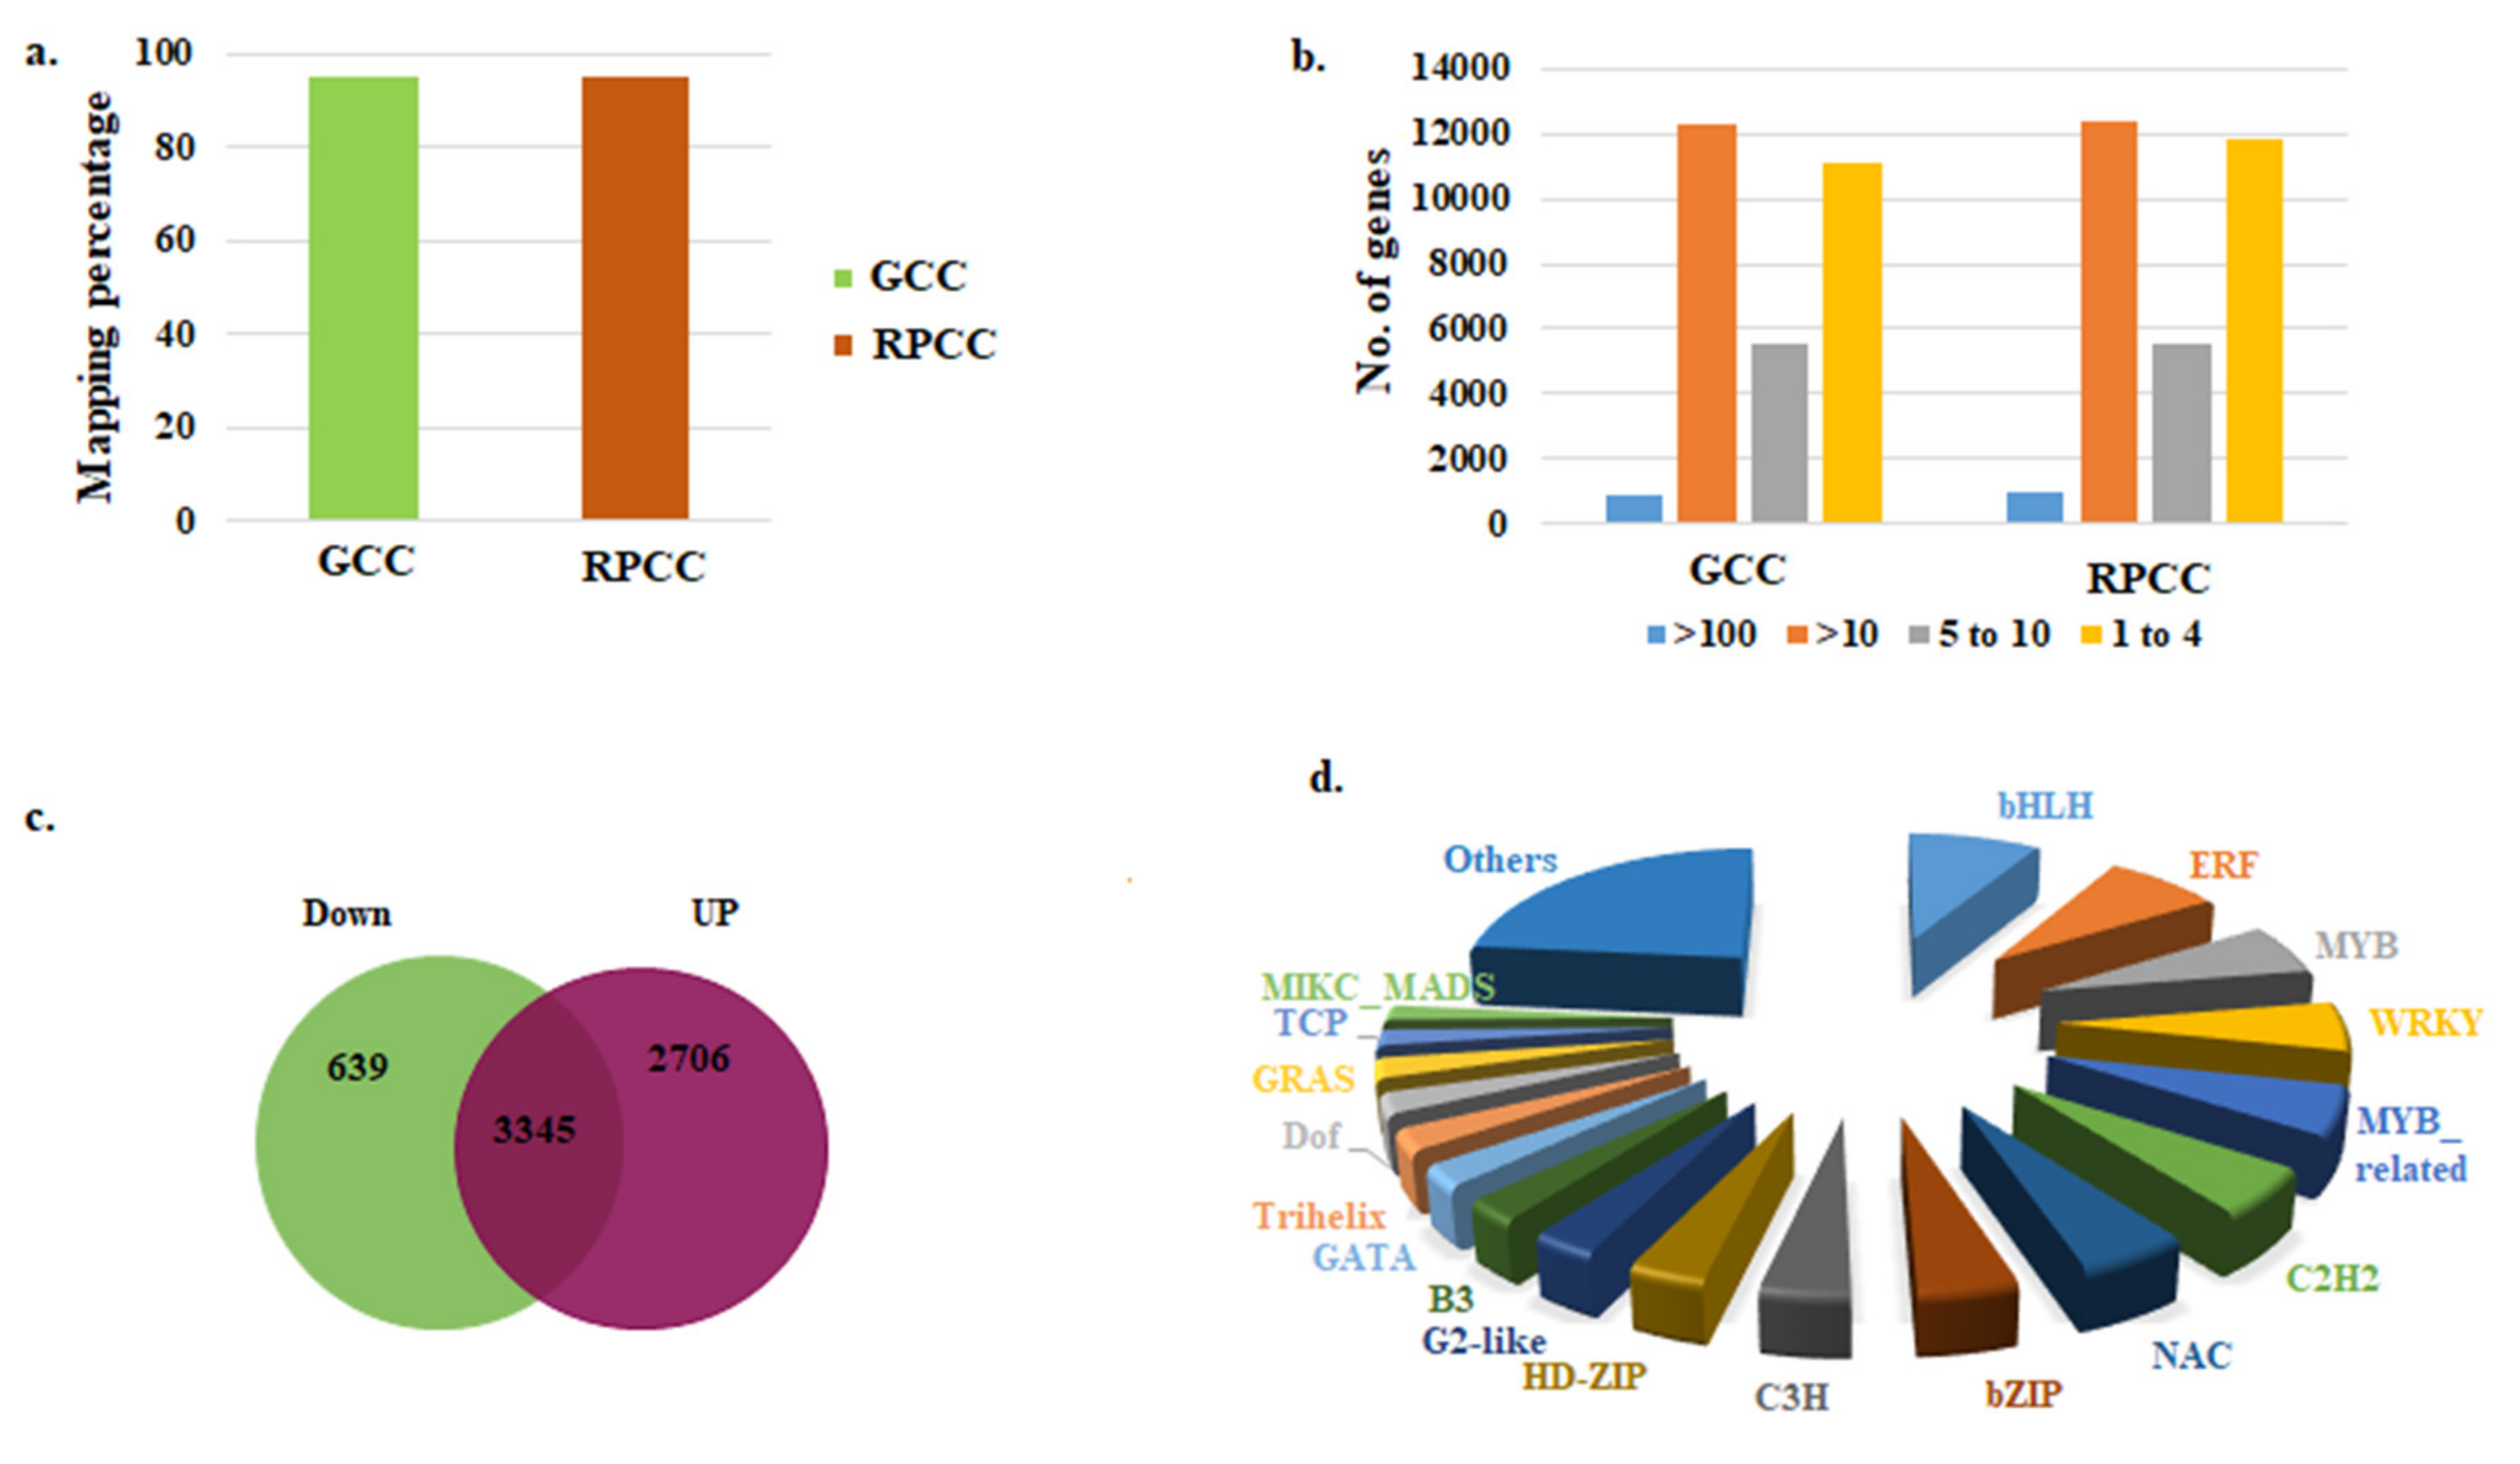
2.2. RNA-Sequencing of RPCC and GCC Samples
2.3. Identification of DEGs
2.4. Identification of Transcription Factor Genes
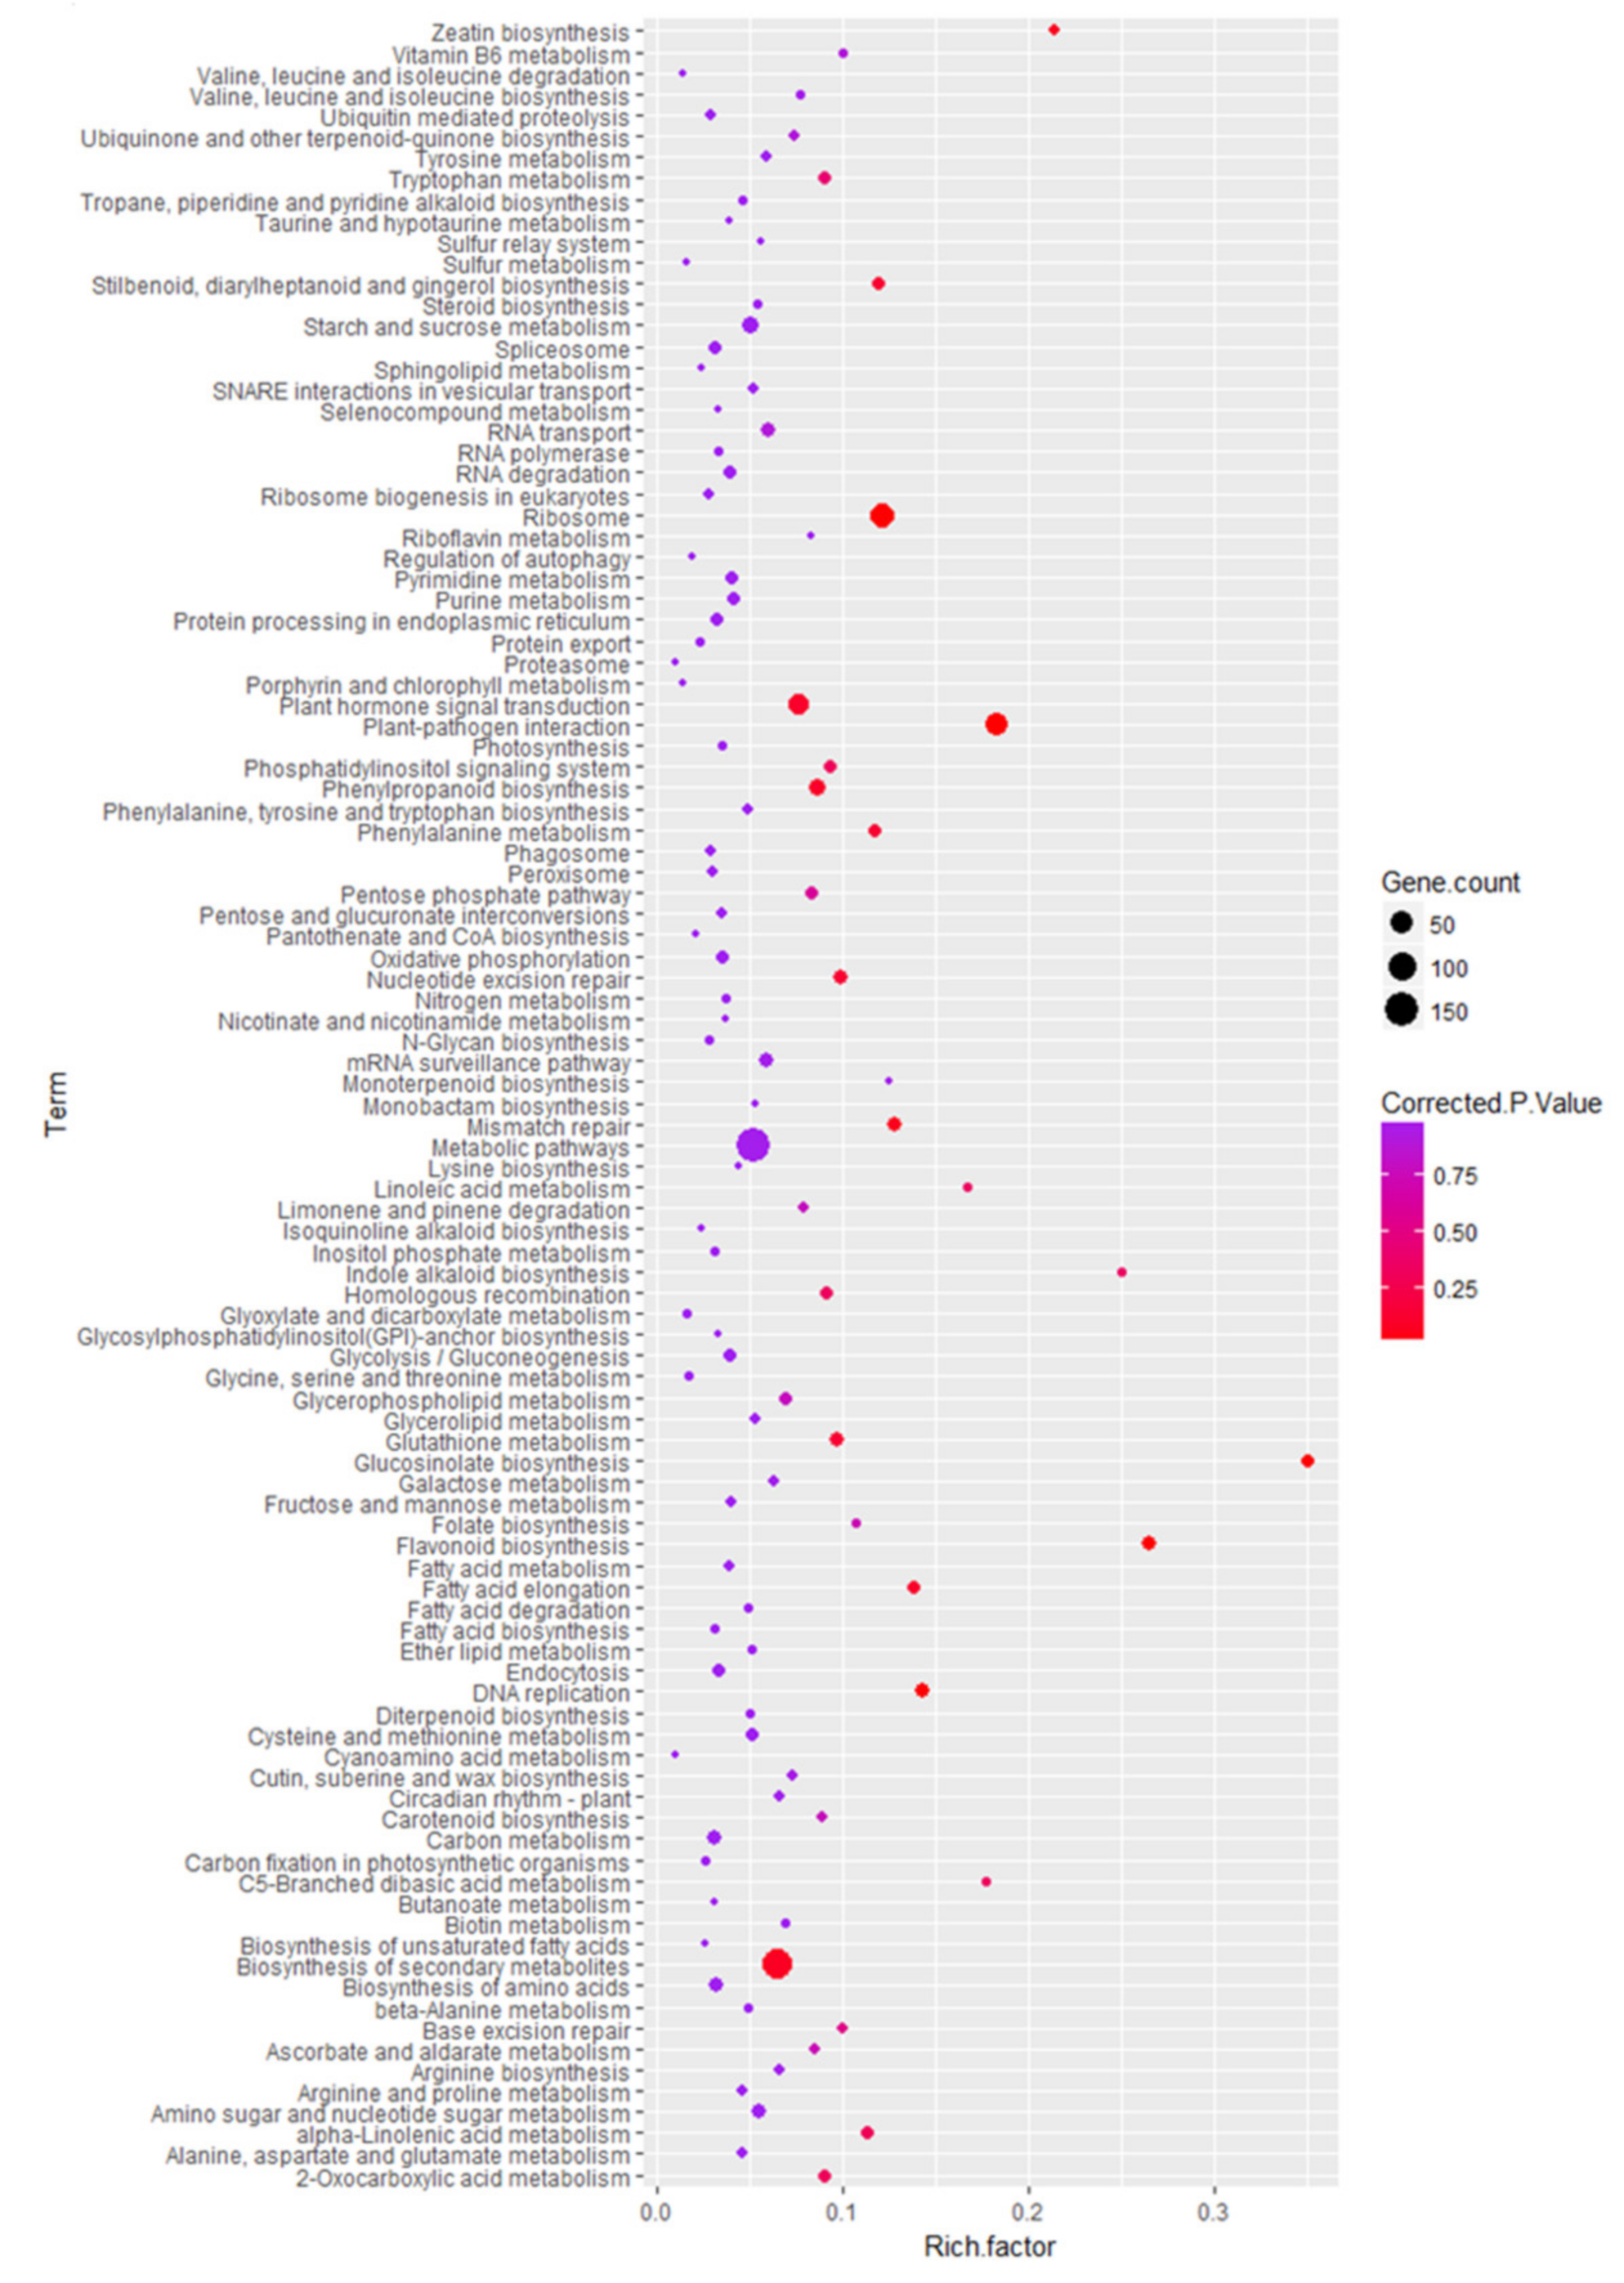
2.5. Functional Characteristics of DEGs and KEGG Pathway Enrichment Analysis
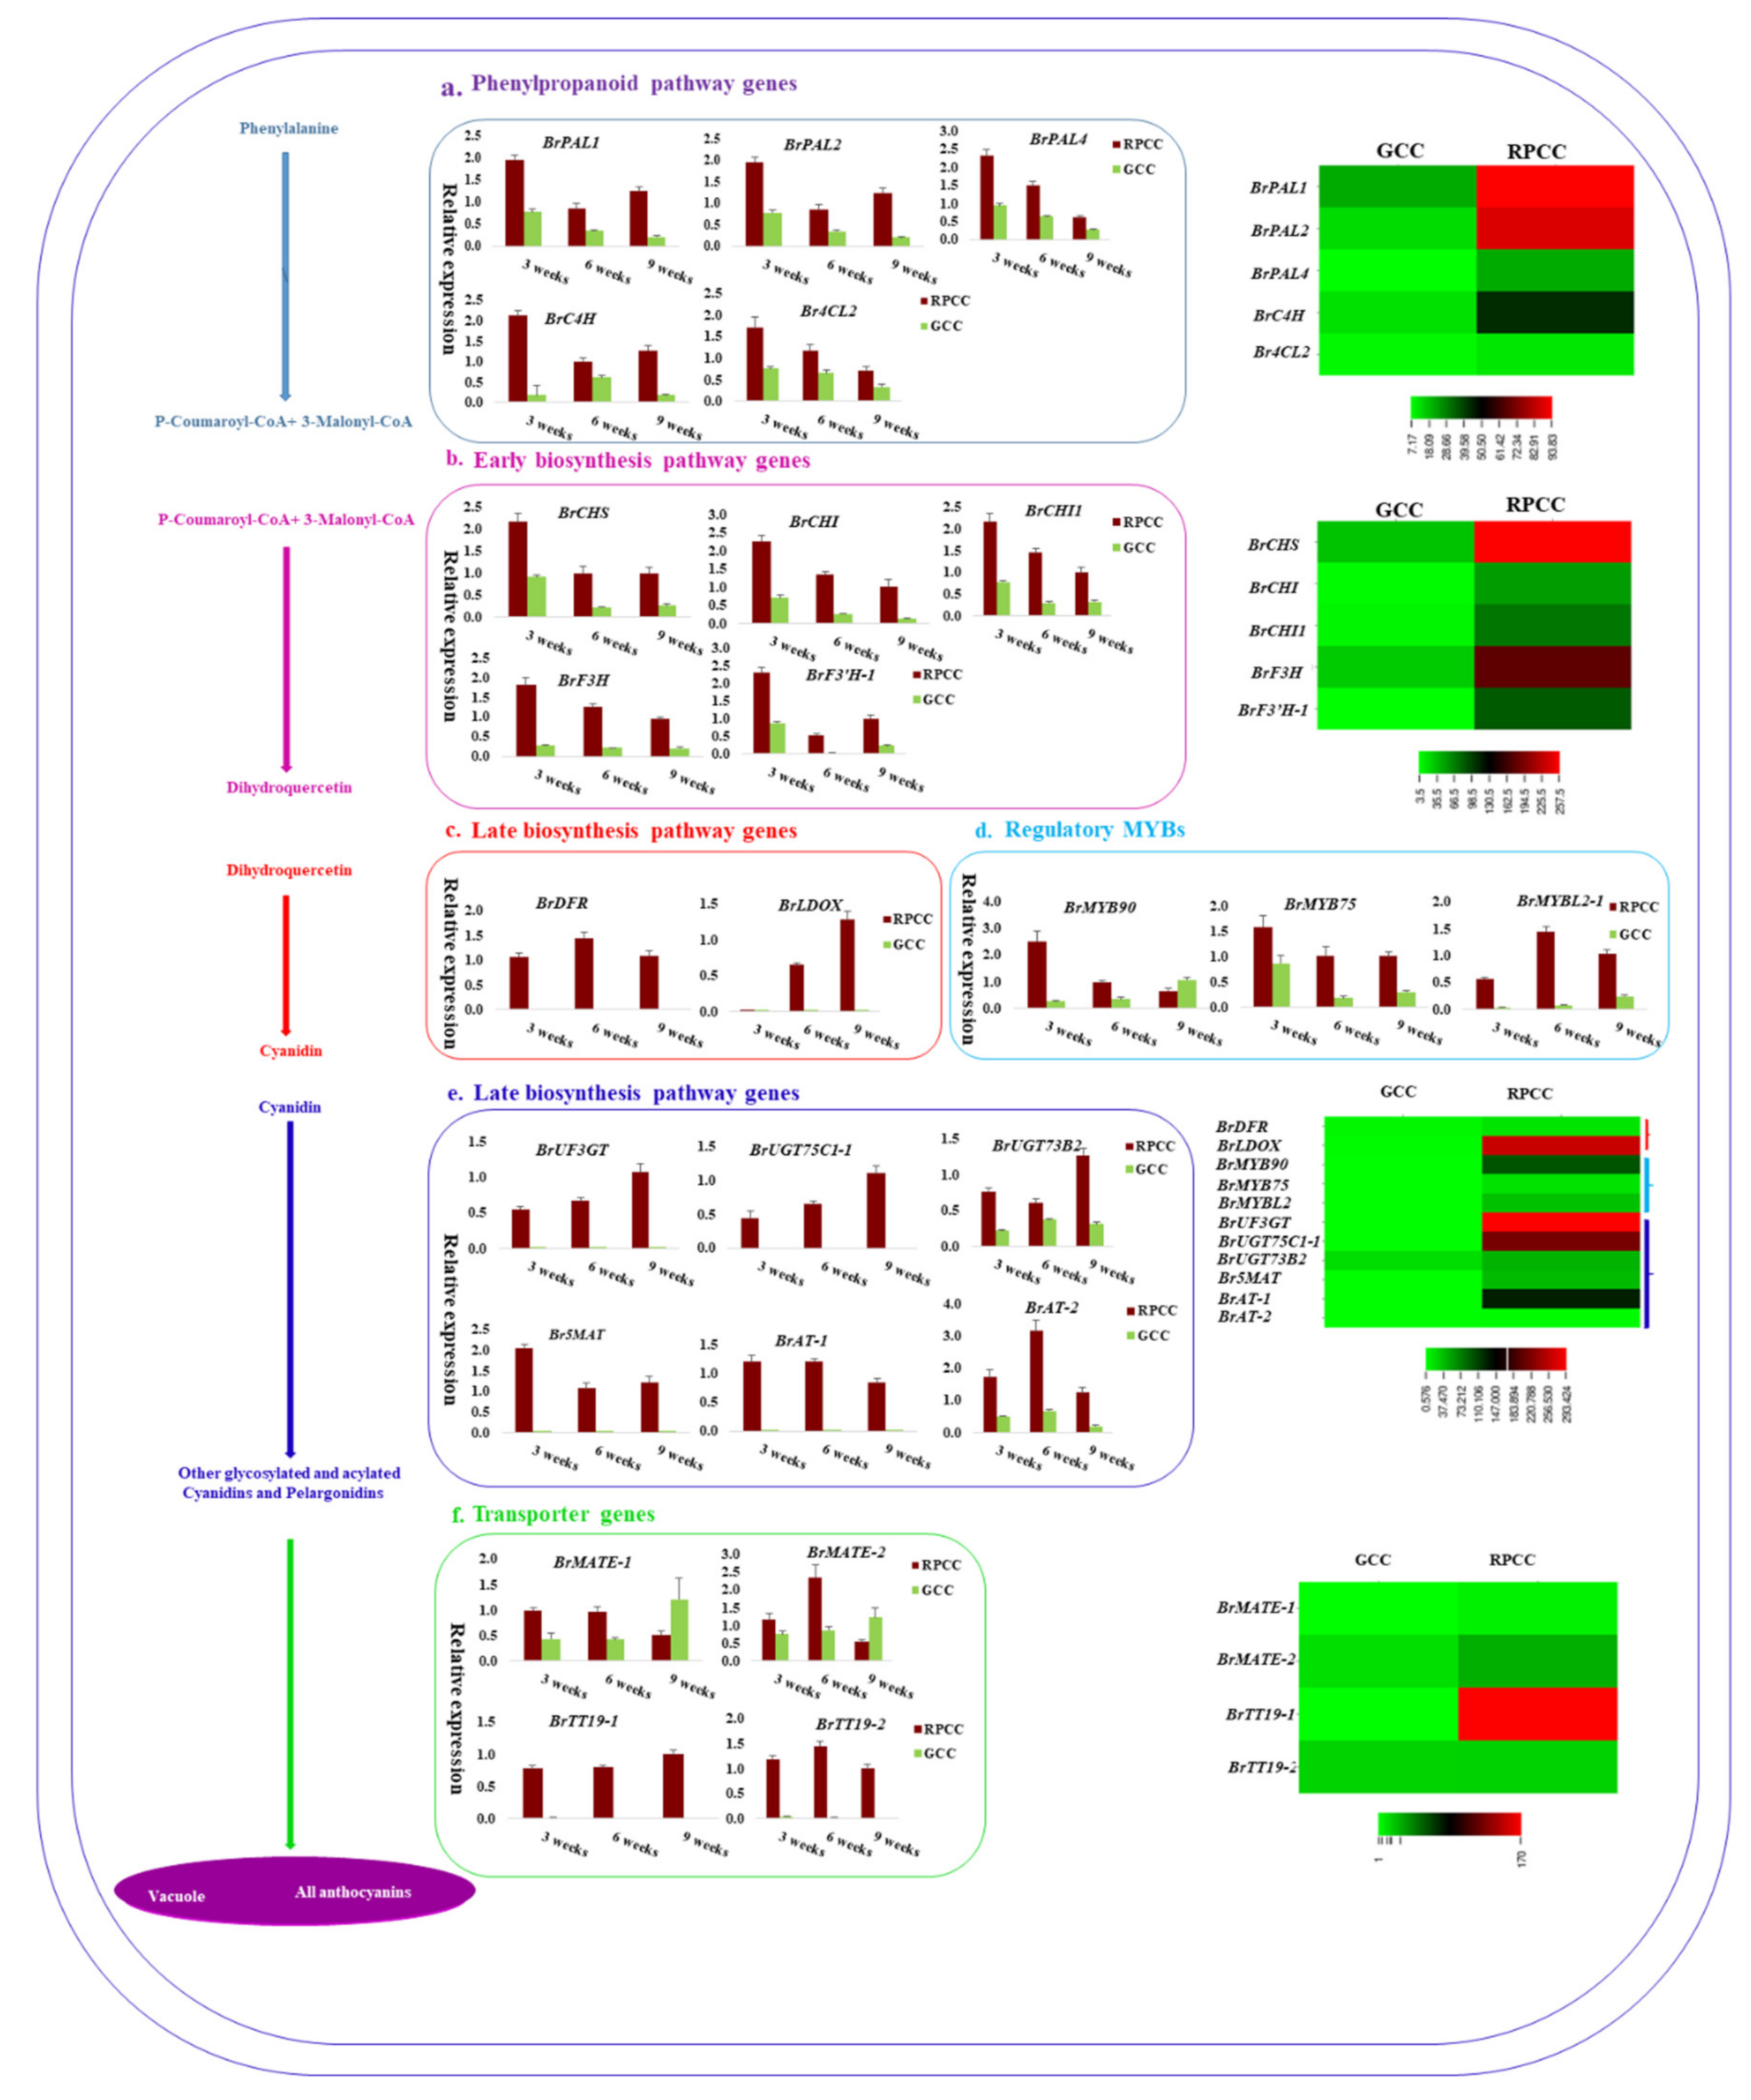
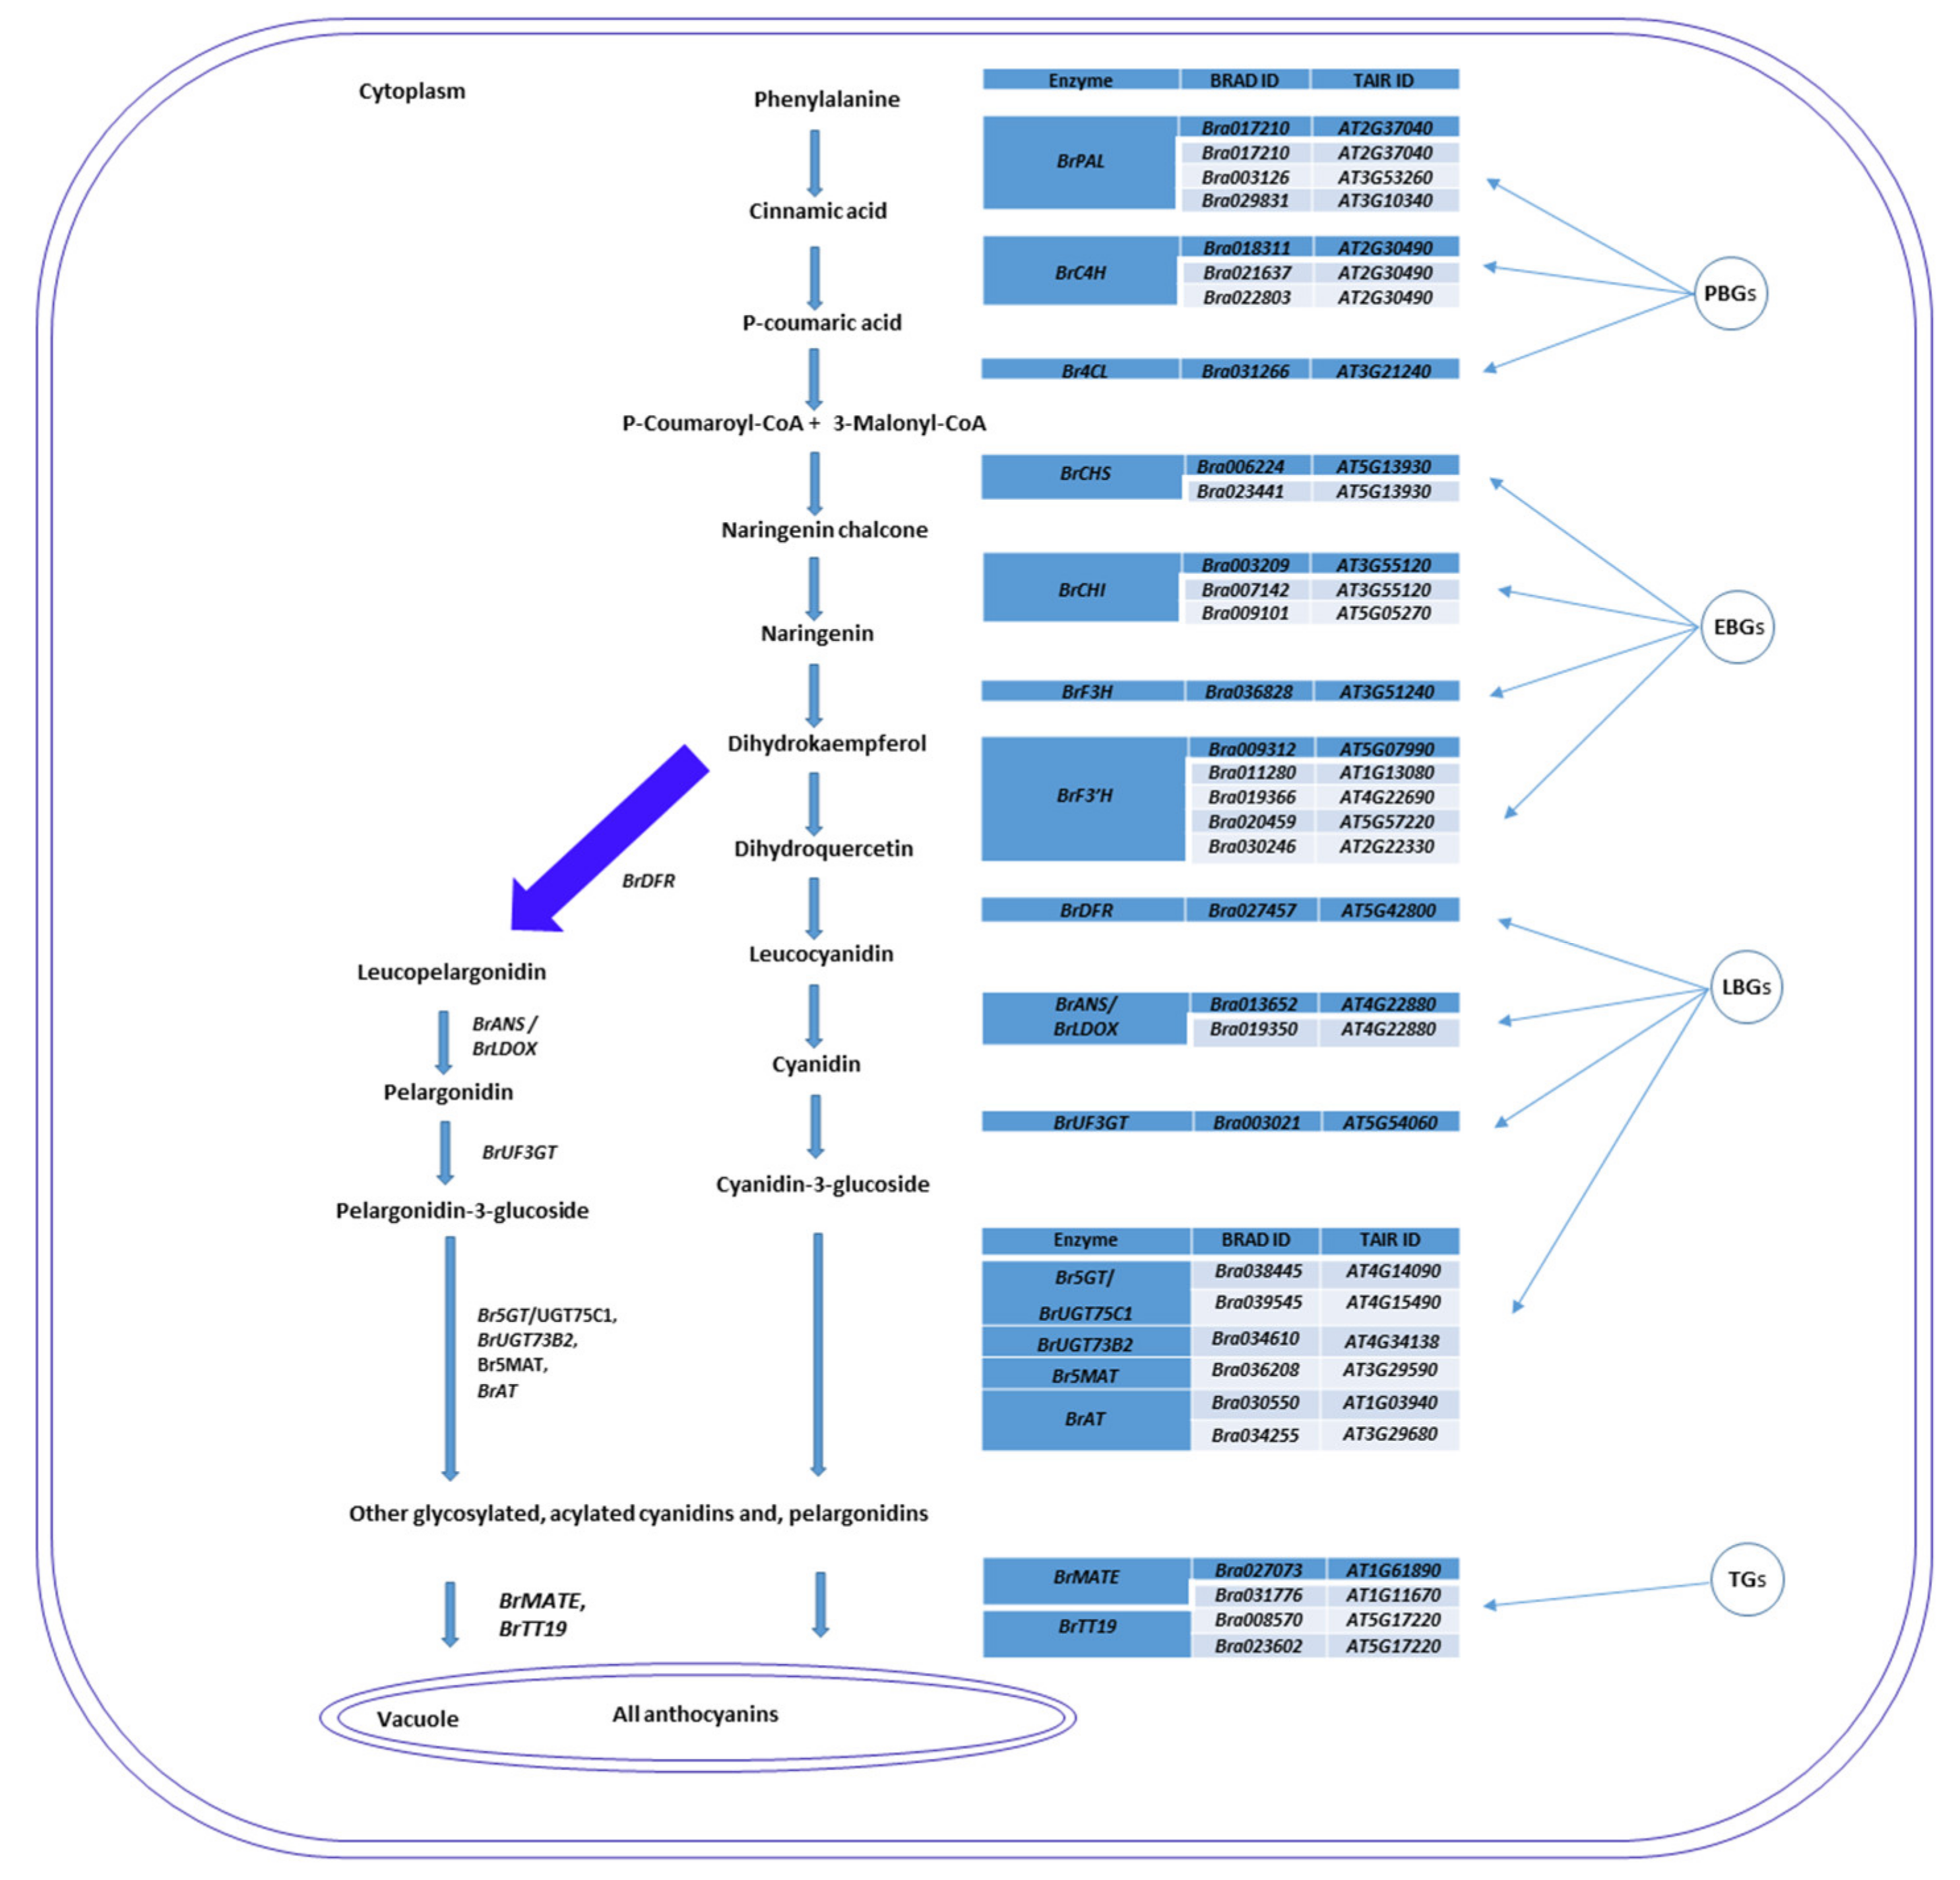
2.6. Genes Related to Anthocyanin Biosynthesis Identified from Transcriptome Data
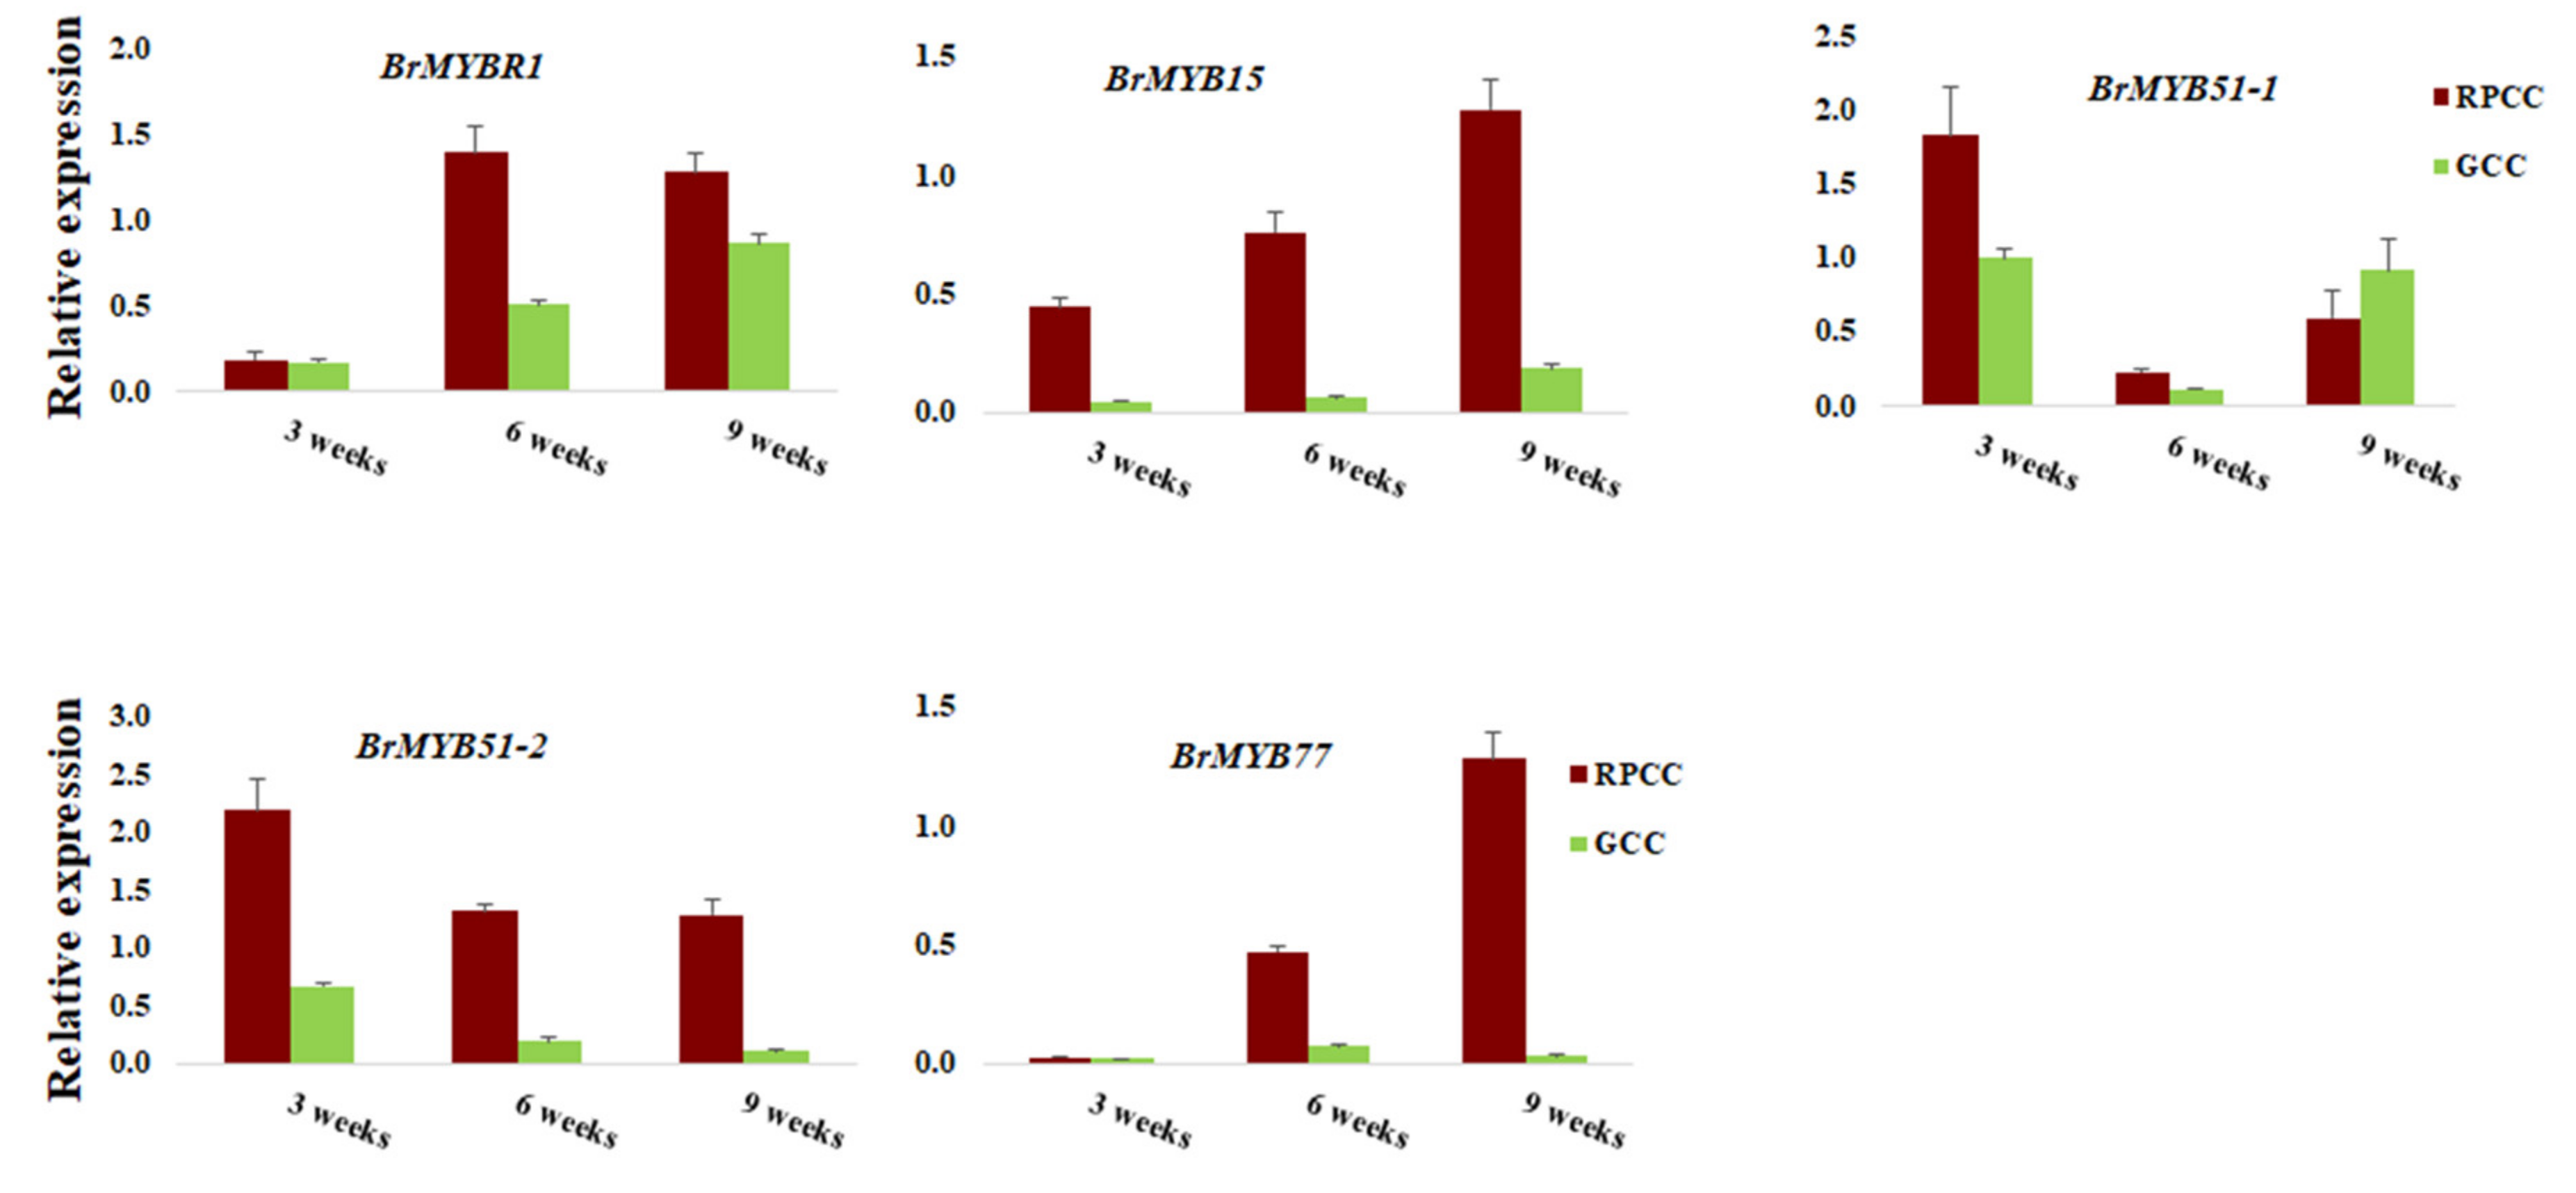
2.7. Expression Analysis of Anthocyanin Biosynthetic Genes by qRT-PCR
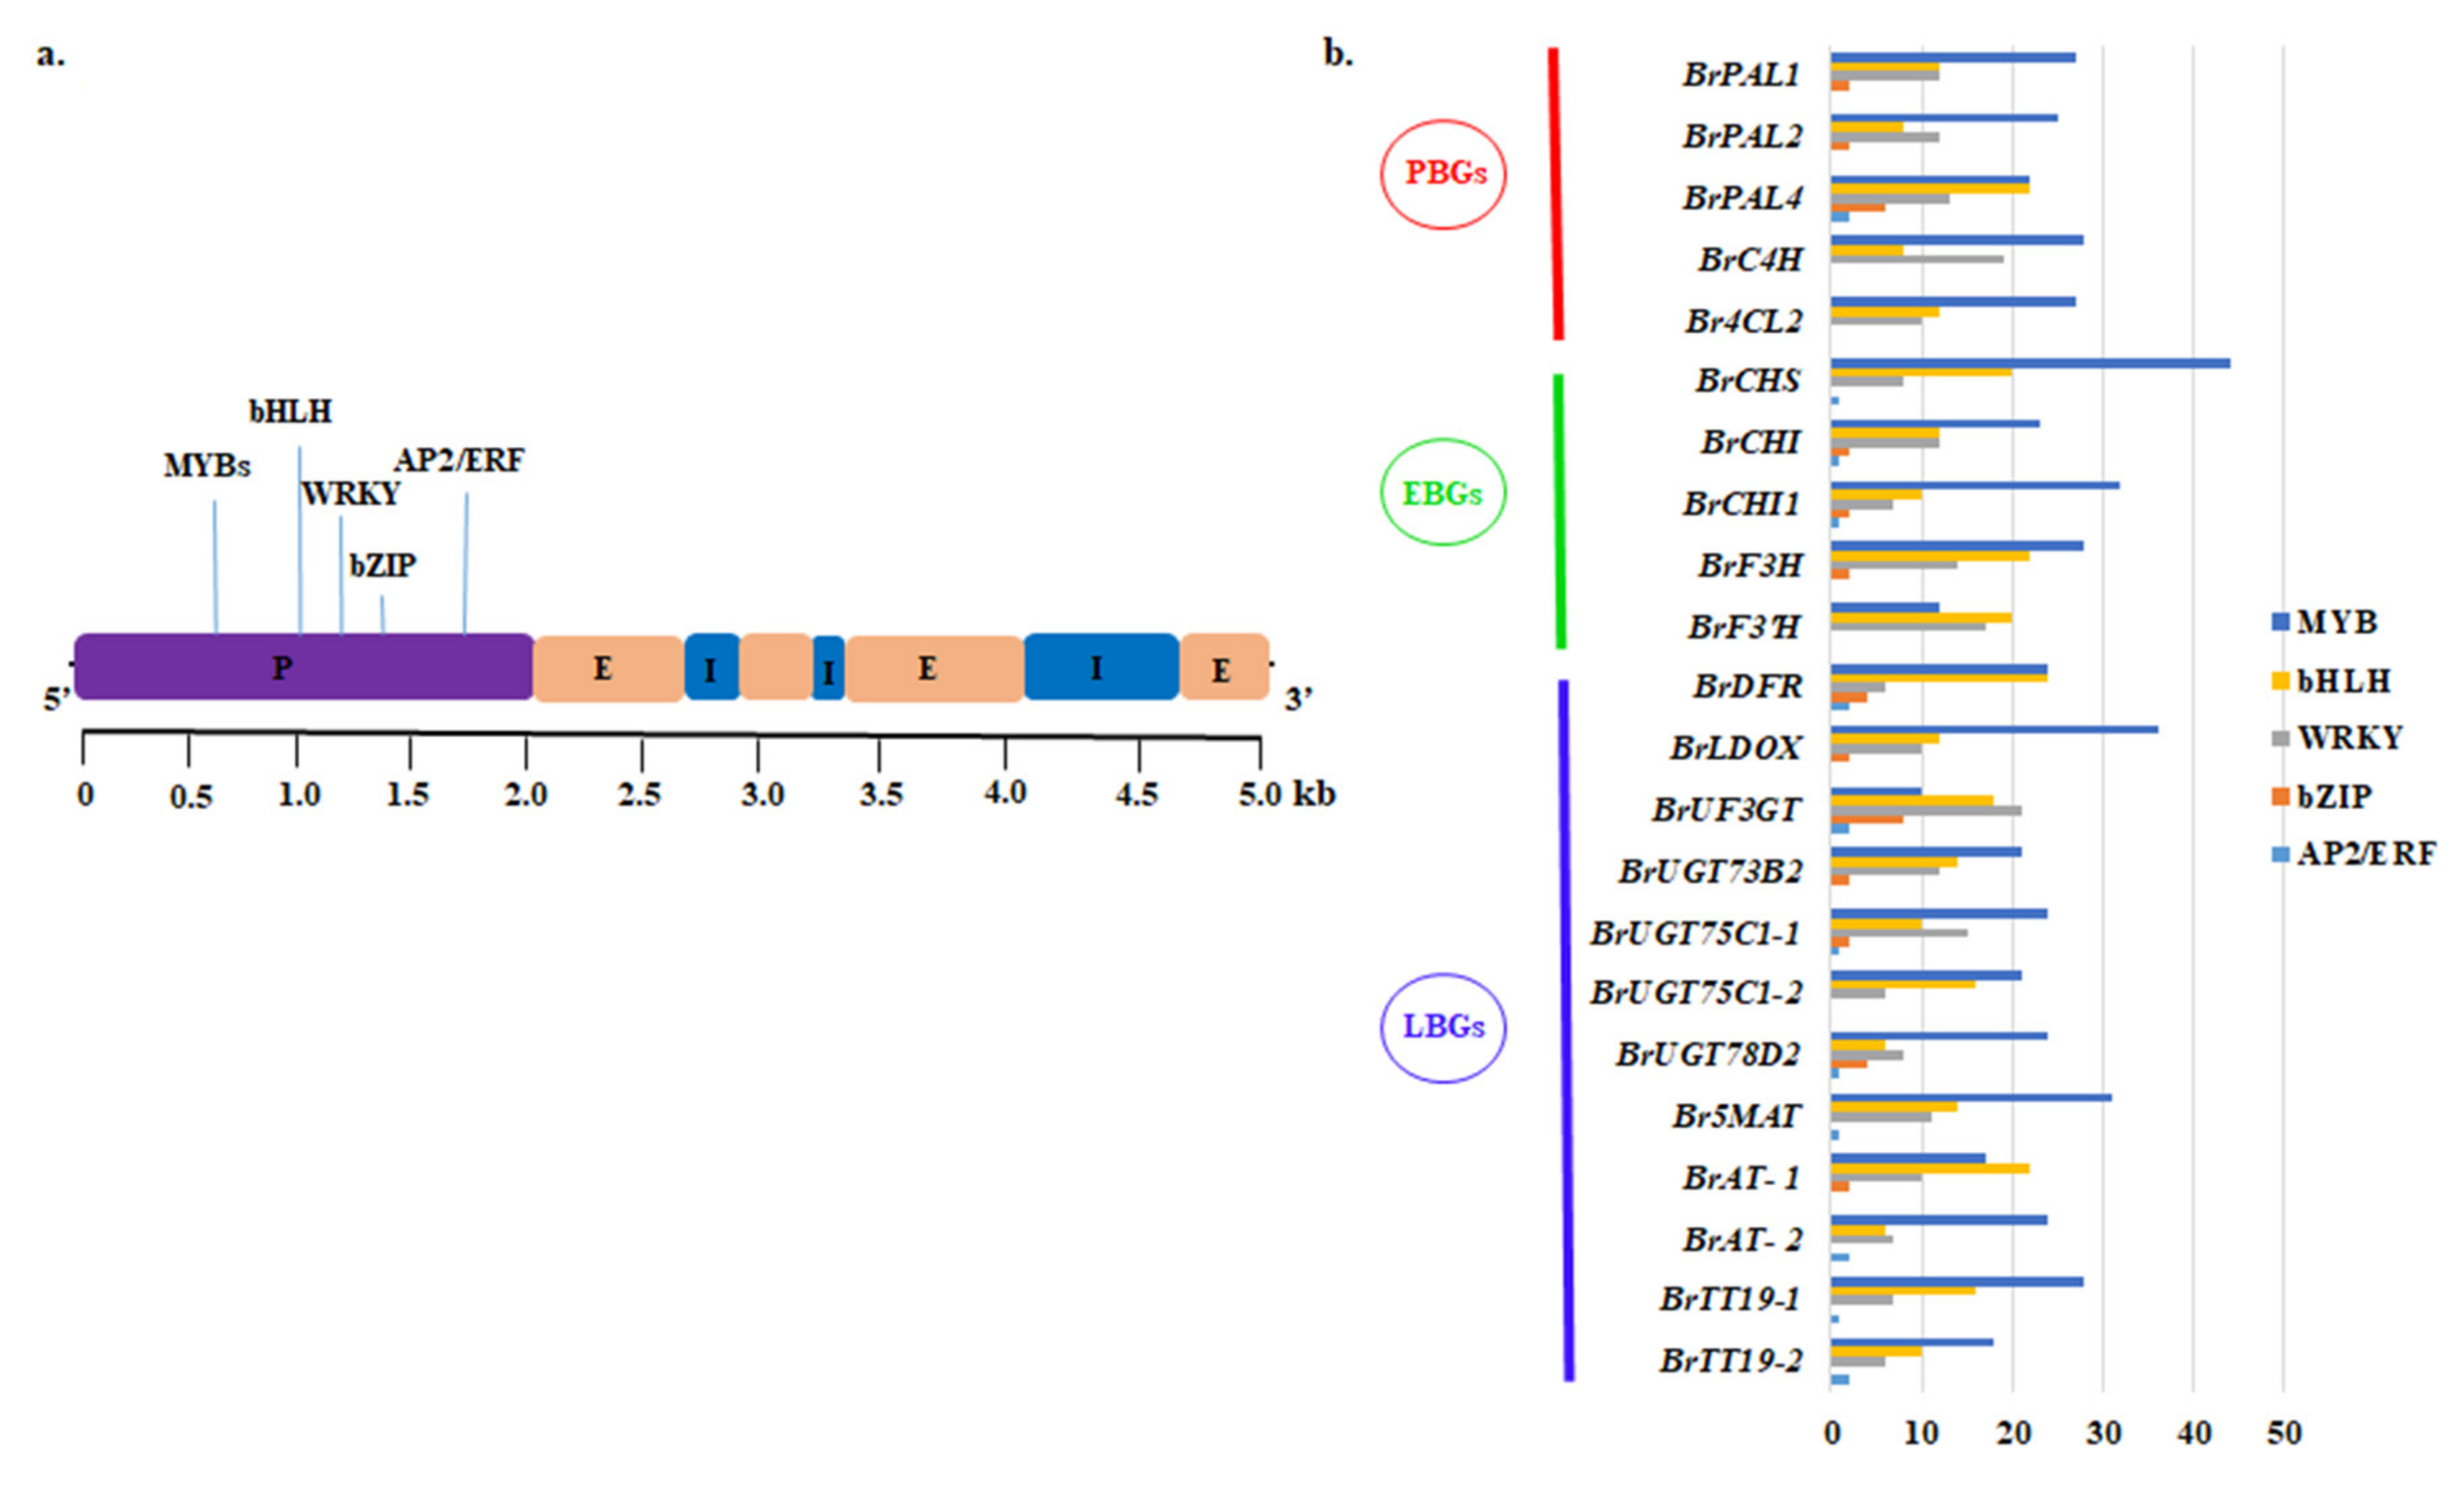
2.8. Promoter Analysis of Anthocyanin Biosynthetic Genes
2.9. Regulatory Network Analysis of Anthocyanin Biosynthesis Genes
3. Discussion
3.1. Novel Anthocyanin Pigments Responsible for the Color of RPCC
3.2. Anthocyanin Biosynthesis Genes Are Differentially Regulated in RPCC
3.3. Differential Expression of MYBs Regulates Reddish Purple Color Accumulation
4. Materials and Methods
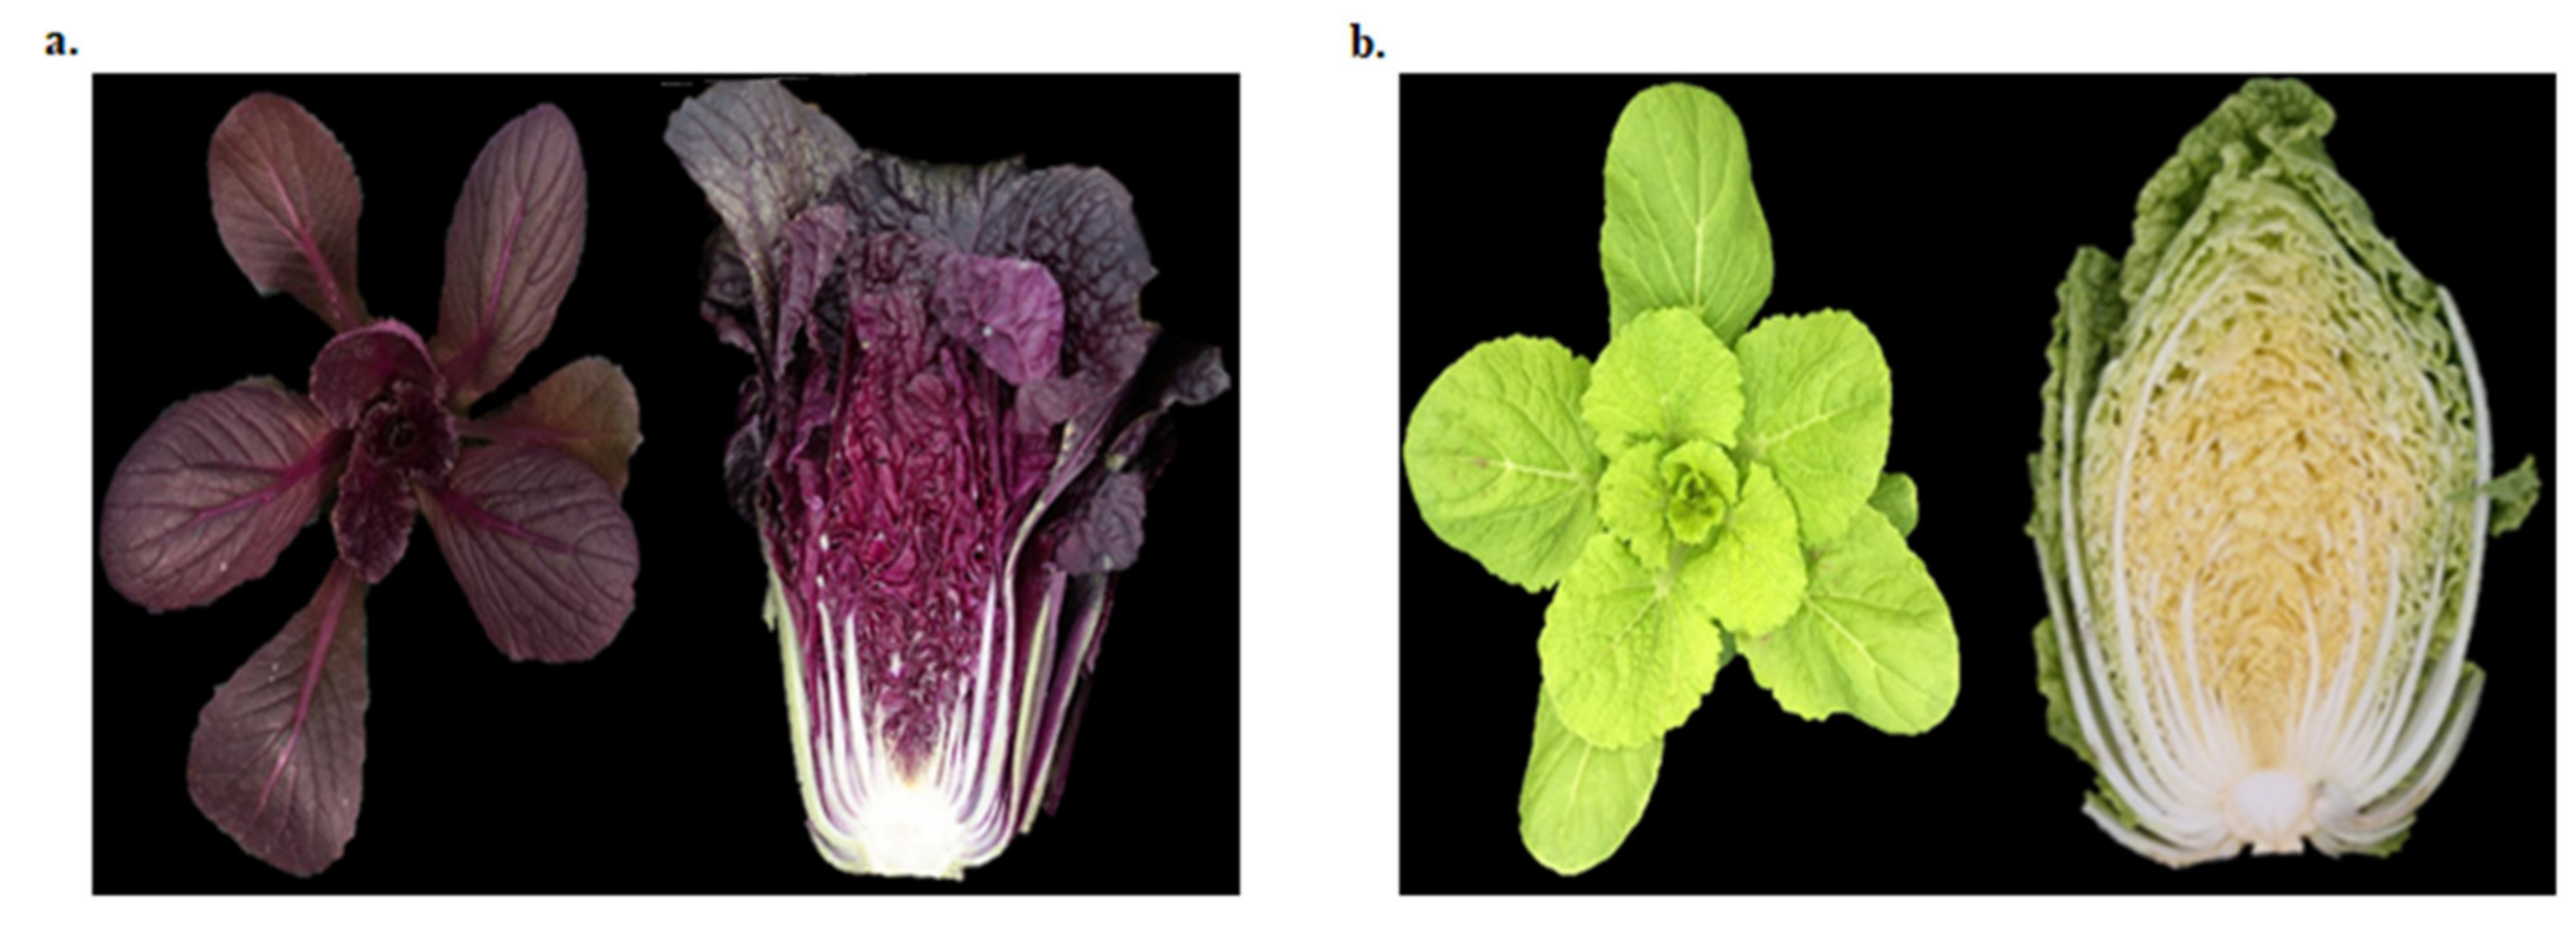
4.1. Plant Material and Sample Collection
4.2. Anthocyanin Extraction and HPLC Analysis
4.3. Sequence Pre-Processing and Assembly
4.4. Mapping and Annotation of Transcripts
4.5. Identification of Transcription Factors
4.6. Prediction of Differentially Expressed Genes
4.7. Expression Analyses
4.8. Gene Ontology Annotation and KEGG Enrichment Analyses
4.9. Identification of Cis-Regulatory Elements
4.10. Network Analysis
5. Conclusions
Supplementary Materials
Author Contributions
Funding
Acknowledgments
Conflicts of Interest
Abbreviations
| ABGs | Anthocyanin biosynthetic genes |
| ABP | Anthocyanin biosynthetic pathway |
| AP2/ERF | Apetala 2/ethylene response factor |
| AT | Acyltransferases |
| bHLH | Basic helix-loop-helix |
| DEGs | Differentially expressed genes |
| DFR | Dihydroflavonol-4-reductase |
| EBGs | Early biosynthetic genes |
| GCC | Green Chinese cabbage |
| HPLC | High performance liquid chromatography |
| LBGs | Late biosynthetic genes |
| LDOX | Leucoanthocyanidin dioxygenases |
| MATE | Multidrug and toxic compound extrusion |
| MYB | Myeloblastosis |
| 5MAT | 5-O-glucoside-6-O-malonyltransferase |
| PBGs | Phenylpropanoid biosynthetic genes |
| qRT-PCR | Quantitative real-time polymerase chain reaction |
| RPCC | Reddish purple Chinese cabbage |
| RPKM | Reads per kilo base per million mapped reads |
| TT19 | Transparent Testa 19 |
| UF3GT | UDP- glucose: flavonoid 3-O-glucosyltransferase |
| UGT75c1 | UDP-glucosyltransferase 75c1 |
References
- Katche, E.; Quezada-Martinez, D.; Katche, E.I.; Vasquez-Teuber, P.; Mason, A.S. Interspecific hybridization for Brassica crop improvement Crop Breeding. Genet. Genom. 2019, 1, e190007. [Google Scholar]
- Wang, G.-X.; Lv, J.; Zhang, J.; Han, S.; Zong, M.; Guo, N.; Zeng, X.-Y.; Zhang, Y.-Y.; Wang, Y.-P.; Liu, F. Genetic and epigenetic alterations of Brassica nigra introgression lines from somatic hybridization: A resource for cauliflower improvement. Front. Plant Sci. 2016, 7, 1258. [Google Scholar] [CrossRef]
- Xie, L.; Li, F.; Zhang, S.; Zhang, H.; Qian, W.; Li, P.; Zhang, S.; Sun, R. Mining for candidate genes in an introgression line by using RNA sequencing: The anthocyanin over accumulation phenotype in Brassica. Front. Plant Sci. 2016, 7, 1245. [Google Scholar] [CrossRef]
- Lee, H.; Oh, I.-N.; Kim, J.; Jung, D.; Cuong, N.P.; Kim, Y.; Lee, J.C.; Kwon, O.; Park, S.U.; Lim, Y.P.; et al. Phenolic compound profiles and their seasonal variations in new red-phenotype head-forming Chinese cabbages. Lwt-Food Sci. Tech. 2018, 90, 433–439. [Google Scholar] [CrossRef]
- Vogt, T. Phenylpropanoid biosynthesis. Mol. Plant 2010, 3, 2–20. [Google Scholar] [CrossRef] [PubMed]
- Tanaka, Y.; Sasaki, N.; Ohmiya, A. Biosynthesis of plant pigments: Anthocyanins, betalains and carotenoids. Plant J. 2008, 54, 733–749. [Google Scholar] [CrossRef]
- Liu, Y.; Tikunov, Y.; Schouten, R.E.; Marcelis, L.F.M.; Visser, R.G.F.; Bovy, A. anthocyanin biosynthesis and degradation mechanisms in solanaceous vegetables: A review. Front. Chem. 2018, 6, 52. [Google Scholar] [CrossRef] [PubMed]
- Petroni, K.; Tonelli, C. Recent advances on the regulation of anthocyanin synthesis in reproductive organs. Plant Sci. 2011, 181, 219–229. [Google Scholar] [CrossRef] [PubMed]
- Sablowski, R.W.M.; Moyano, E.; Cullanez-Macia, F.A.; Schuch, W.; Martin, C.; Bevan, M. A flower specific Myb protein activates transcription of phenylpropanoid biosynthetic genes. EMBO J. 1994, 13, 128–137. [Google Scholar] [CrossRef] [PubMed]
- Lloyd, A.; Brockman, A.; Aguirre, L.; Campbell, A.; Bean, A.; Cantero, A.; Gonzalez, A. Advances in the MYB–bHLH–WD repeat (MBW) pigment regulatory model: Addition of a WRKY factor and co-option of an anthocyanin MYB for betalain regulation. Plant Cell Physiol. 2017, 58, 1431–1441. [Google Scholar] [CrossRef] [PubMed]
- Stracke, R.; Werber, M.; Weisshaar, B. The R2R3-MYB gene family in Arabidopsis thaliana. Curr. Opin. Plant Biol. 2001, 4, 447–456. [Google Scholar] [CrossRef]
- Dubos, C.; Stracke, R.; Grotewold, E.; Weisshaar, B.; Martin, C.; Lepiniec, L. MYB transcription factors in Arabidopsis. Trends Plant Sci. 2010, 15, 573–581. [Google Scholar] [CrossRef] [PubMed]
- Gonzalez, A.; Zhao, M.; Leavitt, J.M.; Lloyd, A.M. Regulation of the anthocyanin biosynthetic pathway by the TTG1/bHLH/Myb transcriptional complex in Arabidopsis seedlings. Plant J. 2008, 53, 814–827. [Google Scholar] [CrossRef] [PubMed]
- Xie, X.; Xie, X.B.; Li, S.; Zhang, R.F.; Zhao, J.; Chen, Y.C.; Zhao, Q.; Yao, Y.X.; You, C.X.; Zhang, X.S.; et al. The bHLH transcription factor MdbHLH3 promotes anthocyanin accumulation and fruit colouration in response to low temperature in apples. Plant Cell Env. 2012, 35, 1884–1897. [Google Scholar] [CrossRef]
- Verweij, W.; Spelt, C.E.; Bliek, M.; de Vries, M.; Wit, N.; Faraco, M. Functionally similar WRKY proteins regulate vacuolar acidification in Petunia and hair development in Arabidopsis. Plant Cell 2016, 28, 786–803. [Google Scholar] [CrossRef] [PubMed]
- An, J.; Qu, F.; Yao, J.; Wang, X.N.; You, C.X.; Wang, X.F.; Hao, Y.J. The bZIP transcription factor MdHY5 regulates anthocyanin accumulation and nitrate assimilation in apple. Hortic. Res. 2017, 4, 1702. [Google Scholar] [CrossRef] [PubMed]
- An, J.P.; Yao, J.F.; Xu, R.R.; You, C.X.; Wang, X.F.; Hao, Y.J. Apple bZIP transcription factor MdbZIP44 regulates abscisic acid-promoted anthocyanin accumulation. Plant Cell Env. 2018, 41, 2678–2692. [Google Scholar] [CrossRef]
- Guo, N.; Wu, J.; Zheng, S.; Cheng, F.; Liu, B.; Liang, J.; Cui, Y.; Wang, X. Anthocyanin profile characterization and quantitative trait locus mapping in zicaitai (Brassica rapa L. ssp.chinensis var. purpurea). Mol. Breed. 2015, 35, 113. [Google Scholar] [CrossRef]
- He, Q.; Zhang, Z.; Zhang, L. Anthocyanin accumulation, antioxidant ability and stability, and a transcriptional analysis of anthocyanin biosynthesis in purple heading Chinese cabbage (Brassica rapa L. ssp. pekinensis). J. Agricul. Food Chem. 2016, 64, 132–145. [Google Scholar] [CrossRef]
- Oh, Y.S.; Lee, J.H.; Yoon, S.H.; Oh, C.H.; Choi, D.S.; Choe, E.; Jung, M.Y. Characterization and quantification of anthocyanins in grape juices obtained from the grapes cultivated in Korea by HPLC/DAD, HPLC/MS, and HPLC/MS/MS. J. Food Sci. 2008, 73, C378–C389. [Google Scholar] [CrossRef]
- Moreno, D.A.; Perez-Balibrea, S.; Ferreres, F.; Gil-Izquierdo, A.; Garcia-Viguera, C. Acylated anthocyanins in Broccoli sprouts. Food Chem. 2010, 123, 358–363. [Google Scholar] [CrossRef]
- Jeon, J.; Kim, J.K.; Kim, H.; Kim, Y.J.; Park, Y.J.; Kim, S.J.; Kim, C.; Park, S.U. Transcriptome analysis and metabolic profiling of green and red kale (Brassica oleracea var. acephala) seedlings. Food Chem. 2018, 241, 7–13. [Google Scholar] [CrossRef] [PubMed]
- Jeon, J.; Lim, C.J.; Kim, J.K.; Park, S.U. Comparative metabolic profiling of green and purple pakchoi (Brassica rapa Subsp. Chinensis). Molecules 2018, 23, 1613. [Google Scholar] [CrossRef] [PubMed]
- Tong, C.; Wang, X.; Yu, J.; Wu, J.; Li, W.; Huang, J.; Dong, C.; Hua, W.; Liu, S. Comprehensive analysis of RNA-seq data reveals the complexity of the transcriptome in Brassica rapa. BMC Genom. 2013, 14, 689. [Google Scholar] [CrossRef] [PubMed]
- Wang, S.; Zhou, G.; Huang, X.; Hu, J.; Wang, B.; Lin, C.; Li, X.; Jia, Y.; Wang, A. Transcriptome analysis of non-heading Chinese cabbage under heat stress by RNA-seq and marker identification. Euphytica 2017, 213, 109. [Google Scholar] [CrossRef]
- Zhang, L.; Xu, B.; Wu, T.; Yang, Y.; Fan, L.; Wen, M.; Sui, J. Transcriptomic profiling of two pak choi varieties with contrasting anthocyanin contents provides an insight into structural and regulatory genes in anthocyanin biosynthetic pathway. BMC Genom. 2017, 18, 288. [Google Scholar] [CrossRef]
- Eom, S.H.; Baek, S.-A.; Kim, J.K.; Hyun, T.K. Transcriptome analysis in Chinese cabbage (Brassica rapa ssp pekinensis) provides the role of glucosinolate metabolism in response to drought stress. Molecules 2018, 23, 1186. [Google Scholar]
- Joo, H.K.; Choi, S.; Lee, Y.R.; Lee, E.O.; Park, M.S.; Park, K.B.; Kim, C.S.; Lim, Y.P.; Park, J.T.; Jeon, B.H. Anthocyanin-rich extract from red Chinese cabbage alleviates vascular inflammation in endothelial cells and Apo E–/–mice. Int. J. Mol. Sci. 2018, 19, 816. [Google Scholar] [CrossRef]
- Ren, J.; Liu, Z.; Niu, R.; Feng, H. Mapping of Re, a gene conferring the red leaf trait in ornamental kale (Brassica oleracea L. var. acephala). Plant Breed. 2015, 134, 494–500. [Google Scholar] [CrossRef]
- Outchkourov, N.; Karlova, R.; Hoelscher, M.; Schrama, X.; Blilou, I.; Jongedijk, E.; Simon, C.D.; van Dijk, A.D.J.; Bosch, D.; Hall, R.D.; et al. Transcription factor-mediated control of anthocyanin biosynthesis in vegetative tissues. Plant Physiol. 2018, 176, 1862–1878. [Google Scholar] [CrossRef]
- Bu, C.; Zhang, Q.; Zeng, J.; Cao, X.; Hao, Z.; Qiao, D.; Cao, Y.; Xu, H. Identification of a novel anthocyanin synthesis pathway in the fungus Aspergillus sydowii H-1. BMC Genom. 2020, 21, 29. [Google Scholar] [CrossRef] [PubMed]
- Cheng, J.; Wei, G.; Zhou, H.; Gu, C.; Vimolmangkang, S.; Liao, L.; Han, Y. Unraveling the mechanism underlying the glycosylation and methylation of anthocyanins in peach. Plant Physiol. 2014, 166, 1044–1058. [Google Scholar] [CrossRef] [PubMed]
- Sasaki, N.; Nishizaki, Y.; Ozeki, Y.; Miyahara, T. The role of acyl-glucose in anthocyanin modifications. Molecules 2014, 19, 18747–18766. [Google Scholar] [CrossRef] [PubMed]
- Hartmann, U.; Sagasser, M.; Mehrtens, F.; Stracke, R.; Weisshaar, B. Differential combinatorial interactions of cis-acting elements recognized by R2R3-MYB, bZIP, and bHLH factors control light-responsive and tissue-specific activation of phenylpropanoid biosynthesis genes. Plant Mol. Biol. 2005, 57, 155–171. [Google Scholar] [CrossRef]
- Yu, M.; Man, Y.; Wang, Y. Light- and temperature-induced expression of an R2R3-MYB gene regulates anthocyanin biosynthesis in red-fleshed kiwifruit. Int. J. Mol. Sci. 2019, 20, 5228. [Google Scholar] [CrossRef]
- Castañeda-Ovando, A.; Pacheco-Hernández, M.L.; Páez-Hernández, E.; Rodríguez, J.A.; Galán-Vidal, C.A. Chemical studies of anthocyanins: A review. Food Chem. 2009, 113, 859–871. [Google Scholar] [CrossRef]
- Park, C.H.; Yeo, H.J.; Kim, N.S.; Eun, P.Y.; Kim, S.-J.; Arasu, M.V.; Al-Dhabi, N.A.; Park, S.Y.; Kim, J.K.; Park, S.U. Metabolic profiling of pale green and purple kohlrabi (Brassica oleracea var. gongylodes). Appl. Biol. Chem. 2017, 60, 249–257. [Google Scholar] [CrossRef]
- Wu, X.; Prior, R.L. Identification and characterization of anthocyanins by High-performance liquid chromatography–electrospray ionization–tandem mass spectrometry in common foods in the United States: Vegetables, nuts, and grains. J. Agric. Food Chem. 2005, 53, 3101–3113. [Google Scholar] [CrossRef]
- Charron, C.S.; Clevidence, B.A.; Britz, S.J.; Novotny, J.A. Effect of dose size on bioavailability of acylated and non-acylated anthocyanins from red cabbage (Brassica oleracea L. var. Capitata). J. Agric. Food Chem. 2007, 55, 5354–5362. [Google Scholar] [CrossRef]
- Park, N.I.; Xu, H.; Li, X.; Jang, I.H.; Park, S.; Ahn, G.H.; Lim, Y.P.; Kim, S.J.; Park, S.U. Anthocyanin accumulation and expression of anthocyanin biosynthetic genes in radish (Raphanus sativus). J. Agric. Food Chem. 2011, 59, 6034–6039. [Google Scholar] [CrossRef]
- Sun, J.; Xiao, Z.; Lin, L.-Z.; Lester, G.E.; Wang, Q.; Harnly, J.M.; Chen, P. Profiling Polyphenols in Five Brassica Species Microgreens by UHPLC-PDA-ESI/HRMSn. J. Agric. Food Chem. 2013, 61, 10960–10970. [Google Scholar] [CrossRef] [PubMed]
- Wu, J.; Liu, W.; Yuan, L.; Guan, W.Q.; Brennan, C.S.; Zhang, Y.Y.; Zhang, J.; Wang, Z.D. The influence of postharvest UV-C treatment on anthocyanin biosynthesis in fresh-cut red cabbage. Sci. Rep. 2017, 7, 5232. [Google Scholar] [CrossRef] [PubMed]
- Goswami, G.; Nath, U.K.; Park, J.-I.; Hossain, M.R.; Biswas, M.K.; Kim, H.T.; Kim, H.R.; Nou, I.S. Transcriptional regulation of anthocyanin biosynthesis in a high-anthocyanin resynthesized Brassica napus cultivar. J. Biol. Res. 2018, 25, 19. [Google Scholar]
- Yuan, Y.; Chiu, L.-W.; Li, L. Transcriptional regulation of anthocyanin biosynthesis in red cabbage. Planta 2009, 230, 1141–1153. [Google Scholar] [CrossRef] [PubMed]
- Solfanelli, C.; Poggi, A.; Loreti, E.; Alpi, A.; Perata, P. Sucrose-specific induction of the anthocyanin biosynthetic path-way in Arabidopsis. Plant Physiol. 2006, 140, 637–646. [Google Scholar] [CrossRef]
- Guo, N.; Han, S.; Zong, M.; Wang, G.; Zheng, S.; Liu, F. Identification and differential expression analysis of anthocyanin biosynthetic genes in leaf color variants of ornamental kale. BMC Genom. 2019, 20, 564. [Google Scholar] [CrossRef]
- Wang, H.; Fan, W.; Li, H.; Yang, J.; Huang, J.; Zhang, P. Functional characterization of dihydroflavonol-4-reductase in anthocyanin biosynthesis of purple sweet potato underlies the direct evidence of anthocyanins function against abiotic stresses. PLoS ONE 2013, 8, e78484. [Google Scholar] [CrossRef]
- Ahmed, N.U.; Park, J.I.; Jung, H.J.; Yang, T.J.; Hur, Y.; Nou, I.S. Characterization of dihydroflavonol 4-reductase (DFR) genes and their association with cold and freezing stress in Brassica Rapa. Gene 2014, 550, 46–55. [Google Scholar] [CrossRef]
- Li, T.; Jia, K.P.; Lian, H.L.; Yang, X.; Li, L.; Yang, H.Q. Jasmonic acid enhancement of anthocyanin accumulation is de-pendent on phytochrome A signaling pathway under far-red light in Arabidopsis. Biochem. Biophys. Res. Commun. 2014, 454, 78–83. [Google Scholar] [CrossRef]
- Tohge, T.; Nishiyama, Y.; Hirai, M.Y.; Yano, M.; Nakajima, J.; Awazuhara, M.; Inoue, E.; Takahashi, H.; Goodenowe, D.B.; Kitayama, M.; et al. Functional genomics by integrated analysis of metabolome and transcriptome of Arabidopsis plants over-expressing an MYB transcription factor. Plant J. 2005, 42, 218–235. [Google Scholar] [CrossRef]
- Luo, J.; Nishiyama, Y.; Fuell, C.; Taguchi, G.; Elliott, K.; Hill, L.; Tanaka, Y.; Kitayama, M.; Yamazaki, M.; Bailey, P.; et al. Convergent evolution in the BAHD family of acyl transferases: Identification and characterization of anthocyanin acyl transferases from Arabidopsis thaliana. Plant J. 2007, 50, 678–695. [Google Scholar]
- D’Auria, J.C.; Reichelt, M.; Luck, K.; Svatos, A.; Gershenzon, J. Identification and characterization of the BAHD acyltransferase malonyl CoA: Anthocyanidin 5-O-glucoside-6’’-O-malonyltransferase (At5MAT) in Arabidopsis. Thaliana. FEBS Lett. 2007, 581, 872–878. [Google Scholar] [CrossRef] [PubMed]
- Sun, Y.; Li, H.; Huang, J.-R. Arabidopsis TT19 functions as a carrier to transport anthocyanin from the cytosol to tonoplasts. Mol. Plant 2012, 5, 387–400. [Google Scholar] [CrossRef] [PubMed]
- Wang, Y.; Tang, Y.; Zhang, M.; Cai, F.; Qin, J.; Wang, Q.; Liu, C.; Wang, G.; Xu, L.; Yang, L.; et al. Molecular cloning and functional characterization of a glutathione S-transferase involved in both anthocyanin and proanthocyanidin accumulation in Camelina sativa (Brassicaceae). Genet. Mol. Res. 2012, 11, 4711–4719. [Google Scholar] [CrossRef]
- Ramsay, N.A.; Glover, B.J. MYB-bHLH-WD40 protein complex and the evolution of cellular diversity. Trends Plant Sci. 2005, 10, 63–70. [Google Scholar] [CrossRef]
- Zhang, B.; Chopra, D.; Schrader, A.; Hülskamp, M. Evolutionary comparison of competitive protein-complex formation of MYB, bHLH, and WDR proteins in plants. J. Exp. Bot. 2019, 70, 3197–3209. [Google Scholar] [CrossRef] [PubMed]
- Kobayashi, S.; Ishimaru, M.; Hiraoka, K.; Honda, C. Myb-related genes of the Kyoho grape (Vitis labruscana) regulate anthocyanin biosynthesis. Planta 2002, 215, 924–933. [Google Scholar]
- Borevitz, J.O.; Xia, Y.J.; Blount, J.; Dixon, R.A.; Lamb, C. Activation tagging identifies a conserved MYB regulator of phenylpropanoid biosynthesis. Plant Cell 2000, 12, 2383–2393. [Google Scholar] [CrossRef]
- Mushtaq, M.A.; Pan, Q.; Chen, D.; Zhang, Q.; Ge, X.; Li, Z. Comparative leaves transcriptome analysis emphasizing on accumulation of anthocyanins in Brassica: Molecular regulation and potential interaction with photosynthesis. Front. Plant Sci. 2016, 7, 311. [Google Scholar] [CrossRef]
- Matsui, K.; Umemura, Y.; Ohme-Takagi, M. AtMYBL2, a protein with a single MYB domain, acts as a negative regulator of anthocyanin biosynthesis in Arabidopsis. Plant J. 2008, 55, 954–967. [Google Scholar] [CrossRef]
- Zhang, X.; Zhang, K.; Wu, J.; Guo, N.; Liang, J.; Wang, X.; Cheng, F. QTL-Seq and sequence assembly rapidly mapped the gene BrMYBL21 for the purple trait in Brassica rapa. Sci. Rep. 2020, 10, 2328. [Google Scholar] [PubMed]
- Cox, M.P.; Peterson, D.A.; Biggs, P.J. SolexaQA: At-a-glance quality assessment of Illumina second-generation sequencing data. BMC Bioinform. 2010, 11, 485. [Google Scholar] [CrossRef] [PubMed]
- Schulz, M.H.; Zerbino, D.R.; Vingron, M.; Birney, E. Oases: Robust denovo RNA-seq assembly across the dynamic range of expression levels. Bioinformatics 2012, 28, 1086–1092. [Google Scholar] [CrossRef] [PubMed]
- Wang, X.; Wang, H.; Wang, J.; Sun, R.; Wu, J.; Liu, S.; Bai, Y.; Mun, J.H.; Bancroft, I.; Cheng, F. The genome of the mesopolyploid crop species Brassica Rapa. Nat. Genet. 2011, 28, 1035–1039. [Google Scholar] [CrossRef]
- Langmead, B.; Salizberg, S.L. Fast gapped-read alignment with Bowtie 2. Nat. Methods 2012, 9, 357–359. [Google Scholar] [CrossRef]
- Anders, S.; Huber, W. Differential expression analysis for sequence count data. Genome Biol. 2010, 11, R106. [Google Scholar] [CrossRef]
- Jin, J.P.; Tian, F.; Yang, D.C.; Meng, Y.Q.; Kong, L.; Luo, J.C.; Gao, G. Plant TFDB 4.0: Toward a central hub for transcription factors and regulatory interactions in plants. Nucleic Acids Res. 2017, 45, D1040–D1045. [Google Scholar] [CrossRef]
- Livak, K.J.; Schmittgen, T.D. Analysis of Relative Gene Expression Data Using Real-Time Quantitative PCR and the 2−ΔΔCT Method. Methods 2001, 25, 402–408. [Google Scholar] [CrossRef]
- Ashburner, M.; Ball, C.A.; Blake, J.A.; Botstein, D.; Butler, H.; Cherry, J.M.; Davis, A.P.; Dolinski, K.; Dwight, S.S.; Eppig, J.T.; et al. Gene ontology: Tool for the unification of biology. The gene ontology consortium. Nat. Genet. 2000, 25, 25–29. [Google Scholar] [CrossRef]
- Xie, C.; Mao, X.; Huang, J.; Ding, Y.; Wu, J.; Dong, S.; Kong, L.; Gao, G.; Li, C.Y.; Wei, L. KOBAS 2.0: A web server for annotation and identification of enriched pathways and diseases. Nucleic Acids Res. 2011, 39, W316–W322. [Google Scholar] [CrossRef]
- Higo, K.; Ugawa, Y.; Iwamoto, M.; Korenaga, T. Plant cis-acting regulatory DNA elements (PLACE) database: 1999. Nucleic Acids Res. 1999, 27, 297–300. [Google Scholar] [CrossRef] [PubMed]
- Szklarczyk, D.; Morris, J.H.; Cook, H.; Kuhn, M.; Wyder, S.; Simonovic, M.; Santos, A.; Doncheva, N.T.; Roth, A.; Bork, P.; et al. The STRING database in 2017: Quality-controlled protein-protein association networks, made broadly accessible. Nucleic Acids Res. 2017, 45, D362–D368. [Google Scholar] [CrossRef]
- Kim, M.-S.; Hong, S.; Devaraj, S.P.; Im, S.; Kim, J.-R.; Lim, Y.P. Identification and characterization of the leaf specific networks of inner and rosette leaves in Brassica rapa. Biochem. Biophys. Res. Commun. 2017, 490, 821–826. [Google Scholar] [CrossRef] [PubMed]
- Wong, D.C.J.; Gutierrez, R.L.; Gambetta, G.A.; Castellarin, S.D. Genome-wide analysis of cis-regulatory element structure and discovery of motif-driven gene co-expression networks in grapevine. DNA Res. 2017, 24, 311–326. [Google Scholar] [CrossRef] [PubMed]
- Chakravarthy, S.; Tuori, R.P.; Dascenzo, M.D.; Fobert, P.R.; Despres, C.; Martin, G.B. The tomato transcription factor Pti4 regulates defence-related gene expression via GCC box and non-GCC box cis-elements. Plant Cell 2003, 15, 3033–3050. [Google Scholar] [CrossRef]
- Abe, H.; Urao, T.; Ito, T.; Seki, M.; Shinozaki, K.; Shinozaki, K.-Y. Arabidopsis AtMYC2 (bHLH) and AtMYB2 (MYB) function as transcriptional activators in abscisic acid signaling. Plant Cell 2003, 15, 63–78. [Google Scholar] [CrossRef]
- Abe, H.; Shinozaki, K.-Y.; Urao, T.; Iwasaki, T.; Hosokawa, D.; Shinozaki, K. Role of Arabidopsis MYC and MYB homologs in drought- and abscisic acid-regulated gene expression. Plant Cell 1997, 9, 1859–1868. [Google Scholar]
- Planchais, S.; Perennes, C.; Glab, N.; Mironov, V.; Inze, D.; Bergounioux, C. Characterization of cis-acting element involved in cell cycle phase-independent activation of Arath; CycB1;1 transcription and identification of putative regulatory proteins. Plant Mol. Biol. 2002, 50, 111–127. [Google Scholar] [CrossRef]
- Gubler, F.; Kalla, R.; Roberts, J.K.; Jacobsen, J.V. Gibberellin-regulated expression of a myb gene in barley aleurone cells: Evidence for Myb transactivation of a high-pl alpha-amylase gene promoter. Plant Cell 1995, 7, 1879–1891. [Google Scholar] [CrossRef]
- Tamagnone, L.; Merida, A.; Parr, A.; Mackay, S.; Culianez-Macia, F.A.; Roberts, K.; Martin, C. (1998). The AmMYB308 and AmMYB330 transcription factors from Antirrhinum regulate phenylpropanoid and lignin biosynthesis in transgenic tobacco. Plant Cell 1998, 10, 135–154. [Google Scholar] [CrossRef]
- Baranowskij, N.; Frohberg, C.; Prat, S.; Willmitzer, L. A novel DNA binding protein with homology to Myb oncoproteins containing only one repeat can function as a transcriptional activator. Embo J. 1994, 13, 5383–5392. [Google Scholar] [CrossRef] [PubMed]
- Yamamoto, S.; Nakano, T.; Suzuki, K.; Shinshi, H. Elicitor-induced activation of transcription via W box-related cis-acting elements from a basic chitinase gene by WRKY transcription factors in tobacco. Biochem. Biophys. Acta 2004, 1679, 279–287. [Google Scholar] [CrossRef] [PubMed]
- Toyofuku, K.; Umemura, T.; Yamaguchi, J. Promoter elements required for sugar-repression of the RAmy3D gene for alpha-amylase in rice. FEBS Lett. 1998, 428, 275–280. [Google Scholar] [CrossRef]
- Izawa, T.; Foster, R.; Nakajima, M.; Shimamoto, K.; Chua, N.-H. The rice bZIP transcriptional activator RITA-1 is highly expressed during seed development. Plant Cell 1994, 6, 1277–1287. [Google Scholar]
- Brown, R.L.; Kazan, K.; McGrath, K.C.; Maclean, D.J.; Manners, J.M. A role for the GCC-box in jasmonate-mediated activation of the PDF1.2 gene of Arabidopsis. Plant Physiol. 2003, 132, 1020–1032. [Google Scholar] [CrossRef]


| No. of Pigments | Trivial Names | RPCC_IL | RPCC_OL | GCC_IL | GCC_OL |
|---|---|---|---|---|---|
| 1 | Cyanidin 3-diglucoside-5-glucoside | 0.26 ± 0.00 | 0.04 ± 0.05 | ND | ND |
| 2 | Cyanidin 3-diglucoside-5-(malonyl)glucoside | 1.74 ± 0.23 | 0.29 ± 0.23 | ND | ND |
| 3 | Cyanidin 3-(feruloyl)diglucoside-5-glucoside | 0.19 ± 0.01 | 0.00 ± 0.00 | ND | ND |
| 4 | Cyanidin 3-(caffeoyl)diglucoside-5-(malonyl)glucoside | 1.93 ± 0.23 | 0.26 ± 0.19 | ND | ND |
| 5 | Cyanidin 3-(p-coumaroyl)diglucoside-5-glucoside | 0.34 ± 0.03 | 0.13 ± 0.09 | ND | ND |
| 6 | Cyanidin 3-(feruloyl)diglucoside-5-glucoside | 0.76 ± 0.09 | 0.08 ± 0.06 | ND | ND |
| 7 | Pelargonidin 3-(caffeoyl)diglucoside-5-(malonoyl)glucoside | 5.66 ± 0.60 | 0.81 ± 0.58 | ND | ND |
| 8 | Cyanidin 3-(feruloyl)diglucoside-5-(malonoyl)glucoside | 12.63 ± 1.37 | 2.19 ± 1.60 | ND | ND |
| 9 | Cyanidin 3-(feruloyl)(feruloyl)diglucoside-5-glucoside | 1.25 ± 0.09 | 0.19 ± 0.14 | ND | ND |
| 10 | Cyanidin 3-O-(sinapoyl)(feruloyl)diglucoside-5-O-glucoside | 0.41 ± 0.06 | 0.16 ± 0.12 | ND | ND |
| 11 | Cyanidin 3-O-(p-coumaroyl)(sinapoyl)diglucoside-5-O-(malonyl)glucoside | 1.92 ± 0.12 | 0.61 ± 0.45 | ND | ND |
| 12 | Cyanidin 3-O-(sinapoyl)(feruloyl)diglucoside-5-O-(malonyl)glucoside | 3.55 ± 0.26 | 1.24 ± 0.92 | ND | ND |
| 13 | Cyanidin 3-O-(p-coumaroyl)(sinapoyl)diglucoside-5-O-(malonyl)glucoside | 1.68 ± 0.12 | 0.77 ± 0.61 | ND | ND |
| Total | 32.31 ± 2.84 | 10.17 ± 1.69 | ND | ND |
| Reddish Purple Chinese Cabbage (RPCC) | Green Chinese Cabbage (GCC) | |
|---|---|---|
| Total Reads | 48,179,516 | 53,127,646 |
| Total Bases | 4866,131,116 | 5365,892,246 |
| Total Bases(Gb) | 4.87 Gb | 5.37 Gb |
| GC_ Count | 2320,659,939 | 2532,951,037 |
| N_ Zero Reads | 48,028,490 | 52,961,958 |
| N5_ Less Reads | 48,091,492 | 53,032,280 |
| N_ Rate | 0.03% | 0.03% |
| Q20_More Bases | 4699,696,370 | 5195,093,244 |
| Q30_ More Bases | 4579,319,019 | 5069,583,507 |
| Clean reads | 34,924,846 | 38,611,432 |
| Clean bases | 3073,838,581 | 3400,979,929 |
| BRAD ID | E-Value | Identity | TAIR Description | Log2 Fold Change | |||
|---|---|---|---|---|---|---|---|
| A. thaliana Id | TF Family | Gene Annotation | Gene Description | RPCC vs. GCC | |||
| AP2/ERF Transcription Factors | |||||||
| Bra011782 | 0 | 100 | AT4G37750 | AP2 | ANT, CKC, CKC1, DRG | Integrase-type DNA-binding superfamily protein | 2.21 |
| Bra017656 | 0 | 99.88 | AT4G34410 | ERF | RRTF1 | Redox responsive transcription factor 1 | 6.90 |
| Bra011529 | 0 | 99.75 | AT4G34410 | ERF | RRTF1 | Redox responsive transcription factor 1 | 6.72 |
| Bra019087 | 0 | 100 | AT2G20350 | ERF | − | Integrase-type DNA-binding superfamily protein | 6.50 |
| Bra034624 | 0 | 99.8 | AT4G34410 | ERF | RRTF1 | Redox responsive transcription factor 1 | 6.16 |
| Bra028290 | 0 | 100 | AT5G51990 | ERF | CBF4, DREB1D | C-repeat-binding factor 4 | 5.94 |
| Bra019777 | 0 | 98.04 | AT1G12610 | ERF | DDF1 | Integrase-type DNA-binding superfamily protein | 5.06 |
| Bra037630 | 0 | 96.93 | AT2G44840 | ERF | ATERF13, EREBP, ERF13 | Ethylene-responsive element binding factor 13 | 5.00 |
| Bra015882 | 0 | 94.68 | AT1G74930 | ERF | ORA47 | Integrase-type DNA-binding superfamily protein | 4.96 |
| Bra027612 | 0 | 100 | AT1G63030 | ERF | DDF2 | Integrase-type DNA-binding superfamily protein | 4.88 |
| Bra016763 | 0 | 100 | AT1G12610 | ERF | DDF1 | Integrase-type DNA-binding superfamily protein | 4.84 |
| Bra024539 | 0 | 99.48 | AT1G22810 | ERF | − | Integrase-type DNA-binding superfamily protein | 4.79 |
| Bra026963 | 0 | 98.87 | AT1G12610 | ERF | DDF1 | Integrase-type DNA-binding superfamily protein | 4.72 |
| Bra031069 | 0 | 100 | AT1G19210 | ERF | − | Integrase-type DNA-binding superfamily protein | 4.64 |
| Bra028759 | 0 | 94.66 | AT5G05410 | ERF | DREB2,DREB2A | DRE-binding protein 2A | 4.58 |
| Bra015660 | 0 | 100 | AT1G77640 | ERF | − | Integrase-type DNA-binding superfamily protein | 4.04 |
| Bra028291 | 0 | 100 | AT5G52020 | ERF | − | Integrase-type DNA-binding superfamily protein | 3.98 |
| Bra016400 | 0 | 100 | AT1G21910 | ERF | − | Integrase-type DNA-binding superfamily protein | 3.95 |
| Bra032901 | 0 | 100 | AT1G28370 | ERF | ATERF11,ERF11 | ERF domain protein 11 | 3.66 |
| Bra014925 | 0 | 100 | AT3G23230 | ERF | − | Integrase-type DNA-binding superfamily protein | 3.64 |
| Bra027614 | 0 | 85 | AT1G12630 | ERF | − | Integrase-type DNA-binding superfamily protein | 3.62 |
| Bra002377 | 0 | 100 | AT5G21960 | ERF | − | Integrase-type DNA-binding superfamily protein | 3.62 |
| Bra010881 | 0 | 99.46 | AT1G28360 | ERF | ATERF12,ERF12 | ERF domain protein 12 | 3.57 |
| Bra016136 | 0 | 100 | AT1G71450 | ERF | − | Integrase-type DNA-binding superfamily protein | 3.36 |
| Bra003780 | 0 | 100 | AT1G74930 | ERF | ORA47 | Integrase-type DNA-binding superfamily protein | 3.29 |
| Bra036022 | 0 | 99.44 | AT1G21910 | ERF | − | Integrase-type DNA-binding superfamily protein | 3.28 |
| Bra016518 | 3.00E−162 | 95.32 | AT1G19210 | ERF | − | Integrase-type DNA-binding superfamily protein | 3.23 |
| Bra029147 | 0 | 100 | AT5G52020 | ERF | − | Integrase-type DNA-binding superfamily protein | 3.21 |
| Bra024953 | 0 | 100 | AT5G47230 | ERF | ATERF-5, ATERF5, ERF5 | Ethylene responsive element binding factor 5 | 3.14 |
| Bra040309 | 0 | 99.15 | AT1G44830 | ERF | − | Integrase-type DNA-binding superfamily protein | 3.14 |
| Bra032665 | 0 | 100 | AT2G44840 | ERF | ATERF13, EREBP, ERF13 | Ethylene-responsive element binding factor 13 | 3.00 |
| Bra030957 | 0 | 99.3 | AT1G53170 | ERF | ATERF-8, ATERF8, ERF8 | Ethylene response factor 8 | 2.99 |
| Bra010880 | 0 | 98.27 | AT1G28370 | ERF | ATERF11, ERF11 | ERF domain protein 11 | 2.91 |
| Bra011383 | 0 | 98.7 | AT4G32800 | ERF | − | Integrase-type DNA-binding superfamily protein | 2.91 |
| Bra015478 | 1.00E−10 | 74.84 | AT2G44840 | ERF | ATERF13, EREBP, ERF13 | Ethylene-responsive element binding factor 13 | 2.86 |
| Bra021048 | 0 | 97.12 | AT4G17500 | ERF | ATERF-1, ERF-1 | Ethylene responsive element binding factor 1 | 2.63 |
| Bra024954 | 0 | 99.54 | AT5G47220 | ERF | ATERF-2, ATERF2, ERF2 | Ethylene responsive element binding factor 2 | 2.61 |
| Bra008952 | 0 | 98.76 | AT5G11590 | ERF | TINY2 | Integrase-type DNA-binding superfamily protein | 2.53 |
| Bra035732 | 0 | 97.33 | AT5G51190 | ERF | − | Integrase-type DNA-binding superfamily protein | 2.51 |
| Bra040158 | 0 | 100 | AT4G17490 | ERF | ATERF6, ERF-6-6, ERF6 | Ethylene responsive element binding factor 6 | 2.48 |
| Bra017493 | 0 | 98.76 | AT5G47230 | ERF | ATERF-5, ATERF5, ERF5 | Ethylene responsive element binding factor 5 | 2.33 |
| Bra040159 | 0 | 100 | AT4G17500 | ERF | ATERF-1,ERF-1 | Ethylene responsive element binding factor 1 | 2.22 |
| Bra034535 | 0 | 100 | AT4G32800 | ERF | − | Integrase-type DNA-binding superfamily protein | 2.11 |
| Bra027736 | 0 | 97.6 | AT1G64380 | ERF | − | Integrase-type DNA-binding superfamily protein | 2.00 |
| bHLH transcription factors | |||||||
| Bra033690 | 0 | 100 | AT5G43650 | bHLH | BHLH92 | Basic helix-loop-helix (bHLH) DNA-binding superfamily protein | 4.69 |
| Bra027501 | 0 | 100 | AT5G43650 | bHLH | BHLH92 | Basic helix-loop-helix (bHLH) DNA-binding superfamily protein | 2.68 |
| Bra035639 | 0 | 97.42 | AT5G56960 | bHLH | − | Basic helix-loop-helix (bHLH) DNA-binding family protein | 2.21 |
| Bra036640 | 0 | 100 | AT1G62975 | bHLH | − | Basic helix-loop-helix (bHLH) DNA-binding superfamily protein | 2.20 |
| bZIP transcription factors | |||||||
| Bra010035 | 0 | 94.65 | AT5G49450 | bZIP | AtbZIP1,bZIP1 | Basic leucine-zipper 1 | 3.10 |
| C2H2 transcription factors | |||||||
| Bra006692 | 1.00E−160 | 88.04 | AT5G59820 | C2H2 | RHL41, ZAT12 | C2H2-type zinc finger family protein | 4.46 |
| Bra002528 | 0 | 98.96 | AT5G59820 | C2H2 | RHL41, ZAT12 | C2H2-type zinc finger family protein | 3.43 |
| Bra022436 | 0 | 97.64 | AT3G19580 | C2H2 | AZF2, ZF2 | Zinc-finger protein 2 | 2.99 |
| Bra010922 | 0 | 99.57 | AT1G27730 | C2H2 | STZ, ZAT10 | Salt tolerance zinc finger | 2.96 |
| Bra001752 | 0 | 99.87 | AT3G19580 | C2H2 | AZF2, ZF2 | Zinc-finger protein 2 | 2.96 |
| Bra032845 | 0 | 100 | AT1G27730 | C2H2 | STZ, ZAT10 | Salt tolerance zinc finger | 2.81 |
| Bra038219 | 0 | 98.11 | AT3G19580 | C2H2 | AZF2, ZF2 | Zinc-finger protein 2 | 2.50 |
| C3H transcription factors | |||||||
| Bra000170 | 1.00E−156 | 100 | AT2G40140 | C3H | ATSZF2, CZF1, SZF2, ZFAR1 | Zinc finger (CCCH-type) family protein | 2.77 |
| Bra007205 | 0 | 98.79 | AT3G55980 | C3H | ATSZF1, SZF1 | Salt-inducible zinc finger 1 | 2.41 |
| Bra004982 | 4.00E−135 | 81.1 | AT2G40140 | C3H | ATSZF2, CZF1, SZF2, ZFAR1 | Zinc finger (CCCH-type) family protein | 2.16 |
| Dof transcription factors | |||||||
| Bra014297 | 0 | 98.01 | AT1G51700 | Dof | ADOF1, DOF1 | DOF zinc finger protein 1 | 2.18 |
| GRAS transcription factors | |||||||
| Bra021063 | 0 | 99.75 | AT4G17230 | GRAS | SCL13 | SCARECROW-like 13 | 2.06 |
| Bra033813 | 0 | 91.33 | AT3G46600 | GRAS | − | GRAS family transcription factor | 2.02 |
| HD-ZIP transcription factors | |||||||
| Bra005259 | 0 | 100 | AT2G36610 | HD-ZIP | ATHB22, HB22 | Homeobox protein 22 | 3.85 |
| Bra016300 | 0 | 100 | AT1G26960 | HD-ZIP | AtHB23, HB23 | Homeobox protein 23 | 2.02 |
| LBD transcription factors | |||||||
| Bra021433 | 5.00E-124 | 83.53 | AT3G02550 | LBD | LBD41 | LOB domain-containing protein 41 | 2.90 |
| MADS transcription factors | |||||||
| Bra017376 | 0 | 99.84 | AT2G03710 | MIKC_ MADS | AGL3,SEP4 | K-box region and MADS-box transcription factor family protein | 2.33 |
| Bra024521 | 0 | 99.59 | AT1G22590 | M-type_ MADS | AGL87 | AGAMOUS-like 87 | 2.10 |
| Bra005166 | 0 | 100 | AT2G28700 | M-type_ MADS | AGL46 | AGAMOUS-like 46 | 2.05 |
| MYB transcription factors | |||||||
| Bra004162 | 2.00E−111 | 84.01 | AT1G66390 | MYB | ATMYB90, MYB90, PAP2 | MYB domain protein 90 | 11.38 |
| Bra039763 | 0 | 92.86 | AT1G56650 | MYB | ATMYB75, MYB75, PAP1, SIAA1 | Production of anthocyanin pigment 1 | 6.87 |
| Bra029990 | 0 | 100 | AT3G50060 | MYB | MYB77 | MYB domain protein 77 | 3.89 |
| Bra012910 | 0 | 100 | AT3G50060 | MYB | MYB77 | MYB domain protein 77 | 2.82 |
| Bra013000 | 9.00E−118 | 100 | AT5G60890 | MYB | ATMYB34, ATR1, MYB34 | MYB domain protein 34 | 2.51 |
| Bra016164 | 0 | 100 | AT1G71030 | MYB_ related | ATMYBL2, MYBL2 | MYB-like 2 | 5.55 |
| Bra007957 | 0 | 97.7 | AT1G71030 | MYB_ related | ATMYBL2, MYBL2 | MYB-like 2 | 4.06 |
| Bra022637 | 5.00E−79 | 89.91 | AT5G53200 | MYB_ related | TRY | Homeodomain-like superfamily protein | 2.34 |
| NAC transcription factors | |||||||
| Bra008553 | 0 | 94.59 | AT4G01550 | NAC | anac069, NAC069 | NAC domain containing protein 69 | 4.31 |
| Bra020188 | 0 | 99.8 | AT5G22380 | NAC | anac090, NAC090 | NAC domain containing protein 90 | 3.14 |
| Bra006624 | 0 | 99.58 | AT5G22380 | NAC | anac090, NAC090 | NAC domain containing protein 90 | 2.86 |
| Bra027238 | 0 | 100 | AT3G15500 | NAC | ANAC055,ATNAC3,NAC055, NAC3 | NAC domain containing protein 3 | 2.62 |
| Bra037283 | 0 | 99.52 | AT2G17040 | NAC | anac036, NAC036 | NAC domain containing protein 36 | 2.17 |
| Bra013034 | 0 | 98.94 | AT2G17040 | NAC | anac036, NAC036 | NAC domain containing protein 36 | 2.08 |
| WRKY transcription factors | |||||||
| Bra023112 | 0 | 99.53 | AT2G37260 | WRKY | ATWRKY44, DSL1,TTG2, WRKY44 | WRKY family transcription factor family protein | 5.13 |
| Bra014426 | 0 | 99.88 | AT2G46400 | WRKY | ATWRKY46, WRKY46 | WRKY DNA-binding protein 46 | 3.87 |
| Bra003588 | 0 | 99.5 | AT1G80840 | WRKY | ATWRKY40, WRKY40 | WRKY DNA-binding protein 40 | 3.81 |
| Bra035148 | 0 | 100 | AT1G80840 | WRKY | ATWRKY40, WRKY40 | WRKY DNA-binding protein 40 | 3.69 |
| Bra005210 | 0 | 100 | AT2G37260 | WRKY | ATWRKY44, DSL1,TTG2, WRKY44 | WRKY family transcription factor family protein | 3.54 |
| Bra035147 | 0 | 99.52 | AT1G80850 | WRKY | − | DNA glycosylase superfamily protein | 3.53 |
| Bra033158 | 0 | 98.49 | AT4G11070 | WRKY | AtWRKY41, WRKY41 | WRKY family transcription factor | 2.95 |
| Bra020196 | 0 | 90.34 | AT5G22570 | WRKY | ATWRKY38, WRKY38 | WRKY DNA-binding protein 38 | 2.87 |
| Bra010032 | 0 | 99.58 | AT5G49520 | WRKY | ATWRKY48, WRKY48 | WRKY DNA-binding protein 48 | 2.86 |
| Bra019265 | 0 | 100 | AT4G23810 | WRKY | ATWRKY53, WRKY53 | WRKY family transcription factor | 2.65 |
| Bra013731 | 0 | 99.57 | AT4G23800 | WRKY | − | HMG (high mobility group) box protein | 2.41 |
| Bra023998 | 0 | 100 | AT4G31550 | WRKY | WRKY11 | WRKY DNA-binding protein 11 | 2.27 |
| Bra031900 | 0 | 98.34 | AT5G64810 | WRKY | WRKY51 | WRKY DNA-binding protein 51 | 2.13 |
| Given I.D | BRAD Id | Gene Position V 1.5 | A. thaliana Id | Gene Annotation | |||||
|---|---|---|---|---|---|---|---|---|---|
| B. rapa Id | Identity | E-Value | Chromosome | Start | End | Strand | |||
| Phenylpropanoid pathway genes | |||||||||
| BrPAL1 | Bra017210 | 98.94 | 0 | A04 | 16132008 | 16134574 | - | AT2G37040 | PAL1 |
| BrPAL2 | Bra003126 | 98.68 | 0 | A07 | 14754085 | 14756786 | - | AT3G53260 | PAL2 |
| BrPAL4 | Bra029831 | 100 | 0 | A05 | 22819640 | 22826303 | - | AT3G10340 | PAL4 |
| BrC4H | Bra021637 | 97.23 | 0 | A04 | 13688684 | 13690602 | - | AT2G30490 | C4H |
| Br4CL2 | Bra031266 | 100 | 0 | A05 | 17255035 | 17257878 | + | AT3G21240 | 4CL2,AT4CL2 |
| Early anthocyanin biosynthesis genes | |||||||||
| BrCHS | Bra006224 | 99.5 | 0 | A03 | 2596137 | 2597594 | + | AT5G13930 | CHS,TT4 |
| BrCHI | Bra007142 | 99.47 | 0 | A09 | 29055564 | 29057157 | - | AT3G55120 | CHI,TT5 |
| BrCHI1 | Bra009101 | 100 | 0 | A10 | 15229294 | 15230280 | - | AT5G05270 | CHI1 |
| BrF3H | Bra036828 | 99.91 | 0 | A09 | 27095567 | 27097080 | + | AT3G51240 | F3H,TT6 |
| BrF3′H-1 | Bra009312 | 100 | 0 | A10 | 14356094 | 14358845 | - | AT5G07990 | F3′H,TT7 |
| BrF3′H-2 | Bra020459 | 90.02 | 0 | A02 | 5846392 | 5848174 | - | AT5G57220 | F3′H,TT7 |
| BrF3′H-3 | Bra019366 | 99.68 | 0 | A03 | 24701345 | 24702922 | + | AT4G22690 | F3′H,TT7 |
| BrF3′H-4 | Bra030246 | 100 | 0 | A04 | 10022729 | 10024935 | + | AT2G22330 | F3′H,TT7 |
| BrF3′H-5 | Bra011280 | 94.06 | 0 | A01 | 2958371 | 2960458 | - | AT1G13080 | F3′H,TT7 |
| Late anthocyanin biosynthesis genes | |||||||||
| BrDFR | Bra027457 | 100 | 0 | A09 | 10926334 | 10927890 | - | AT5G42800 | DFR,M318,TT3 |
| BrLDOX | Bra013652 | 98.48 | 0 | A01 | 6885692 | 6887113 | - | AT4G22880 | LDOX |
| BrUF3GT | Bra003021 | 99.81 | 0 | A10 | 6063162 | 6064651 | - | AT5G54060 | UF3GT |
| BrUGT75C1-1 | Bra038445 | 100 | 0 | A08 | 8755970 | 8757334 | - | AT4G14090 | UGT75C1 |
| BrUGT75C1-2 | Bra039545 | 100 | 0 | A01 | 11553894 | 11555345 | + | AT4G15490 | UGT75C1 |
| BrUGT73B2 | Bra034610 | 100 | 0 | A08 | 11760868 | 11762581 | + | AT4G34138 | UGT73B2 |
| BrUGT78D2 | Bra023594 | - | - | A02 | 3087246 | 3088800 | - | AT5G17050 | UGT78D2 |
| Br5MAT | Bra036208 | 98.82 | 0 | A09 | 1925788 | 1927140 | - | AT3G29590 | 5MAT |
| BrAT-1 | Bra030550 | 98.52 | 0 | A08 | 20600205 | 20602987 | + | AT1G03940 | Acyl-transferase family protein-1 |
| BrAT-2 | Bra034255 | 100 | 0 | A04 | 11806054 | 11806788 | - | AT3G29680 | Acyl-transferase family protein |
| Anthocyanin transporter genes | |||||||||
| BrMATE2-1 | Bra031776 | 88.51 | 0 | A09 | 36544120 | 36546929 | + | AT1G11670 | TT12 |
| BrMATE-2 | Bra027073 | 99.8 | 0 | A09 | 8642073 | 8645111 | + | AT1G61890 | TT12 |
| BrTT19-1 | Bra008570 | 100 | 0 | A10 | 11677671 | 11678470 | - | AT5G17220 | GST26,TT19 |
| BrTT19-2 | Bra023602 | 99.69 | 0 | A02 | 3117740 | 3118547 | + | AT5G17220 | TT19 |
| Other anthocyanin biosynthesis genes | |||||||||
| BrOMT1-2 | Bra011292 | 99.13 | 0 | A01 | 2896202 | 2897686 | - | AT1G77520 | OMT1 |
| BrCCR2 | Bra008438 | 100 | 0 | A02 | 14649009 | 14650738 | - | AT1G80820 | CCR2 |
| BrRNS1-1 | Bra026570 | 99.86 | 0 | A02 | 20391492 | 20392500 | + | AT2G02990 | RNS1 |
| BrCCoAMT | Bra033968 | 100 | 0 | A02 | 9548647 | 9549923 | + | AT1G67980 | CCoAMT |
| BrFLS3 | Bra029212 | 99.68 | 0 | A02 | 25974752 | 25976735 | - | AT5G63590 | ATFLS3,FLS3 |
| BrLAC17 | Bra006683 | 90.74 | 0 | A03 | 4611941 | 4613968 | - | AT5G60020 | LAC17 |
| BrOxygenase protein | Bra012691 | 100 | 0 | A03 | 22738914 | 22741827 | - | AT4G16770 | oxygenase superfamily protein |
| BrSCPL10-2 | Bra025601 | 98.52 | 0 | A04 | 7905792 | 7908695 | - | AT2G22980 | SCPL10 |
| BrBGLU10 | Bra037647 | 100 | 0 | A04 | 18448229 | 18455545 | + | AT3G60120 | BGLU10 |
| BrFLS1 | Bra022378 | 100 | 0 | A05 | 18803675 | 18805312 | + | AT3G19010 | FLS1 |
| BrIRX12 | Bra005140 | 99.73 | 0 | A05 | 3679277 | 3682262 | - | AT2G38080 | IRX12 |
| BrBGLU46-1 | Bra018969 | 99.24 | 0 | A06 | 976174 | 979392 | - | AT1G52400 | BGLU46 |
| BrOST2 | Bra024452 | 96.24 | 9.00E−83 | A06 | 16477147 | 16483736 | - | AT2G18960 | AHA1,HA1,OST2,PMA |
| BrSCPL10-1 | Bra012153 | 88.53 | 0 | A07 | 11924527 | 11938309 | + | AT2G23000 | SCPL10 |
| BrOMT1-1 | Bra012269 | 98.11 | 0 | A07 | 11175574 | 11176865 | + | AT1G21100 | OMT1 |
| BrOMT | Bra003707 | 100 | 3.00E−43 | A07 | 17900548 | 17902240 | + | AT1G76790 | O-methyltransferase family protein |
| BrCAD1-2 | Bra010819 | 99.59 | 0 | A08 | 15846126 | 15848906 | + | AT1G29690 | CAD1 |
| BrCAD1-3 | Bra010879 | 99.78 | 0 | A08 | 16130363 | 16132914 | - | AT1G28380 | CAD1 |
| BrCCoAOMT1 | Bra034600 | 100 | 0 | A08 | 11803933 | 11805048 | - | AT4G34050 | CCoAOMT1 |
| BrCAD1-1 | Bra026804 | 100 | 0 | A09 | 35535138 | 35538610 | - | AT1G14780 | CAD1 |
| BrRNS1-2 | Bra026846 | 100 | 0 | A09 | 35723513 | 35724548 | + | AT1G14220 | RNS1 |
| BrCCR5 | Bra008743 | 100 | 0 | A10 | 12472468 | 12475087 | + | AT5G14700 | CCR5 |
| BrBGLU46-2 | Bra002978 | 98.56 | 0 | A10 | 6383388 | 6385871 | - | AT5G54570 | BGLU46 |
| BrOMT1-3 | Bra003009 | 100 | 0 | A10 | 6154442 | 6160001 | + | AT5G54160 | ATOMT1,OMT1 |
| Regulatory transcription factors | |||||||||
| BrMYBR1 | Bra012149 | 100 | 0 | A07 | 11952841 | 11953731 | - | AT5G67300 | MYBR1 |
| BrMYBL2-1 | Bra016164 | 100 | 0 | A07 | 22386380 | 22387236 | - | AT1G71030 | MYB-like 2 |
| BrMYB15 | Bra001907 | 99.77 | 0 | A03 | 19315200 | 19316380 | + | AT3G23250 | MYB15 |
| BrMYB51 | Bra025666 | 97.36 | 0 | A06 | 6841688 | 6842966 | + | AT1G18570 | MYB51 |
| BrMYB51 | Bra016553 | 100 | 0 | A08 | 18248352 | 18249890 | - | AT1G18570 | MYB51 |
| BrMYB75 | Bra039763 | 92.86 | 0 | A02 | 8839008 | 8840737 | + | AT1G56650 | PAP1,MYB75 |
| BrMYB77 | Bra012910 | 100 | 0 | A03 | 21598456 | 21599337 | - | AT3G50060 | MYB77 |
| BrMYB90 | Bra004162 | 84.01 | 2.00E−111 | A07 | 20426416 | 20431671 | + | AT1G66390 | MYB90 |
© 2020 by the authors. Licensee MDPI, Basel, Switzerland. This article is an open access article distributed under the terms and conditions of the Creative Commons Attribution (CC BY) license (http://creativecommons.org/licenses/by/4.0/).
Share and Cite
Rameneni, J.J.; Choi, S.R.; Chhapekar, S.S.; Kim, M.-S.; Singh, S.; Yi, S.Y.; Oh, S.H.; Kim, H.; Lee, C.Y.; Oh, M.-H.; et al. Red Chinese Cabbage Transcriptome Analysis Reveals Structural Genes and Multiple Transcription Factors Regulating Reddish Purple Color. Int. J. Mol. Sci. 2020, 21, 2901. https://doi.org/10.3390/ijms21082901
Rameneni JJ, Choi SR, Chhapekar SS, Kim M-S, Singh S, Yi SY, Oh SH, Kim H, Lee CY, Oh M-H, et al. Red Chinese Cabbage Transcriptome Analysis Reveals Structural Genes and Multiple Transcription Factors Regulating Reddish Purple Color. International Journal of Molecular Sciences. 2020; 21(8):2901. https://doi.org/10.3390/ijms21082901
Chicago/Turabian StyleRameneni, Jana Jeevan, Su Ryun Choi, Sushil Satish Chhapekar, Man-Sun Kim, Sonam Singh, So Young Yi, Sang Heon Oh, Hyuna Kim, Chang Yeol Lee, Man-Ho Oh, and et al. 2020. "Red Chinese Cabbage Transcriptome Analysis Reveals Structural Genes and Multiple Transcription Factors Regulating Reddish Purple Color" International Journal of Molecular Sciences 21, no. 8: 2901. https://doi.org/10.3390/ijms21082901
APA StyleRameneni, J. J., Choi, S. R., Chhapekar, S. S., Kim, M.-S., Singh, S., Yi, S. Y., Oh, S. H., Kim, H., Lee, C. Y., Oh, M.-H., Lee, J., Kwon, O. H., Park, S. U., Kim, S.-J., & Lim, Y. P. (2020). Red Chinese Cabbage Transcriptome Analysis Reveals Structural Genes and Multiple Transcription Factors Regulating Reddish Purple Color. International Journal of Molecular Sciences, 21(8), 2901. https://doi.org/10.3390/ijms21082901