1. Introduction
Paternally expressed gene 10 (
PEG10) is an imprinted gene located on the human chromosome 7q21 and is known to have evolved from a retroviral element, although it has lost the ability to replicate independently [
1]. This domesticated retroviral remnant has been shown to be essential for embryonic development in mice; previous studies demonstrated that mutations in the coding sequence of the gene are lethal in the embryonic stage because of defects in placental development [
2]. Additionally, upregulated
PEG10 expression has been observed in malignancies such as hepatocellular carcinoma [
3,
4,
5,
6], embryonic kidney Wilms’ tumor [
7], lung cancer [
8], breast cancer [
9], and pancreatic cancer [
10,
11]. Although endogenous expression of
PEG10 had previously been detected using antibodies in the human liver cancer cell line HepG2 and human embryonic kidney cells (HEK), more sensitive methods revealed that other cell lines, such as breast tumor and large-cell lung carcinoma cells, also express
PEG10 [
12]. The mRNA of
PEG10 encodes at least two protein isoforms: the major PEG10 protein product reading frame 1 (RF1
PEG10) and reading frames 1 and 2 (RF1/RF2
PEG10), which are translated by a typical retroviral-1 ribosomal frameshift mechanism [
13,
14,
15,
16]. RF1
PEG10 encodes a Gag-like protein, and RF1/RF2
PEG10 encodes a Gag-Pol-like polyprotein that is characteristic to retroviruses and retroelements. Additionally, RF1
PEG10 has a conserved major homology domain and a CCHC-type Zn-finger motif in its structure (Cys-X
2-Cys-X
4-His-X
4-Cys). Shortly following the -1 ribosomal frameshift site, RF2
PEG10 contains a consensus -Asp-Ser-Gly- sequence motif (
Figure 1) that is characteristic of retroviral aspartic proteases; this domain is followed by a truncated reverse transcriptase domain [
17].
While the anti-apoptotic role of RF1
PEG10 was previously investigated [
18,
19,
20], the role of RF2
PEG10 has not yet been elucidated. The predicted post-translational modifications of RF2
PEG10, such as phosphorylation and dephosphorylation, may be essential for the regulation of PEG10 function [
15]. Considering its importance, the −1 translational frameshift mechanism of RF1/RF2
PEG10 has been thoroughly investigated. Lux et al. [
12] cloned the entire RF1/RF2
PEG10 sequence into an eukaryotic expression vector. RF1/RF2
PEG10 was then expressed in transfected COS-1 cells, and the cell lysate was analyzed by Western blot. Three protein bands were identified that corresponded to the full length of RF1/RF2
PEG10, as well as RF1
PEG10 and a shorter N-terminal fragment (PEG10-cleaved N-terminus fragment), which was considered to be most likely a cleavage product of an aspartic protease [
12]. Analysis of the proteolytic activity of PEG10 protease (PR
PEG10) was previously attempted using an active-site mutant, where the conserved aspartate was mutated to alanine, thereby impairing its catalytic activity [
15]. Even though the authors verified the proteolytic activity of PR
PEG10, it is unclear whether this proteolytic activity is required for the function of PEG10, or whether PR
PEG10 has simply persisted as an evolutionary remnant. We assumed that the PEG10 is involved in the regulation of cell proliferation and has anti-apoptotic effects due to the protease (PR) activity of RF2
PEG10. Based on this hypothesis, and if proven correct, PR
PEG10 may be effectively targeted for chemotherapeutic purposes.
In this study, we focused on the aspartic protease domain of RF1/RF2
PEG10, a part of RF2
PEG10. Although PR
PEG10 is believed to mediate polyprotein processing in a similar manner to other retroviral PRs [
15], neither the biochemical characteristics of this protease nor its functional importance have been established to date. Therefore, we aimed to investigate the activity of PR
PEG10 and study its involvement in the function of PEG10. The activity of PR
PEG10 was proven by investigating autoproteolysis of wild-type and active site mutant RF1/RF2
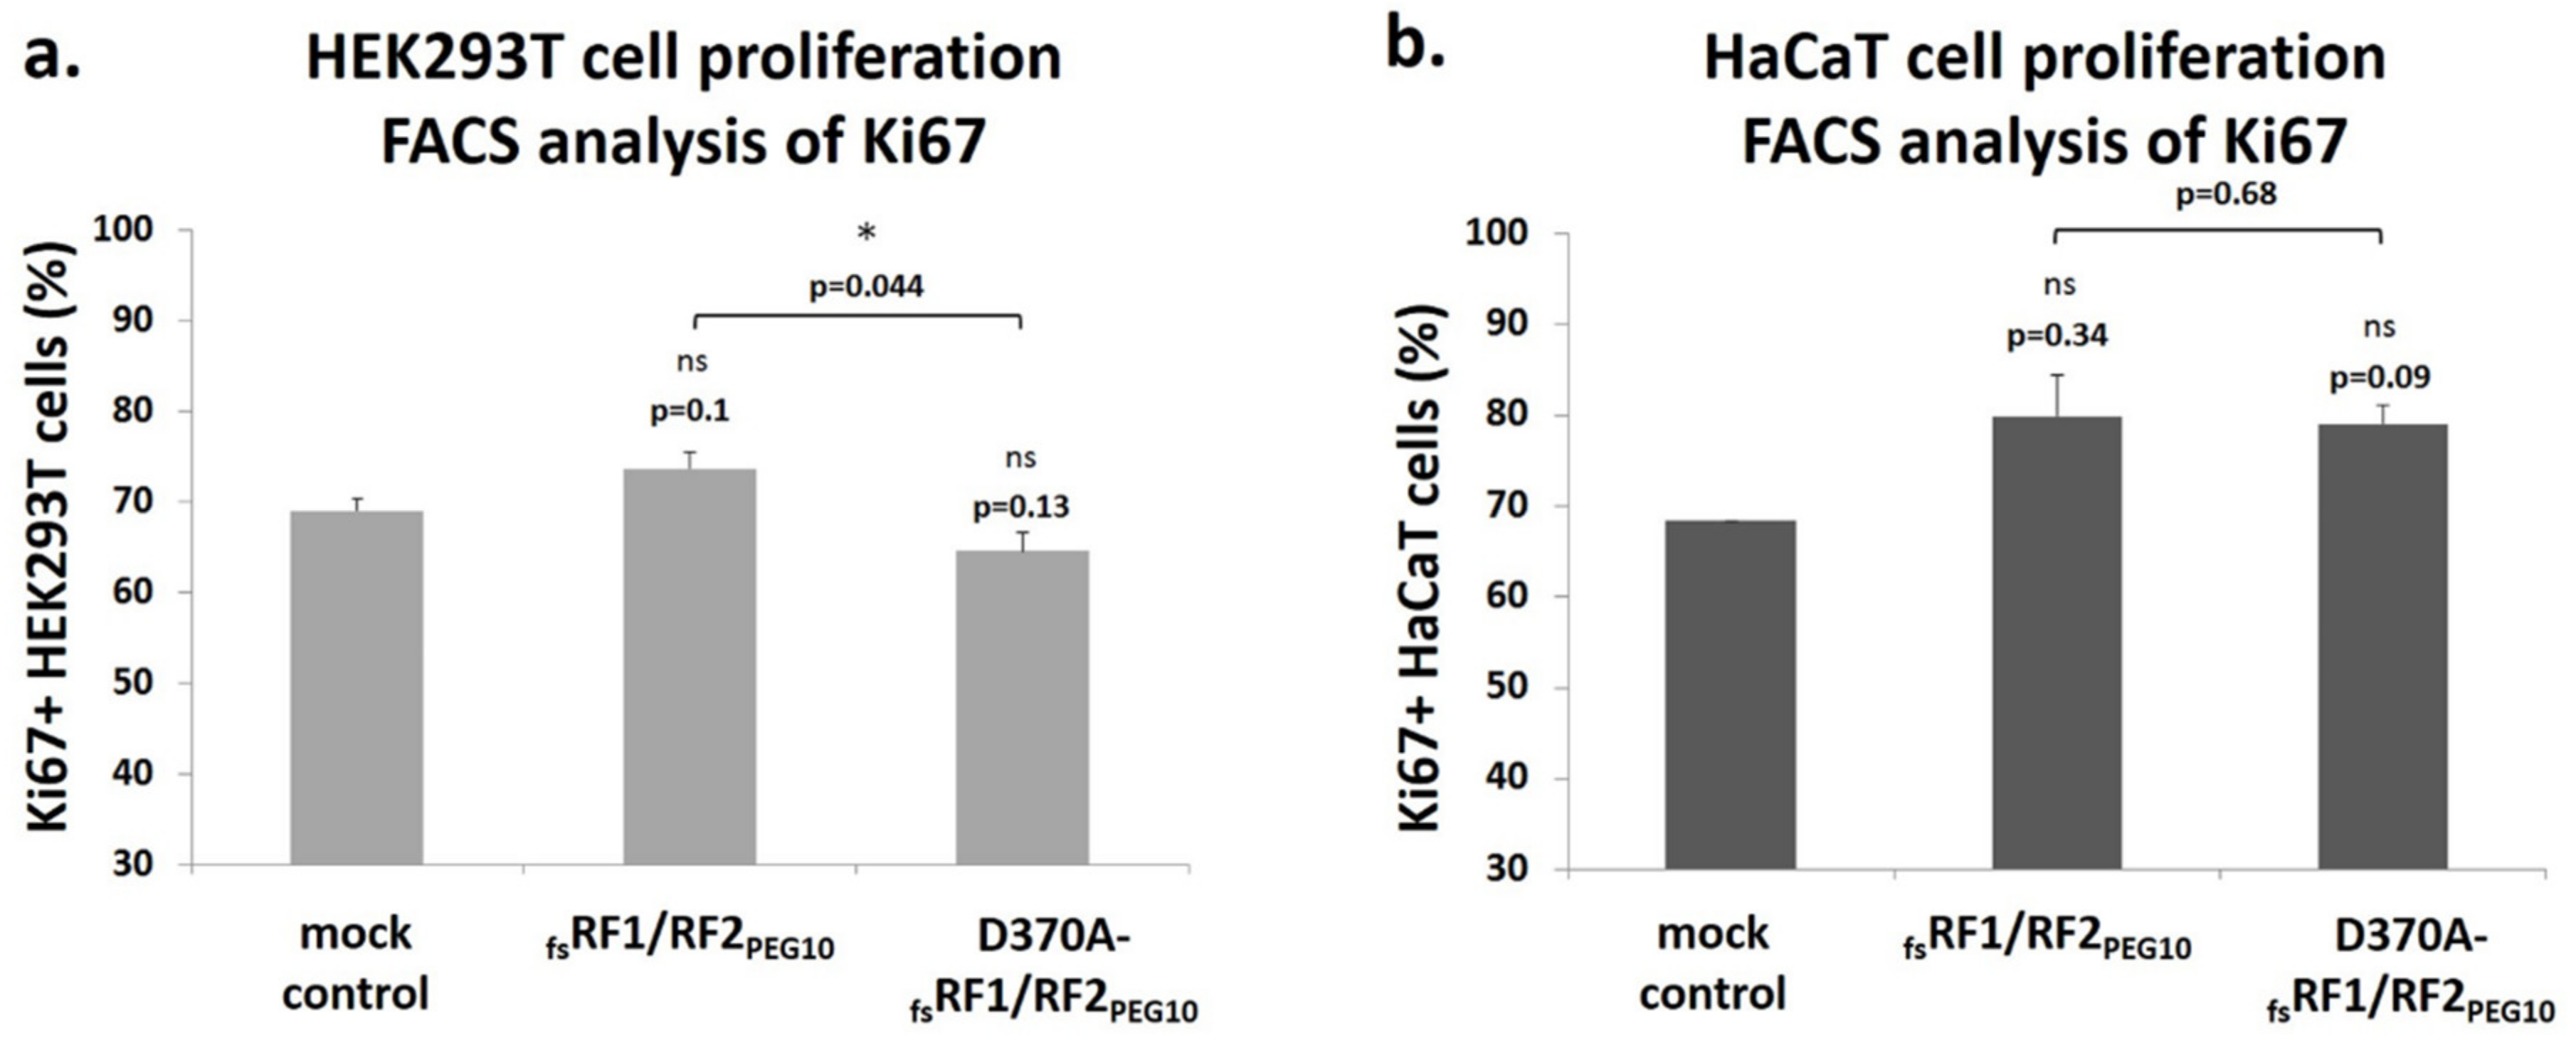
PEG10 proteins in the lysates of transfected HEK293T cells. Furthermore, functional studies were performed in order to investigate whether overexpression of frameshift mutant
fsRF1/RF2
PEG10 affects the proliferation and viability of transfected human embryonic kidney 293T (HEK293T) and human keratinocyte HaCaT cells.
3. Discussion
In this study, we investigated the structural and biochemical characteristics of the aspartic protease domain encoded by the human retrotransposon-derived gene PEG10.
The three-dimensional structure of PR
PEG10 has not been solved experimentally to date; therefore, in silico prediction algorithms were applied to estimate structural characteristics of the protease structure. Based on the results of secondary structure prediction and homology modeling, PR
PEG10 shares its overall fold with those of retroviral PRs (
Figure 2). PR
PEG10 was found to show the highest sequence and structural similarity with DNA-damage-inducible 2 (Ddi2) and Ddi1 PRs [
22,
27,
28]; each of these retroviral-like PRs contains an additional helical insert and has a six-stranded dimer interface organization, which was not found to be characteristic of retroviral PRs [
29]. In addition, the D-S-G-A active site motif of human PR
PEG10 is also identical to that of human Ddi1 and Ddi2 PRs, but this consensus motif is followed by a Ser residue (D-S-G-A-S) in PR
PEG10 (
Figure 1). Ser in this position is not characteristic of retroviral or Ddi1/Ddi2 PRs [
29] but can be found in the Ty1 retrotransposon PR [
30]. The D-T/S-G-A active site motif of most retroviral PRs is followed by an Asp residue, but in contrast with this Asp residue, a Ser in this position does not enable salt-bridge formation between PR
PEG10 subunits. In the sequence motif of the consensus helix, retroviral PRs (excepting spumaretrovirus PRs) contain the G-R-N motif, but similarly to Ddi1 and Ddi2 proteins, PR
PEG10 also contains a different sequence (G-V-R) in this helix, and thus lacks the corresponding interactions that are provided by the Arg residue of the G-R-N motif [
29]. Structural analysis of retroviral and Ddi1 and Ddi2 PRs revealed correlation between the dimer interface organization and the intermonomeric contacts [
29]. No data are available for in vitro dimer stability of PR
PEG10, but high structural similarity implies that its dimer stability may be comparable with those of Ddi1/Ddi2 PRs and may be lower than that of HIV-1 PR.
To investigate the biochemical characteristics of PR
PEG10 in vitro, we expressed different forms of PEG10 in HEK293T mammalian cell line (
Figure 4a), and detected these in total cell lysates by Western blot analysis (
Figure 4b). We observed two proteolytic fragments (PF1: ~ 45 kDa and PF2: ~ 37kDa); the ~37 kDa product was previously found to contain the intact N-terminus of the protein and is part of RF1 [
15]. Proteolytic fragments did not appear when
PEG10 harboring an active-site mutation of PR
PEG10 was expressed (
Figure 5). As observed in the case of HIV-1 PR, D25A mutation resulted in complete inactivation of the enzyme, whereas the T26A mutant showed only residual proteolytic activity. While the mutant HIV-1 PR was virtually monomeric, traces of active dimers were believed to be formed upon interaction with the substrate [
23]. In accordance with this, our results imply that PR
PEG10 has the ability to dimerize; this ability was abolished by the S371A mutation. Results of our in vitro experiments are in good agreement with the predicted structure and prove the essential role of the S371 residue in the dimerization of PR
PEG10, which depends on “fireman’s grip” interactions, similar to HIV-1 PR.
Previous studies on PEG10′s protease activity implied multiple cleavages within human and mouse PEG10, but the cleavage pattern varied among different cell lines and tissues [
12,
15,
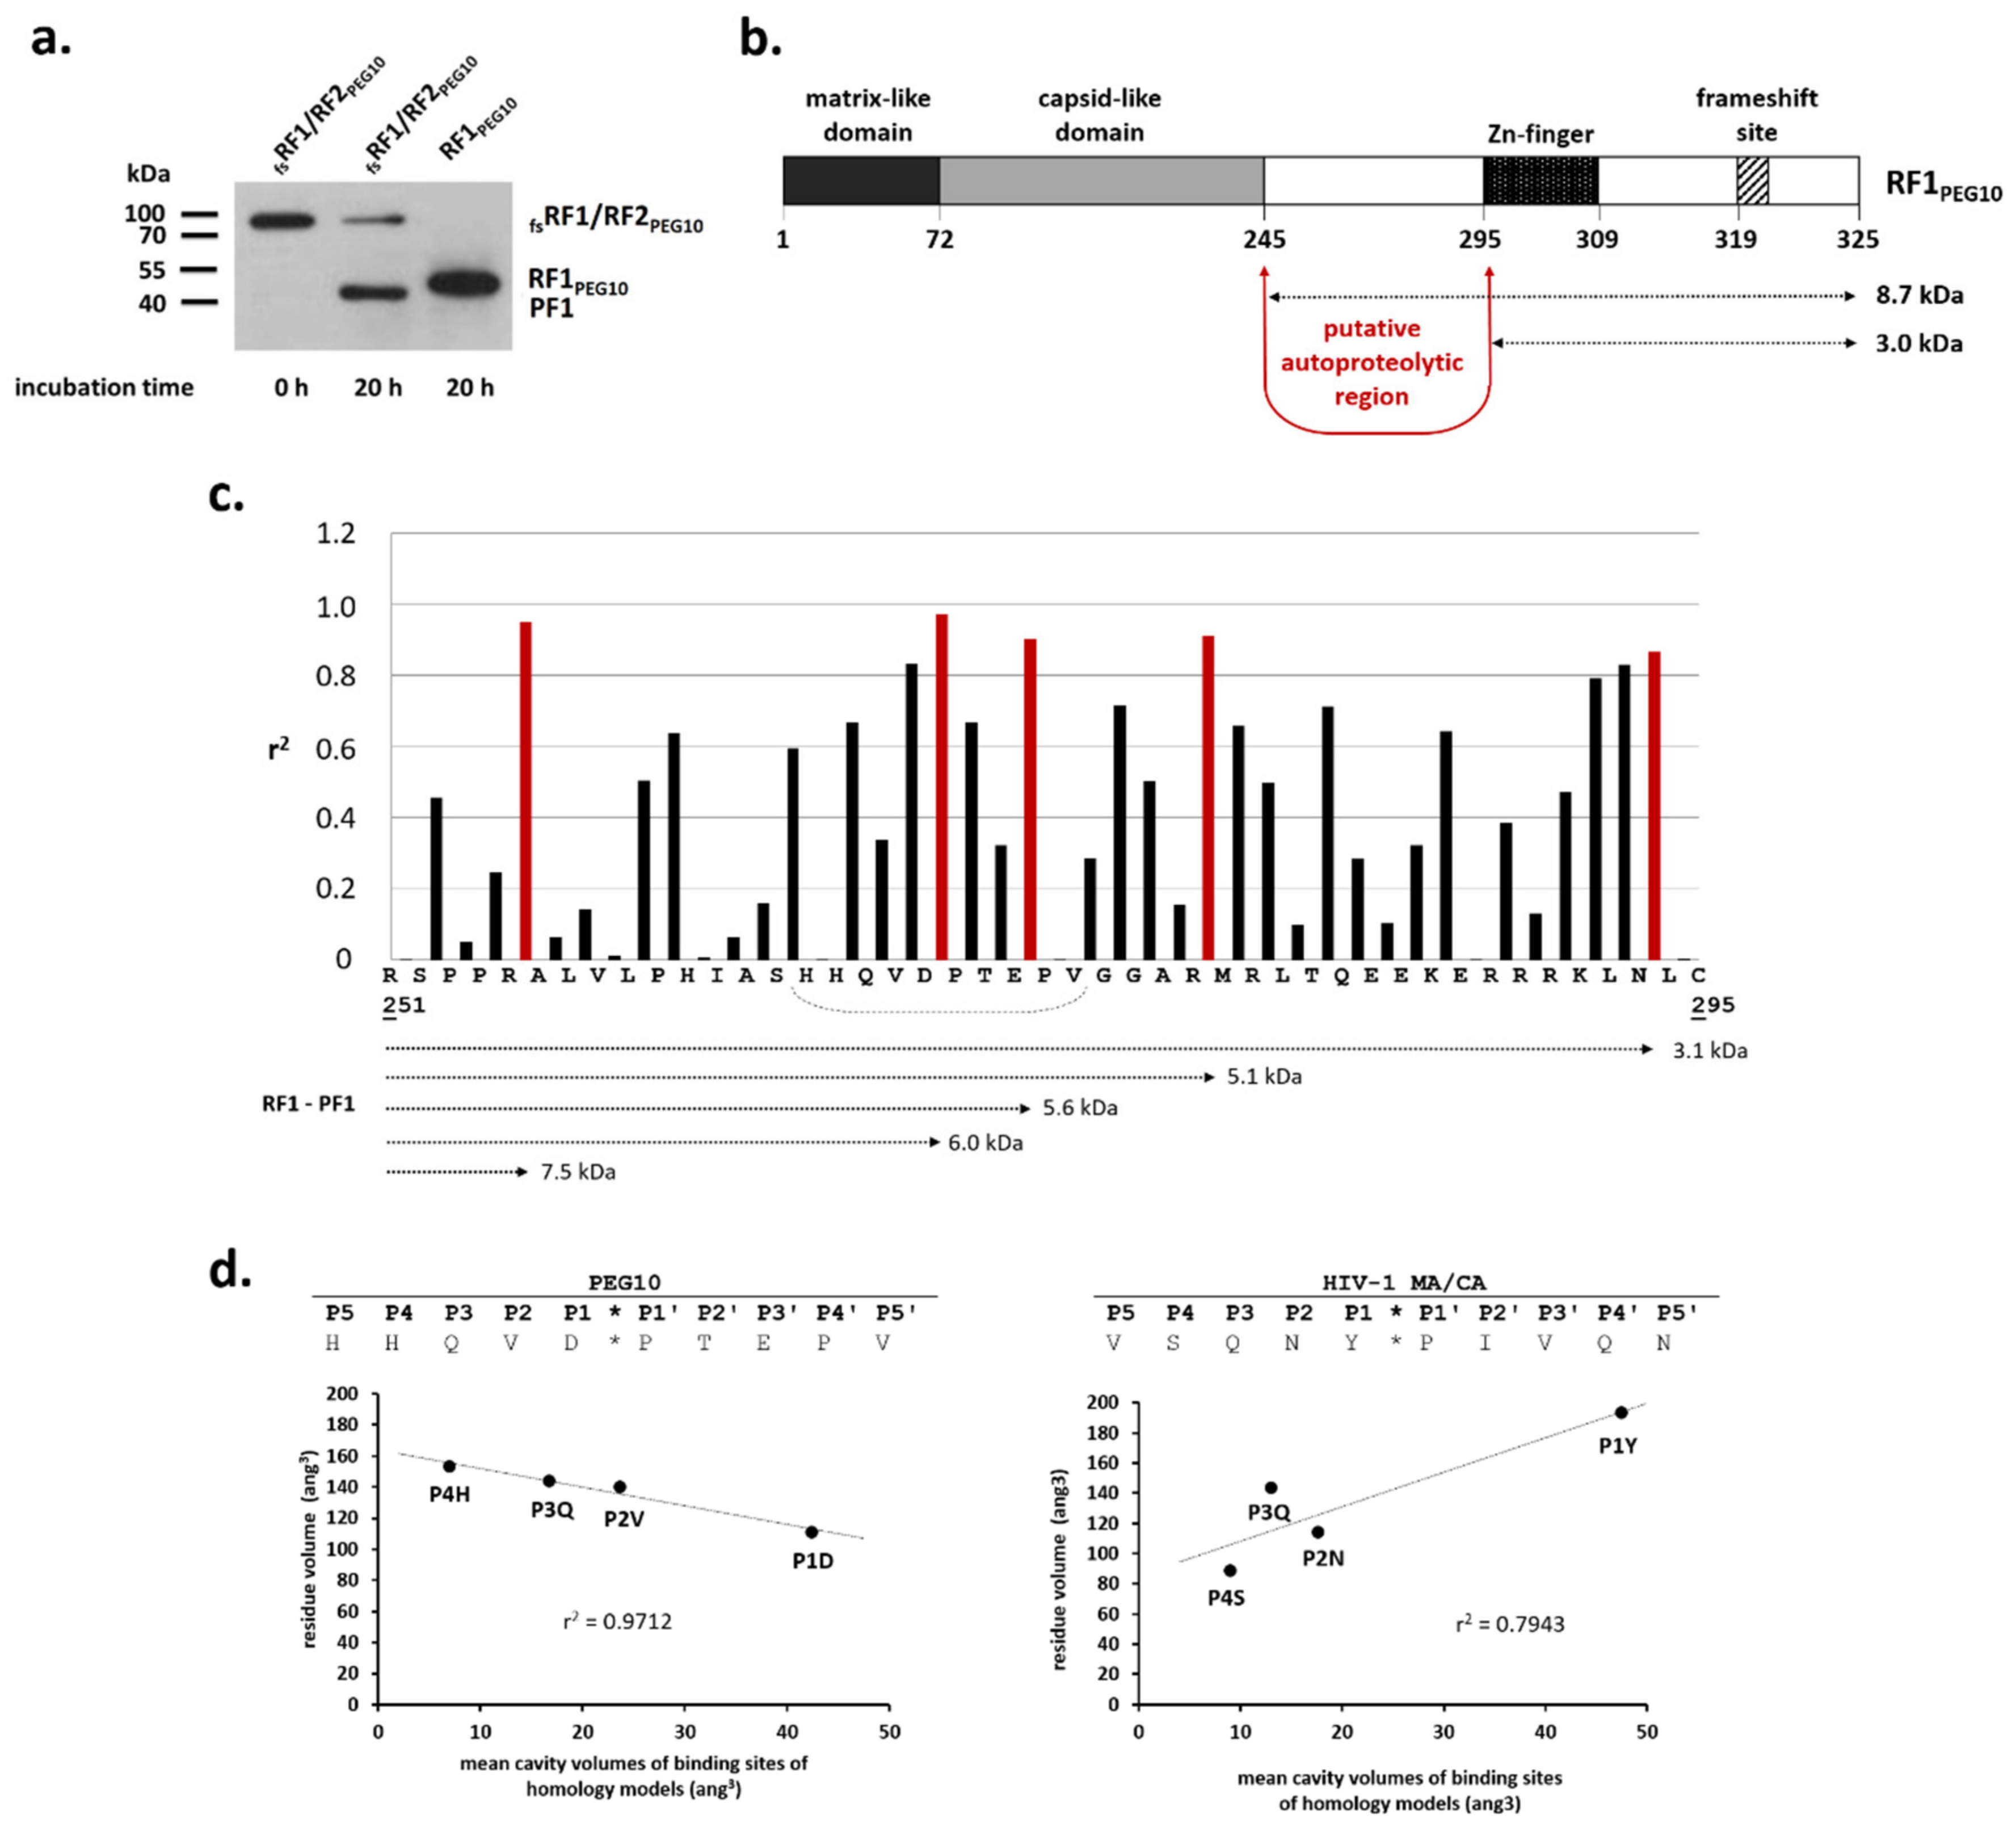
31]. We only observed a single cleavage product (PF1) when anti-PEG10 antibody was used for the detection of proteolytic fragments in HEK293T cells. The molecular weight of PF1 was estimated based on Western blot images and indicated that autoproteolysis may occur prior to the frameshift site, between the capsid-like domain and the Zn-finger motif. The compositions and cavity volumes of the substrate binding sites were determined based on the homology model structure (
Figure 3), and the results of in vitro and in silico experiments were used to estimate a potential cleavage position. The highest probability was predicted for the HHQVD*PTEPV cleavage site (
Figure 6), which does not resemble most cleavage site sequences of retroviral PRs. Although the presence of an aspartate residue in the P1 position is not characteristic of retroviral PR cleavage sites, it is not unique. For example, the naturally occurring nucleocapsid–protease cleavage site of Walley epidermal hyperplasia virus (WDSV) PR contains a P1-Asp residue (TYPAD*PIDC) [
26], and bovine leukemia virus (BLV) PR was also found to efficiently cleave a peptide representing a P1-substituted analogue of the HTLV-1 capsid–nucleocapsid cleavage-site (KTKVD*VVQPK) [
32]. Structural analysis of BLV and human T-cell leukemia virus type I (HTLV-1) PRs revealed that both enzymes have mainly hydrophobic S1 binding cavities, which consist of identical residues [
25]. In contrast, the P1-Asp-substituted substrate was cleaved efficiently by BLV protease, but not by HTLV-1 PR [
25]. This shows that estimation of cleavage positions based purely on the volumes of cleavage site residues and substrate binding cavities should only be considered approximate.
The applied small-scale eukaryotic expression system was found to be not suitable enough to produce the protein in sufficient amounts for cleavage site identification; thus,
fsRF1/RF2
PEG10 was expressed in a bacterial expression system. Similar to other retroviral-like proteases—especially recombinant human Ddi2 [
27] and
S. cerevisiae Ddi1 [
28] PRs—we also failed to detect the proteolytic activity of the bacterially expressed purified protein. As has already been proposed for Ddi1 and Ddi2 PRs [
27,
28], putative-specific factors or determinants may be necessary for the activation of the protease, which would probably not be present in the sample after protein purification. Therefore, identification of the autoproteolytic cleavage positions of PEG10 remains to be identified.
Our data imply low catalytic efficiency of PR
PEG10, but detailed comparison cannot be made due to the limited data on the catalytic efficiencies of retroviral-like proteases. To date, the proteolytic activity of a recombinant protein was proven in vitro only for
Leishmania major Ddi1 [
33] and
Saccharomyces cerevisiae Ty1 retroviral-like proteases [
30], while catalytic efficiency was determined only for the latter one. The structural characteristics of PR
PEG10 indicate high similarity with other retroviral-like proteases; thus, the dimer stability of PR
PEG10 is potentially lower than that of most retroviral proteases [
31], and is more comparable to that of retroviral-like proteases. For example, Ty1 PR was found to possess trans activity and has very low specific activity as compared to retroviral proteases (e.g., HIV-1, HTLV-1, BLV, and MMLV) [
30]. Due to the limited data, future studies need to reveal whether all human retroviral-like proteases (including PEG10, Ddi1, and Ddi2) have lower specific activity than retroviral proteases.
Activity was not detected when a recombinant protein containing putative autoproteolytic sites was used as the substrate; the lack of trans activity indicated a self-inactivation mechanism for PR
PEG10. The suspected self-inactivation mechanism has already been observed for alphavirus capsid PRs [
34]. In these viruses, the nascent structural polyprotein contains an intramolecular (chymotrypsin-like) serine protease that possesses cis activity. As part of polyprotein maturation, self-cleavage occurs, leading to the release of the capsid. This autoproteolytic event is a perquisite for capsid assembly and results in PR inactivation. After self-cleavage, the conserved P1 residue of the cleavage site blocks the trans activity by interacting with the catalytic center [
34]. Self-inactivation has also been described for the capsid protease of the Aura virus, Chikungunya virus [
35], Sindbis virus [
36], and Semliki Forest virus [
37], but has not been previously reported in the case of retroviral or retroviral-like PRs. A possible mechanism for blocking trans activity may be caused by a crystal structure of the Ddi1 of
Saccharomyces cerevisiae [
28]. In this structure, the N-terminal region of the homodimeric PR interacts with the active site of the adjacent asymmetric unit as a pseudo-substrate. Although this was considered to be caused by a crystallization artefact, this reveals a possible mode of substrate engagement [
28]. We assume that this binding mode may represent a possible mode of inactivation. In this case, the autoproteolytic fragments may interact with the active site of PR
PEG10, blocking the trans activity. However, future studies are needed to explore whether inter- or intramolecular events are involved in the self-inactivation mechanism.
We detected a difference between the calculated (73 kDa) and observed (~95 kDa) molecular weights of the overexpressed
fsRF1/RF2
PEG10 protein (
Figure 4,
Figure 5,
Figure 6,
Figure 7,
Figure 8,
Figure 9 and
Figure 10), which implies post-translational protein modification [
12,
15]. The difference in the molecular weight is attributed to ubiquitination of RF1/RF2
PEG10, which is supported by the fact that ubiquitination of PEG10 has already been indicated based on its interaction with the E3 ubiquitin-protein ligase SIAH1 protein [
4]. Furthermore, quantitative proteomic analyses have reported this post-translational modification [
38,
39,
40,
41]. Ubiquitination sites of PEG10 are listed in the PhosphoSite database (
http://www.phosphosite.org); our in silico predictions also indicated the presences of putative ubiquitination sites with high confidence (
Table S1). Taking into consideration the above-mentioned findings, we assume that the differences in molecular weights of PF1 and PF2 may also be explained by ubiquitination; however, this requires further validation using co-immunoprecipitation techniques in future experiments.
PR
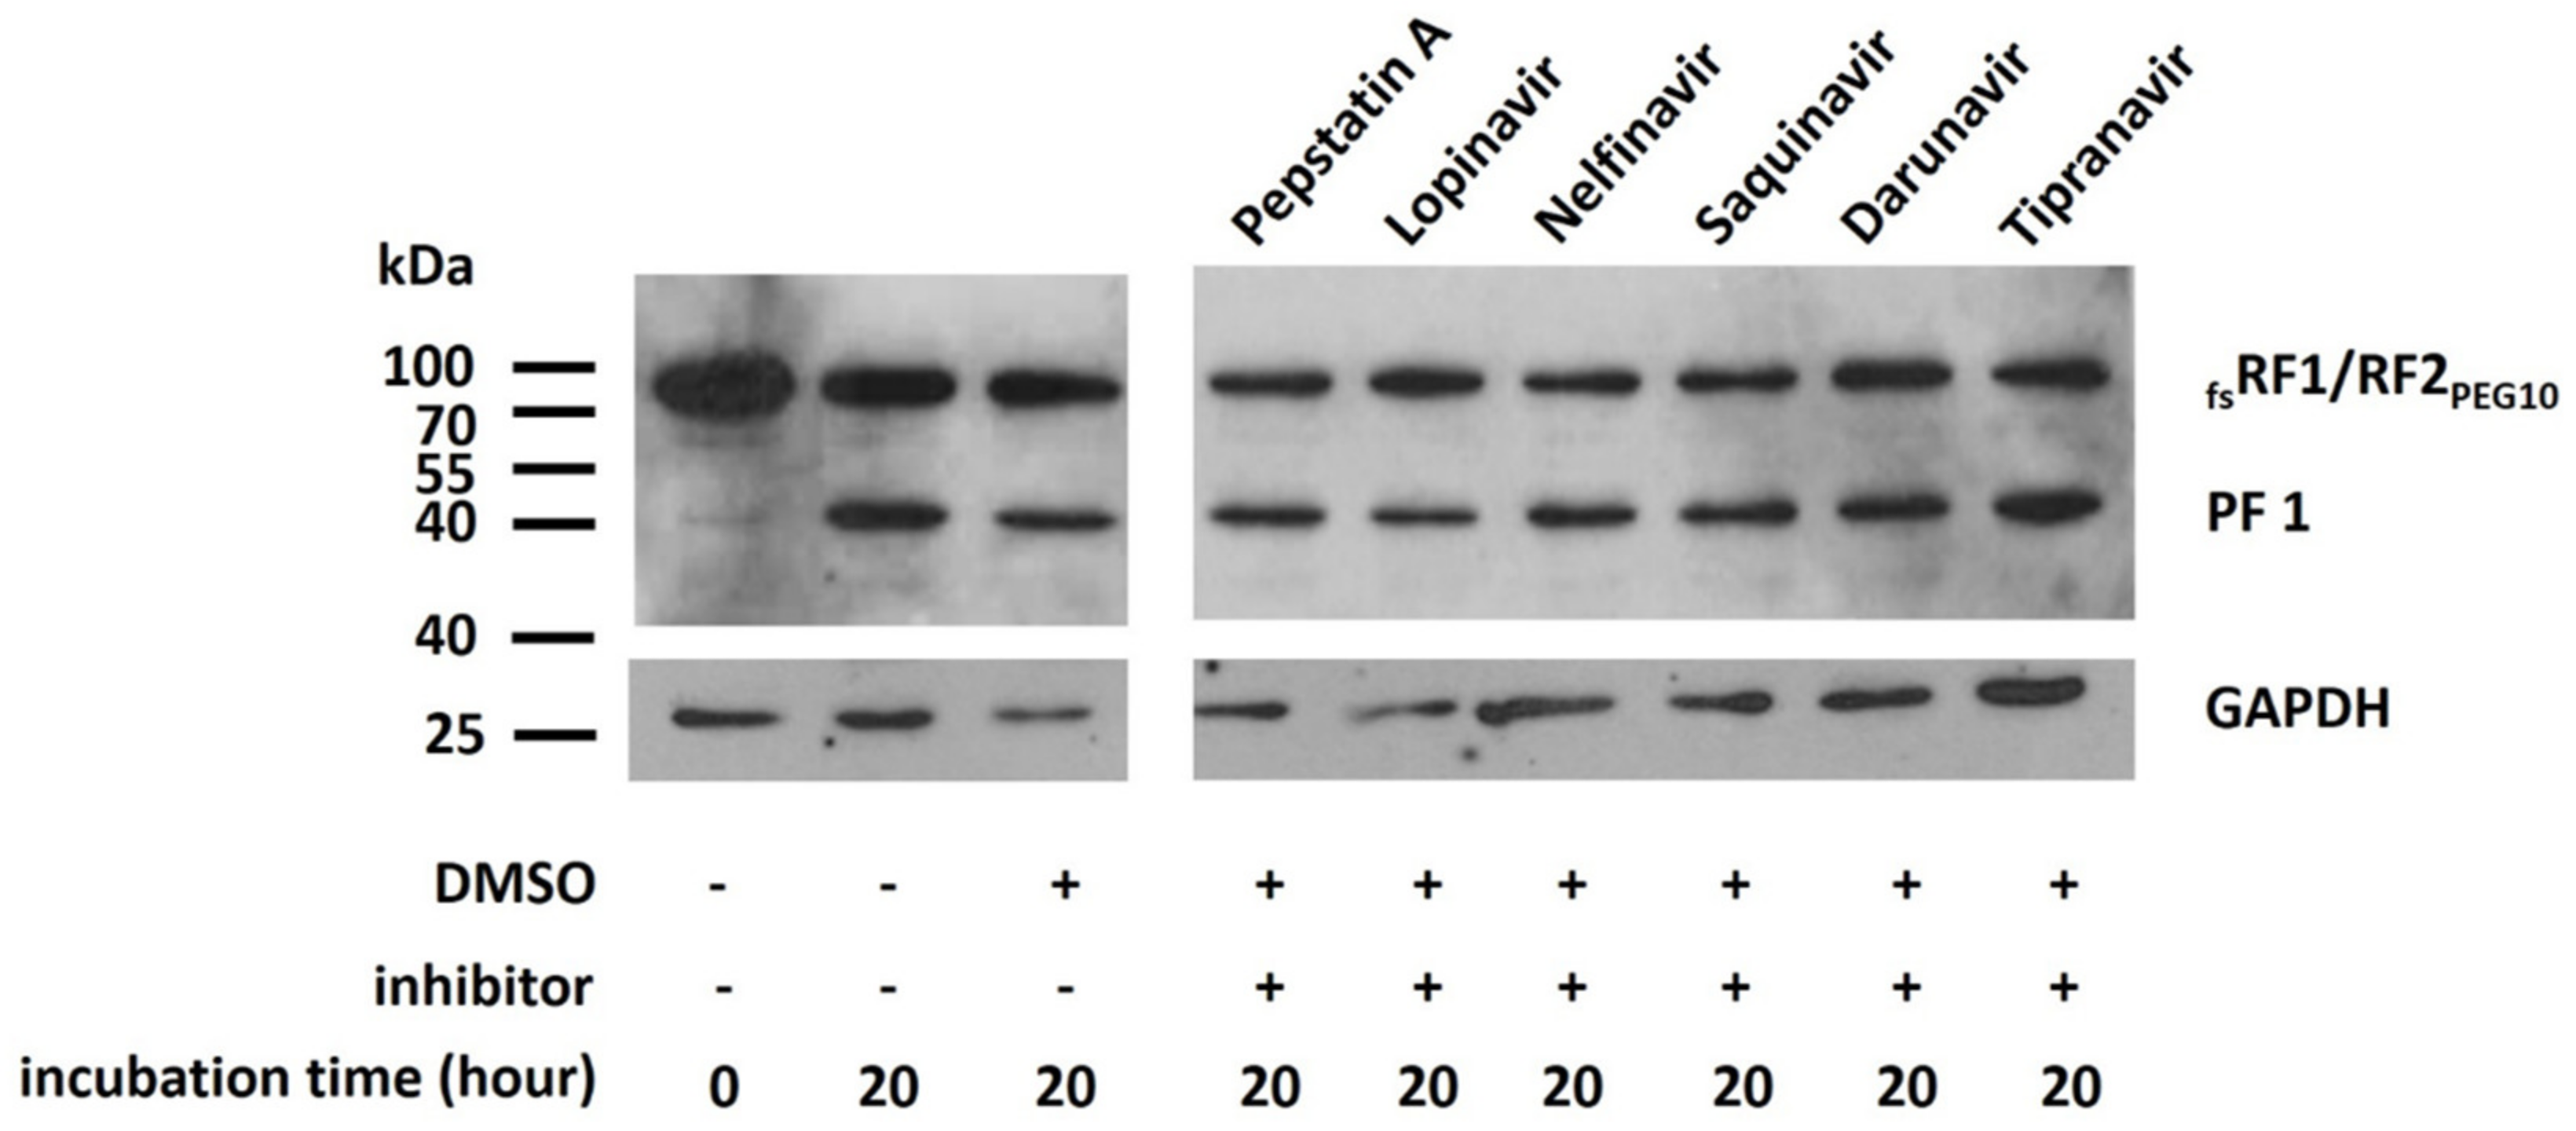
PEG10 exhibits similarities to other retroviral-like aspartic PRs; however, there are only few studies on the sensitivities of these PRs towards HIV PR inhibitors. Of the tested inhibitors, pepstatin A and saquinavir failed to inhibit the autoproteolytic activity of retroviral-like aspartic protease 1 (ASPRV1), based on literature data [
42]. In the case of human Ddi2 protein, isothermal titration calorimetry (ITC) measurements proved that several HIV PR inhibitors, including saquinavir, nelfinavir, darunavir, and acetyl-pepstatin, were unable to bind to the protein, and thus were ineffective against the Ddi2 PR [
43]. Recently, human endogenous retrovirus-K (HERV-K) PR was found to be sensitive to darunavir and lopinavir [
44]; however, its structure is more similar to that of HIV-1 PR than to those of PEG10, ASPRV1, and Ddi2 PRs. These data suggest that most HIV PR inhibitors have only weak inhibitory potential against retroviral-like human PRs or are unable to inhibit these enzymes. This implies that for an effective inhibition of PR
PEG10 and its autoproteolytic function, specific inhibitors need to be designed and tested in the future. However, autoproteolysis was not inhibited by the panel of PR inhibitors (
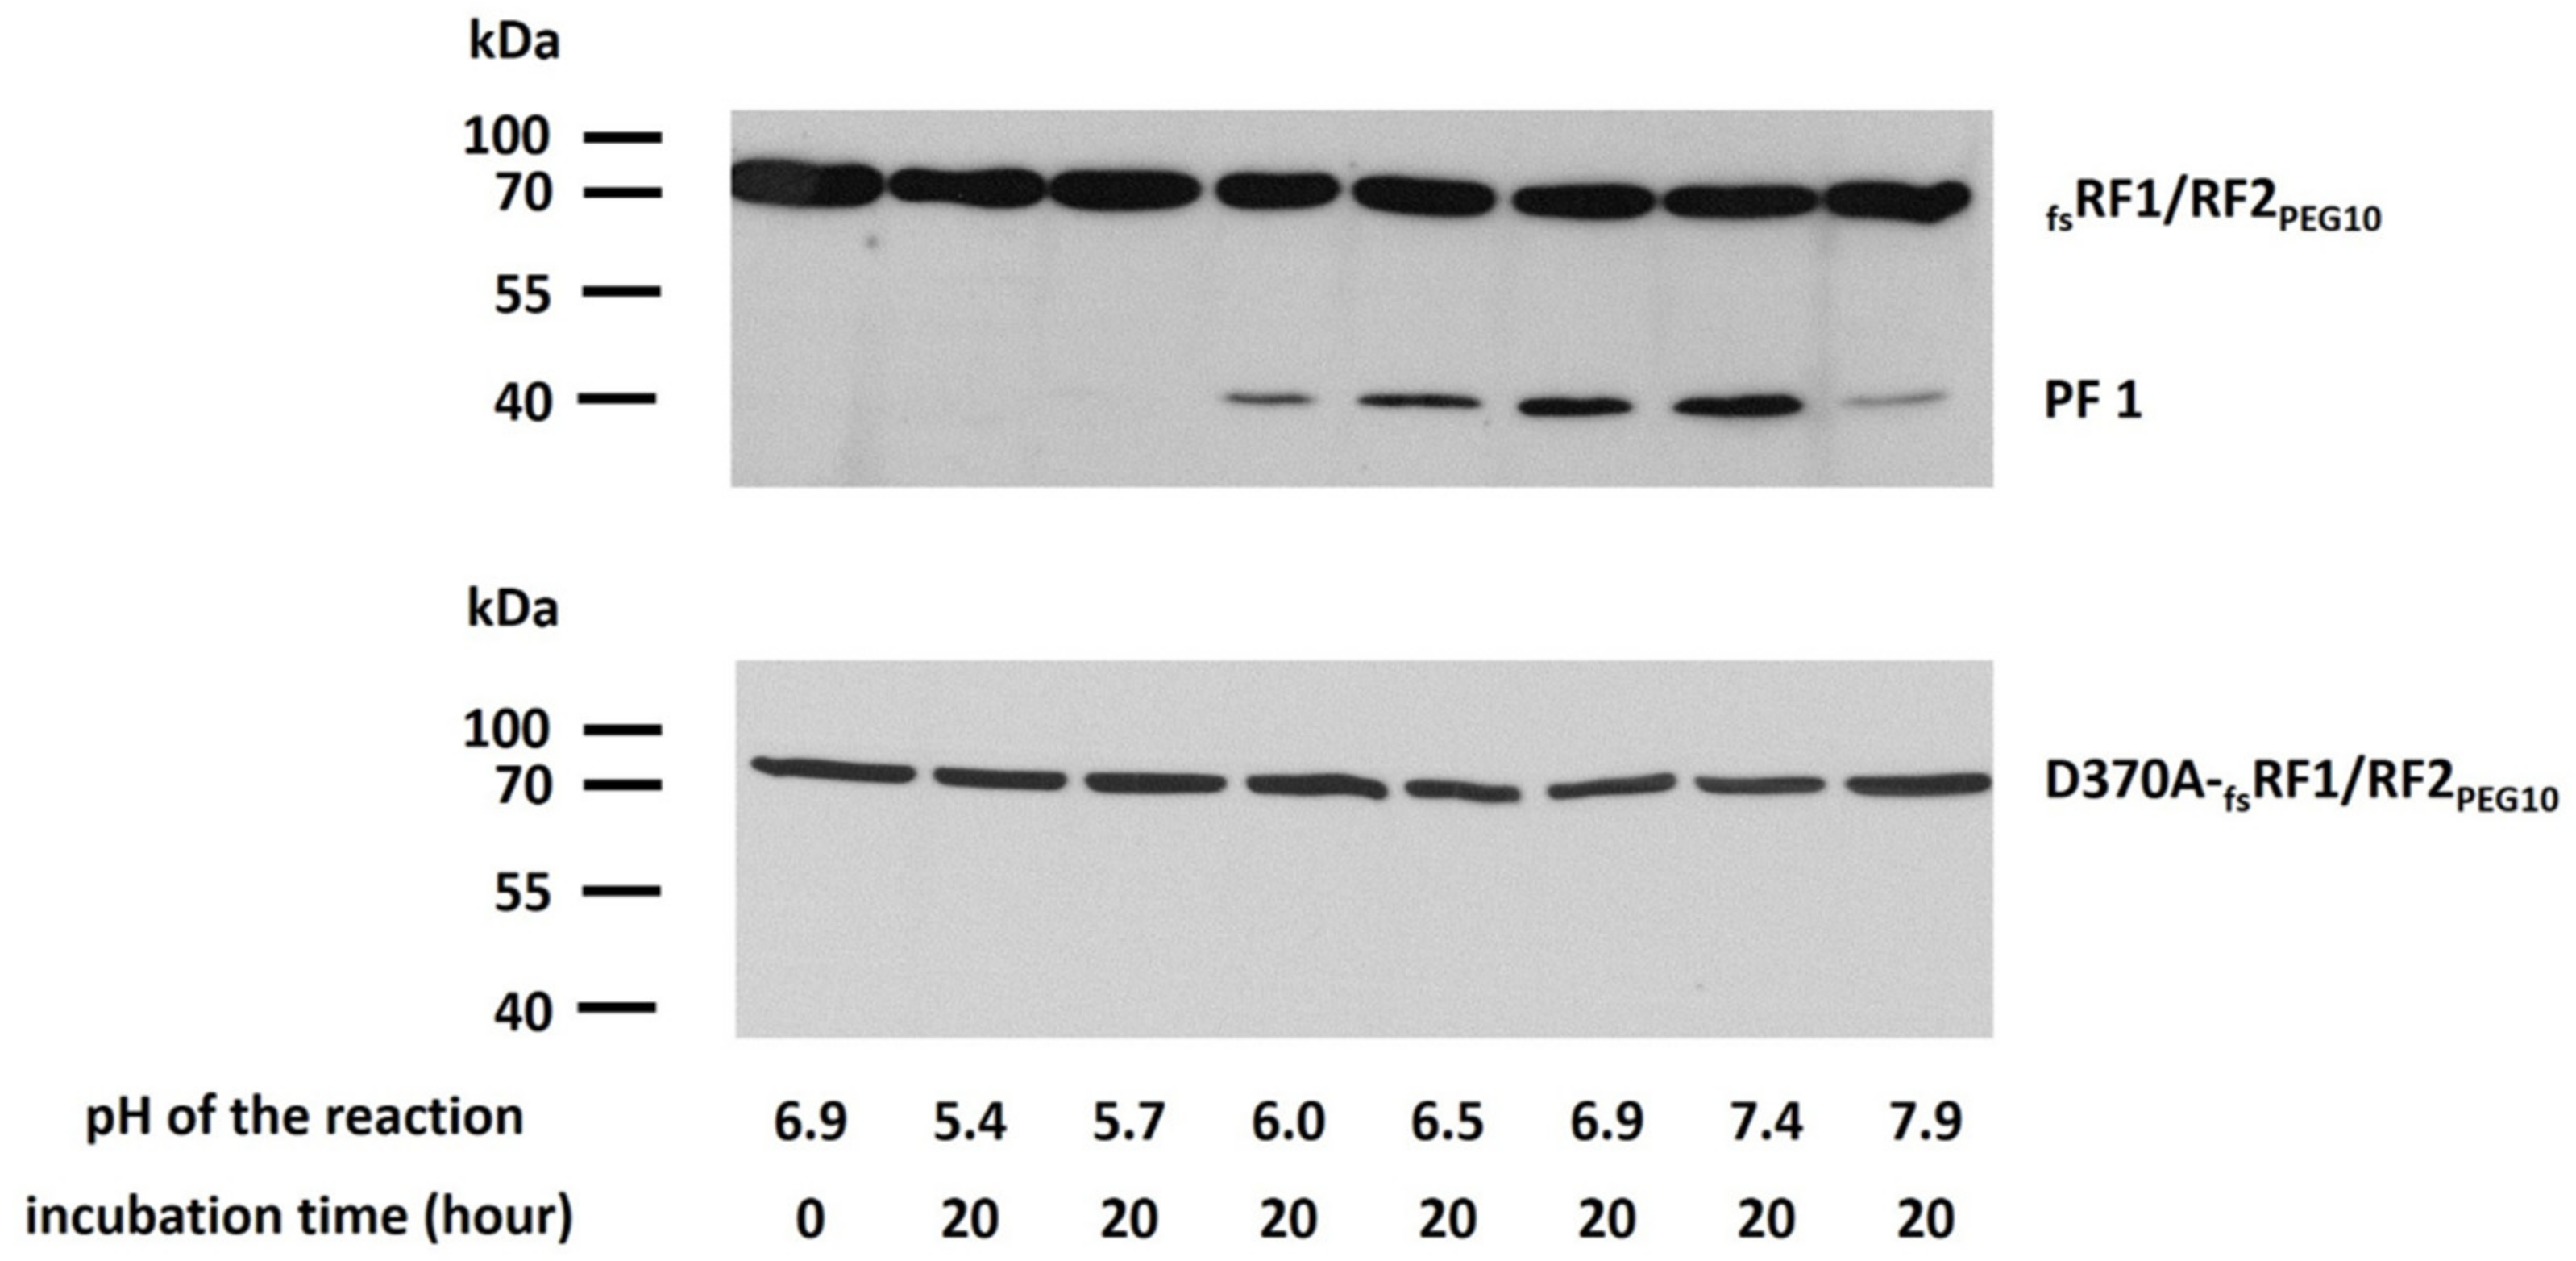
Figure 10), we found that self-processing is dependent on the pH (
Figure 9), and the optimal pH is close to neutral (6.9–7.4), which is similar to the optimum pH for human foamy virus proteinase (6.6) [
45].
To further elucidate the role of PR
PEG10 in the function of
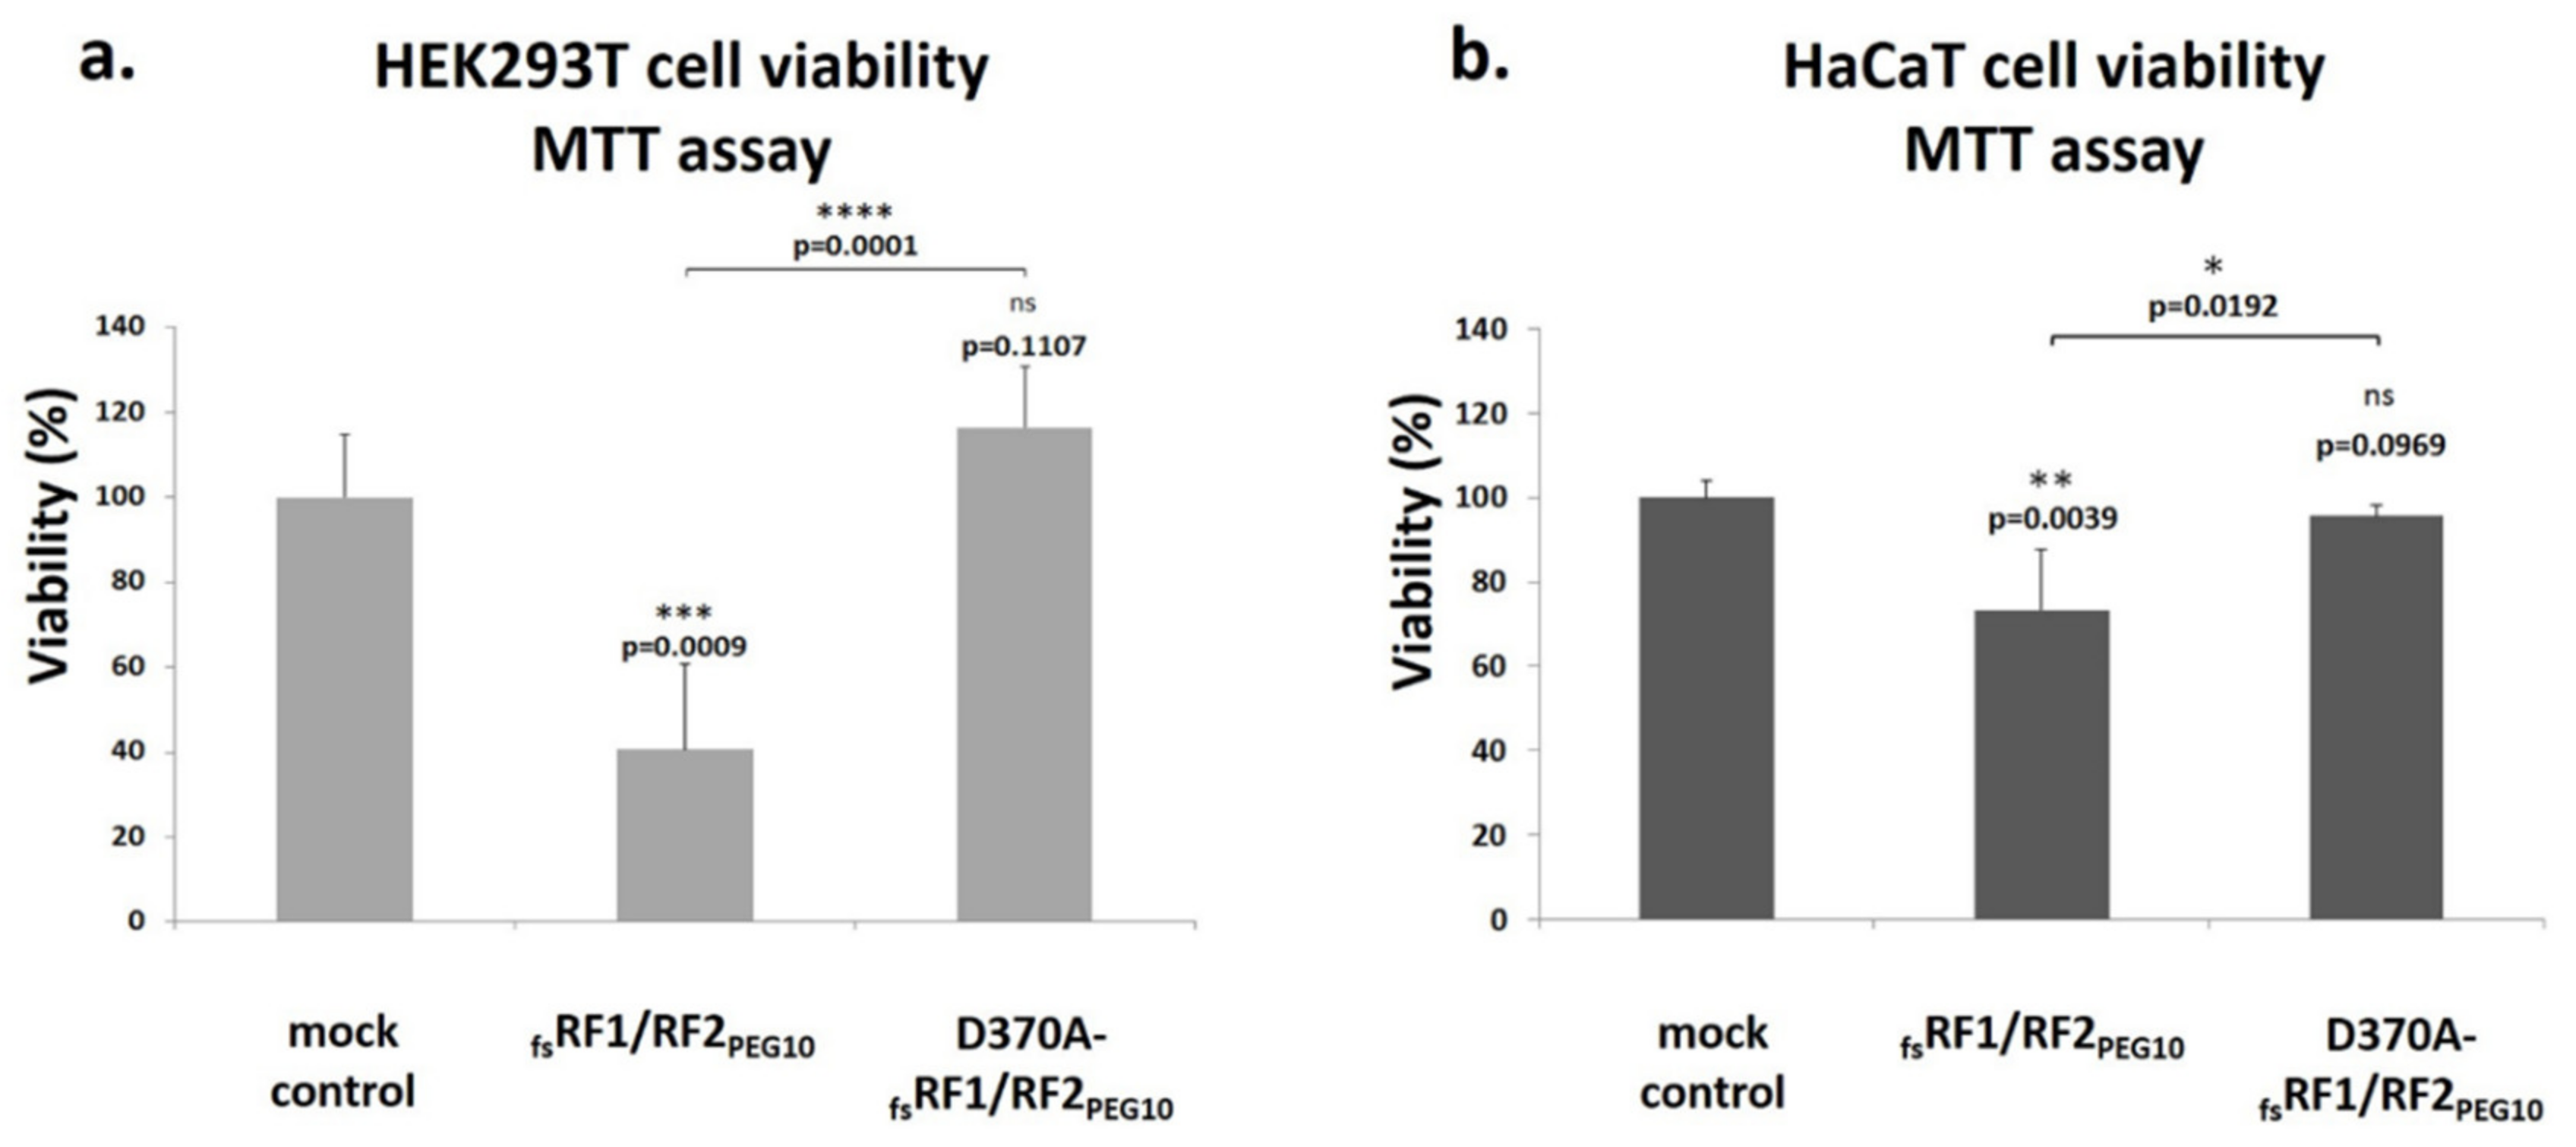
PEG10, cell culture experiments were performed, which revealed that PR
PEG10 plays an important role in the regulation of cell viability and proliferation (
Figure 11 and
Figure 12). Transfection of cells with
fsRF1/RF2
PEG10 harboring wild-type PR
PEG10 resulted in a significant increase in cellular proliferation compared to cells overexpressing the catalytically inactive protease, at least in the HEK293T cell line. Notably, PR
PEG10 appeared to decrease cell viability, since transfection of cells with
fsRF1/RF2
PEG10 led to a decrease in cell viability by > 60%. This effect was reversed when we inactivated PR
PEG10 with the D370A mutation. Others have reported that the viability of Alexander and Huh7 cells was also adversely affected by the suppression of endogenous PEG10 expression, unlike in SNU423 cells, which do not express the endogenous protein [
4]. The contribution of PEG10 to regulation of cell viability and proliferation has already been studied previously by either overexpressing recombinant PEG10 in transfected cells [
4,
9,
12] or at the level of the endogenous protein (e.g., by downregulating expression by siRNAs) [
8,
10,
11]. While the effects of a recombinant protein on cell viability and proliferation may be different as compared to the endogenous protein, the results obtained by different methods are comparable and reveal the oncogenic potential of PEG10. In agreement with this, in this work we aimed to study the protease activity of PEG10, and we think that the comparison of results obtained for the overexpressed recombinant wild-type and mutant proteins can provide valuable information about protease function.
While the association between
PEG10 and malignancies had already been reported [
3,
4,
5,
6,
7,
8,
9,
10,
11], little is known about the function of PR
PEG10. We demonstrated that PR
PEG10 exhibits autoproteolytic activity, and is indeed involved in the cyto-proliferative effect observed when
PEG10 is overexpressed, at least in HEK293T cell line. Although the precise mechanism by which PR
PEG10 is involved in the induction of cellular proliferation is unclear, we hypothesize that the downregulation of pro-apoptotic pathways mediated by
PEG10 is dependent on a functional protease domain, which may facilitate this interaction in a direct or indirect manner, the details of which should be investigated in the future.
4. Materials and Methods
4.1. In Silico Analysis
Secondary structure prediction was performed using the Jpred4 server [
43] based on the sequence of PR
PEG10 (UniProtKB: Q86TG7). Disorder prediction was performed using the IUPred web server [
46]. Modeller9v13 [
47] was used to prepare a homology model for the 346–477 region of RF1/RF2
PEG10. Crystal structures of EIAV protease (PDBID: 1FMB) [
21] and human (PDBID: 3S8I) and yeast (PDBID: 2I1A) Ddi1 proteins [
22] were used as templates. Molecular visualizations were performed using the PyMOL Molecular Graphics System (version 1.3; Schrödinger, LLC). The mean cavity volumes of S1–S4 substrate binding sites were calculated for PR
PEG10 using the previously described method [
24,
25]. Ubiquitination of human PEG10 was predicted by UbiSite (
http://csb.cse.yzu.edu.tw/UbiSite/prediction.php) [
48], BDM-PUB: Prediction of Ubiquitination sites with Bayesian Discriminant Method (
http://bdmpub.biocuckoo.org), and UbPred (predictor of protein ubiquitination sites) (
http://www.ubpred.org/cgi-bin/ubpred/ubpred.cgi) [
49] web servers, using default parameters.
4.2. Cloning
The PEG10 human cDNA sequence (clone name hh04271) was obtained from Kazusa DNA Research Institute (Kisarazu, Japan). The vector (pQE-TriSystem) for expression of C-terminally 8×His-tagged proteins was a kind gift from Zoltán Papp at the Division of Clinical Physiology, Institute of Cardiology, Faculty of Medicine, University of Debrecen. The cDNA sequences encoding RF1
PEG10 (1–325 res), RF2
PEG10 (320–626 res), and RF1/RF2
PEG10 (1–626 res) were cloned into a HindIII and XhoI enzyme-cleaved pQE-TriSystem expression vector. As the PEG10 cDNA sequence contains an XhoI restriction endonuclease cleavage site, it was mutated to facilitate cloning of the sequence. Insertional mutagenesis was performed in the frameshift site of the sequence encoding RF1/RF2
PEG10 by insertion of a single adenine into the G-GGA-AAC “slippery” heptanucleotide sequence (G- GGA-
AAA-C, inserted nucleotide underlined) to enable transcription of the RF1/RF2
PEG10-encoding mRNA (
fsRF1/RF2
PEG10). A thrombin cleavage site was designed after the PEG10-encoding sequences to facilitate removal of the polyhistidine tag from the fusion protein. The 1878-bp frameshift mutant RF1/RF2
PEG10, followed by the sequence encoding the thrombin cleavage site, was cloned into the plasmid. The sequences encoding the RF1
PEG10-thrombin cleavage site, the RF2
PEG10-thrombin cleavage site, or the RF1/RF2
PEG10-thrombin cleavage site were amplified in the initial PCR step, while the second PCR reaction was used to create a 3′XhoI restriction site. The inserts were amplified using PCR (iCycler Thermal Cycler, Bio-Rad, Hercules, CA, USA). Both the amplified fragments and the vector were digested with HindIII and XhoI restriction endonucleases and were extracted from agarose gel using a gel extraction kit (ISOLATE II PCR and Gel Kit, BIOLINE) after separation by electrophoresis. For ligation, T4 DNA ligase was used with a vector/insert molar ratio of 1:5. To predict the molecular weight of the C-terminal His-tagged PEG10 proteins, we used a freely available protein molecular weight calculator (
http://www.bioinformatics.org/sms/prot_mw.html, date of last accession: June 2017). D369A, D370A, S371A, and XhoI endonuclease cleavage site mutations in the PEG10 sequence were generated using a QuikChange mutagenesis kit (Agilent Technologies, Santa Clara, CA, USA) according to the manufacturer’s instruction. Sequencing was performed using gene- and vector-specific primers and the BigDye Terminator v3.1 Cycle Sequencing Kit (Applied Biosystems, Foster City, CA, USA). Oligonucleotide sequences are shown in
Table S2.
4.3. Transfection of HEK293T Cells
HEK293T cells (Invitrogen, Carlsbad, CA, USA) were cultured in T-75 flasks in Dulbecco’s modified Eagle’s medium (DMEM) supplemented with 1% penicillin-streptomycin, 1% glutamine, and 10% fetal bovine serum (FBS), and incubated at 37 °C and 5% CO
2. Cells were transfected with PEG10 constructs (14 μg DNA) at 60% confluency using a polyethylenimine (PEI) transfection protocol [
50]. After transfection, the cells were incubated in DMEM containing no antibiotics and FBS. After 5 h of incubation, fresh medium (supplemented with 10% FBS, 1% penicillin-streptomycin, 1% glutamine) was added to cells, and the cells were further incubated overnight. We used pQE-TriSystem plasmid DNA as a mock control.
4.4. Lysis of PEG10-Transfected HEK293T Cells
Cells were trypsinized and collected by centrifugation (130× g, 8 min, room temperature) 24 h after transfection. The pellet was resuspended in 500 μL of phosphate-buffered saline containing protease inhibitor cocktail (complete EDTA-free Protease Inhibitor Tablet, ROCHE, St. Louis, MO, USA). The pellets were lysed by sonication (Branson Sonifer 450, duty cycle 30 %, output control 4) for 3 × 10 s. Cell lysates were then centrifuged at 16,000× g for 15 min at 4 °C to remove cellular debris. For the comparison of expressed PEG10 proteins, 30 μL aliquots of the supernatants were analyzed by Western blot.
4.5. Analysis of Proteolytic Activity
Following transfection with either fsRF1/RF2PEG10 or active-site mutant fsRF1/RF2PEG10, HEK293T cells were incubated for 48 h and the medium was replaced after 24 h. Next, the cellular pellet was collected and lysed as described above (see “Lysis of PEG10-transfected HEK293T cells”). After cell lysis and centrifugation, supernatants were dialyzed overnight against storage buffer (20 mM piperazine-1,4-bis(2-ethanesulfonic acid) (PIPES), 1 mM EDTA, 100 mM NaCl, 10% glycerol, 0.5% Nonidet P-40, 2 mM DTT, pH 7.0). Protease inhibitor cocktail (20 μL of 7× stock solution) was also added to 120 μL lysate to inhibit the proteolysis of the protein of interest by serine, cysteine, and metalloproteases present in the cellular extract. The proteolytic activity of fsRF1/RF2PEG10 was assessed by incubating the total cell lysates of transfected cells for 20 h at 37 °C. For the “0 h” sample, the collected cell lysate was frozen immediately at −20 °C.
To investigate the susceptibility of a recombinant protein substrate for cleavage by PRPEG10, the total cell lysate of transfected HEK293T cells expressing fsRF1/RF2PEG10 protein was incubated with His6-MBP-fsRF1/RF2PEG10(1-345)-mTurquoise2 fusion protein in storage buffer for 24 h at 37 °C. The cleavage reaction was followed by Western blot using anti-MBP antiserum (E8030S, New England Biolabs, Ipswich, MA, USA) and anti-PEG10 antibody (SAB1400438-50UG; Sigma-Aldrich, St. Louis, MO, USA).
4.6. Recombinant Protein Substrate Preparation
For preparation of a recombinant fusion protein substrate containing the 1–345 residues of the full-length
fsRF1/RF2
PEG10 protein (His
6-MBP-
fsRF1/RF2
PEG10 (1-345)-mTurquoise2), we used a slightly modified version of the previously described method [
51]. The introduced changes are detailed below.
A pGEX-4T-3 expression plasmid containing the codon-optimized coding sequence of the
fsRF1/RF2
PEG10 protein was obtained from GenScript, and the pDest-His
6-MBP-mTurquoise2 bacterial expression plasmid was used from the in-house stock [
51] The coding sequence of the 1–345 region of the
fsRF1/RF2
PEG10 protein was amplified using PCR, and both the amplicon and pDest-His
6-MBP-mTurquoise2 plasmid were digested with PacI and NheI restriction endonucleases followed by ligation. The plasmid was transformed into BL21(DE3)
Escherichia coli cells, and then the His
6-MBP-
fsRF1/RF2
PEG10(1–345)-mTurquoise2 protein substrate was expressed at 16 °C for 6 h. After cell lysis, the protein substrate was purified by Ni-NTA magnetic agarose beads (Qiagen, Hilden, Germany), after which the buffer was changed to modified storage buffer (20 mM PIPES, 100 mM NaCl, 0.05% Tween20, pH 7.0) using 0.5 mL 10K Amicon Ultra centrifugal filter tubes (Merck-Millipore, Burlington, MA, USA). The purified recombinant protein was applied as the substrate to test the proteolytic activity of PR
PEG10.
4.7. Western Blot Analysis
Samples were prepared for Western blot as described in the
Section 4.5. Protein samples subjected for the detection of ubiquitination were purified with Ni-chelate affinity chromatography (HisTrap HP column, GE Healthcare; ÄKTA prime liquid chromatograph, Amersham Biosciences, Little Chalfont, UK). The SDS loading dye was added to the samples and the mixtures were boiled at 95 °C for 10 min, followed by brief centrifugation. Samples were then loaded onto a 14% SDS polyacrylamide gel. Following SDS-PAGE electrophoresis, proteins were transferred onto a nitrocellulose membrane at 100 V for 70 min. The membrane was blocked by 5 % dry milk in Tris-buffered saline (TBS, pH 7.5) for 1 h at room temperature, followed by incubation with the antibodies. Mouse anti-PEG10 polyclonal antibody (SAB1400438-50UG; Sigma-Aldrich, St. Louis, MO, USA) was applied in a 1:2000 dilution, a rabbit anti-ubiquitin polyclonal antibody (Z0458; Dako Cytomation, Glostrup, Denmark) in a 1:500 dilution, and a rabbit anti-MBP antiserum (E8030S, New England Biolabs, Ipswich, Massachusetts, USA) in a 1:20,000 dilution. Rabbit anti-GAPDH antibody (G9545; Sigma-Aldrich, MO, USA) was applied in a 1:15,000 dilution. Primary antibodies were diluted in Tris-buffered saline complemented with Tween20 (TTBS) containing 0.1 % dry milk and were incubated at 4 °C overnight. The membranes were washed three times with TTBS for 15 min and were then incubated with polyclonal anti-mouse (A4416; Sigma-Aldrich, MO, USA) or anti-rabbit (170–6515; Bio-Rad, CA, USA) secondary antibodies for 1 h at room temperature. The membranes were subsequently washed a further three times with TTBS. Proteins were detected using SuperSignal West Pico chemiluminescent substrate (Thermo Fisher Scientific, Waltham, MA, USA).
4.8. Determination of pH Optimum for PRPEG10
Effect of pH on PRPEG10 activity was measured in META buffer (100 mM 2-(N-morpholino)-ethanesulfonic acid (MES), 200 mM Tris, 100 mM Na-acetate, 2 M NaCl). Following transfection of cells, 100 μL of cell lysate was dialyzed against storage buffer (pH 7.0) for 3 h and then incubated at 37 °C for 20 h in a 1:1 volume ratio of a series of META buffers with pH values ranging from 5.0 to 8.0. The pH values of the reactions mixtures were determined to be 5.4, 5.7, 6.0, 6.5, 6.9, 7.4, and 7.9.
4.9. In Vitro Inhibition of PRPEG10
Pepstatin A, lopinavir, nelfinavir, saquinavir, darunavir, and tipranavir (NIH AIDS Reagent Program) dissolved in dimethylsulfoxide (DMSO, Sigma-Aldrich, MO, USA) were used for the inhibition of PRPEG10. The reaction mixtures contained the lysate of fsRF1/RF2PEG10-transfected cells, which was dialyzed against storage buffer. HIV inhibitors were added to a final concentration of 10 µM, followed by incubation at 37 °C for 20 h. Only DMSO was added to the control sample. The reactions were terminated by the addition of SDS loading dye, and the mixtures were boiled at 95 °C for 10 min and centrifuged briefly before Western blot analysis.
4.10. Cell Viability Assay
HEK293T and HaCaT cells were seeded at a density of 10,000 cells per well (~70–80% confluence) in 96-well plates 16 h before treatment. For transfection of the cells, Lipofectamine LTX&PLUS™ reagent (Invitrogen, Carlsbad, CA, USA) was used according to the manufacturer’s instructions. The plasmid DNA (100 ng/well) and the Lipofectamine reagent (0.5 μL/well) were also diluted in Opti-MEM medium. After incubation for 5 min, the DNA was mixed with the diluted Lipofectamine in a 1:1 volume ratio. The DNA–lipid mixture was incubated for 20 min at room temperature. The cell culture medium was changed to fresh Opti-MEM (90 μL) in each well, and after addition of the pre-incubated mixture the cells were further incubated for 5 h, then the transfection medium was replaced with fresh DMEM. Cell viability was determined by adding 1 mM of 3-(4,5-dimethylthiazol-2-yl)-2,5-diphenyltetrazolium bromide (MTT, Invitrogen, Carlsbad, CA, USA) to the cells that were incubated at 37 °C for 4 h. Then, MTT formazan crystals were dissolved using DMSO (Sigma-Aldrich, MO, USA), followed by re-incubation for 10 min. Absorbance values were measured at 544 nm using an automatic microplate reader (Wallac 1420 Victor2, Wallac Oy, Turku, Finland). HEK293T cells transfected with a pQE-TriSystem plasmid were used as mock control, whereas the efficiency of transfection was determined by measuring fluorescence of cells transfected with a pQE-TriSystem-GFP plasmid.
4.11. Analysis of Cell Proliferation by Flow Cytometry
HEK293T and HaCaT cells maintained in DMEM (supplemented with 1% penicillin-streptomycin, 1% glutamine, and 10% FBS) were plated in 6-well plates at a density of 3 × 10⁵ cells/well 24 h before transfection. Cells maintained in Opti-MEM medium lacking antibiotics were transfected with fsRF1/RF2PEG10 or D370A-fsRF1/RF2PEG10 DNA, using Lipofectamine LTX&PLUS™ reagent (Invitrogen, CA, USA) according to the manufacturer’s protocol. Then, 5 μL/well Lipofectamine reagent and 3 μg/well plasmid DNA were diluted in Opti-MEM medium and incubated for 5 min. After incubation, the DNA and the Lipofectamine were mixed (volume ratio of 1:1). In order to form the DNA-lipid complex, the solution was incubated again for 20 min. The incubated solution was added to the cells in 750 μL Opti-MEM dropwise and incubated for 5 h. For mock control, pQE-TriSystem was used to transfect cells. After incubation, 3 mL of fresh medium supplemented with 10% FBS was added to the transfected cells, which were then further incubated for 36 h. The success of transfection was verified by determining the fluorescence of control cells that had been transfected with pQE-TriSystem-GFP plasmid. Cellular proliferation was analyzed using flow cytometry (FACS Calibur, BD Biosciences, San Jose, CA, USA), using mouse-anti-human Ki67-FITC antibody (11-5699-41, eBioscience, San Diego, CA, USA).
4.12. Statistical Analysis


