Lipid Deposition and Mobilisation in Atlantic Salmon Adipocytes


Abstract
1. Introduction
2. Results
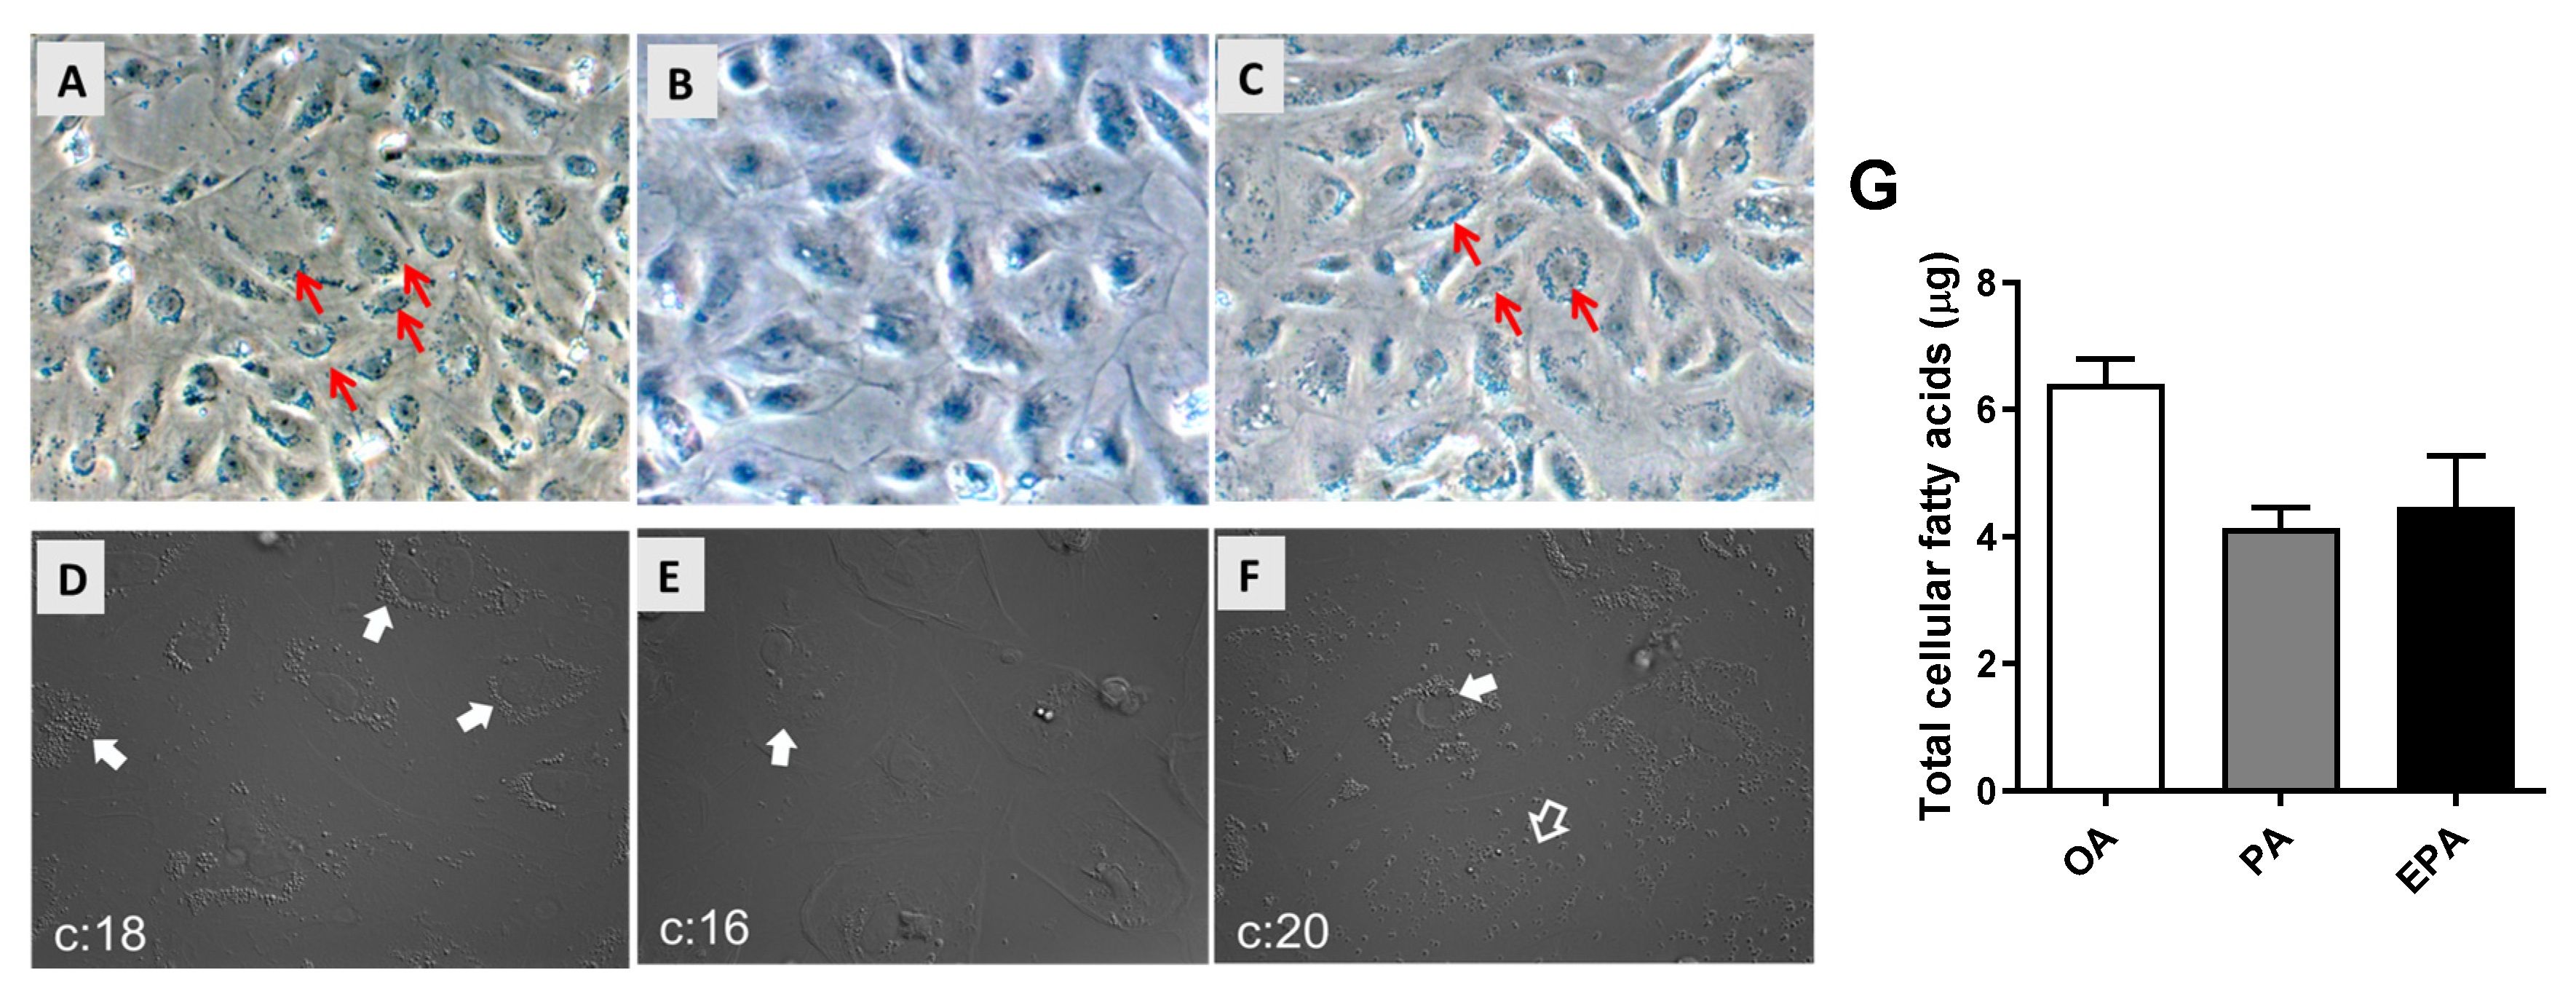
2.1. The Influence of OA, PA, and EPA on Lipid Droplets Formation, Total FA Content, and FA Composition
2.2. The Influence of OA, PA, and EPA on Lipogenesis
2.3. The Influence of Endogenous FA Composition on Incorporation of Radiolabelled PA in Different Cellular Lipid Classes
2.4. Cellular Response to Nutrient Deprivation and Glucagon
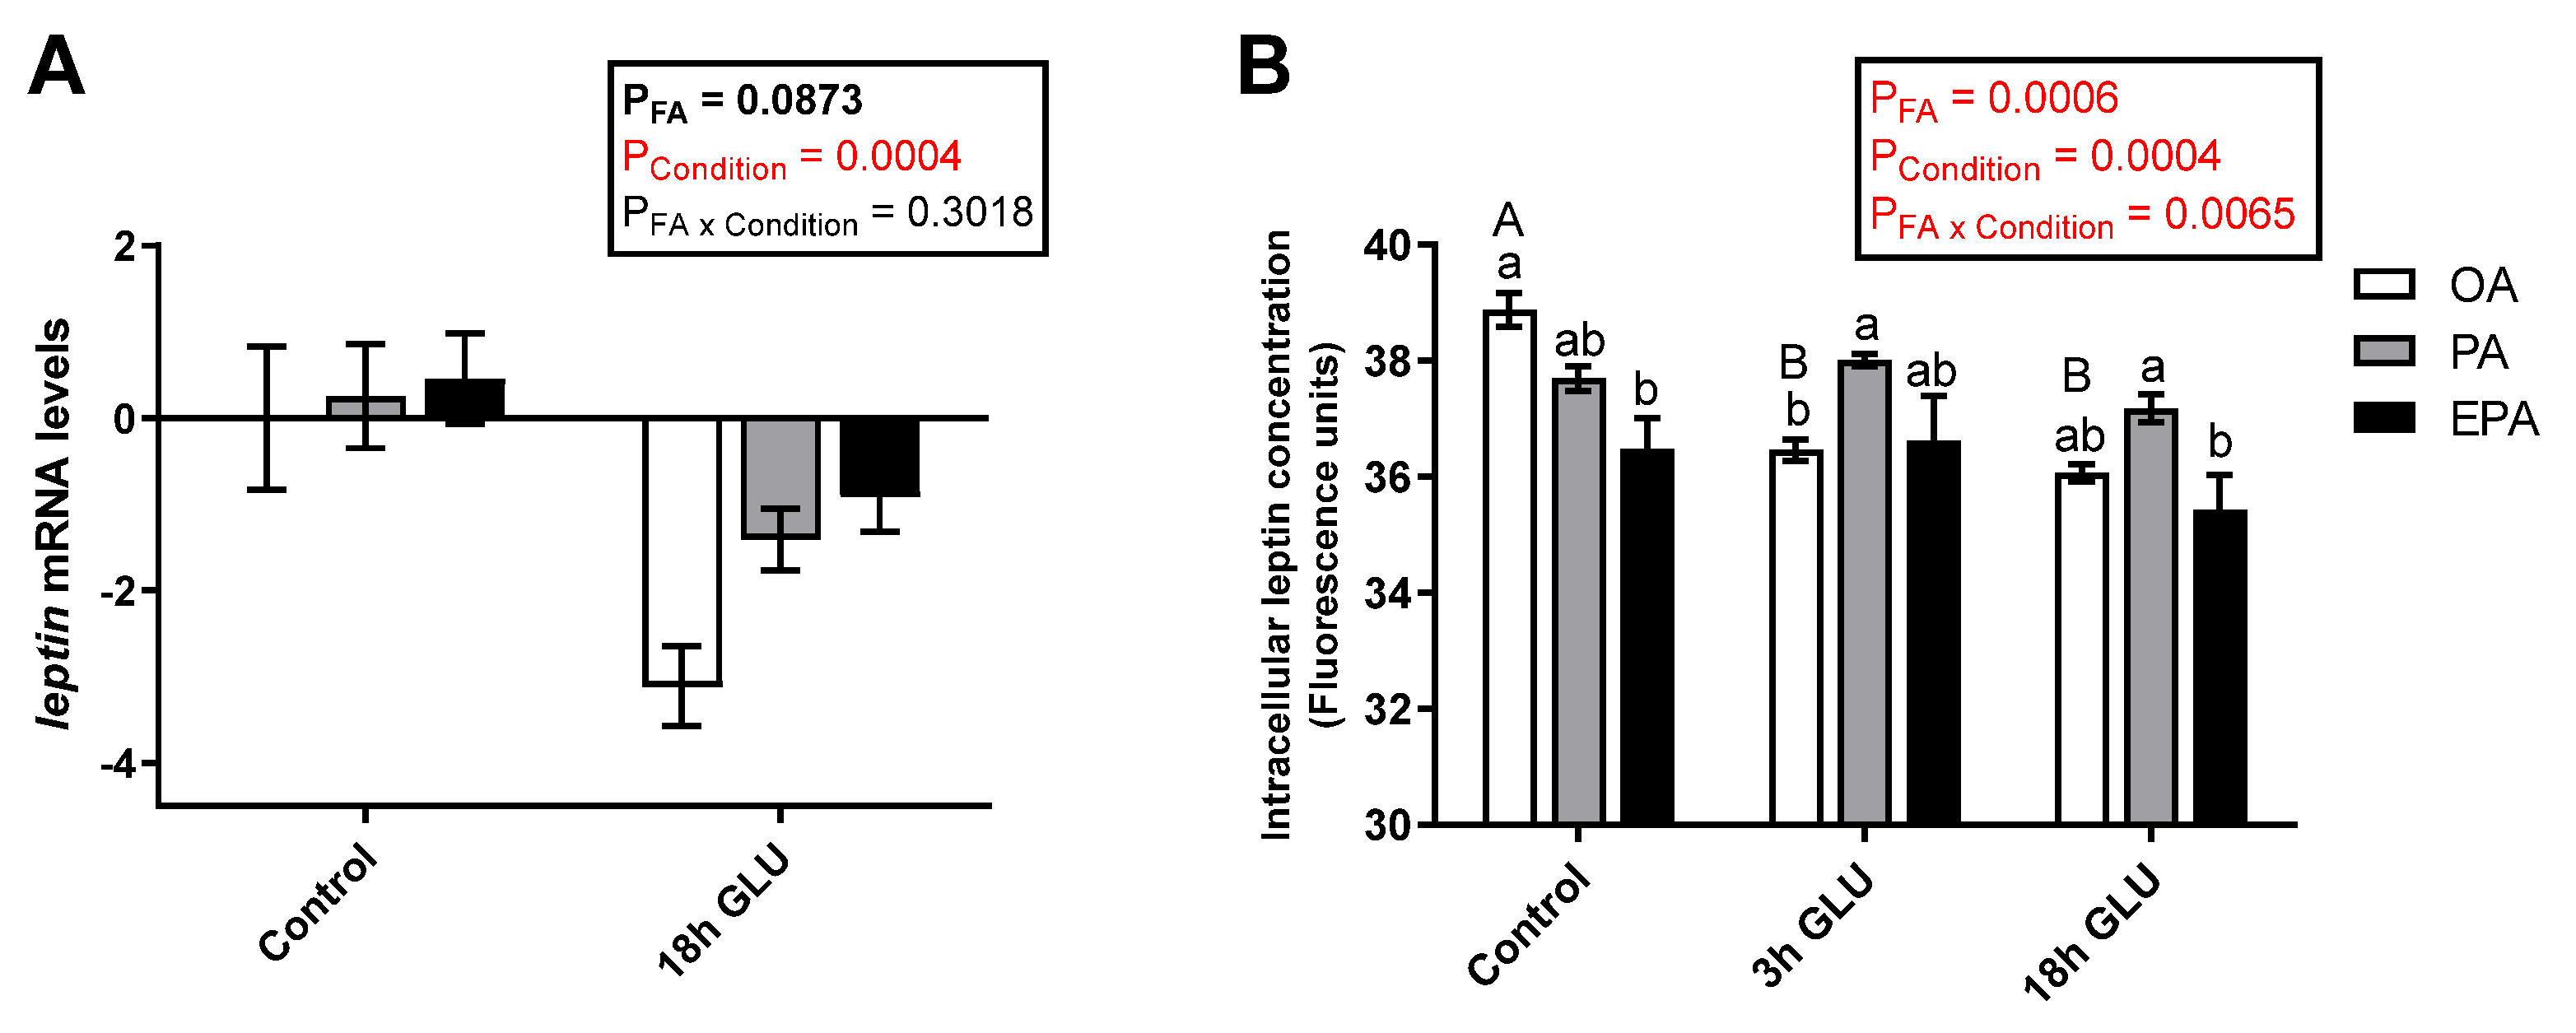
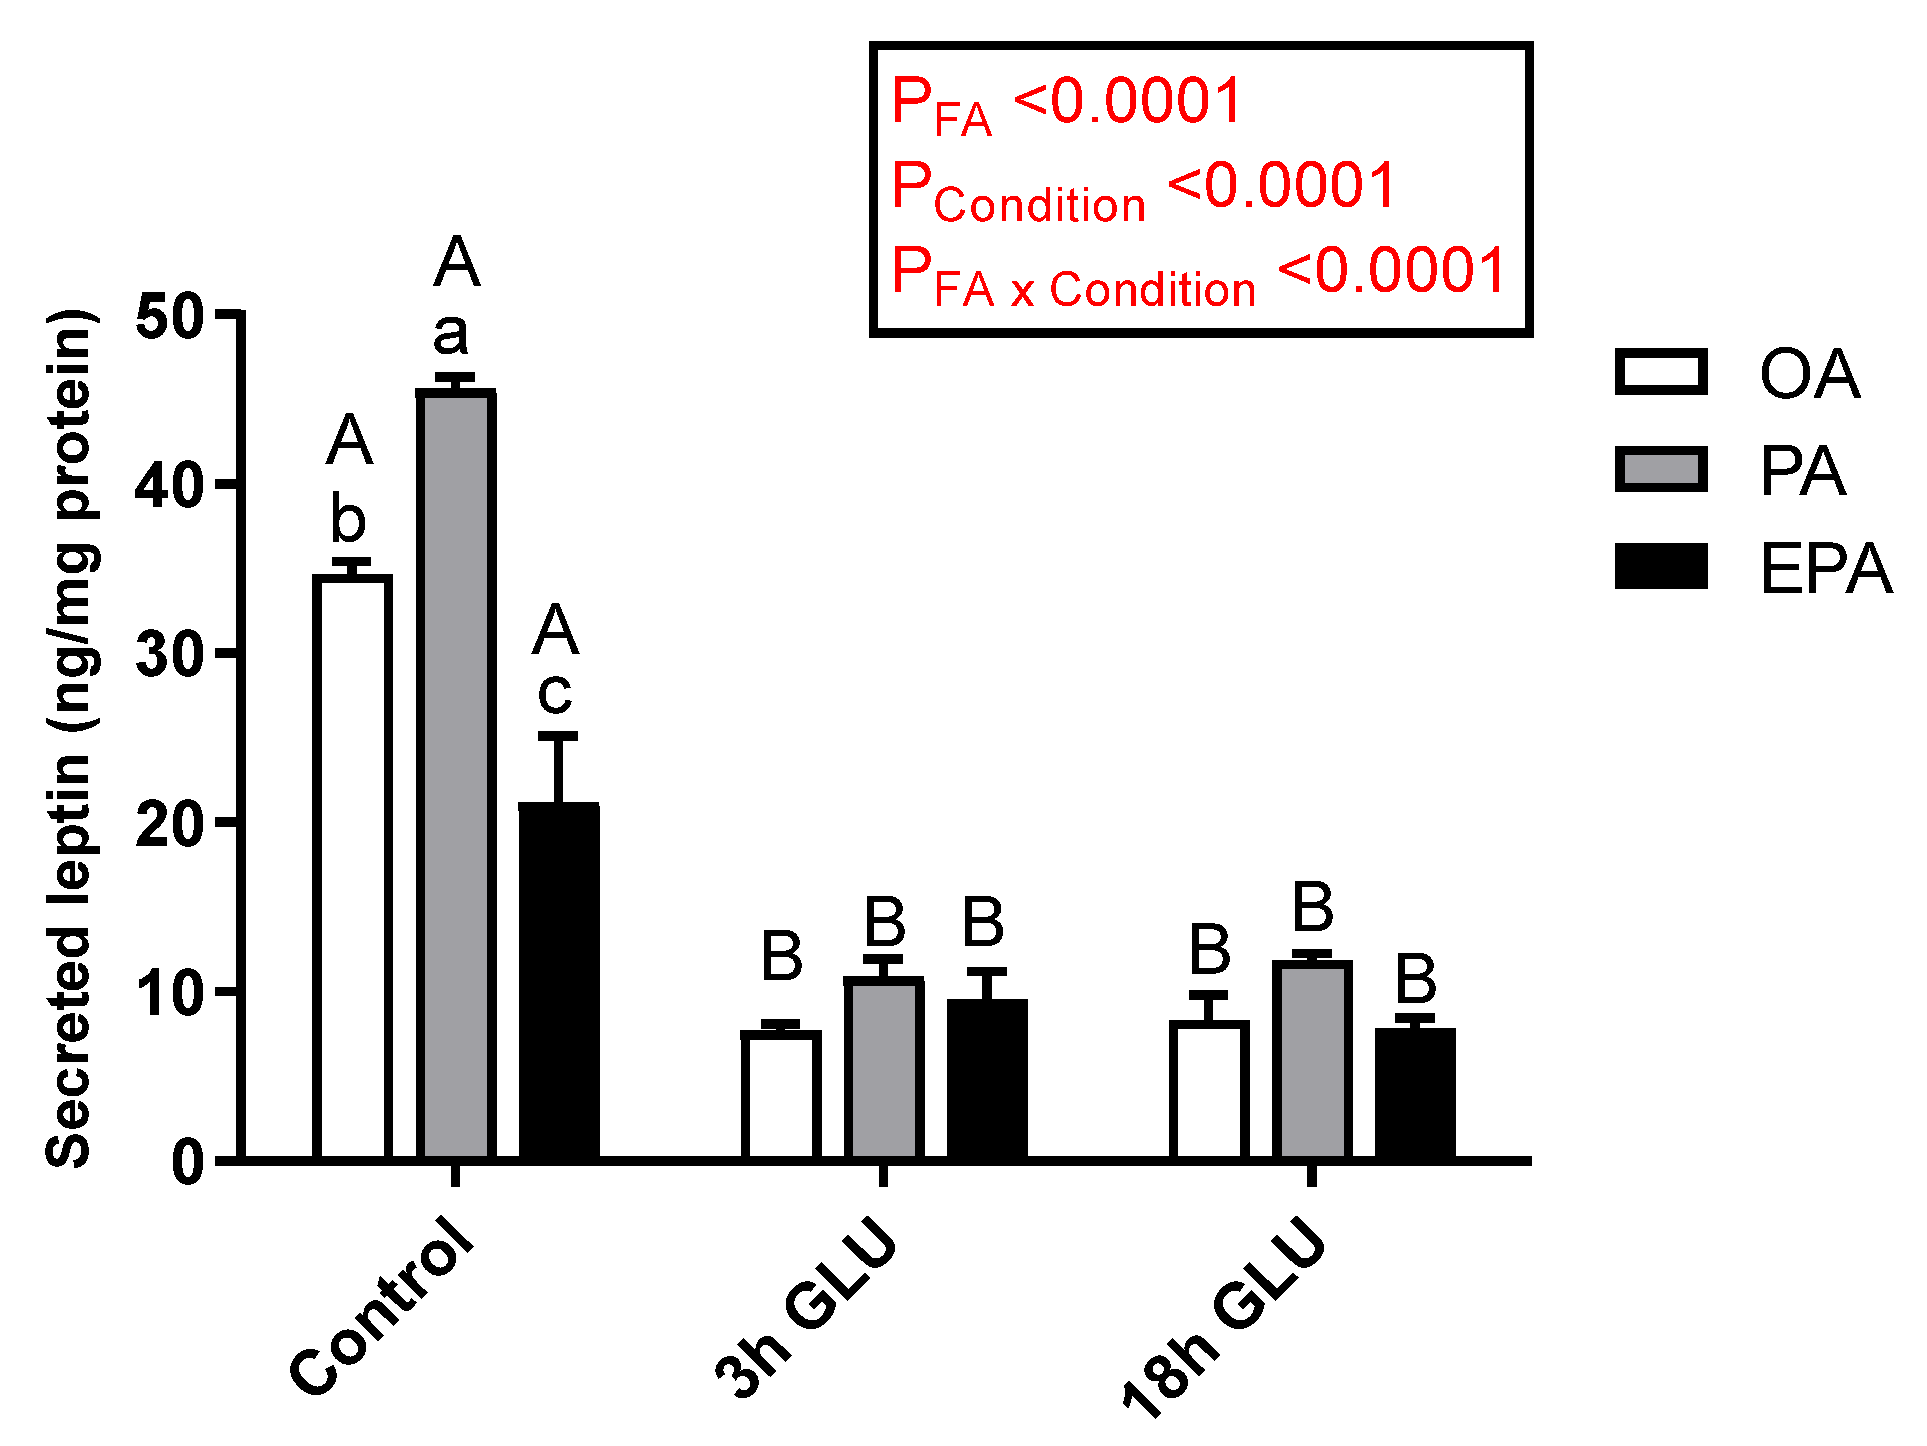
2.4.1. Leptin
2.4.2. Transcriptional Responses to Serum Deprivation and Glucagon Supplementation
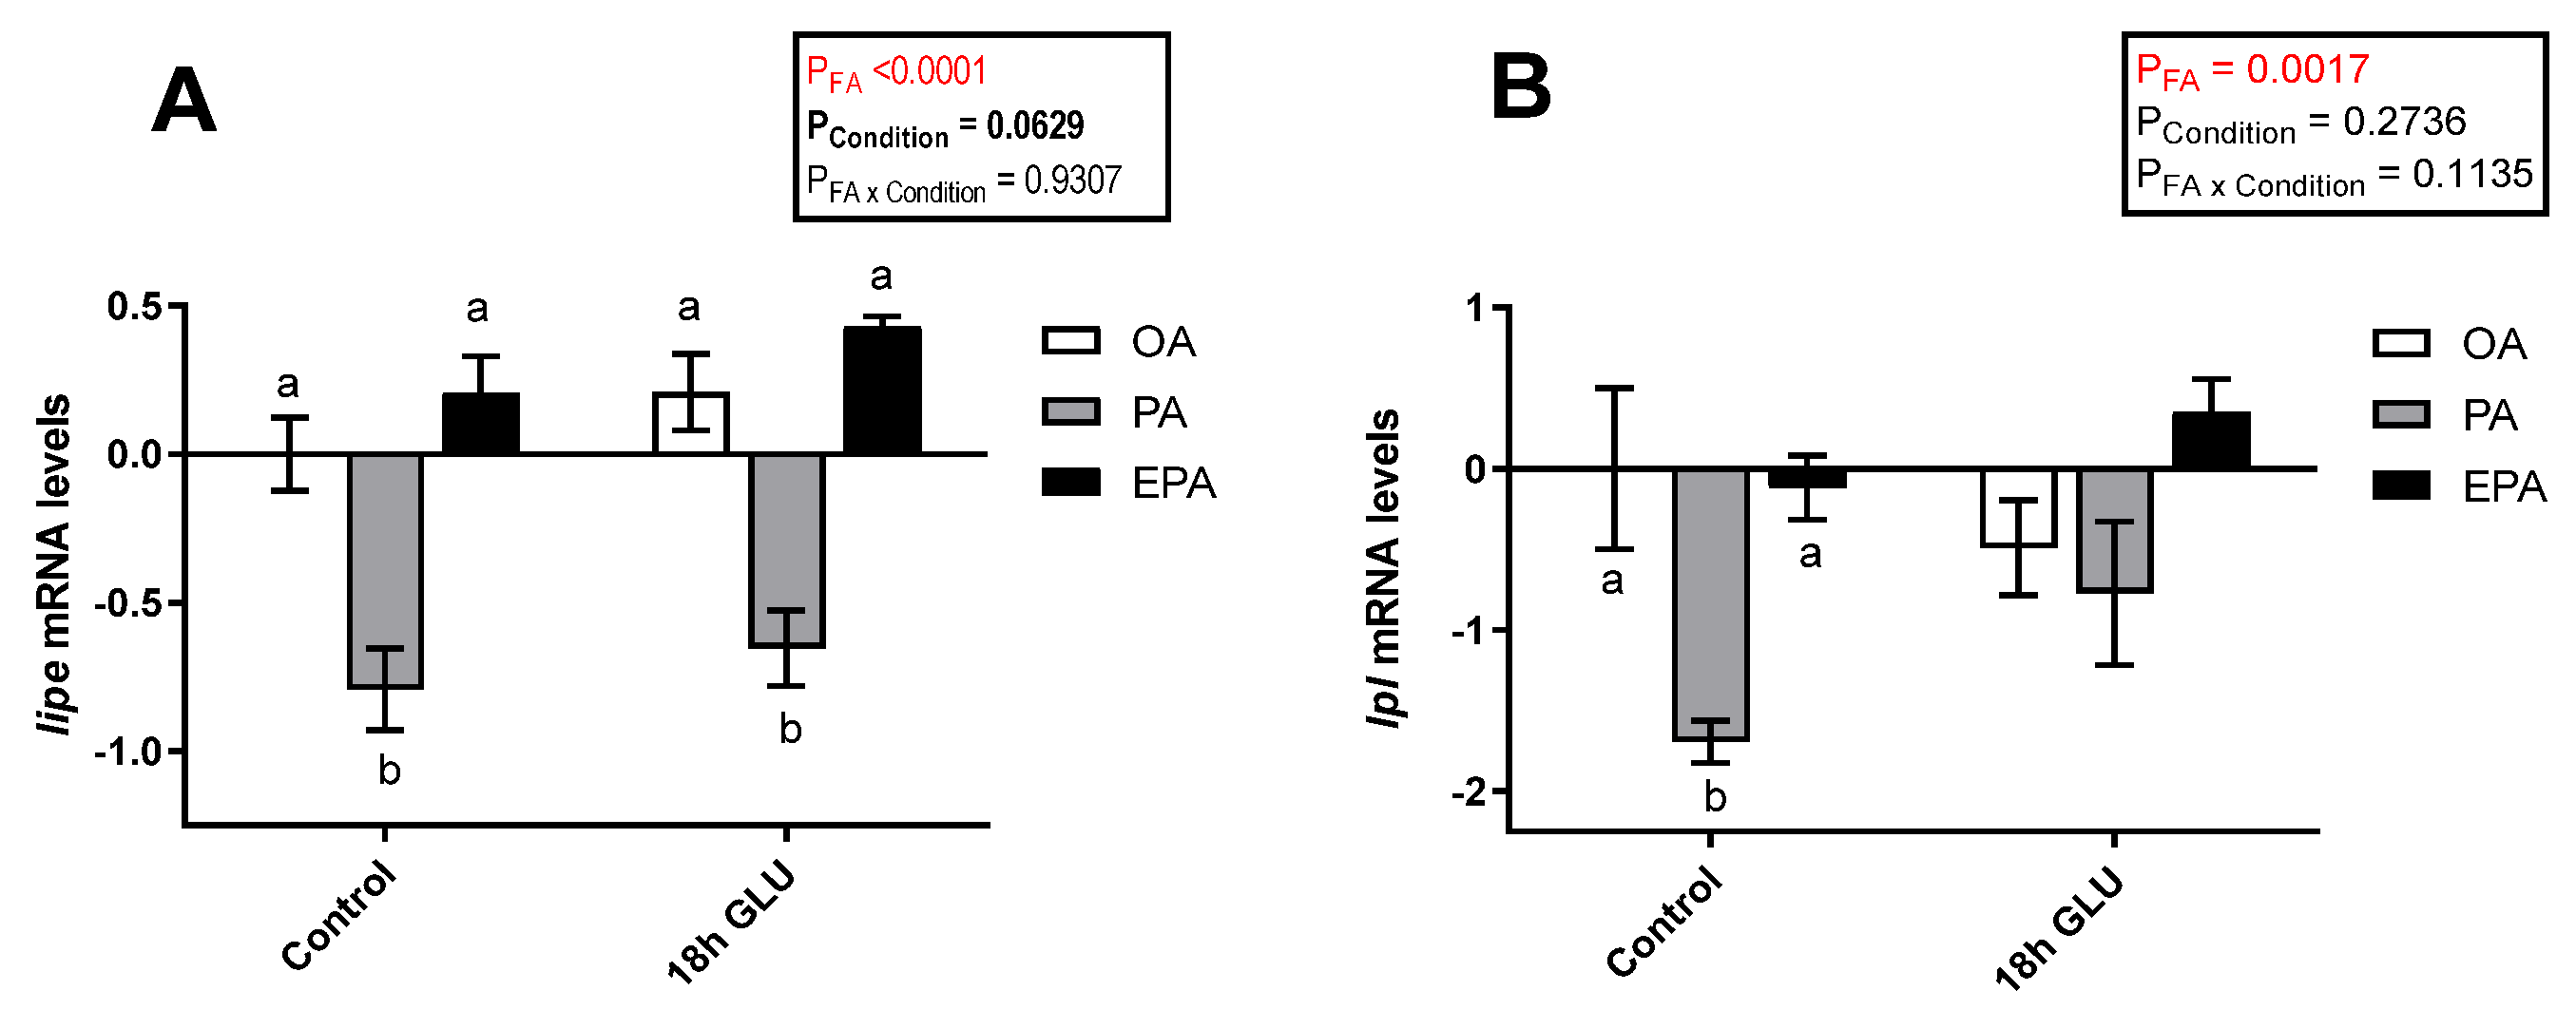
2.4.3. Lipolysis
2.4.4. Mitochondria
3. Discussion
3.1. Adipocyte Response to OA, PA, and EPA Supplementation during a Fed Status
3.2. Adipocyte Response to Mimicking a Fasting Condition: Lipid Mobilization
3.3. Leptin Regulation in Adipocytes Enriched with OA, PA, or EPA during a Fed and a Fasting Status
3.4. Mitochondrial Responses in Adipocytes Enriched with OA, PA, or EPA during a Fed and a Fasting Status
4. Materials and Methods
4.1. Isolation of Preadipocytes
4.2. Incubation of Adipocytes with Radiolabelled Palmitic Acid
4.3. Incubation of Adipocytes with Non-Radiolabelled Fatty Acids
4.4. Leptin, NEFA, and Glycerol Secretion Measurements
4.5. Lipid Extraction and Radiolabelled Lipid Class Analysis
4.6. Immunofluorescence Staining
4.7. RNA Extraction, cDNA Synthesis, and Quantitative Real-Time RT-PCR
4.8. Protein Measurements
4.9. Presentation of Data and Statistics
5. Conclusions
Author Contributions
Funding
Acknowledgments
Conflicts of Interest
Abbreviations
| OA | Oleic acid |
| PA | Palmitic acid |
| EPA | Eicosapentaenoic acid |
| FA | Fatty acids |
| FFA | Free fatty acids |
| TAG | Triglycerides |
| PL | Phospholipids |
| CE | Cholesteryl ester |
References
- Braun, K.; Oeckl, J.; Westermeier, J.; Li, Y.; Klingenspor, M. Non-adrenergic control of lipolysis and thermogenesis in adipose tissues. J. Exp. Biol. 2018, 221 (Suppl. 1), jeb165381. [Google Scholar] [CrossRef]
- Albalat, A.; Gutiérrez, J.; Navarro, I. Regulation of lipolysis in isolated adipocytes of rainbow trout (Oncorhynchus mykiss): The role of insulin and glucagon. Comp. Biochem. Physiol. Part A Mol. Integr. Physiol. 2005, 142, 347–354. [Google Scholar] [CrossRef] [PubMed]
- Albalat, A.; Sánchez-Gurmaches, J.; Gutiérrez, J.; Navarro, I. Regulation of lipoprotein lipase activity in rainbow trout (Oncorhynchus mykiss) tissues. Gen. Comp. Endocrinol. 2006, 146, 226–235. [Google Scholar] [CrossRef] [PubMed]
- Cruz-Garcia, L.; Saera-Vila, A.; Navarro, I.; Calduch-Giner, J.; Pérez-Sánchez, J. Targets for TNFα-induced lipolysis in gilthead sea bream (Sparus aurata L.) adipocytes isolated from lean and fat juvenile fish. J. Exp. Biol. 2009, 212, 2254–2260. [Google Scholar] [CrossRef]
- Todorčević, M.; Vegusdal, A.; Gjoen, T.; Sundvold, H.; Torstensen, B.E.; Kjaer, M.A.; Ruyter, B. Changes in fatty acids metabolism during differentiation of Atlantic salmon preadipocytes; effects of n-3 and n-9 fatty acids. Biochim. Biophys. ActaMol. Cell Biol. Lipids 2008, 1781, 326–335. [Google Scholar] [CrossRef] [PubMed]
- Todorčević, M.; Kjær, M.A.; Djaković, N.; Vegusdal, A.; Torstensen, B.E.; Ruyter, B. N-3 HUFAs affect fat deposition, susceptibility to oxidative stress, and apoptosis in Atlantic salmon visceral adipose tissue. Comp. Biochem. Physiol. Part B Biochem. Mol. Biol. 2009, 152, 135–143. [Google Scholar] [CrossRef]
- Albalat, A.; Gomez-Requeni, P.; Rojas, P.; Medale, F.; Kaushik, S.; Vianen, G.J.; Van den Thillart, G.; Gutierrez, J.; Perez-Sanchez, J.; Navarro, I. Nutritional and hormonal control of lipolysis in isolated gilthead seabream (Sparus aurata) adipocytes. Am. J. Physiol. Regul. Integr. Comp. Physiol. 2005, 289, R259–R265. [Google Scholar] [CrossRef] [PubMed]
- Cruz-Garcia, L.; Sanchez-Gurmaches, J.; Bouraoui, L.; Saera-Vila, A.; Perez-Sanchez, J.; Gutierrez, J.; Navarro, I. Changes in adipocyte cell size, gene expression of lipid metabolism markers, and lipolytic responses induced by dietary fish oil replacement in gilthead sea bream (Sparus aurata L.). Comp. Biochem. Physiol. Part A Mol. Integr. Physiol. 2011, 158, 391–399. [Google Scholar] [CrossRef]
- Blüher, M.; Mantzoros, C.S. From leptin to other adipokines in health and disease: Facts and expectations at the beginning of the 21st century. Metabolism 2015, 64, 131–145. [Google Scholar] [CrossRef]
- Schoettl, T.; Fischer, I.P.; Ussar, S. Heterogeneity of adipose tissue in development and metabolic function. J. Exp. Biol. 2018, 221 (Suppl. 1), jeb162958. [Google Scholar] [CrossRef]
- Deck, C.A.; Honeycutt, J.L.; Cheung, E.; Reynolds, H.M.; Borski, R.J. Assessing the functional role of leptin in energy homeostasis and the stress response in vertebrates. Front. Endocrinol. 2017, 8, 63. [Google Scholar] [CrossRef]
- Klein, S.; Coppack, S.W.; Mohamed-Ali, V.; Landt, M. Adipose tissue leptin production and plasma leptin kinetics in humans. Diabetes 1996, 45, 984–987. [Google Scholar] [CrossRef] [PubMed]
- Zhang, Y.; Proenca, R.; Maffei, M.; Barone, M.; Leopold, L.; Friedman, J.M. Positional cloning of the mouse obese gene and its human homologue. Nature 1994, 372, 425. [Google Scholar] [CrossRef] [PubMed]
- Maffei, M.; Halaas, J.; Ravussin, E.; Pratley, R.; Lee, G.; Zhang, Y.; Fei, H.; Kim, S.; Lallone, R.; Ranganathan, S. Leptin levels in human and rodent: Measurement of plasma leptin and ob RNA in obese and weight-reduced subjects. Nat. Med. 1995, 1, 1155. [Google Scholar] [CrossRef] [PubMed]
- Rønnestad, I.; Nilsen, T.O.; Murashita, K.; Angotzi, A.R.; Moen, A.-G.G.; Stefansson, S.O.; Kling, P.; Björnsson, B.T.; Kurokawa, T. Leptin and leptin receptor genes in Atlantic salmon: Cloning, phylogeny, tissue distribution and expression correlated to long-term feeding status. Gen. Comp. Endocrinol. 2010, 168, 55–70. [Google Scholar] [CrossRef] [PubMed]
- Kurokawa, T.; Uji, S.; Suzuki, T. Identification of cDNA coding for a homologue to mammalian leptin from pufferfish, Takifugu rubripes. Peptides 2005, 26, 745–750. [Google Scholar] [CrossRef]
- Murashita, K.; Uji, S.; Yamamoto, T.; Rønnestad, I.; Kurokawa, T. Production of recombinant leptin and its effects on food intake in rainbow trout (Oncorhynchus mykiss). Comp. Biochem. Physiol. Part B Biochem. Mol. Biol. 2008, 150, 377–384. [Google Scholar] [CrossRef]
- Johansson, M.; Morgenroth, D.; Einarsdottir, I.E.; Gong, N.; Björnsson, B.T. Energy stores, lipid mobilization and leptin endocrinology of rainbow trout. J. Comp. Physiol. B 2016, 186, 759–773. [Google Scholar] [CrossRef]
- Aas, T.S.; Ytrestøyl, T.; Åsgård, T. Utilization of feed resources in the production of Atlantic salmon (Salmo salar) in Norway: An update for 2016. Aquac. Rep. 2019, 15, 100216. [Google Scholar] [CrossRef]
- Colombo, S.M.; Foroutani, M.B.; Parrish, C.C. Fats and Oils in Aquafeed Formulations. In Bailey’s Industrial Oil and Fat Products; Shahidi, F., Ed.; Wiley Online Library: Hoboken, NJ, USA, 2020; pp. 1–28. [Google Scholar]
- Bou, M.; Berge, G.M.; Baeverfjord, G.; Sigholt, T.; Østbye, T.-K.; Romarheim, O.H.; Hatlen, B.; Leeuwis, R.; Venegas, C.; Ruyter, B. Requirements of n-3 very long-chain PUFA in Atlantic salmon (Salmo salar L.): Effects of different dietary levels of EPA and DHA on fish performance and tissue composition and integrity. Br. J. Nutr. 2017, 117, 30–47. [Google Scholar] [CrossRef]
- Fry, J.P.; Mailloux, N.A.; Love, D.C.; Milli, M.C.; Cao, L. Corrigendum: Feed conversion efficiency in aquaculture: Do we measure it correctly? (2018 Environ. Res. Lett. 13 024017). Environ. Res. Lett. 2018, 13, 079502. [Google Scholar] [CrossRef]
- Fry, J.P.; Mailloux, N.A.; Love, D.C.; Milli, M.C.; Cao, L. Feed conversion efficiency in aquaculture: Do we measure it correctly? Environ. Res. Lett. 2018, 13, 024017. [Google Scholar] [CrossRef]
- Todorcevic, M.; Skugor, S.; Krasnov, A.; Ruyter, B. Gene expression profiles in Atlantic salmon adipose-derived stromo-vascular fraction during differentiation into adipocytes. BMC Genom. 2010, 11, 39. [Google Scholar] [CrossRef] [PubMed]
- Berge, R.K.; Madsen, L.; Vaagenes, H.; Tronstad, K.J.; Gottlicher, M.; Rustan, A.C. In contrast with docosahexaenoic acid, eicosapentaenoic acid and hypolipidaemic derivatives decrease hepatic synthesis and secretion of triacylglycerol by decreased diacylglycerol acyltransferase activity and stimulation of fatty acid oxidation. Biochem. J. 1999, 343 Pt 1, 191–197. [Google Scholar] [CrossRef]
- Froyland, L.; Madsen, L.; Vaagenes, H.; Totland, G.K.; Auwerx, J.; Kryvi, H.; Staels, B.; Berge, R.K. Mitochondrion is the principal target for nutritional and pharmacological control of triglyceride metabolism. J. Lipid Res. 1997, 38, 1851–1858. [Google Scholar]
- Guo, W.; Xie, W.; Lei, T.; Hamilton, J.A. Eicosapentaenoic acid, but not oleic acid, stimulates β-oxidation in adipocytes. Lipids 2005, 40, 815–821. [Google Scholar] [CrossRef]
- Collins, J.M.; Neville, M.J.; Hoppa, M.B.; Frayn, K.N. De novo lipogenesis and stearoyl-CoA desaturase are coordinately regulated in the human adipocyte and protect against palmitate-induced cell injury. J. Biol. Chem. 2010, 285, 6044–6052. [Google Scholar] [CrossRef] [PubMed]
- Rustan, A.C.; Nossen, J.O.; Osmundsen, H.; Drevon, C.A. Eicosapentaenoic acid inhibits cholesterol esterification in cultured parenchymal cells and isolated microsomes from rat liver. J. Biol. Chem. 1988, 263, 8126–8132. [Google Scholar]
- Homma, Y. Comparison in inhibitory effects of lipolysis products on cholesterol esterification. Artery 1989, 16, 233–247. [Google Scholar]
- Rosqvist, F.; Bjermo, H.; Kullberg, J.; Johansson, L.; Michaëlsson, K.; Ahlström, H.; Lind, L.; Risérus, U. Fatty acid composition in serum cholesterol esters and phospholipids is linked to visceral and subcutaneous adipose tissue content in elderly individuals: A cross-sectional study. Lipids Health Dis. 2017, 16, 68. [Google Scholar] [CrossRef]
- Awad, A.B.; Chattopadhyay, J.P. Effect of dietary saturated fatty acids on hormone-sensitive lipolysis in rat adipocytes. J. Nutr. 1986, 116, 1088–1094. [Google Scholar] [CrossRef] [PubMed]
- Matsuo, T.; Sumida, H.; Suzuki, M. Beef tallow diet decreases beta-adrenergic receptor binding and lipolytic activities in different adipose tissues of rat. Metabolism 1995, 44, 1271–1277. [Google Scholar] [CrossRef]
- Fernandez-Quintela, A.; Churruca, I.; Portillo, M.P. The role of dietary fat in adipose tissue metabolism. Public Health Nutr. 2007, 10, 1126–1131. [Google Scholar] [CrossRef] [PubMed]
- Raclot, T.; Mioskowski, E.; Bach, A.C.; Groscolas, R. Selectivity of fatty acid mobilization: A general metabolic feature of adipose tissue. Am. J. Physiol. 1995, 269 Pt 2, R1060–R1067. [Google Scholar] [CrossRef]
- Fournier, N.; Sayet, G.; Vedie, B.; Nowak, M.; Allaoui, F.; Solgadi, A.; Caudron, E.; Chaminade, P.; Benoist, J.F.; Paul, J.L. Eicosapentaenoic acid membrane incorporation impairs cholesterol efflux from cholesterol-loaded human macrophages by reducing the cholesteryl ester mobilization from lipid droplets. Biochim Biophys Acta Mol Cell Biol Lipids 2017, 1862 Pt A, 1079–1091. [Google Scholar] [CrossRef]
- Li, Y.-h.; Liu, L. Apolipoprotein E synthesized by adipocyte and apolipoprotein E carried on lipoproteins modulate adipocyte triglyceride content. Lipids Health Dis. 2014, 13, 136. [Google Scholar] [CrossRef] [PubMed]
- Kypreos, K.E.; Zannis, V.I. Pathway of biogenesis of apolipoprotein E-containing HDL in vivo with the participation of ABCA1 and LCAT. Biochem. J. 2007, 403, 359–367. [Google Scholar] [CrossRef]
- Semenkovich, C.F.; Wims, M.; Noe, L.; Etienne, J.; Chan, L. Insulin regulation of lipoprotein lipase activity in 3T3-L1 adipocytes is mediated at posttranscriptional and posttranslational levels. J. Biol. Chem. 1989, 264, 9030–9038. [Google Scholar]
- Zechner, R.; Zimmermann, R.; Eichmann, T.O.; Kohlwein, S.D.; Haemmerle, G.; Lass, A.; Madeo, F. FAT SIGNALS--lipases and lipolysis in lipid metabolism and signaling. Cell Metab. 2012, 15, 279–291. [Google Scholar] [CrossRef]
- Frederich, R.C.; Hamann, A.; Anderson, S.; Lollmann, B.; Lowell, B.B.; Flier, J.S. Leptin levels reflect body lipid content in mice: Evidence for diet-induced resistance to leptin action. Nat. Med. 1995, 1, 1311–1314. [Google Scholar] [CrossRef]
- Ahima, R.S.; Prabakaran, D.; Mantzoros, C.; Qu, D.; Lowell, B.; Maratos-Flier, E.; Flier, J.S. Role of leptin in the neuroendocrine response to fasting. Nature 1996, 382, 250–252. [Google Scholar] [CrossRef] [PubMed]
- Salmeron, C.; Johansson, M.; Angotzi, A.R.; Ronnestad, I.; Jonsson, E.; Bjornsson, B.T.; Gutierrez, J.; Navarro, I.; Capilla, E. Effects of nutritional status on plasma leptin levels and in vitro regulation of adipocyte leptin expression and secretion in rainbow trout. Gen. Comp. Endocrinol 2015, 210, 114–123. [Google Scholar] [CrossRef] [PubMed]
- Rojo-Martinez, G.; Soriguer, F.; Gonzalez-Romero, S.; Tinahones, F.; Moreno, F.; de Adana, S.R.; Garriga, M.; Esteva, I.; Garcia-Arnes, J.; Gomez-Zumaquero, J. Serum leptin and habitual fatty acid dietary intake in patients with type 1 diabetes mellitus. Eur. J. Endocrinol. 2000, 142, 263–268. [Google Scholar] [CrossRef] [PubMed]
- Reseland, J.E.; Haugen, F.; Hollung, K.; Solvoll, K.; Halvorsen, B.; Brude, I.R.; Nenseter, M.S.; Christiansen, E.N.; Drevon, C.A. Reduction of leptin gene expression by dietary polyunsaturated fatty acids. J. Lipid Res. 2001, 42, 743–750. [Google Scholar] [PubMed]
- Kolaczynski, J.W.; Considine, R.V.; Ohannesian, J.; Marco, C.; Opentanova, I.; Nyce, M.R.; Myint, M.; Caro, J.F. Responses of leptin to short-term fasting and refeeding in humans: A link with ketogenesis but not ketones themselves. Diabetes 1996, 45, 1511–1515. [Google Scholar] [CrossRef] [PubMed]
- Saladin, R.; De Vos, P.; Guerre-Millot, M.; Leturque, A.; Girard, J.; Staels, B.; Auwerx, J. Transient increase in obese gene expression after food intake or insulin administration. Nature 1995, 377, 527–528. [Google Scholar] [CrossRef]
- Lee, M.J.; Yang, R.Z.; Gong, D.W.; Fried, S.K. Feeding and insulin increase leptin translation. Importance of the leptin mRNA untranslated regions. J. Biol. Chem. 2007, 282, 72–80. [Google Scholar] [CrossRef]
- Kling, P.; Ronnestad, I.; Stefansson, S.O.; Murashita, K.; Kurokawa, T.; Bjornsson, B.T. A homologous salmonid leptin radioimmunoassay indicates elevated plasma leptin levels during fasting of rainbow trout. Gen. Comp. Endocrinol. 2009, 162, 307–312. [Google Scholar] [CrossRef]
- Trombley, S.; Maugars, G.; Kling, P.; Bjornsson, B.T.; Schmitz, M. Effects of long-term restricted feeding on plasma leptin, hepatic leptin expression and leptin receptor expression in juvenile Atlantic salmon (Salmo salar L.). Gen. Comp. Endocrinol. 2012, 175, 92–99. [Google Scholar] [CrossRef]
- Angotzi, A.R.; Stefansson, S.O.; Nilsen, T.O.; Rathore, R.M.; Ronnestad, I. Molecular cloning and genomic characterization of novel leptin-like genes in salmonids provide new insight into the evolution of the Leptin gene family. Gen. Comp. Endocrinol. 2013, 187, 48–59. [Google Scholar] [CrossRef]
- Angotzi, A.R.; Stefansson, S.O.; Nilsen, T.O.; Ovrebo, J.I.; Andersson, E.; Taranger, G.L.; Ronnestad, I. Identification of a novel leptin receptor duplicate in Atlantic salmon: Expression analyses in different life stages and in response to feeding status. Gen. Comp. Endocrinol. 2016, 235, 108–119. [Google Scholar] [CrossRef] [PubMed]
- Bereiter-Hahn, J. Behavior of mitochondria in the living cell. Int. Rev. Cytol. 1990, 122, 1–63. [Google Scholar] [PubMed]
- Bereiter-Hahn, J.; Voth, M. Dynamics of mitochondria in living cells: Shape changes, dislocations, fusion, and fission of mitochondria. Microsc. Res. Tech. 1994, 27, 198–219. [Google Scholar] [CrossRef]
- Van der Bliek, A.M.; Shen, Q.; Kawajiri, S. Mechanisms of mitochondrial fission and fusion. Cold Spring Harb. Perspect. Biol. 2013, 5, a011072. [Google Scholar] [CrossRef] [PubMed]
- Liesa, M.; Shirihai, O.S. Mitochondrial Dynamics in the Regulation of Nutrient Utilization and Energy Expenditure. Cell Metab. 2013, 17, 491–506. [Google Scholar] [CrossRef]
- Lee, J.-Y.; Kapur, M.; Li, M.; Choi, M.-C.; Choi, S.; Kim, H.-J.; Kim, I.; Lee, E.; Taylor, J.P.; Yao, T.-P. MFN1 deacetylation activates adaptive mitochondrial fusion and protects metabolically challenged mitochondria. J. Cell Sci. 2014, 127, 4954–4963. [Google Scholar] [CrossRef]
- Rambold, A.S.; Kostelecky, B.; Elia, N.; Lippincott-Schwartz, J. Tubular network formation protects mitochondria from autophagosomal degradation during nutrient starvation. Proc. Natl. Acad. Sci. USA 2011, 108, 10190–10195. [Google Scholar] [CrossRef]
- Gomes, L.C.; Di Benedetto, G.; Scorrano, L. During autophagy mitochondria elongate, are spared from degradation and sustain cell viability. Nat. Cell Biol. 2011, 13, 589–598. [Google Scholar] [CrossRef]
- Molina, A.J.; Wikstrom, J.D.; Stiles, L.; Las, G.; Mohamed, H.; Elorza, A.; Walzer, G.; Twig, G.; Katz, S.; Corkey, B.E. Mitochondrial networking protects β-cells from nutrient-induced apoptosis. Diabetes 2009, 58, 2303–2315. [Google Scholar] [CrossRef]
- Senyilmaz-Tiebe, D.; Pfaff, D.H.; Virtue, S.; Schwarz, K.V.; Fleming, T.; Altamura, S.; Muckenthaler, M.U.; Okun, J.G.; Vidal-Puig, A.; Nawroth, P.; et al. Dietary stearic acid regulates mitochondria in vivo in humans. Nat. Commun. 2018, 9, 3129. [Google Scholar] [CrossRef]
- Kjaer, M.; Vegusdal, A.; Gjøen, T.; Rustan, A.; Todorčević, M.; Ruyter, B. Effect of rapeseed oil and dietary n-3 fatty acids on triacylglycerol synthesis and secretion in Atlantic salmon hepatocytes. Biochim. Biophys. Acta 2008, 1781, 112–122. [Google Scholar] [CrossRef] [PubMed]
- Vegusdal, A.; Gjoen, T.; Berge, R.K.; Thomassen, M.S.; Ruyter, B. Effect of 18:1n-9, 20:5n-3, and 22:6n-3 on lipid accumulation and secretion by Atlantic salmon hepatocytes. Lipids 2005, 40, 477–486. [Google Scholar] [CrossRef] [PubMed]
- Todorčević, M.; Hodson, L. The Effect of Marine Derived n-3 Fatty Acids on Adipose Tissue Metabolism and Function. J. Clin. Med. 2015, 5, 3. [Google Scholar] [CrossRef] [PubMed]
- Riera-Heredia, N.; Lutfi, E.; Sanchez-Moya, A.; Gutierrez, J.; Capilla, E.; Navarro, I. Short-Term Responses to Fatty Acids on Lipid Metabolism and Adipogenesis in Rainbow Trout (Oncorhynchus mykiss). Int. J. Mol. Sci. 2020, 21, 1623. [Google Scholar] [CrossRef] [PubMed]
- Folch, J.; Lees, M.; Sloane Stanley, G.H. A simple method for the isolation and purification of total lipides from animal tissues. J. Biol. Chem. 1957, 226, 497–509. [Google Scholar] [PubMed]
- Nikolova-Damyanova, B. Silver ion chromatography and lipids. In Adv. Lipid Methodol. One; Chrostie, W.W., Ed.; The Oily Press: Ayr, Scotland, 1992; pp. 181–237. [Google Scholar]
- Livak, K.J.; Schmittgen, T.D. Analysis of relative gene expression data using real-time quantitative PCR and the 2(-Delta Delta C(T)) Method. Methods (San DiegoCalif.) 2001, 25, 402–408. [Google Scholar] [CrossRef]
- Lowry, O.H.; Rosebrough, N.J.; Farr, A.L.; Randall, R.J. Protein measurement with the Folin phenol reagent. J. Biol. Chem. 1951, 193, 265–275. [Google Scholar]
- Peterson, G.L. A simplification of the protein assay method of Lowry et al. which is more generally applicable. Anal. Biochem. 1977, 83, 346–356. [Google Scholar] [CrossRef]


| Fatty Acid | OA | PA | EPA | p |
|---|---|---|---|---|
| 16:0 | 10.0 ± 4.5b | 36.4 ± 4.3a | 19.0 ± 0.8b | 0.0058 |
| Other SFA§ | 15.5 ± 0.7 | 17.5 ± 1.8 | 16.3 ± 3.1 | 0.8031 |
| 16:1 n−7 | nd | 3.8 ± 3.8 | 1.0 ± 0.4 | 0.4910 |
| 18:1 n−7 | 1.9 ± 0.3 | 5.0 ± 2.6 | 2.0 ± 0.1 | 0.3218 |
| 18:1 n−9 | 47.4 ± 6.7a | 15.8 ± 1.0b | 17.5 ± 0.2b | 0.0020 |
| Other MUFA† | 8.5 ± 3.4 | 9.9 ± 5.9 | 8.4 ± 1.2 | 0.9593 |
| 18:2 n−6 | 3.7 ± 1.0 | 2.2 ± 0.6 | 3.8 ± 0.1 | 0.2617 |
| 20:4 n−6 | 4.6 ± 0.6 | 4.0 ± 0.9 | 3.3 ± 0.5 | 0.4239 |
| 20:5 n−3 | ND | 2.9 ± 1.3b | 18.6 ± 3.1a | 0.0010 |
| 22:5 n−3 | 2.1 ± 0.3 | 4.3 ± 2.7 | 3.5 ± 0.4 | 0.6279 |
| 22:6 n-−3 | 4.0 ± 0.4 | 2.6 ± 0.7 | 3.3 ± 0.4 | 0.2751 |
| Other FA‡ | 5.1 ± 0.0 | 0.7 ± 0.0 | 3.2 ± 0.7 | 0.2252 |
| Sum identified | 97.5 ± 0.8 | 96.0 ± 1.9 | 96.8 ± 0.6 | 0.6994 |
| Sum EPA/DHA | 4.0 ± 0.4b | 5.6 ± 0.6b | 21.9 ± 3.3a | 0.0011 |
| Sum N−3 | 7.8 ± 1.2b | 10.1 ± 2.2b | 26.4 ± 3.9a | 0.0053 |
| Sum N−6 | 8.2 ± 1.6 | 6.2 ± 1.2 | 9.1 ± 0.6 | 0.2900 |
| Sum N−0 | 25.5 ± 4.8b | 53.9 ± 5.9a | 35.3 ± 3.9ab | 0.0172 |
| (%) | OA | PA | EPA | p |
|---|---|---|---|---|
| PL | 46.17 ± 3.37 b | 47.26 ± 7.02 b | 82.33 ± 2.71 a | 0.0026 |
| FFA | 2.63 ± 0.25 b | 12.00 ± 2.28 a | 3.35 ± 0.97 b | 0.0064 |
| TAG | 5.84 ± 1.10 b | 11.28 ± 1.32 ab | 11.93 ± 1.55 a | 0.0338 |
| DAG | 2.08 ± 0.43 | 1.9 ± 0.72 | 2.39 ± 0.67 | 0.8583 |
| CE | 43.29 ± 4.67 a | 27.56 ± 4.56 b | ND | 0.0367 |
| Total nmol 1 | 5.8 ± 0.35 a | 1.8 ± 0.07 b | 6.7 ± 0.46 a | 0.0001 |
| Gene | Accession No. | Direction | Primer Sequence 5′→ 3′ |
|---|---|---|---|
| ef1α | AF321836 | Forward | CACCACCGGCCATCTGATCTACAA |
| Reverse | TCAGCAGCCTCCTTCTGAACTTC | ||
| etif3 | DW542195 | Forward | CAGGATGTTGTTGCTGGATGGG |
| Reverse | ACCCAACTGGGCAGGTCAAGA | ||
| β-actin | AF012125 | Forward | ACATCAAGGAGAAGCTGTGC |
| Reverse | GACAACGGAACCTCTCGTTA | ||
| scd | BT044999 | Forward | TGAAATAGTGCTGTCCCGGGCTC |
| Reverse | TGGGGAAACCTCTTAGCCACTCCG | ||
| leptin | FJ830677 | Forward | CCAGGCCGCCAGCAGAAACA |
| Reverse | GCGCCACTGGACCCACACTC | ||
| lipe | XM_014201599 | Forward | TCCCCAGACGTTTGTGTCAGATGC |
| Reverse | GCTTTGGATCCCCCATTAGTTCCTG | ||
| lpl | BI468076 | Forward | TGCTGGTAGCGGAGAAAGACAT |
| Reverse | CTGACCACCAGGAAGACACCAT | ||
| mfn1 | BT072406 | Forward | AGTGTGTCCAGTCTTCCGCACA |
| Reverse | ACAGGCTACAGCACCCAACCTT | ||
| fis1 | BT072691 | Forward | CCCCAGGGGGCATCCTGTCTTA |
| Reverse | TTGCAGCTGGCCGATCTAGCG |
© 2020 by the authors. Licensee MDPI, Basel, Switzerland. This article is an open access article distributed under the terms and conditions of the Creative Commons Attribution (CC BY) license (http://creativecommons.org/licenses/by/4.0/).
Share and Cite
Bou, M.; Wang, X.; Todorčević, M.; Østbye, T.-K.K.; Torgersen, J.; Ruyter, B. Lipid Deposition and Mobilisation in Atlantic Salmon Adipocytes. Int. J. Mol. Sci. 2020, 21, 2332. https://doi.org/10.3390/ijms21072332
Bou M, Wang X, Todorčević M, Østbye T-KK, Torgersen J, Ruyter B. Lipid Deposition and Mobilisation in Atlantic Salmon Adipocytes. International Journal of Molecular Sciences. 2020; 21(7):2332. https://doi.org/10.3390/ijms21072332
Chicago/Turabian StyleBou, Marta, Xinxia Wang, Marijana Todorčević, Tone-Kari Knutsdatter Østbye, Jacob Torgersen, and Bente Ruyter. 2020. "Lipid Deposition and Mobilisation in Atlantic Salmon Adipocytes" International Journal of Molecular Sciences 21, no. 7: 2332. https://doi.org/10.3390/ijms21072332
APA StyleBou, M., Wang, X., Todorčević, M., Østbye, T.-K. K., Torgersen, J., & Ruyter, B. (2020). Lipid Deposition and Mobilisation in Atlantic Salmon Adipocytes. International Journal of Molecular Sciences, 21(7), 2332. https://doi.org/10.3390/ijms21072332